Market prefers safe-haven instruments at the start of the year

The market started the year 2023 in a safety mode, creating demand for US Dollars and Gold as safe-haven instruments while waiting for this week’s US key economic data and events.

The dollar advances, the yen stabilizes and the oil price drops sharply. US shares market falls lead to Asia stocks facing muted opening. The yield on 10-Year Treasuries falls by most in more than a month. \

US’s four most representative benchmark indexes DJIA, S&P500, NASDAQ and SOX were all close lower. Shares in Asia faced a muted opening Wednesday after a decline in US stocks and the price of oil signalled unease about the dimming outlook for the global economy. Treasuries and the dollar rallied, and the yen stabilized after a Tuesday jump. Equity futures for Japan, Australia, and Hong Kong each rose less than 1%. The 10-year Treasury yield fell 14 basis points to 3.74%, the biggest decline in more than a month. An index of the dollar rallied by the most in two weeks.

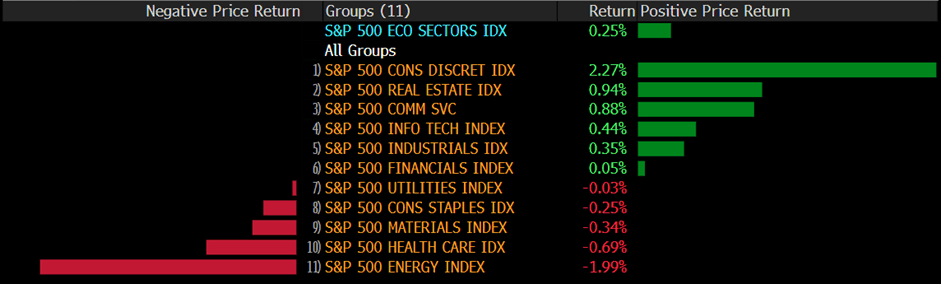
The S&P 500 ended Tuesday 0.4% lower, weighed down by energy and tech stocks. Among all eleven sectors in S&P500, Comm SVC, Financials Index, Real Estate Index, Industrials Index, and Utilities Indes gain positive price returns.  As for the Energy Index field, dropped by 3.62% on a daily loss.

Main Pairs Movement

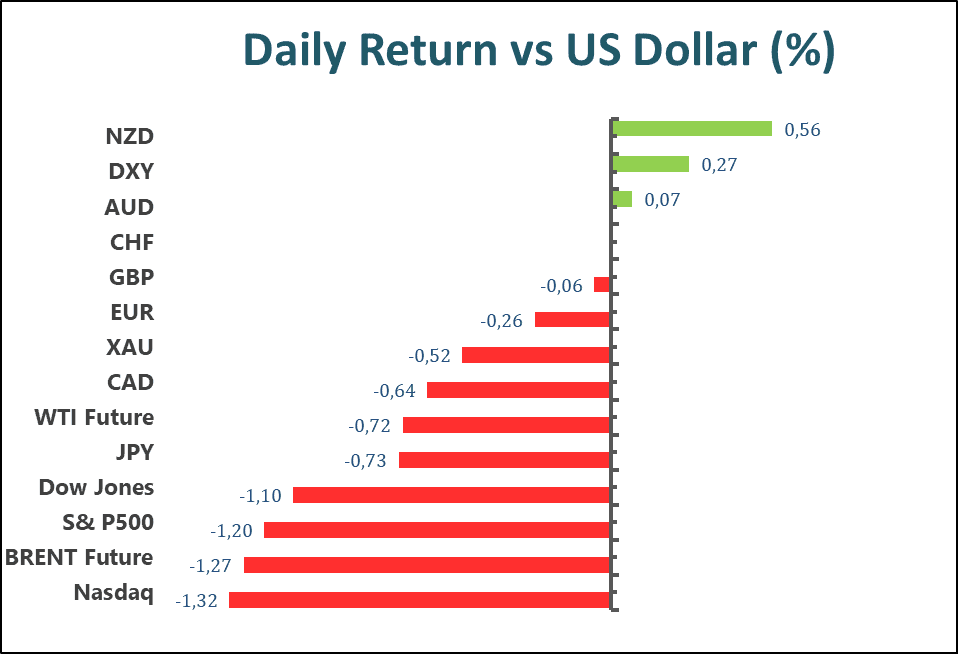
The Dollar index, which tracks the U.S. Greenback against a basket of other major foreign currencies, surged more than 1% throughout Tuesday’s trading. The first official U.S. trading day witnessed a broad-based sell-off in the equities market, while market participants bid up the U.S. currency. Despite the surge in Dollar value, the U.S. 10-year treasury yield remained subdued over yesterday’s trading. The benchmark yield currently sits at 3.759% and the U.S. 2-year treasury yield sits at 4.382%.

EURUSD traded 1.11% lower throughout Tuesday’s trading. Risk-averse sentiment across markets helped buoy the Dollar against the Euro.

Cable lost 0.64% throughout Tuesday’s trading. The British Pound fared worse against the Dollar as market participants flighted to safety.

The Dollar denominated Gold rose 0.87% throughout Tuesday’s trading. The precious metal gained ground as market participants started the new year with caution in mind.

Technical Analysis

EURUSD (4-Hour Chart)

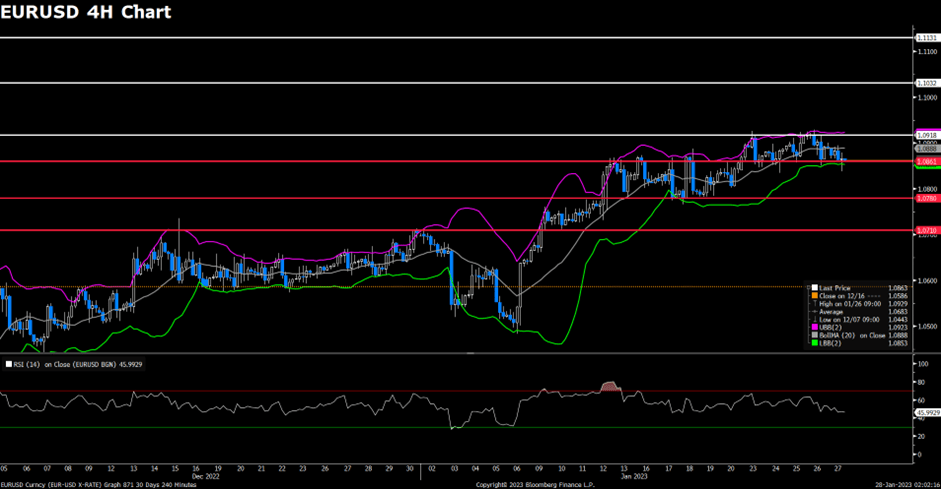
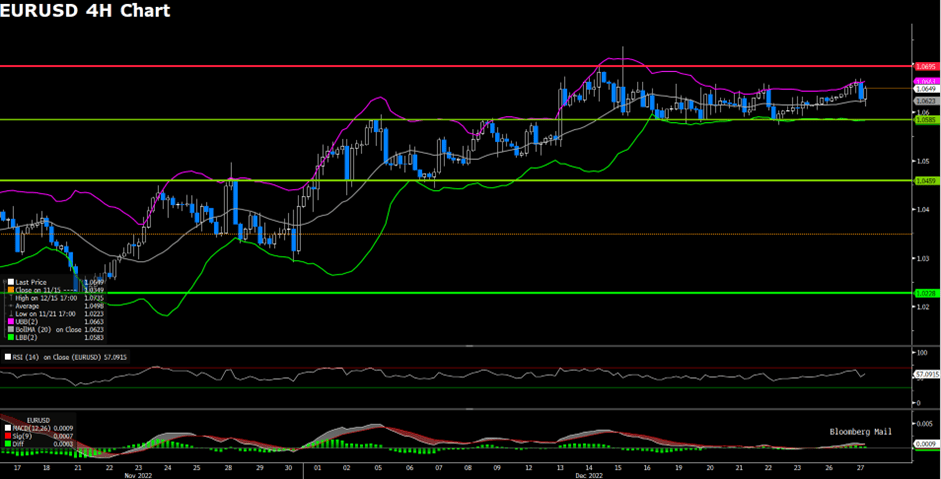
The EUR/USD pair declined sharply on Tuesday, witnessing heavy bearish pressure and has managed to erase a small portion of its daily losses near the 1.0560 mark amid the resurgent US Dollar demand. The pair is now trading at 1.0543, posting a 1.14% loss daily. EUR/USD stays in the negative territory amid a stronger US Dollar across the board, as the greenback started the day on a firm footing and advanced above 140.70 with investors returning from the New Year holiday. On the economic data front, the S&P Global Manufacturing Index from the US came at 46.2 in December, which is unchanged from the flash reading. Meanwhile, the Federal Reserve will publish the minutes of the latest FOMC meeting on Wednesday, which will be crucial for the EUR/USD traders to watch. In the Eurozone, the Consumer Price Index (CPI) from Germany revealed that inflation declined to 8.6% every year in December and came in below the market expectation of 9%. The reading made it difficult for the Euro to gather recovery momentum today.

For the technical aspect, RSI indicator 28 figures as of writing, suggesting that the pair could experience a directional change in the near term as the RSI is in an oversold zone. As for the Bollinger Bands, the price witnessed heavy selling and dropped out of the lower band, therefore the downside traction should persist. In conclusion, we think the market will be bearish as long as the 1.0583 resistance line holds. On the downside, a break below the 1.0512 support could favour the bears.

Resistance:  1.0583, 1.0710

Support: 1.0512, 1.0467, 1.0315

GBPUSD (4-Hour Chart)

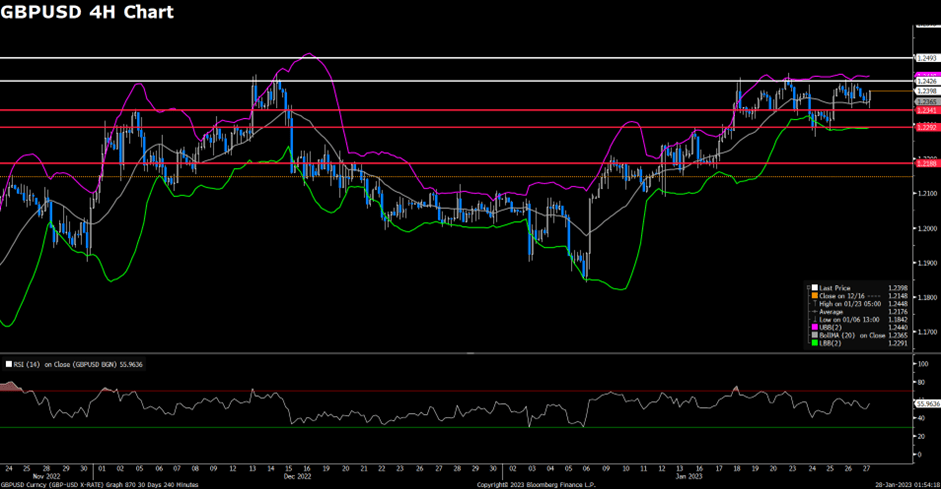
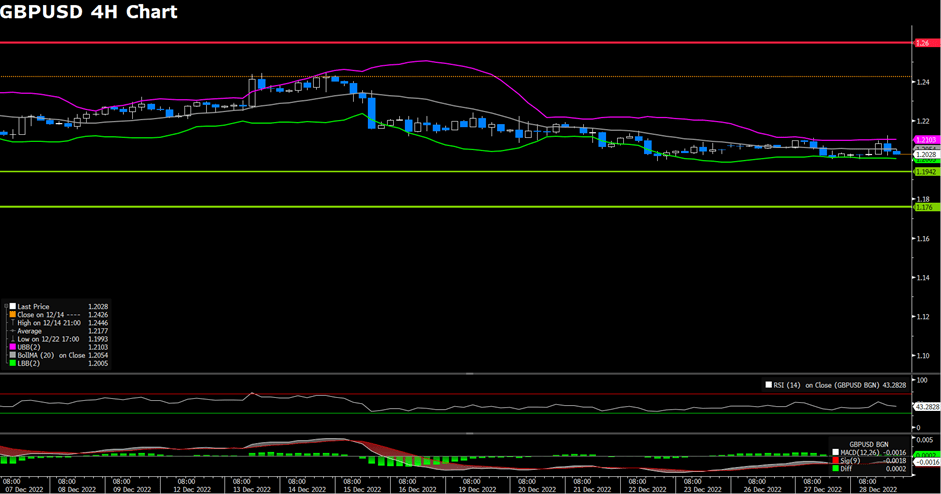
GBP/USD dropped to fresh multi-week lows near 1.1900 on Tuesday. Despite the absence of a fundamental factor, the US dollar outperforms other pairs as investors return from the new year holiday. GBP/USD, therefore, came under heavy bearish pressure. In the Meanwhile, political jitters in the UK seem to weigh on the Pound. The Telegraph reported over the weekend that British Prime Minister Rishi Sunak had shelved the childcare reform that was designed to help parents save money and get back to work. In addition, the first of five consecutive days of national rail strikes have begun on Tuesday.

For the technical aspect, the RSI indicator is 40 figures as of writing, suggesting the bearish traction will remain in the near-term technical outlook as the RSI stays below the mid-line. As for the Bollinger Bands, the price dropped below the average and now hovering around the lower bound, signalling some downside momentum. In conclusion, we think the market is still in bearish mode. If the price close negative below the current support at 1.1942 on the 4H chart. It may head to test the next support at 1.1765. For more price action, eye on tier 1 economic figures. In the US, the economic calendar remains busy with the release of the FOMC Meeting Minutes, as well as the ISM Manufacturing PMI Index for December. In the UK, Mortgage Approvals and Lending would be revealed.

Resistance: 1.2095, 1.2212, 1.2334

Support: 1.1942, 1.1765

XAUUSD (4-Hour Chart)

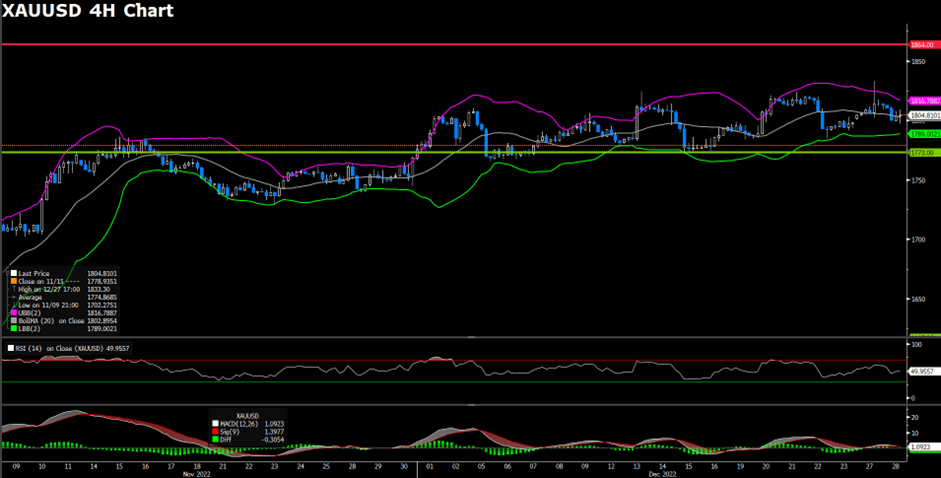
Gold prices were volatile on Tuesday after returning to normal trading activity. Earlier XAU/USD soared to $1,849.96, a multi-month high, and then started to decline as the dollar regather its strength in the mid-European trading session. At the time of writing, the gold price held around $1,830. That said, the pullback in gold price seems limited, as the US treasury yields fall modestly, which favours non-yielding gold. Gold traders now await the release of the FOMC Meeting Minutes, as well as the ISM Manufacturing PMI Index for December, which may provide cues for future monetary policy.

For the technical aspect, RSI indicator 71 figures as of writing, suggesting strong momentum in the near term. On the other hand, the pair could stage some downside correction as the RSI is in the overbought zone. For the Bollinger Bands, the price slightly pulls back after touching the upper bound signalling the lack of further momentum. In conclusion, we think the market is still in bullish mode as long as the price keeps rallying above the upward trend line. However, the gold price can stage correction as technical analysis shows price pressure. On the downside, if a price drops below the trend line, it may change its current uptrend and head to test the next support at $1,775.

Resistance: 1842, 1857

Support: 1775, 1735

Economic Data

CurrencyDataTime (GMT + 8)Forecast
USDISM Manufacturing PMI (Dec)23:0048.5
USDJOLTs Job Openings (Nov)23:0010M

Download MT4 For PC

Forex is a popular form of trading for users worldwide, providing diverse markets to speculate in. But to open positions and make trades in a way that suits your strategy and aims, you need the right platform.

Here at VT Markets, we work to ensure that our users have all the tools and platforms they need to develop their trading strategy and grow their experience in the market. This includes offering MetaTrader 4 for PC. Also known as MT4, this trading platform is available on PC and mobile. It is designed to provide a positive learning curve and a powerful selection of features for users of all experience levels and trading backgrounds. Whether you are learning to trade on the forex market or have been trading for several years, you’ll find that MT4 supports your needs.

Read on to learn more about how to download MT4 for PC and start utilising its tools and features today.

Download MT4 for PC in four simple steps

To begin with, you’ll need to get set up with a VT Markets account. We provide easy MT4 downloads onto your PC device. If you’ve already got a VT Markets account, log in and head down to step 2.

Step 1: Create your VT Markets account
  • Head to the top of the page or the VT Markets homepage. Select the Open a Live Account option.
  • Enter your nationality, first name and surname, telephone number, and email address in the form on the right-hand side of the page.
  • On the next page, complete your personal details and submit your identification information.
  • Head to the next form and add more information where required.
  • On the next screen, complete your account configuration.
  • Confirm your ID on the next page.
  • On the final screen of the setup, add funding to your account so that you can begin trading.
Step 2: Log in to your VT Markets account and find MT4

After you have created your VT Markets account, the next step is to log in. You can do this using the button in the header menu, just to the right of the Create a Live Account button.

Next, return to the header menu and hover over the Trading option. This will bring up a menu with the tools and platforms we offer. Under the Platforms section, select MetaTrader 4 at the top of this list.

Select Start Trading Now and then download MetaTrader 4 for PC.

Step 3: Complete your download

Start by downloading the VT Markets MetaTrader 4 software. This will be saved to your PC as a .exe file. When prompted by a dialogue box, choose the Run option and the Yes option to run the .exe file.

When downloading MetaTrader 4 for PC, you will need to allow the program to make changes on the device. You’ll see a prompt asking you to grant this permission — confirm this to continue.

You’ll also need to read through the licence agreement. After you’ve checked this document, select I Agree to continue. You can save the platform to a custom install folder via the Settings button on the next window, or you can download the program to your default folder. 

Continue through the wizard until you hit the Finish button. Select this option to complete the download.

Step 4: Ensure you’re working with the latest version of MT4

If you’ve just downloaded MT4 for your PC, you will work with the latest version. If you downloaded the platform sometime earlier, you will need to check that you are working with the latest version.

This is because VT Markets has added many new features to the MetaTrader 4 platform in recent releases. This includes a Trading Central Tools package designed to help you get more from the platform and an economic calendar and Forex New Terminal to ensure traders remain updated and in tune with market developments. There are also account management facilities on the newest versions of MT4 that were not provided in earlier iterations.

Set your PC to automatically update and upgrade applications to avoid missing out on the latest features and functions provided by the VT Markets team. Reach out to the team to find out more about the latest releases and features or with any questions about the platform. We also provide useful resources to support you as you learn how to use MT4.

Trade with MetaTrader 4 at VT Markets

Give MetaTrader 4 a try today — download the platform from VT Markets and explore its tools and features. You can set up a demo account at first and then start trading for real with a live trading account. Want to learn more about the MT4 platform? Reach out to our team today.

FAQs

Can you use MetaTrader 4 on a PC?

Yes, you can download MetaTrader 4 on your PC. The MT4 platform was designed for PC devices and is not supported by the iOS operating system found on Macs and Apple products.

It is also possible to download MT4 on mobile devices that use the Android operating system.

Can I still download MetaTrader 4?

Yes, you can still download MetaTrader 4. Head to the MT4 page on the VT Markets website and download the platform like any other software. 

There has been some confusion among traders simply because of MetaTrader 5 — the update and successor to MT4. However, many traders find that they prefer the older version of the platform and have stuck with this. In 2022, traders can download and use both platforms on their PC. 

How do I log into MetaTrader 4 on PC?

To log into MetaTrader 4 for PC, you’ll first need to download it. You can do this right here on the VT Markets page after you have set up and logged into your account. Once the MetaTrader 4 platform is up and running, you can select the File menu option and log into your account from here.

Remember to keep your login credentials safe, and don’t copy or reuse the username and password you use with other applications. If you feel your account information has been compromised, change this information within the MetaTrader 4 platform without delay.

Can you trade forex on PC?

Yes, you’ll need a forex trading account and a platform like MetaTrader 4. This will give you access to the market, enabling you to assess the latest movements and make trades. It is highly recommended that you practise trading on an MT4 demo account before you begin trading for real. 

Please be aware that there is always a risk involved when you trade. Even more experienced and expert traders can lose money if the market does not move as expected.

What are MT4 indicators?

Indicators are important features on the MT4 platform, and you can use them as you try to predict future movements in the market. These MT4 indicators may be divided into common types, such as trend indicators, momentum indicators, volatility indicators and volume indicators. While indicators are slightly more advanced trading features, the learning curve of the MT4 platform is designed to help you grow your experience as you utilise these elements.

Remember that indicators do not provide guarantees. The market can still move in the other direction, even if an indicator has suggested otherwise. There is no way to eliminate risk, so always trade carefully and conservatively.

Can you trade on the margin in MT4?

It is possible to trade on the margin with MetaTrader 4. A forex margin refers to the amount of money you will need to put forward from your own capital reserves to open and control a trading position. The broker will put forward the remainder of the money, which makes the trading strategy similar to using leverage. Both tactics involve controlling a position worth more than you would otherwise have been able to afford.

While this increases the potential for profits, it also increases the potential risk. When you trade on the margin, you will effectively be borrowing capital from the broker. This capital will need to be paid back regardless of whether or not the position is successful, and the more you borrow, the more you will need to pay the broker. You may also experience a margin call if your available funds fall below a certain level, which means your positions may be closed automatically.

Download MetaTrader 4

If you want to trade on the forex market, you need a platform you can trust — this is where you will find all the tools and features you need to analyse market movements and open and close positions on forex pairs. Many platforms are available, but VT Markets seeks to help our users narrow their choices and connect with some of the most intuitively designed and powerful tools available.

We offer MetaTrader 4 here on the VT Markets site. Once you have set up your VT Markets account, you’ll be able to download the MT4 platform and get started immediately. From here, you can begin to grow your experience and make trades either on the demo or the live version of the platform. We recommend using the demo MT4 account first to build your confidence and understanding before you start to make trades for real.

So what are the first steps? To begin, you’ll need to choose which version of MetaTrader 4 to download. This will depend upon what device you are using. Take a look at our guide below to find out more about how to download the platform.

Downloading MetaTrader 4 — A straightforward guide to help you get started

You can download and use MT4 across various devices and operating systems, providing traders with a more flexible and capable set of options. These include most desktop devices and operating systems and mobile and tablet devices.

Downloading the MT4 platform for desktop and laptop

Desktop and laptop devices tend to be more powerful than your smartphone or tablet, offering more storage capability and scoring higher on other key metrics. The extra capacity and power of the device enable you to get the most out of the software, as this was the operating environment it was originally designed for. Many users prefer to download MT4 on a PC or laptop device.

  • Download MetaTrader 4 for Microsoft Windows — Most laptop and desktop devices still use the Microsoft Windows operating system, and MT4 is designed for use on this OS.
  • Download MetaTrader 4 for Apple Mac OS — Many users prefer Apple’s Mac OS, and all Macs and computers developed by Apple will run this OS. You can download MT4 to your Mac if required.
  • Download MetaTrader 4 for Linux — Linux is not as widely used as Windows and Mac OS. Still, developers have used the open-source system to create many operating systems, many of which have become popular. The Linux OS does support the MetaTrader 4 platform.
Downloading the MT4 platform for smartphones and tablets

While MT4 was initially developed with the power and function of desktop devices in mind, it is now available in smartphone and tablet versions. These versions help traders enjoy a far more convenient experience, with market data and trading tools right in the palm of their hand, even when they are out and about.

  • Download MetaTrader 4 for Apple iOS Devices — Like with the Mac OS, many users are experts in using Apple products and prefer to utilise Apple OS versions of software and apps. To support this, MT4 is available for download on Apple’s iPhone and iPad products. While the tablet version provides more detailed views, traders can still utilise all the required features on the mobile version. 
  • Download MetaTrader 4 for Android Devices — Android devices are becoming increasingly popular among smartphone and mobile users, and various Android operating systems power various products in the market. If you have one of these devices, you’ll be able to have MT4 downloaded on your Android smartphone or tablet.

Your guide to a successful MetaTrader 4 download

It’s easy to download the MT4 platform you need when you use VT Markets. With a handy wizard feature, downloading and setup is largely automated. Follow these handy steps to complete your installation.

  • Step One — Create your VT Markets account here on the website. Add your personal information, confirm your identification, and then add funds to your account.
  • Step Two — Log into your VT Markets account and head to the top banner menu on any page on the VT Markets site. Select MetaTrader 4 in the drop-down menu and open this page. From here, select the link to begin to download for the operating system and device you are using.
  • Step Three — Open the .exe file and follow the wizard to complete the laptop and desktop devices setup. Move through the different screens of the wizard, select a download file folder and configure your options. The platform will be saved in your default download file if you don’t do this. Select Finish once you reach the end of the wizard. If you are using a mobile or tablet device, it will be saved to your app folder, and the installation will take place automatically.
  • Step Four — Log into the MT4 platform and use the features. You can grow your experience over time, utilising features such as MT4 indicators to execute more advanced trading and predictive functions.

Understanding the different MT4 trading accounts

You will want to take some time to develop your experience and gain confidence using the platform. While there are never any guarantees with forex trading — and even more experienced traders can find that their positions are not always successful — learning how to trade forex carefully will help you make future strategic decisions. With this in mind, we offer two versions of the MT4 platform for download. Learn more about these below.

Downloading and using the demo version of MT4

The demo version of MT4 is the same as the full version. You’ll still be able to take advantage of all of the different features and tools built into the platform, and you’ll have the opportunity to grow your skills and experience in a meaningful way. The only major difference is that there is no real money changing hands. As this is just a demo account, you won’t be executing trades for real. Of course, this means there’s no potential for profit, but there’s no risk either.

We highly recommend you use the demo account for a while when you first download MetaTrader 4. Even if you already have some experience with trading forex, you’ll need time to learn how to use MT4 and to grow acquainted with the specific features of the platform. The risk-free environment of the demo account is perfect for achieving this. 

Downloading and using the live version of MT4

When you download the live version of MetaTrader 4, you gain access to all of the platform’s features, from indicators and other predictive tools to those used in active trading. In this sense, it’s almost the same as the demo version, only this version of MT4 supports live trades.

This means you can make money when you open and close positions on the live version of the platform, but there’s also the potential to lose money. Bear this risk in mind, and trade conservatively. If you decide to maximise your exposure in the market with margin trading or leverage trading on forex pairs, you will increase the risk level. 

The margin in FX refers to the amount of money you will need to put forward to control a position. Trading on the margin means you are essentially borrowing capital from the broker, which will need to be paid back. Leverage works similarly, maximising the stake you control and involves borrowing capital directly from the broker.

Only adopt these forms of trading if you are confident with using the MetaTrader 4 version you downloaded and after you have spent time learning forex and practising on the demo version of the platform.

Download MT4 and start growing your trading experience

We want to ensure that our users have access to all the tools and platforms they need to develop their experience as they trade forex. This is why we provide a roster of industry-leading software pieces designed to help traders open and close positions according to their unique strategies. 

There are always risks involved with this kind of trading, which is why it’s a good idea to practise using the features of MT4 after you download it. To do this, simply use the demo account, and enjoy all the features in a risk-free environment. When you feel ready, you can graduate to the live trading account and open positions for real. Want to learn more about our platform? Reach out to our team today.

Most traded forex currency pairs

What are the best forex pairs to trade? If only this question had a straightforward answer — it would make learning how to trade forex and speculating on currency movements far more reliable. Unfortunately, this is not the case, and deciding on the best currency pairs to trade is always a personal choice and depends exclusively on your own trading strategy.
However, examining the most traded currency pairs in the market can be helpful. This gives you some idea of the most liquid options when trading currency pairs and provides you with a wealth of data you can use to develop your future strategies.

EUR/USD — European Euro and United States Dollar

The EUR/USD currency pair is the most traded in the market regarding volume and trading frequency. In forex trading, this high volume builds momentum, making the most frequently traded pairs very popular among currency speculators. This is because of the high liquidity of frequently traded pairs, which helps keep spreads tight. 

Traders must remain aware of actions from the European Central Bank and the United States Federal Reserve. These financial institutions set the interest rates that dictate the relative values of the currencies. If one institution increases interest rates relative to the other, that institution’s currency may grow in value — this will dictate whether the trader needs to open a long or short position.

USD/JPY — United States Dollar and Japanese Yen

The USD/JPY pair puts the United States Dollar in the base position and uses the Japanese Yen as the quote currency. This pair is sometimes referred to as the gopher, another highly liquid option for traders. The liquidity is supported by the proliferation of trading on the Japanese Yen in the Asian market — a huge portion of the global forex trading landscape. 

Again, the Federal Reserve sets interest rates on the USD, but the Bank of Japan dictates Japanese domestic rates. Traders will need to be aware of changes in these rates as they decide on their strategy for the USD/JPY.

GBP/USD — British Pound and United States Dollar

With the British Pound as the base currency and the United States Dollar as the quote currency, the GBP/USD pair is sometimes referred to as “cable” among forex traders. This is because of the long history of trading across the pair, and it refers directly to the wire cables that used to be utilised to execute transatlantic trades.

Traders must remain aware of the actions of the Federal Reserve in the United States and the Bank of England in London. Both of these factors will impact the performance of the GBP relative to the quoted USD value.

AUD/USD — Australian Dollar and United States Dollar

Traders may call the AUD/USD pair “the Aussie” simply because the Australian Dollar is in the base position, while the United States Dollar is the quote currency. While many other pairs use the Australian Dollar as the base currency, the AUD/USD is the most frequently traded and liquid, so this one receives the colloquial nickname.

The Reserve Bank of Australia determines the country’s official cash rate, so traders need to be aware of this in relation to the current Federal Reserve interest rate. The Australian Dollar also depends on the performance of the natural resources that bolster the country’s economy.

USD/CAD — United States Dollar and Canadian Dollar

The USD/CAD is another pair on this list, with the United States Dollar in the base position while the neighbouring Canadian Dollar takes the quote position. This pair may also be called “the loonie”, a nickname for the physical Canadian Dollar coin. 

In addition to the interest rates across the two nations, traders will need to be aware of the price of oil on the global market. This is an important influence on the Canadian economy and will affect the currency’s value relative to the United States Dollar south of the border.

USD/CNY — United States Dollar and Chinese Yuan

This currency pair puts the United States Dollar and the Chinese Yuan in the base and quote positions, respectively. As the two biggest economies in the world, the United States and the People’s Republic of China have a huge influence on the forex market, and this pair has grown to become one of the most frequently traded in the world.

The Chinese central government exerts control over the country’s economy and the value of its currency. It has intentionally allowed the value of the Yuan — sometimes referred to as the Renminbi — to depreciate relative to other global currencies. This makes the USD/CNY a unique pairing on this list, and the potential volatility of the pair has been compounded in recent years by the unfolding trade war and political tensions between the two countries.

USD/CHF — United States Dollar and Swiss Franc

When forex platform users are trading currency pairs, they may notice “the Swissie” — this is another name for the United States Dollar and Swiss Franc currency pair, or the USD/CHF.

The Swiss Franc is often considered a stable currency, so traders may be tempted to invest in the CHF during periods of uncertainty in the broader market. If the market is generally stable, traders are less likely to turn to the Swiss Franc. Despite this, the USD/CHF, or Swissie, remains one of the most traded currency pairs.

USD/HKD — United States Dollar and Hong Kong Dollar

One of the most traded currency pairs in recent years has been the United States Dollar and the Hong Kong Dollar, or USD/HKD. This is a somewhat unique entry on this list simply because of the relationship between the two currencies. The HKD quote currency is pegged directly to the USD base currency, which means the value of the quote currency will rise and fall with that of the base currency.

There is still room for speculation, however. The HKD can fluctuate by several cents up or down from the current United States Dollar value. When extrapolated out over larger trade values and volumes — or trades made with leverage in the FX market — this can still represent a significant level of fluctuation.

EUR/GBP — European Euro and British Pound

Bringing together the European Euro in the base currency slot, up against the British Pound in the quote position, the EUR/GBP currency pair is among the most interesting options around. This is because of the geopolitical and economic speculation that has taken place in this part of the world over the last few years. While Britain was never in the Eurozone, it was a member of the European Union until several years ago. Its recent exit has caused serious fluctuations in the relative values of the two currencies.

Of course, fluctuations and volatility do not always mean bad news for investors, and many traders will actively welcome this kind of movement in the market. This is why the EUR/GBP has become one of the most popular choices for speculation, although traders are always advised to tread carefully.

USD/KRW — United States Dollar and Korean Won

The tenth and final pair on this list of the most traded currency pairs is the USD/KRW. With this pair, we find the United States Dollar in the base currency position again, while South Korea’s Won fills the quote currency position.

Huge economic growth in South Korea in the last few decades, as well as its status as one of the leaders in the global tech market, has led to considerable interest in this currency. And, of course, the United States Dollar remains one of the most commonly traded currencies in the world, making for a natural base option.

A few things to bear in mind when trading currency pairs

The above list is not definitive. The market’s most commonly traded currency pairs can change at any time, with new pairs emerging and other pairs falling out of favour. As you decide on the best currency pairs to trade, you’ll need to pay attention to market movements, examine the dashboard of your trading platform and identify trends.

Examining the market means you’ll need to stay aware of pips. Pips in FX are small movements, typically at the fourth decimal place of the currency pair value. However, with smaller denomination quote currencies like the Japanese Yen or Korean Won, these movements may be at the second decimal place. While a single pip movement may not look like much, this can represent a significant amount of money on a large trade. Even on smaller trades, pip movements decide whether the position is successful or not.

Trade the main currency pairs at VT Markets

Here at VT Markets, we provide traders with the tools and platforms they need to grow their experience in the market. This may include trading with some of the common most traded currency pairs out there, or it may involve emerging and exotic pairs. Whichever strategy you choose, begin your journey with a demo account and open real positions on the live trading account. Want to discover more? Reach out to our team today.

Week ahead: All eyes on US Non-Farm Employment Change and FOMC Meeting Minutes

The US will release the Non-Farm Employment Change and FOMC Meeting Minutes this week. 

The Non-farm Employment Change is expected to show a total of 220,000 jobs added in December, down from the 263,000 jobs added in November. Forecasters also expect the Unemployment Rate to remain unchanged at 3.7%. 

Meanwhile, the Minutes from the Federal Open Market Committee will shed further light on policy intentions going forward.

Here are the key market events for the week ahead:

Swiss Consumer Price Index (4 January)

The Consumer Price Index in Switzerland stood at 0% in November of 2022, unchanged from the previous month. 

Analysts expect the index to decrease by 0.3% in December.

US ISM Manufacturing PMI (4 January)

The US Institute for Supply Management’s Manufacturing Purchasing Managers Index fell to 49 in November 2022 from 50.2 in October, its first contraction since May 2020.

Analysts expect the index to remain at 49.

US JOLTS Job Openings (4 January)

US job openings dropped by 353,000 to 10.3 million in October 2022, according to the JOLTS report. This may indicate that demand for workers has started to slow amid a softer economic forecast and higher interest rates.

Analysts expect that the number of available jobs will decrease more in November to 10.1 million.

FOMC Meeting Minutes (5 January)

In its last monetary policy meeting of 2022, the Federal Reserve raised the fed funds rate by 50bps to 4.25%-4.5%. This was its seventh consecutive rate hike.

The Fed expects that interest rates would reach 5.1% in 2023, 4.1% in 2024, and 3.1% in 2025.

ADP Non-Farm Employment Change (5 January)

The US private sector added only 127,000 jobs in November of 2022, below economists’ expectations.

Economists expect ADP Non-Farm to create another 150,000 jobs in December.

Canada Employment Change (6 January)

In November 2022, 10,100 jobs were added to the Canadian economy, while the unemployment rate stood at 5.1%, decreasing from the previous month’s rate of 5.2%.

Analysts predict that employment will grow by an additional 60,000 positions over the next month, with the unemployment rate to stand at 5.2%.

US Non-Farm Employment Change (6 January)

The US non-farm payrolls report for November showed an increase of 263,000 jobs following a downwardly revised 284,000 gain in October. The unemployment rate was unchanged at 3.7%, close to September’s 3.5%.

Analysts expect the unemployment rate to remain unchanged at 3.7% while non-farm payrolls will increase by 220,000 for December.

US ISM Services PMI (6 January)

The US Institute for Supply Management’s Services Index jumped to 56.5 in November from 54.4 in October. It is expected to decline slightly to 53 in December.

Economic data-packed week starts 2023

American markets start trading today. Before Asia opened, U.S. equity futures surged. An economic data-packed week will start the year. ADP and the Department of Labor will report nonfarm employment change and first jobless claims during the late American trading session on the fifth. The December U.S. nonfarm payrolls and unemployment rate will be noted on December 6. German and EU CPI for December will be released on December 6, respectively.

In 2022, all three major U.S. market indices performed worst since 2008. Dow Jones Industrial Average dropped 8.8% to 33147.25. S&P 500 fell 19.4% to 3839.5. Nasdaq plummeted 33.1% to 10466.88. Inflation and central bank tightening have caused one of the most volatile equity markets in recent years. Late-cycle economic activity—tight labour markets, increasing inventories, declining profit margins, and most importantly, tighter monetary policy—indicates an even gloomier investment climate for 2023.

Geopolitical conflicts will drive market action in 2023. Since March 2022, the Russia-Ukraine conflict has persisted. The Kremlin has faced unprecedented Western punishment for shelling Kyiv and other Ukrainian cities. The eight-month battle has disrupted supply chains, raising commodity prices, and weakened international relations. A resolution between the two countries will affect Eastern Europe’s economy and the Euro.

Main Pairs Movement

On the very first trading day of 2023, the Dollar index did not make the market surprised with huge floating based on last Friday’s close price. Instead, it failed to start in a positive way to 2023 as the DXY remained under pressure during the early Asian session on Monday near a seven-month low, which was near 103.40 by now.

EURUSD lost some vantages on the first trading day of 2023 due to thin liquidity conditions in the financial markets. It fell around 0.32% and closed at around 1.06640 price level. The release of S&P Global PMIs in the Eurozone on Monday failed to support the shared currency.

GBPUSD extends its daily slide trend, failing to keep price above 1.2050 of the closing price during Monday’s trading course. Amid thin trading conditions on the observed New Year holiday, the pairs’ losses remain limited for the time being.

Gold price settled around 1823.00 on last Friday after failing to surpass the same resistance despite a sell-off in the DXY. The precious metal delivered a gradual upside move from the psychological support of $1,800.00 after sheer pain in the USD Index.

Technical Analysis

EURUSD (4-Hour Chart)

The EUR/USD pair edged lower on Monday, remaining under bearish pressure and continued to trade in a tight channel below 1.0700 as trading conditions remain thin with major markets remaining closed during the New Year holiday. The pair is now trading at 1.0667, posting a 0.31% loss daily. EUR/USD stays in the negative territory amid holidays in the global markets, despite the downbeat prints of the US data has dragged the US Dollar Index (DXY) to refresh a seven-month low the previous day. On the economic data front, Wednesday’s latest FOMC meeting minutes and Friday’s December month employment numbers for the US will both be crucial for the EUR/USD traders to watch. In the Eurozone, the hawkish comments from ECB President Christine Lagarde failed to support the EUR/USD pair as Germany’s Finance Minister Christian Lindner expects that inflation in Europe’s biggest economy to drop to 7% this year and continue falling in 2024.

For the technical aspect, RSI indicator 51 figures as of writing, suggesting that the pair could experience some downside momentum as the RSI is falling towards 50. As for the Bollinger Bands, the price witnessed fresh selling and dropped to the moving average, therefore the downside traction should persist. In conclusion, we think the market will be bearish as the pair is heading to test the 1.0660 support line. On the upside, the case for recovery will be firmer if the pair extends gains above 1.0710.

Resistance:  1.0710

Support: 1.0660, 1.0584, 1.0467

GBPUSD (4-Hour Chart)

The GBP/USD pair declined on Monday, coming under modest bearish pressure and stretched lower to the 1.2050 area amid a cautious market mood on the first trading day of 2023. At the time of writing, the cable stays in negative territory with a 0.36% loss for the day. Investors grow increasingly concerned over the impact of the surging number of coronavirus cases in China on global economic activity as the country stays on the reopening path. For the British pound, British Prime Minister (PM) Rishi Sunak shelved the plans for a major overhaul of the childcare system aimed at saving parents money and helping them return to work. Moreover, British ministers think UK labour unions will run out of money and have to back down but the unions reject the claim. Therefore, the British labour strike and UK PM Sunak’s pushback to childcare reform join geopolitical concerns to exert bearish pressure on the GBP/USD pair.

For the technical aspect, RSI indicator 44 figures as of writing, suggesting the bearish traction will remain in the near-term technical outlook as the RSI stays below the mid-line. As for the Bollinger Bands, the price preserved its downside traction and dropped below the moving average, therefore a continuation of the bearish trend can be expected. In conclusion, we think the market will be bearish as long as the 1.2095 resistance line holds. A four-hour close above that level could open the door for additional gains and favour the bulls.

Resistance: 1.2095, 1.2212, 1.2334

Support: 1.2012, 1.1942

USDCAD (4-Hour Chart)

Despite most markets remaining closed on the observance of the new year’s holiday on Monday, the pair USD/CAD witnessed some upside momentum and climbed to a daily top around the 1.3580 mark in the early US trading session. USD/CAD is trading at 1.3572 at the time of writing, rising 0.23% daily. the lack of US and Canadian economic data keeps traders leaning on market mood and technicals. Investors now shift their focus to the S&P Global Manufacturing PMIs for both countries, with Canada’s PMI expected to drop to 49.2, below the previous month’s reading of 49.6. On top of that, the fears of easing demand, which is mainly due to the Covid fears emanating from China, might limit the upside for the crude oil prices and undermine the commodity-linked loonie. Looking forward, holidays in multiple markets could restrict the USD/CAD intraday moves.

For the technical aspect, RSI indicator 54 figures as of writing, suggesting the pair’s indecisiveness in the near term as the RSI indicator hovers around the mid-line. For the Bollinger Bands, the price regained some upside strength and climbed above the moving average, therefore a continuation of the upside trend could be expected. In conclusion, we think the market will be slightly bullish as long as the 1.3529 support line holds. The rising RSI also reflects bull signals as the oscillator has exited from the bearish territory.

Resistance: 1.3608, 1.3675, 1.3704

Support: 1.3529, 1.3497, 1.3399

Economic Data

CurrencyDataTime (GMT + 8)Forecast
CNYCaixin Manufacturing PMI (Dec)09:4548.8
EURGerman Unemployment Change (Dec)16:5515K
GBPManufacturing PMI (Dec)17:3044.7
EURGerman CPI (YoY) (Dec)21:009.1%

US equities climbed as the stronger jobs data would support more aggressive policy

US stocks rose in a broad-based rally and Treasury yields fell as data allayed fears of a supercharged jobs market that would support a more aggressive policy path. A gauge of the dollar fell. Investors took solace in US jobs data that failed to reveal unwanted surprises while underscoring the resilience of the labour market in the face of the Federal Reserve’s aggressive monetary tightening. Initial unemployment claims rose slightly to 225,000, in line with expectations, in the week ended Dec. 24.

Continuing claims rose to 1.7 million in the week ended Dec. 17, the most since early February. The rally is a ray of light as a dismal year for stocks and bonds draws to a close. Global equities have lost a fifth of their value in 2022, the largest decline since 2008 on an annual basis.

The benchmark, the S&P500 rallied with a 1.75% daily gain on Thursday. All eleven sectors in S&P500 stayed in the positive territory, with the Communication Service and Information technology section performing the best among all groups, rising 2.69% and 2.64% respectively for the day. Apart from this, the tech-heavy Nasdaq 100 outperformed, surging by 2.54% on a daily gain.

Trade CFD with VT Markets

Main Pairs Movement

The US Dollar slid with 0.49% daily losses on Thursday, as US data showed the resilience of the labour market. The DXY index suffered heavy selling pressures all day, touching a daily low level below 103.8.

The GBPUSD edged higher with 0.31% daily for the day, as a decent recovery in the risk appetite theme. The pair regained mildly positive momentum in the late UK trading session, ending around the 1.2045 level. Meanwhile, the EURUSD witnessed fresh transactions since European trading hours and touched a daily high level of 1.069. The pair ended the day with a 0.46% daily gain.

The gold surged by 0.59% daily on Thursday, as the greenback stayed on the back foot, which provide support for the dollar-denominated yellow metal. The XAUUSD gained upside traction during the late European session, once reaching a daily high of $1820 marks in the middle of US trading hours.

Technical Analysis

EURUSD (4-Hour Chart)

EURUSD raised $0.0049 and edged higher around 0.46% throughout Thursday’s trading. The EUR is holding gains against the dollar as market sentiment improves ahead of the final trading day of 2022. Data from the US showed a slight increase in jobless claims, boosting EUR/USD, while China’s Covid-19 easing made investors nervous. In other places, Russia’s invasion of Ukraine has escalated with a news report of the shelling of Kyiv and other cities.

Meanwhile, the Eurozone economic calendar saw Spanish retail sales jump 3.8% month-over-month over the previous month’s 0.4%, while EU M3 money supply jumped to 4.8% year-over-year in November versus expectations of 5%.

On the technical side, EUR/USD is still trading unstable, as usually happened in the last ten days of trading of the year. However, the RSI indicators show that the common currency could start the new year at a higher as the RoC is flat. RSI for the pair sits at 64.52, as of writing. On the four-hour chart, EURUSD currently trades above its 50, 100, and 200-day SMA.

Resistance: 1.0695, 1.0736

Support: 1.0585, 1.0459

GBPUSD (4-Hour Chart)

The Pound remains sideways during the North American session after hitting a daily low of $1.2005 against the US dollar. However, the cable slightly raised by 18 pips after US initial jobless claims data was released on the 30 minutes chart. As of writing, the price sitting at $1.20707, raised around 0.45% in today’s trading course. On Friday, the UK economic docket is empty, while the US calendar will feature the Chicago PMI for December, estimated at 40.

On the other side, the GBP/USD is motivated by the US dollar due to the lack of UK economic data. The DXY a gauge that tracks the greenback value of a packet of six currencies tumbles 0.5% down to $103.8 as of writing. Weighed by falling US treasury yields. The US 10-year benchmark note rate drops 3.0 basis points to 3.85%.

On the technical side, from the daily chart, the GBP/USD upside was restricted by the 20 and 200-day EMA, each at $1.12111 and $1.2082. The RSI and RoC indicate that the cable is edging up, even though the short-side sellers are beginning to gather momentum. From the four-hour chart, the price level sits above the descending regression channel and is close to 20-day SMA. RSI for the pair sits at 54.74, as of writing. On the four-hour chart, GBPUSD currently trades above its 50, and 100-day SMA and just crossed its 200-day SMA.

Resistance: 1.2320, 1.2600

Support: 1.19, 1.176

XAUUSD (4-Hour Chart)

Gold price raised over 0.8% to $1,820 during today’s trading course as of writing. As US 10-year treasury yields edge lower 3.0 basis points to 3.85%, probes the DXY bulls and puts a floor under the gold price. Also, the US weekly initial jobless claims-related data with 225K meet markets’ expectations. Which gave the investors the belief that the Fed may ease the fighting strength against inflation, leading the greenback to devaluation, and DXY falls over 0.5% down to $103.8 as of writing.

On the other hand, should keep an eye on China’s Zero-Covid policy, as around seven major nations have recently announced Covid test requirements for Chinese travellers as the virus cases swirl in the dragon nation. a top official from the Chinese Center for Disease Control and Prevention recently warned of Covid spreading throughout the holiday season. The diplomat, however, also mentioned that the covid virus outbreaks have peaked in Beijing, Tianjin and Chengdu.

On the technical side, a three-week-old ascending triangle restricts Gold prices between $1,782 and $1,825. That means the XAU/USD currently fades bounce off a fortnight-old upward-sloping support line inside the stated triangle. RSI sits at 59.21 as of writing. On the four-hour chart, gold price trades above its 50, 100, and 200-day SMA.

Resistance levels: 1820, 1830

Support levels: 1792, 1785, 1773

Economic Data

CurrencyDataTime (GMT + 8)Forecast
USDCrude Oil Inventories00:00-1.250M

Weekly Dividend Adjustment Notice – December 29, 2022

Dear Client,

Please note that when constituent stocks of a market index generate dividends, VT Markets will make dividends and deductions for clients who hold the products after the close of the day before the ex-dividend date.

The dividends will not be paid/charged as an inclusion along with Swap. It will be executed separately in your account and the record will be annotated as “Div & Product Name & Net Volume”.

Please note the specific adjustments as follows:

The above data is for reference only, please refer to the MT4/MT5 software for specific data.

If you’d like more information, please don’t hesitate to contact [email protected].

US stocks fall due to COVID-19 concerns

US stocks were dragged lower for a second day, as stocks in Asia headed for declines on Wednesday with fresh concerns about the spread of Covid-19 from China unnerved investors. Market appetite for risk waned on news that the US would require inbound airline passengers from China to show a negative Covid-19 test before entry.

In Italy, health officials said they would test arrivals from China and said almost half of passengers on two flights from China to Milan were found to have the virus. However, Hong Kong removed limits on gatherings and testing for travellers in a further unwinding of its last major Covid rules, offering a boost to the global economy but sparking concerns it would amplify inflation pressures and prompt US policymakers to maintain tight monetary settings.

The benchmarks, the S&P500 dropped 1.2% for the day, to the lowest level in more than a month. All eleven sectors stayed in the negative territory, especially the Energy sector fell dramatically with 2.22% daily losses after the several-day surge. The tech-heavy Nasdaq 100 further declined by 1.3% daily, and the Dow Jones Industrial Average slid 1.10% on Wednesday.

Main Pairs Movement

The US Dollar edged higher with a 0.27% daily gain on Wednesday, as the concerns about the outbreak of Covid-19 from China attracted some risk-aversion flow to the safe-haven greenback. The DXY index confronted some mild selling during the first half of Wednesday, then managed to rebound above the 104.4 level during the US trading session.

The GBPUSD has little change lower for the day, as the strong US Dollar is across the board. The cables dropped hugely during the early American trading session as the US administration announced mandatory Covid tests for travellers from China. In the meantime, EURUSD tumbled by almost 0.36% undermining market risk sentiment. The pair ended the day with 0.26% daily losses.

The Gold price remains defensive around the $1805 mark after printing the first daily negative closing in three, as the market’s fresh fears of inflation, emanating from China, as well as geopolitical tension surrounding Russia and Ukraine, which in turn provide support for US Treasury bond yields and the greenback. The XAUUSD slumped during the UK trading hour and once fell below the $1800 mark, then regain upside momentum and stand firmly around the $1805 mark.

Technical Analysis

EURUSD (4-Hour Chart)

EURUSD edged lower throughout Wednesday’s trading and could not extend the pair’s three-day winning streak. The Euro-Dollar pair witnessed large volatility at the start of the American trading session as the Dollar dipped before starting an impressive rally that altered the course of EURUSD. The renewed Dollar strength comes after U.S. equities continue to sell off as the year comes to a close. Market participants are looking for safety as both equities and bonds continue to lose ground since trading began after the holidays. The benchmark U.S. 10-year treasury yield is now trading above the 3.87% mark, while the 2-year treasury yield was last seen trading at 4.357%. Yield curve inversion, often seen during late-cycle economies,  will continue to be the norm as global economies head into a grim 2023. The nature of late-cycle economies could favour the U.S. Greenback in 2023 as global market participants look to protect asset valuations.

On the technical side, EURUSD has continued to trade below our previously estimated resistance level of 1.0695. Short-term support remains at 1.0585 and 1.04591. RSI for the pair sits at 61.97, as of writing. On the four-hour chart, EURUSD currently trades above its 50, 100, and 200-day SMA.

Resistance: 1.0695

Support: 1.0585, 1.0459

GBPUSD (4-Hour Chart)

The pound rose sharply after a choppy European session, rebounding from an intra-day low near $1.2000 to challenge the $1.2100 figure in the American session. China is lifting Covid-19 restrictions on tourists, while it has started issuing travel permits to Hong Kong residents. In addition, authorities are starting to issue passports and will officially reopen the border on Jan. 8. Even though sentiment has turned positive, concerns about rising inflationary pressures are keeping traders on their toes. the U.S. Dollar Index, which measures the value of the greenback against a basket of peers – was down 0.28% at 103.984, weighed down by lower yields on U.S. Treasuries. There are no particular market events by this week for the UK.

Looking at the daily chart, GBP/USD is testing the 20 and 200-day EMA at 1.2113 after bouncing off the weekly lows near 1.2000. If the former is cleared, nest resistance would be the previous support-transfer-resistance of the uptrend line near 1.2180, followed by the 1.2200 figure. Conversely, failure to stay above 1.2100 could pave the way towards the weekly low at 1.2000 and the 50-day EMA at 1.1935. RSI for the pair sits at 48.71, as of writing. On the four-hour chart, GBPUSD currently trades above its 50, 100 day SMA but above its 200-day SMA.

Resistance: 1.2320, 1.2600

Support: 1.19, 1.176

XAUUSD (4-Hour Chart)

XAUUSD gave back gains after surging higher on Tuesday and fell further on Wednesday, basically having spit out all gains so far. The prices edged lower by nearly 1% to the lowest price at $1,797 during the American trading session.  It is hovering around $1,800 with bearish trends. As the price broke through the last estimated support of $1,812 and $1,800, it would make gold vulnerable to a decline to test an uptrend line around $1,795. A break below could trigger more losses, to the $1,785 zone. Below the next support is located at $1,773, which is Dec 15 & 16 low. As equity prices in Wall Street turned negative and amid a rebound in US yields to fresh daily highs, and the US Dollar Index rose from the lowest level in almost a week at 103.84 to 104.45, the strongest since Friday. The context put pressure on the gold price.

On the technical side, The four-hour chart shows that gold prices have slowed since mid-November, with the centre of gravity gradually rising, but the trend is gradually forming a rising wedge that warrants caution, as this is often a signal for a reversal to the downside. RSI sits at 57.47 as of writing. On the four-hour chart, gold price trades above its 50, 100, and 200-day SMA.

Resistance levels: 1805, 1820, 1830

Support levels: 1792, 1785, 1773

Economic Data

CurrencyDataTime (GMT + 8)Forecast
USDInitial Jobless Claims21:30225K

US 10-year treasuries climbed as China lifted the visitor quarantine

US stocks fall to start the final week of 2022 trading. Tesla Inc. shares led to losses as a report of a plan to temporarily halt production at its China factory rekindled fears about demand risks. Besides, Apple Inc. touched the lowest since June 2021 amid a slump in big tech. Moreover, Southwest Airlines Co. led declines in airline stocks after cancelling flights, hobbled by a massive winter storm that battered the US.

The yield on 10-year Treasuries climbed 10 basis points to the highest since mid-November, as China moved to end the quarantine for inbound visitors.

The benchmark, the S&P 500 fell with 0.40% daily losses with trading about 20% below the 30-day average. Six of eleven sectors of the S&P500 stayed in the negative territory, and the Consumer Discretion section got the worst performance among all groups, recording 1.64% losses daily. Apart from this, the tech-heavy Nasdaq underperformed, dropping more than 1%. The Dow Jones Industrial Average surprisingly edged higher by 0.1%, and the MSCI world index moved lower by 0.1% for the day.

Main Pairs Movement

The US Dollar index edged lower on Tuesday, as trading volume is low with investors just coming back from the Christmas holidays. The DXY index hovered in a narrow range from 103.9 to 104.4 during the first trading day of the last week of this year.

The GBPUSD stayed on the defensive since the UK trading session, with China announcing earlier in the day that it will lift quarantine obligations for travellers from January 8 as part of its reopening efforts. The pair dropped around 0.78% in the period of European trading hours. In the meantime, the EURUSD was pricing with wild moves on Tuesday. The pair dropped hugely ahead of the US trading hour but managed to erase most losses and ended with a 0.03% daily gain.

The gold is benefiting from recent positive headlines surrounding Beijing. China’s easing of the Coronavirus-linked activity restrictions joined an upward revision to the 2021 GDP forecast to favour gold bulls amid a sluggish holiday season. The XAUUSD surged and once climbed above the $1830 mark in the early American trading session, then pullback and ended with a 0.86% daily gain on Tuesday.

Technical Analysis

EURUSD (4-Hour Chart)

Discover Forex with VT Markets

EURUSD edged higher on the first day of the holiday-shortened trading week. The Euro fared better against the Dollar as market participants continue to sell the Greenback while U.S. interest rate expectations trim lower. Furthermore, the Dallas Fed’s December Texas Manufacturing Outlook Survey indicates a further drawdown of business activity and demand, thus prompting market participants to ditch the U.S. Greenback as markets lower interest rate expectations from the Fed.

The lowered business activity indicator furthers the recession rhetoric as markets brace for pending economic slowdown. On the economic docket, no major data releases are scheduled for the E.U., while the U.S. will release its pending home sales figures during today’s American trading session.

On the technical side, EURUSD continues to trade below our previously estimated resistance level of 1.065, but the pair has witnessed a steady upward momentum over the past four days. A new short-term support level around the 1.0585 price region. RSI for the pair sits at 56.95, as of writing. On the four-hour chart, EURUSD currently trades above its 50, 100, and 200-day SMA.

Resistance: 1.0650, 1.0695

Support: 1.0580, 1.0500, 1.0459, 1.0228

GBPUSD (4-Hour Chart)

GBPUSD edged lower on the first trading day of the week. Cable has been trading extremely range-bound over the past 3 trading sessions as the year ends. The British Pound continues to be plagued by the U.K.’s economic outlook and inflation; however, losses for Cable should be contained as no significant market-moving news is scheduled before 2023. The U.S. Greenback has shown weakness over the holiday weekend as China loosened its Covid restrictions and prompted a gain for the CNY.

The Dollar index lost 0.2% throughout Tuesday’s trading. While the U.S. 10-year treasury yield has resumed above 3.8%, market participants are not piling into U.S. treasury bonds as they expect flows to favour the equity market. On the economic docket, the U.K. has no significant news scheduled for the 28th, while the U.S. will release its pending home sales figures for November during the American trading session.

On the technical side, GBPUSD continues to trade below our previously estimated resistance level of 1.232. A steady downward trend has formed for Cable over the past week. The short-term support level for Cable remains at around the 1.19 and 1.176 price region. RSI for the pair sits at 43.51, as of writing. On the four-hour chart, GBPUSD currently trades below its 50, 100, and 200-day SMA.

Resistance: 1.2320, 1.2600

Support: 1.19, 1.176

XAUUSD (4-Hour Chart)

After dropping toward $1,800 in the early American session on Tuesday, yellow metal prices hiked nearly 1.9% up to a fresh December high of $1,833 during the intraday trading. The markets’ atmosphere started the week in an optimistic mood amid news from China, which is the biggest country producing gold, indicating that the local government will focus on economic growth, further moving away from its zero-covid policy. Meanwhile, the 10-year US Treasury bond yield holds positive territory above 3.8% but does little to nothing to derail the gold price’s rally.

On the technical side, according to the four-hour chart, technical indicators head north almost vertically, although the Momentum stands at neutral levels, while the RSI is near overbought readings. At the same time, XAUUSD has accelerated north after meeting buyers around a flat 20 SMA, currently at $1,805, which remains above the longer ones. RSI sits at 64.28 as of writing. On the four-hour chart, gold price trades above its 50, 100, and 200-day SMA.

Resistance levels: 1833, 1845, 1864

Support levels: 1812, 1805, 1792, 1785

Economic Data

CurrencyDataTime (GMT + 8)Forecast
USDPending Home Sales (Nov)23:00-0.8%
Back To Top
server

Hello there 👋

How can I help you?

Chat with our team instantly

Live Chat

Start a live conversation through...

  • Telegram
    hold On hold
  • Coming Soon...

Hello there 👋

How can I help you?

telegram

Scan the QR code with your smartphone to start a chat with us, or click here.

Don’t have the Telegram App or Desktop installed? Use Web Telegram instead.

QR code