If you’re a forex trader you’ll know that MetaTrader 4 is the king of Forex trading platforms. Not only does it allow you to place and manage orders, undertake various technical analysis functions and auto trade, it also allows you to do plenty of not-so-well-known things. Let’s talk about a few.
First, the ruler tool. This is super handy when measuring this distance (in pips) between two points… ie stop loss and entry, etc. So how do you get this tool? Simple, click on the cross hair, or press Ctrl+F and click and drag between two points. You’ll find all sorts of handy info such as pip-distance, the number of bars in a range and the date. Not bad!
Secondly, if there are some indicators, scripts or EAs that you frequently use, why not make it easier to access them. Simply right-click on the item of your choosing and select ‘Add to favourites’. Now that was simple!
When it comes to becoming a better trader, it is super beneficial to go back over previous trades to see what you did right or wrong. So for a deeper look into your closed trades in MT4, pop on over to ‘Account History’ in the terminal. Just click on a closed position, drag it on to the chart in which you placed the trade, and presto, you’ll see the entry, target, exit mark data as well as the stop less, etc. This is great to see how you can improve on your market timing, stop losses and profit targets, as well as further refining your setups.
Use a customised template that you’ve created and are sick of always switching to it when you open a new chart? Well, here’s one for you. Set up your template to exactly how you like it, right click and choose ‘Template – Save Template’, and save it as ‘Default’. Now, every time you open a new chart it will automatically have your template as the MetaTrader 4 default.
I personally find it helpful to write notes on charts so that when I’m reviewing my trades I can go back to exactly why I took the trade, emotions, thoughts, things I notice about the market, etc. To do this, head up to the Insert menu and choose ‘Insert Text’ and you can enter whatever you want. And, you can use multiple text boxes.
There you go, I hope these few little not-so-well-known tips and tricks make your MT4 life just a little bit faster and easier.
The US CPI has been slowing down over the past few months. However, it’s likely that this trend will continue into December as well.
Here are market events to look out for this week:
Australia Consumer Price Index (11 January)
The October Consumer Price Index (CPI) in Australia fell below September’s record high of 7.3%.
Analysts expect November’s CPI reading to rebound higher to 7.5%.
US Consumer Price Index M/M (12 January)
The Consumer Price Index in the US rose 0.1% from November 2022, slowing from the 0.4% increase in October. This indicates that annual inflation in the US slowed for a fifth straight month to 7.1% in November 2022, its lowest point since December 2021.
Analysts expect that US CPI might continue to slow down and will be released at -0.1% in December 2022, which means that inflation is slowed more to 6.9%.
UK Gross Domestic Product M/M (13 January)
The economy in the UK grew 0.5% in October from September 2022, the most significant increase in nearly a year.
Analysts predict November’s GDP to be unchanged at 0.0%.
Prelim University of Michigan (UoM) Consumer Sentiment (13 January)
In December 2022, the University of Michigan revised its consumer sentiment index for the US upward to 59.7 in December 2022 from 59.1 in the previous month.
Analysts expect this month’s UoM Consumer sentiment index to be higher at 60.
U.S. equities scored their best trading day of the year throughout last Friday’s trading. The Dow Jones Industrial Average climbed 2.13% to close at 33630.61. The S&P 500 gained 2.28% to close at 3895.08. The tech-heavy Nasdaq composite jumped 2.56% to close at 10569.29. U.S. equities rose after the U.S. nonfarm payrolls and unemployment change data both indicated higher employment during the previous month.
The nonfarm payrolls came in at 223K, while the monthly unemployment change came in at 3.5%. Furthermore, the ISM PMI figure came in below market expectations at 49.6, indicating a slowdown in private-sector purchasing. Market participants assumed that the higher employment and falling private sector purchasing would prompt the Fed to throttle back on interest rate controls, thus equities rallied while treasury yields and the Greenback retreated.
The benchmark U.S. 10-year treasury yield was last seen trading at 3.56%, while the 2-year yield sits at 4.258%.
On the economic docket, Fed chairman Jerome Powell is due to speak during the American trading session on the 10th. The U.S. will release core CPI and initial jobless claims figures on the 12th, and the U.K. will release GDP and manufacturing figures on the 13th.
Main Pairs Movement
The Dollar index, which tracks the U.S. Greenback against a basket of major foreign currencies, slumped 1.18% throughout Friday. Market participants sold the Greenback after the “Fed desired” U.S. economic data released throughout Friday’s American trading session. Retreating U.S. yields acted as a headwind for the falling Dollar.
EURUSD jumped 1.12% throughout Friday’s trading. The Dollar weakness across markets allowed Euro bulls to bid the Euro higher and allowed the pair to reverse a four-day loss.
GBPUSD soared 1.54% throughout Friday’s trading. While there were no major economic data releases from the U.K., the lower-than-expected U.S. PMI data sparked a selloff of the Dollar.
Gold climbed 1.82% throughout Friday’s trading. The Dollar denominated Gold soared after a broad-based selloff of the U.S. Greenback.
Technical Analysis
EURUSD (4-Hour Chart)
The EUR/USD pair advanced higher on Friday, regaining upside traction and recovered towards the 1.0600 mark after the release of the US NFP report. The pair is now trading at 1.0609, posting a 0.85% gain daily. EUR/USD stays in the positive territory amid weaker US dollars across the board, as the US job data weakened the US Dollar even though the labour market remains tight. The US Nonfarm Payrolls rise by 223,000 in December, which came in much higher than the market expectation of 200,000 and exerted bearish pressure on the greenback. The upbeat employment figures caused investors to reassess the Fed’s policy outlook as the CME Group FedWatch Tool’s probability of a 25 basis points Fed rate hike in February declined to 57% from 70% on Wednesday. In the Eurozone, the Eurozone Consumer Price Index (CPI) for December came at 9.2%, which was lower than expected but failed to drag the EUR/USD pair lower amid the renewed US dollar weakness.
For the technical aspect, the RSI indicator is 54 figures as of writing, suggesting the pair could extend its daily gains as the RSI is rising sharply. As for the Bollinger Bands, the price witnessed fresh buying and climbed above the moving average, therefore a continuation of the upside trend can be expected. In conclusion, we think the market will be bullish as the pair is testing the 1.0583 resistance. Euro bulls are now looking at the 1.0624 area which is the next resistance.
Resistance: 1.0583, 1.0624, 1.0710
Support: 1.0508, 1.0467
GBPUSD (4-Hour Chart)
GBP/USD recovers lost territory from Thursday’s losses, reclaims 1.12 on soft USD after US NFP report. US Nonfarm Payrolls rose by 223K, exceeding expectations, and pointing to a solid labour market. The unemployment rate fell to 3.5%, while Average Hourly Earnings fell to 4.6%, compared with expectations for 5%, suggesting that inflation on wages is easing. USD index dropped to around 104, which favours GBPUSD. The pair rose accordingly. At the time of writing, the pair is trading at 1.2071, posting a 1.5% gain daily.
For the technical aspect, the RSI indicator is 60 figures as of writing, rebounding from the oversold zone. The RSI indicator rose sharply, indicating the pair may continue on its upward traction. For the Bolling Bands, the price rose sharply through the average from the lower bound. A continuing upward trend could be expected. For the price action, the pair recover lost territory below a first support level and is now hovering around 1.21 at the time of writing, close to the first resistance level at 1.2110. In conclusion, we think GBPUSD is in bullish mode. Based on the technical analysis, there is a high possibility to break through the first resistance of 1.2110. On the upside, if the price advance above the resistance level at 1.2110 on 4H Chart, it may head to test the next resistance at 1.2233.
Resistance: 1.2110, 1.2233, 1.2335
Support: 1.1927, 1.1765
XAUUSD (4-Hour Chart)
The gold price soared on the solid US NFP data. In the US trading session on Friday, the US Bureau of Labor Statistics revealed that US Nonfarm Payrolls rose by 223K, exceeding expectations. The unemployment rate fell to 3.5%, while Average Hourly Earnings fell to 4.6%, compared with expectations for 5%, suggesting that inflation on wages is easing. Markets reacted to the US economic figures. The US dollar index dropped to around 104, while the US 10-year yield rose from 3.73% to 3.57%. The gold price soared directly from $1,835 to $1,860, refreshing the highest level from last mid-June. At the time of writing, the price is hovering around $1,870.
For the technical aspect, the RSI indicator is 70 figures as of writing, rising from 50. The RSI indicator rose sharply, indicating the pair may continue on its upward traction. For the Bolling Bands, the price goes up along with the upward trading average and is now trading around the upper bound. For the price action, the pair rises sharply and makes a higher high on its pattern, which is a standard pattern for the upward trend. In conclusion, we think the gold price is in a bullish mode based on the technical analysis, and there is a high possibility to continue on its upward trend. That said, the RSI indicator and Bolling Bands both show signs of being overbought. Traders should be aware of the risk of a correction.
U.S. equities continued to fall throughout Thursday’s trading. Equities retreated due to the upside surprise from the ADP nonfarm employment change, which showed that employers added 235,000 jobs in December, and initial jobless claims, indicating 204,000 claims in December. The two red-hot job reports affirmed the Fed’s reservations on the contractual effectiveness of its interest rate hikes. The tight labour market report sparked a rally in treasury yields and the U.S. Greenback.
The Dow Jones Industrial Average dropped 1.02% to close at 32930.08. The S&P 500 lost 1.16% to close at 3808.1. The tech-heavy Nasdaq Composite slumped 1.47% to close at 10305.24. The U.S. 10-year treasury yield was last seen trading at 3.725%.
Equities were dragged down by the downside surprise of earnings results released by Walgreens (NAS: WBA) and Bed, Bath & Beyond (NAS: BBBY). Walgreens, which dropped more than 6% over yesterday’s trading, showed a $5.2 Billion opioid litigation settlement that dragged quarterly earnings. Bed, Bath and Beyond plummeted more than 29% after the company announced cash insufficiency and possible chapter 11 bankruptcy.
Main Pairs Movement
The Dollar Index, which tracks the U.S. Greenback against a basket of other major foreign currencies, rose more than 0.8% throughout yesterday’s trading. The ADP nonfarm payrolls and initial jobless claims, both coming in above market expectations, buoyed the Dollar higher as short-term U.S. interest rate expectations continue to price higher across markets.
EURUSD dropped 0.76% throughout yesterday’s trading. The Euro fared worse against the Dollar as market participants bid up the Greenback due to hotter-than-expected job reports. The construction PMI further indicated price levels remaining at elevated levels.
GBPUSD slumped 1.25% throughout yesterday’s trading. The British Pound weakened against the Dollar due to the broad-based Dollar’s strength. The British construction PMI is scheduled for today’s European trading session.
Gold lost 1.18% throughout yesterday’s trading. The Dollar denominated Gold lost ground as the U.S. Greenback surged across the board.
Technical Analysis
EURUSD (4-Hour Chart)
The EUR/USD pair shows an upside momentum faltered once again around 1.0630 and dropped to daily lows near 1.0529, breaking below the support at 1.0536, EUR/USD is 100 pips down from its Friday close, the spot saw its losses accelerate after the US ADP report showed the US private sector added 235K jobs during December, surpassing initial estimates, besides, weekly Jobless Claims rose less than expected, both shows the good health of the labour market in US. On the Europe side, the Construction PMI improved marginally to 41.7 in December, and the released November Producer Price Index, which rose at an annual pace of 27.1%, retreating from a revised 30.5% gain in October, In the near term, the pair is neutral-to-bearish and lack the conviction to surpass the recent resistance area near 1.0660 for the time being.
For the technical aspect, RSI indicator 14 figures as of writing, it’s suggestion strong buying signals and indicates an oversold or undervalued condition, estimated to be bullish and will rebound from the bottom. As for the Bollinger Bands, the price keeps hovering around the upper bound signalling the upside traction maintained in the near term, and the drop is expected. In the US, the key event is Friday’s release of the US Dec non-farm payrolls and the Eurozone inflation report. On the Europe side, Key events in the euro area this week are the Germany Retail Sales, EMU Flash Inflation Rate, and EMU Retail Sales, which may bring motivation for the EURUSD buyers into the market.
Resistance: 1.0661, 1.0710
Support: 1.0310, 1.0536, 1.0461
GBPUSD (4-Hour Chart)
GBP/USD comes under heavy selling pressure on Thursday amid resurgent USD demand due to the FOMC Meeting Minutes and PMI yesterday and the dollar-positive ADP report released today, this pair continues losing ground through the early North American session and weakens further below the 1.2000 and aiming at the Support at 1.1927. According to the data published by Automatic Data Processing (ADP), the higher-than-expected demand from the US private sector employers provides a strong boost to the US Dollar, which, in turn, exerts downward pressure on the GBP/USD pair, the less hawkish outlook keeps the US Treasury bond yields depressed near a multi-week low, which could act as a headwind for the buck and lend some support to the GBP/USD pair.
For the technical aspect, RSI indicator 14 figures as of writing, it’s a suggestion for strong buying signals and indicates an oversold or undervalued condition, estimated to be bullish and will rebound from the bottom. For the Bolling Bands, it indicates the high volatility of the market. Both signals indicate the investors are interested in buying the market, however, the daily chart has just started gaining negative traction, the GBP/USD pair might then turn vulnerable and go for the 1.1927 mark. In the US, the ADP indicates momentum for the Dollar market, Friday’s release of the US Dec non-farm payrolls and Eurozone inflation report would provide fresh signals. In the UK, the weaker-than-expected UK services PMI added to a softer near-term tone, and more signals are required to define near-term direction.
Resistance: 1.2110, 1.2233, 1.2335
Support: 1.1927, 1.1765
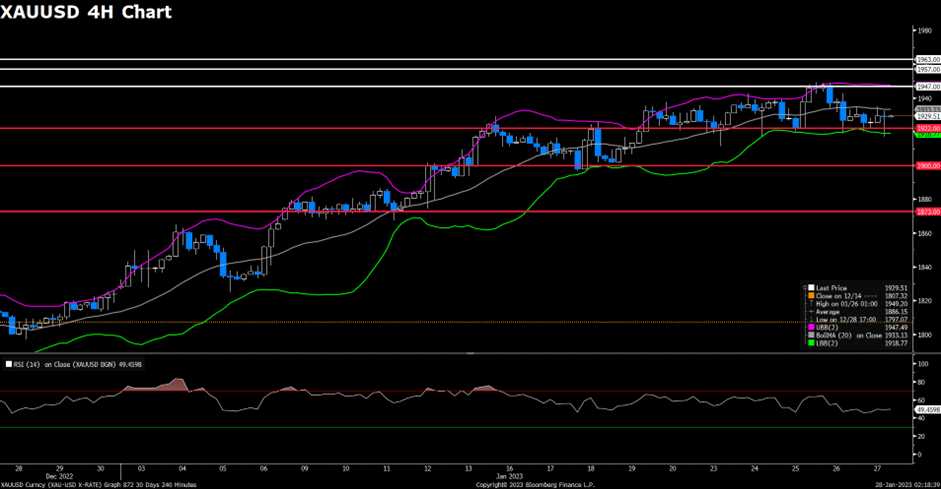
XAUUSD (4-Hour Chart)
Gold price staged a downside correction after a four-day winning streak. Gold price fell more than 1% on Thursday, retreating from the highest level from mid-June, driven by a stronger US dollar and soaring US Treasury yields. The dollar regained strength after US data, before NFP. The ADP employment report showed that private payrolls increased by 235K over the 150K of expectation. Initial Jobless Claims dropped to 204K, the lowest since September. Markets reacted to the US economic figures. The dollar index advanced to 105, the highest level in three weeks while the US 10-year yield rose from 3.70% to 3.77%. The gold price fell directly below $1,850 to $1,831. At the time of writing, the price is hovering around $1,830.
For the technical aspect, RSI indicator 48 figures as of writing, slipping from the overbought zone, suggesting that it may continue on the correction. For the Bollinger Bands, the price dropped through the average as the price stage a strong downside correction in the near term. In conclusion, we think the market is still in bullish mode as the price still rally above the upward trend line. However, the gold price can keep falling modestly as technical analysis shows that the gold price is still under correction. On the downside, if the price drops below the trend line, it may change its current uptrend and head to test the next support at $1,775.
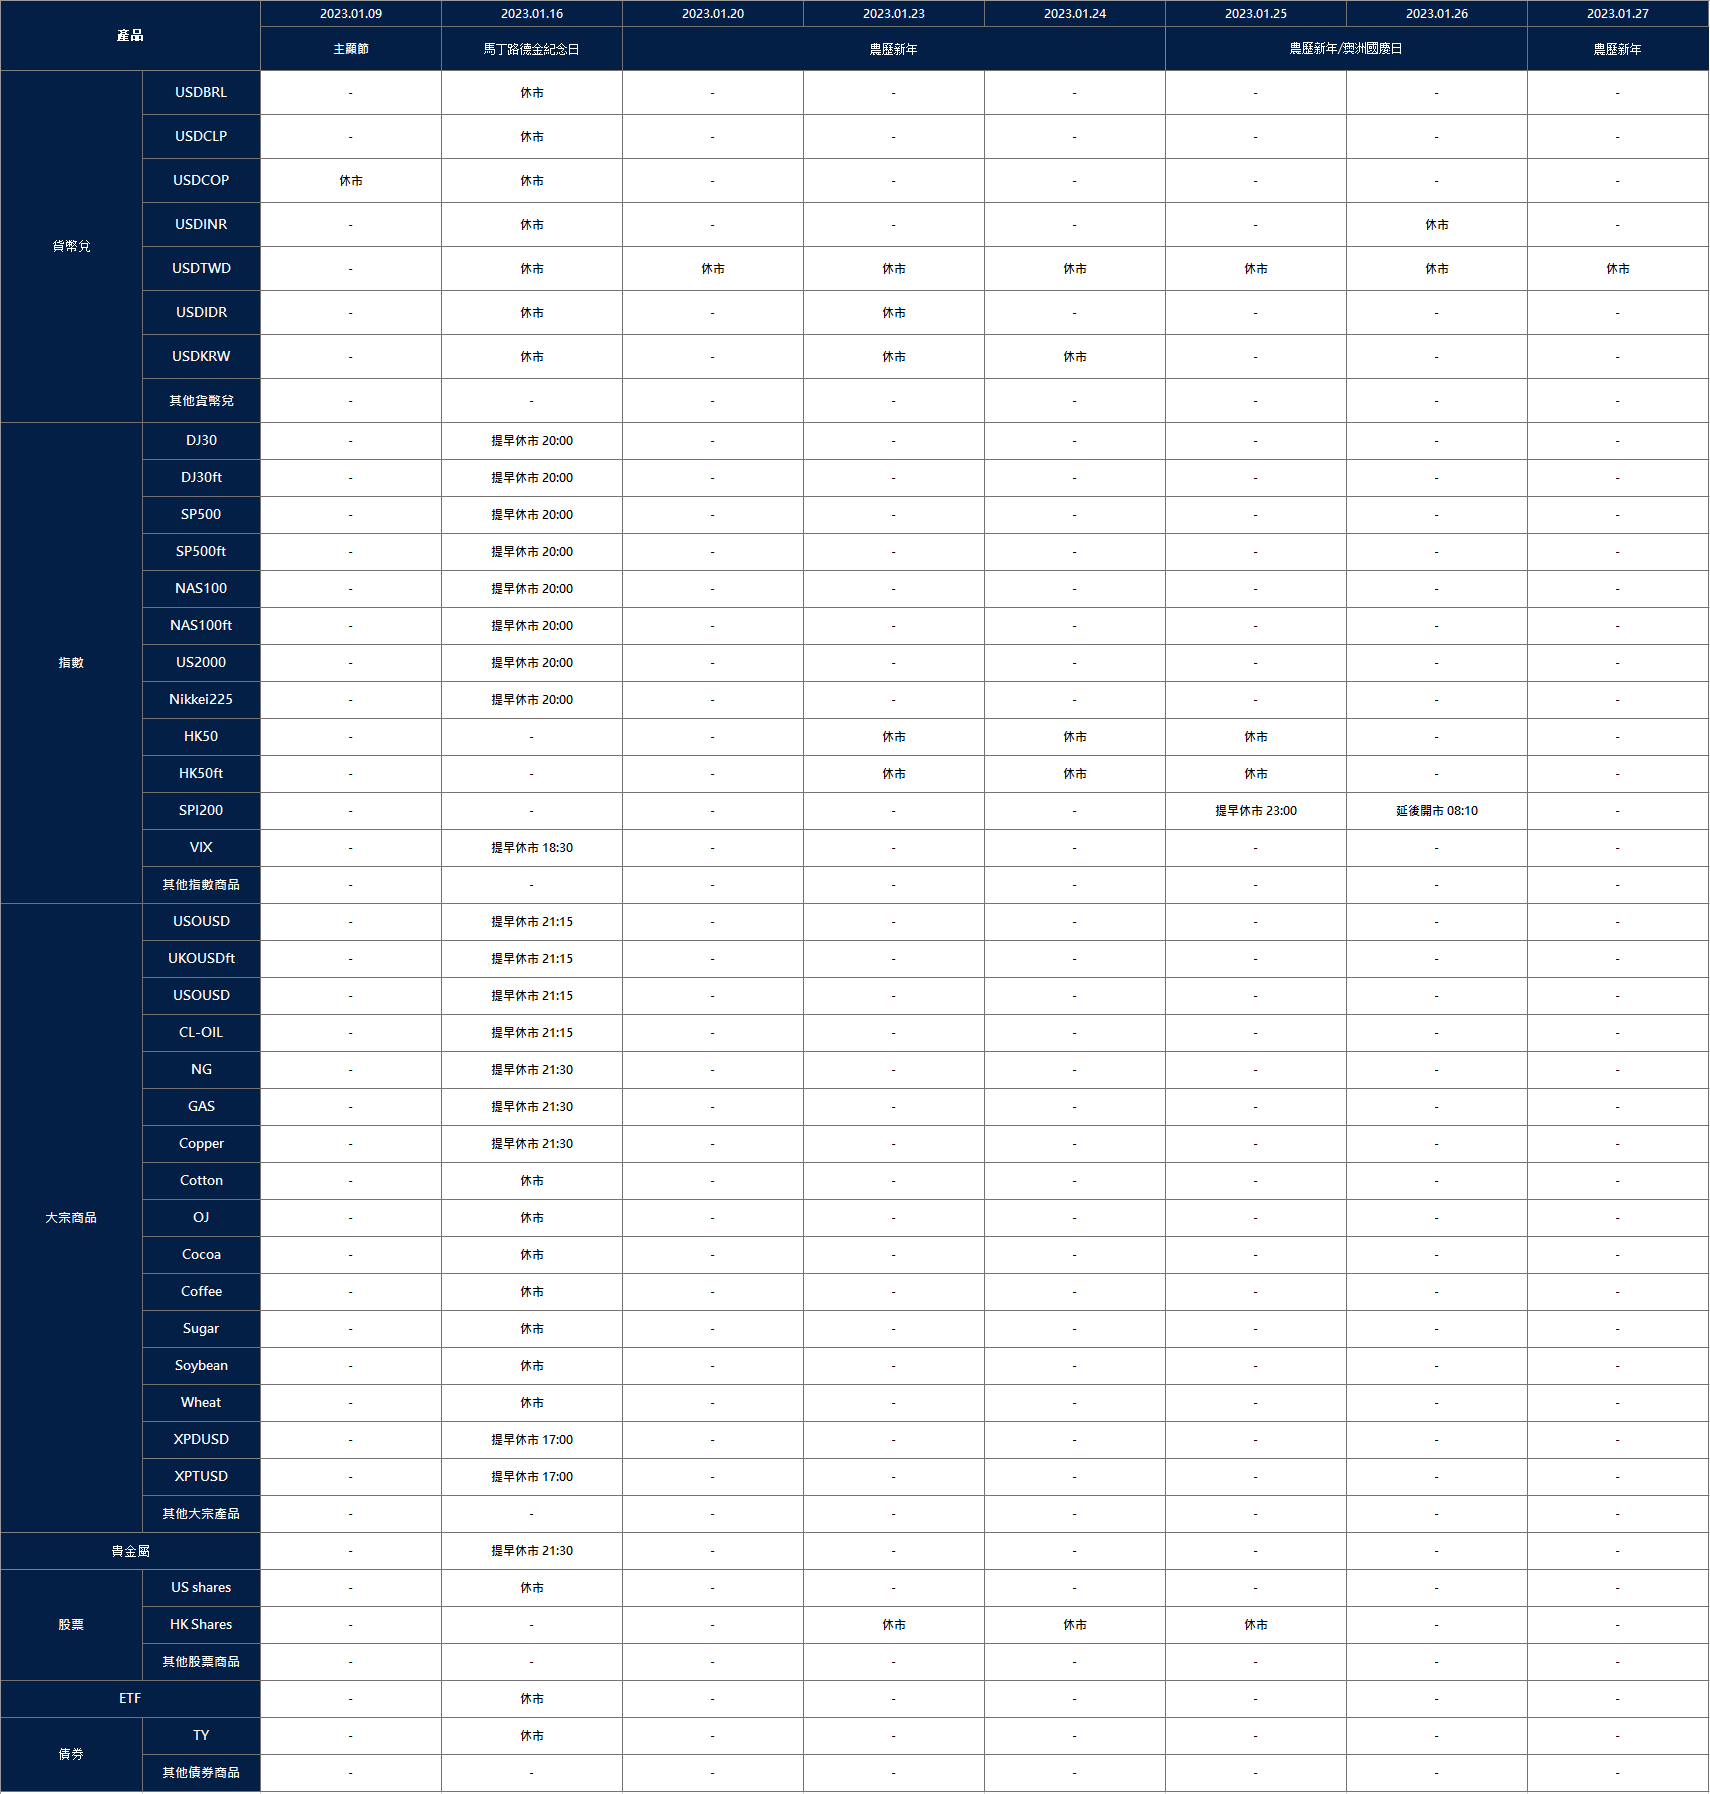
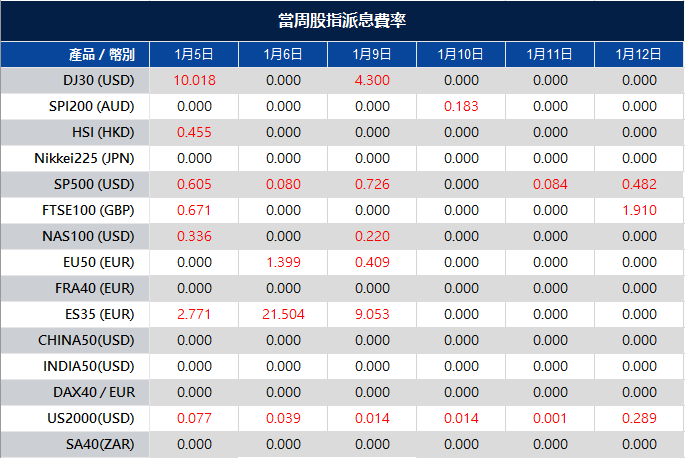
Please note that when constituent stocks of a market index generate dividends, VT Markets will make dividends and deductions for clients who hold the products after the close of the day before the ex-dividend date.
The dividends will not be paid/charged as an inclusion along with Swap. It will be executed separately in your account and the record will be annotated as “Div & Product Name & Net Volume”.
Please note the specific adjustments as follows:
The above data is for reference only, please refer to the MT4/MT5 software for specific data.
If you’d like more information, please don’t hesitate to contact [email protected].
The FOMC minutes reaffirmed multiple things that Chairman Jerome Powell attempted to communicate to market participants during his previous speech in December of 2022. The minutes reiterated the central bank’s determination to bring the inflation level down to the targeted 2%; furthermore, citing previous experiences with pre-mature rate cuts, the minutes dismissed any notions of a rate cut in 2023, even though the Fed has slowed its pace in December. Most importantly, the minutes indicated that the Fed would not cease hiking rates until the central bank sees ample evidence of inflation on a steady and convincing downward trajectory towards 2%.
U.S. equity markets experienced a turbulent trading session as major economic data releases peppered yesterday’s American trading session. All three major equity indices closed higher by the bell. The Dow Jones Industrial Average gained 0.4% to close at 33269.77. The S&P 500 climbed 0.75% to close at 3852.97. The tech-heavy Nasdaq Composite climbed 0.69% to close at 10458.76.
The JOLTs job openings for November came in at 10.458M positions, despite being lower than last month’s print, this figure exceeded market expectations of 10M. The BLS report continues to show that the labour market remains tight, while the labour participation rate has continued to decrease. The job data release foreshadowed the hawkish FOMC minutes, which were released during the latter part of the American trading session.
Main Pairs Movement
The Dollar Index went through a slight fluctuation trading day as the market news was released with US JOLTs JOB Openings (Nov.) & FOMC Meeting Minutes. The DXY sets back around 0.4% after the previous day’s hiking by over 1.10%. The price bounces off lows and regians 104.0 ahead of FOMC’s meeting minutes. The US Dollar was little changed with the news, although US short-term interest-rate futures dropped.
EURUSD struggled to retain 1.0600 after the FOMC meeting minutes release. EUR/USD has lost its bullish momentum and pierced the 1.0600 thresholds following hawkish FOMC Meeting Minutes and tepid US data weighing on the market’s optimism. Bulls, however, are not yet done.
Cable gains 0.64% throughout Tuesday’s trading. A little changed every week. The negative real GDP of the UK recession undermind demand for the Pound.
Gold continues its bull momentum, raised 0.8% throughout Tuesday’s trading, with yields dropping post-FOMC minutes.
Technical Analysis
EURUSD (4-Hour Chart)
The EUR/USD pair advanced higher on Wednesday, regaining some upside momentum and displayed back-and-forth moves around the 1.0600 mark amid an upbeat market sentiment ahead of FOMC minutes. The pair is now trading at 1.0611, posting a 0.61% gain daily. EUR/USD stays in the positive territory amid weaker US dollars across the board, as the sharp decline witnessed in government bond yields undermined the greenback and helped the EUR/USD pair to find strength. China’s planning to support the property market and the relaxation of its Covid zero-tolerance policy both provided support to the market mood. On the economic data front, the US ISM Manufacturing PMI declined modestly in December to 48.4, which came in below the market expectation of 48.5. The main spotlight would be the release of the FOMC December meeting minutes. In the Eurozone, the Eurozone Services PMI was confirmed at 49.8, indicating that price pressures remained elevated but retreated further from their recent peaks. The encouraging news also provided mild support to the EUR/USD pair.
For the technical aspect, RSI indicator 46 figures as of writing, suggesting the lack of directions for the pair as the RSI remains flat around the mid-line. As for the Bollinger Bands, the price failed to preserve its upside traction and retreated lower, therefore a downside movement can be expected. In conclusion, we think the market will be slightly bearish as the pair might head to test the 1.0580 support line. Technical indicators also remain within negative levels after correcting oversold conditions.
Resistance: 1.0661, 1.0710
Support: 1.0580, 1.0546, 1.0467
GBPUSD (4-Hour Chart)
GBP/USD climb back to 1.2088 after the decline on Tuesday, GBP/USD has regained its traction which erased the losses, however, the ISM will release the December Manufacturing PMI report. The headline PMI is forecast to decline to 48.5 from 49 in December. Market participants will also pay close attention to the Prices Paid component of the survey, which will offer fresh insight into input inflation in the manufacturing sector, the US Dollar could continue to weaken against its major rivals. On the other hand, an unexpected rebound above 50 in the headline PMI and an increase in the inflation component should have the opposite effect on the currency’s valuation and weigh on GBP/USD.
For the technical aspect, the RSI indicator is 55 figures as of writing, though it’s a mediocre indicator, however, the climbing RSI and Bollinger Bands show a bounce back, which suggests the bullish market and points to a renewed buyer’s interest. In the US, the lower-than-expected Manufacturing PMI could temporarily boost US Dollar, and investors are focusing on the release of the FOMC Meeting Minutes. In the UK, the falling appetite for corporate debt is raising red flags for economic prospects, and the expensive credit also resists the growth of the UK economy.
Resistance: 1.2095, 1.2215, 1.2337
Support: 1.1936, 1.1765
XAUUSD (4-Hour Chart)
Gold prices hit seven-month highs above $1,860 in the mid-European session as the US Treasury yields decline and the US dollar weakens on the risk-on mood. On the other hand, an upbeat market mood spurred by China’s news support gold prices. Chinese authorities planning to deliver additional support to property developers aimed to relax liquidity stress in some developers. Market participants now focus on the release of the Federal Open Market Committee (FOMC) December meeting minutes. The FOMC minutes will provide an explanation of December’s monetary policy decision and cues of future monetary policy action, which will directly influence the financial market.
For the technical aspect, RSI indicator 79 figures as of writing, suggesting strong momentum in the near term. On the other hand, the pair could stage some downside correction as the RSI is in the overbought zone. For the Bollinger Bands, the price keeps hovering around the upper bound signalling the upside traction maintained in the near term. In conclusion, we think the market is still in bullish mode as long as the price keeps rallying above the upward trend line. However, the gold price can stage a correction as technical analysis show that the gold price is at a short-term high. On the downside, if a price drops below the trend line, it may change its current uptrend and head to test the next support at $1,775.
The market started the year 2023 in a safety mode, creating demand for US Dollars and Gold as safe-haven instruments while waiting for this week’s US key economic data and events.
The dollar advances, the yen stabilizes and the oil price drops sharply. US shares market falls lead to Asia stocks facing muted opening. The yield on 10-Year Treasuries falls by most in more than a month. \
US’s four most representative benchmark indexes DJIA, S&P500, NASDAQ and SOX were all close lower. Shares in Asia faced a muted opening Wednesday after a decline in US stocks and the price of oil signalled unease about the dimming outlook for the global economy. Treasuries and the dollar rallied, and the yen stabilized after a Tuesday jump. Equity futures for Japan, Australia, and Hong Kong each rose less than 1%. The 10-year Treasury yield fell 14 basis points to 3.74%, the biggest decline in more than a month. An index of the dollar rallied by the most in two weeks.
The S&P 500 ended Tuesday 0.4% lower, weighed down by energy and tech stocks. Among all eleven sectors in S&P500, Comm SVC, Financials Index, Real Estate Index, Industrials Index, and Utilities Indes gain positive price returns. As for the Energy Index field, dropped by 3.62% on a daily loss.
Main Pairs Movement
The Dollar index, which tracks the U.S. Greenback against a basket of other major foreign currencies, surged more than 1% throughout Tuesday’s trading. The first official U.S. trading day witnessed a broad-based sell-off in the equities market, while market participants bid up the U.S. currency. Despite the surge in Dollar value, the U.S. 10-year treasury yield remained subdued over yesterday’s trading. The benchmark yield currently sits at 3.759% and the U.S. 2-year treasury yield sits at 4.382%.
EURUSD traded 1.11% lower throughout Tuesday’s trading. Risk-averse sentiment across markets helped buoy the Dollar against the Euro.
Cable lost 0.64% throughout Tuesday’s trading. The British Pound fared worse against the Dollar as market participants flighted to safety.
The Dollar denominated Gold rose 0.87% throughout Tuesday’s trading. The precious metal gained ground as market participants started the new year with caution in mind.
Technical Analysis
EURUSD (4-Hour Chart)
The EUR/USD pair declined sharply on Tuesday, witnessing heavy bearish pressure and has managed to erase a small portion of its daily losses near the 1.0560 mark amid the resurgent US Dollar demand. The pair is now trading at 1.0543, posting a 1.14% loss daily. EUR/USD stays in the negative territory amid a stronger US Dollar across the board, as the greenback started the day on a firm footing and advanced above 140.70 with investors returning from the New Year holiday. On the economic data front, the S&P Global Manufacturing Index from the US came at 46.2 in December, which is unchanged from the flash reading. Meanwhile, the Federal Reserve will publish the minutes of the latest FOMC meeting on Wednesday, which will be crucial for the EUR/USD traders to watch. In the Eurozone, the Consumer Price Index (CPI) from Germany revealed that inflation declined to 8.6% every year in December and came in below the market expectation of 9%. The reading made it difficult for the Euro to gather recovery momentum today.
For the technical aspect, RSI indicator 28 figures as of writing, suggesting that the pair could experience a directional change in the near term as the RSI is in an oversold zone. As for the Bollinger Bands, the price witnessed heavy selling and dropped out of the lower band, therefore the downside traction should persist. In conclusion, we think the market will be bearish as long as the 1.0583 resistance line holds. On the downside, a break below the 1.0512 support could favour the bears.
Resistance: 1.0583, 1.0710
Support: 1.0512, 1.0467, 1.0315
GBPUSD (4-Hour Chart)
GBP/USD dropped to fresh multi-week lows near 1.1900 on Tuesday. Despite the absence of a fundamental factor, the US dollar outperforms other pairs as investors return from the new year holiday. GBP/USD, therefore, came under heavy bearish pressure. In the Meanwhile, political jitters in the UK seem to weigh on the Pound. The Telegraph reported over the weekend that British Prime Minister Rishi Sunak had shelved the childcare reform that was designed to help parents save money and get back to work. In addition, the first of five consecutive days of national rail strikes have begun on Tuesday.
For the technical aspect, the RSI indicator is 40 figures as of writing, suggesting the bearish traction will remain in the near-term technical outlook as the RSI stays below the mid-line. As for the Bollinger Bands, the price dropped below the average and now hovering around the lower bound, signalling some downside momentum. In conclusion, we think the market is still in bearish mode. If the price close negative below the current support at 1.1942 on the 4H chart. It may head to test the next support at 1.1765. For more price action, eye on tier 1 economic figures. In the US, the economic calendar remains busy with the release of the FOMC Meeting Minutes, as well as the ISM Manufacturing PMI Index for December. In the UK, Mortgage Approvals and Lending would be revealed.
Resistance: 1.2095, 1.2212, 1.2334
Support: 1.1942, 1.1765
XAUUSD (4-Hour Chart)
Gold prices were volatile on Tuesday after returning to normal trading activity. Earlier XAU/USD soared to $1,849.96, a multi-month high, and then started to decline as the dollar regather its strength in the mid-European trading session. At the time of writing, the gold price held around $1,830. That said, the pullback in gold price seems limited, as the US treasury yields fall modestly, which favours non-yielding gold. Gold traders now await the release of the FOMC Meeting Minutes, as well as the ISM Manufacturing PMI Index for December, which may provide cues for future monetary policy.
For the technical aspect, RSI indicator 71 figures as of writing, suggesting strong momentum in the near term. On the other hand, the pair could stage some downside correction as the RSI is in the overbought zone. For the Bollinger Bands, the price slightly pulls back after touching the upper bound signalling the lack of further momentum. In conclusion, we think the market is still in bullish mode as long as the price keeps rallying above the upward trend line. However, the gold price can stage correction as technical analysis shows price pressure. On the downside, if a price drops below the trend line, it may change its current uptrend and head to test the next support at $1,775.