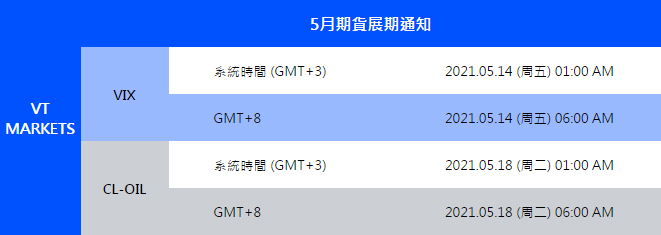
VT Markets May. futures rollover announcement

Dear Client,

New contracts will automatically rolled-over as follow.

Please note:

• The rollover will be automatic, and any existing open positions will remain open.

• Positions that are open on the expiration date will be adjusted via a rollover charge or credit to reflect the price difference between the expiring and new contracts.

• To avoid CFD rollovers, clients can choose to close any open CFD positions prior to the expiration date.

• Clients should ensure that take profits and stop losses are adjusted before this rollover occurs.

If you have any questions, our team will be happy to answer your questions.Please mail to [email protected] or contact the service online.

Daily Market Analysis

Market Focus

Stocks climbed to a record after surprisingly weak jobs data eased fears about higher inflation and a cutback in stimulus. The dollar slumped, while Treasuries were little changed.

All major groups in the S&P 500 rose, with energy, real-estate and industrial shares leading the charge. Earlier in the day, technology led equity gains as softer economic data drove investors into the perceived safety of pandemic darlings – mega caps flush with cash and stay-at-home stocks. A gauge of giant growth companies such as Apple Inc. and Amazon.com Inc. pared most of its advance.

The long-awaited employment data rattled markets, with payrolls up only 266,000 in April, trailing the projected 1 million surges. For several analysts, the figures may give a boost to President Joe Biden’s $6 trillion economic agenda and another reason for the Federal Reserve to keep its accommodative stance. Treasury Secretary Janet Yellen said the report “underscores the long-haul climb back to recovery,” while retaining her expectation of a return to full employment next year.

Federal Reserve Bank of Minneapolis President Neel Kashkari told Bloomberg Television he has “zero sympathy” for critics on Wall Street, who slam the central bank’s aggressive support of the U.S. economy while millions of Americans remain out of work.

“We need to rebuild this labor market and put them back to work. Then there will be plenty of time to normalize monetary policy,” he said.


Main Pairs Movement:

A gauge of the dollar slumped to a 10-week low after U.S. job growth missed all estimates and as stocks rose on easing inflation concerns. The euro advanced to the highest in more than two months amid short-covering.

Dollar Spot Index slid as much as 0.665%, the most since December, after data showed the U.S. unemployment rate edged up to 6.1% and payrolls increased by just 266,000 after a downwardly revised 770,000 March increase, well short of projections. The dollar also came under pressure as offshore yuan posts its biggest advance in four months.

The euro climbs as much as 0.8% to $1.2165 amid short-covering and after ECB governing council member Martins Kazaks said that a June decision to slow down bond-buying is possible if the economy doesn’t deteriorate. EUR/USD implieds are higher across the curve with 1-year climbing to as high as 6.4350, highest level since March 24.

On the week, commodity currencies led gains against the dollar, as prices of raw materials continued to soar. GBP/USD gained as much as 0.8% to 1.4, falling just short of the 1.4009 level last seen on April 20. USD/JPY was down 0.4% to 108.71 after earlier sliding as much as 0.7% to 108.34, the lowest since April 27.


Technical Analysis:

EURUSD (4 hour Chart)


Euro fiber extended it yesterday upward momentum to approached 2-month high on 1.216 level after U.S. unveiled an extremely disappointed NFP data that miss 1 million job gain versus 266 K actually, trading at 1.2164 as of writing. For technical aspect, RSI indicator shows 76 figures, suggesting a over bought sentiment at least for short term. On average price view, 15-long SMA accelerating it ascending slope and 60-long SMA turned it slope to teeny-tiny upside in day market.

We foresee market it pretty optimistic for gain traction as it edged higher than last peak. Meanwile, market seems try toward to next psychological level at 1.22. Therefore, we expect the first immediately downside support level will be the peak of last time at 1.2151 and 1.2106 following.

Resistance: 1.22

Support: 1.207, 1.2105, 1.215


XAUUSD (4 Hour Chart)

Gold consecutive it bull movement once breached to 3 months peak at 1843 and had a correction for it gain traction after market digest the poor US NFP data, trading at 1832. Meantime, U.S. 10 years Treasuries yield have fallen to 1.5% stage which is testing the neckline of 2-month-long double top pattern. For RSI side, indicator shows 73 figures which show market is experiencing a torrid sentiment. On the other hands, 15 and 60-long SMAs indicator are accelerating it upward slope.

At current stage, it seems market pricing for bullish trade while gold market without any cap pressure. However, we verdict that soared up rapidly in short term market could motivate take profit momentum. Therefore, for bull favour, first immediately downside support at 1812.8 and pyschological level at 1800 will be follow. On up way, we expect there has another take profit level on 1850.

Resistance: 1850  

Support: 1812.8, 1800, 1760


USDCAD (Daily Chart)

Loonie had a fluctuate movement in the day market and toward to another day to day low level, trading at 1.2137 as of writing, while market reacted mix for upsetting US job data and Canada’s unemployment rate also miss the 7.8% expecation that figure show 8.1% of actual. Meantime, WTI crude turn negative territory to positive area after U.S. session and copper was edging up to record-setting level. For RSI side, indicator shows 22 figures which shows market is on an over bought sentiment in recently. For moving average side, 15 and 60-long SMAs indicator are remaining it descending movement.

Overall, we foresee market will continue it downside movement as bearish momentum is still on favor traction. On slid way, we expect sell position will incent strong take profit on psychological level at 1.21.

Resistance: 1.2264, 1.238, 1.2491

Support: 1.21


Economic Data

Currency

Data

Time (GMT + 8)

Forecast

AUD

Retail Sales (MoM)(Mar)

09:30

1.4%

VT Markets Notification of Server Upgrade

Dear Client,

As part of our commitment to providing the best reliability and service to our customers, we are planning an upgrade in our server on May 08th 2021.

As a result, we will be conduct maintenance according to the schedule below.
Start date and time: 2021-05-08 18:00 GMT+3(Server time)
End date and time: 2021-05-08 21:00 GMT+3(Server time)

The impact can only make customers be unable to log in to the MT4 /MT5 software temporarily, and that won’t affect any order which has been opened.

After the upgrade, clients can login to MT4/ MT5 software using the server which is shown in the account activation mail.

No action is required by our customers. Your services will come back online at the end of the maintenance.

Thank you for your patience and understanding with regard to this important initiative.

If you have any questions, our team will be happy to answer your questions.Please mail to [email protected] or contact the service online.

Daily Market Risk

Market Focus

Stocks climbed as data showing the world’s largest economy is strengthening overshadowed inflation worries, with investors awaiting Friday’s jobs report. The dollar retreated.

The S&P 500 closed near session highs, while the Dow Jones Industrial Average rose to a record. China’s shares traded in New York briefly extended losses after Bloomberg News reported the Biden administration is likely to preserve limits on U.S. investments in certain companies from the Asian nation. In late trading, Beyond Meat Inc. slumped as the maker of plant-based protein products reported disappointing sales, and Peloton Interactive Inc. whipsawed as investors assessed its results.

Applications for U.S. state unemployment insurance fell last week to a fresh pandemic low as labor-market conditions continued to improve and the economy reopened more broadly. Separate data highlighted a rebound in productivity in the first quarter as the pace of output exceeded a pickup in hours worked. Economists predict the upcoming employment report will show the U.S. added about 1 million jobs in April.


Main Pairs Movement:

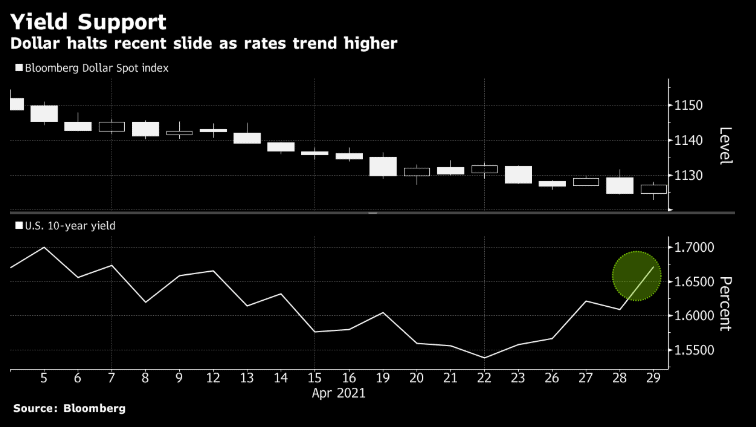
The greenback weakened versus most Group-of-10 currency peers as U.S. 10-year yields remained steady ahead of data Friday forecast to show employment growth in America soared. The Canadian dollar climbed to the highest since 2017 as metals helped to boost an index of commodities to a fresh 2015 high. Ten-year U.S. yields little changed at ~1.56%; NFP forecast for gain of 1m.

USD/CAD -0.7% to 1.2184; touched 1.2181, lowest since Sep. 18, 2017; higher gold, silver helped to buoy loonie. Options in loonie remain active amid call interest. Overnight volatility in USD/CAD hit ~9.77%, highest since early January on a closing basis, ahead of the nation’s employment data, also scheduled for Friday, that is expected to show loss of about 150k jobs in the month.

GBP/USD down 0.1% to 1.3891; BOE slowed its emergency bond-buying and signaled it’s on course to end that crisis support later this year. EUR/USD +0.5% to 1.2060; poised for the first gain in three sessions; shared currency supported by cross-related buying and interest in short-dated euro calls.


Technical Analysis:

EURUSD (4 hour Chart)


Euro fiber retreated yesterday loomy amid fueled by macroeconomic data from the E.U and U.S. which boosted risk sentiment, helped euor dollat to advance, currently trading at 1.206 that wipe out yesterday fail. For futher eco-data driven, euro holding a bull expectation to an extension ahead of NFP. For technical aspect, RSI indicator shows 58 figures, suggesting a bullish momentum at least for short term. On average price view, 15-long SMA turned ascending slope and 60-long SMA turned it slope to teeny-tiny upside in day market.

We foresee market will continue whipsaw or choppy in a range between first support and resistance or even continue day gain traction further. On up way, if position breakthrough 1.207 level, we eye on next couple resistance of upside. Of course, the first immediately is on 1.199-1.2 around and 1.192 following.

Resistance: 1.207, 1.2105, 1.215

Support: 1.199, 1.19


XAUUSD (4 Hour Chart)

Gold rallied to 2-month-long peak as seems bearish momentum had a correction to test short position. Gold once ramp of to daily high at 1816 level then slightly resume position to nearly market close, trading at 1814.7. For RSI side, indicator shows 72.5 figures which suggest over bought sentiment base on 4 hour interval. On the other hands, 15 and 60-long SMAs indicator are shifting it sluggish movement to acending momentum.

At current stage, it seems market pricing for bullish trade while gold market without any cap pressure. However, we verdict that soared up rapidly in short term market could motivate take profit momentum. Therefore, for bull favour, first immediately downside support at 1812.8 and pyschological level at 1800 will be follow.

Support: 1812.8, 1800, 1760


USDCAD (Daily Chart)

Loonie gain a downside victory intraday as it sucessively extended bearish momentum in recently amid spectacular economic data trigger the risk-on mode to commodities-linked currencies, trading at 1.2158 which record-setting low in nearly 3 year. Meanwhile, an exceptional decrease in U.S. oil inventories didn’t pump up the price which holding beneath 65 level where comfort at 64.88 as of writing. However, pan-indistrial metal is constantly in gain traction. For RSI side, indicator shows 16 figures which represent market is on an over bought sentiment.

Overall, we foresee market will continue it downside movement as bearish momentum is still on favor traction. On slid way, we expect sell position will incent strong take profit on psychological level at 1.21.

Resistance: 1.2264, 1.238, 1.2491

Support: 1.21


Economic Data

Currency

Data

Time (GMT + 8)

Forecast

GBP

Construction PMI (Apr)

16:30

62.3

USD

Nonfarm Payrolls (Apr)

20:30

978 K

USD

Unemployment Rate (Apr)

20:30

5.8%

CAD

Employment Change (Apr)

20:30

-175 K

CAD

Ivey PMI (Apr)

22:00

60.5

Daily Market Analysis

Market Focus

Stocks almost wiped out their gains as technology shares turned lower, offsetting optimism over solid corporate earnings and economic reports. Treasuries climbed.

The S&P 500 notched an advance of less than 0.1% while the Nasdaq 100 ended in the red. The Dow Jones Industrial Average rose to a fresh record. Moderna and Johnson & Johnson retreated, while Pfizer finished little changed on news the U.S. will support a proposal to waive intellectual-property protections for Covid-19 shots. Peloton tumbled after recalling its treadmill products. Copper and lumber rallied, adding to inflation worries.

As the world’s largest economy rebounds, an intense debate has emerged over whether actual price pressures are set to materialize. The five-year breakeven rate — a proxy for the annual inflation rate bond traders expect over the span — jumped to the highest since 2008. Despite the increase in commodity prices and supply shortages, several Fed officials said Wednesday that inflation is unlikely to get out of control.


Main Pairs Movement:

The New Zealand and Australian dollars outperformed Group-of-10 currency peers Wednesday as copper surged and a key gauge of commodities rose to the highest since 2015. The dollar was steady, while volatility in the pound hit the highest since March ahead of a Bank of England policy decision due Thursday.

Among G-10 peers, Kiwi led with gains of 0.9%; the Aussie and loonie rounded out the top three, with the latter jumping to the highest since 2018 before paring gains as oil dropped; the Norwegian krone lagged all. Rising commodities are contributing to more bullish sentiment on inflation, with the 5-year breakeven rate hitting the highest since 2008.

GBP/USD rises 0.2% to 1.3908; pared gains after rising as much as 0.3%. One-week volatility in the pound rose to 8.32 vols, highest since late March; Scottish independence vote also fueling higher vols. Elsewhere, gold was struggling in the day and set it below 1790 level, spiral in an accommodative choppy scope between 1764.5 to 1795.


Technical Analysis:

EURUSD (4 hour Chart)


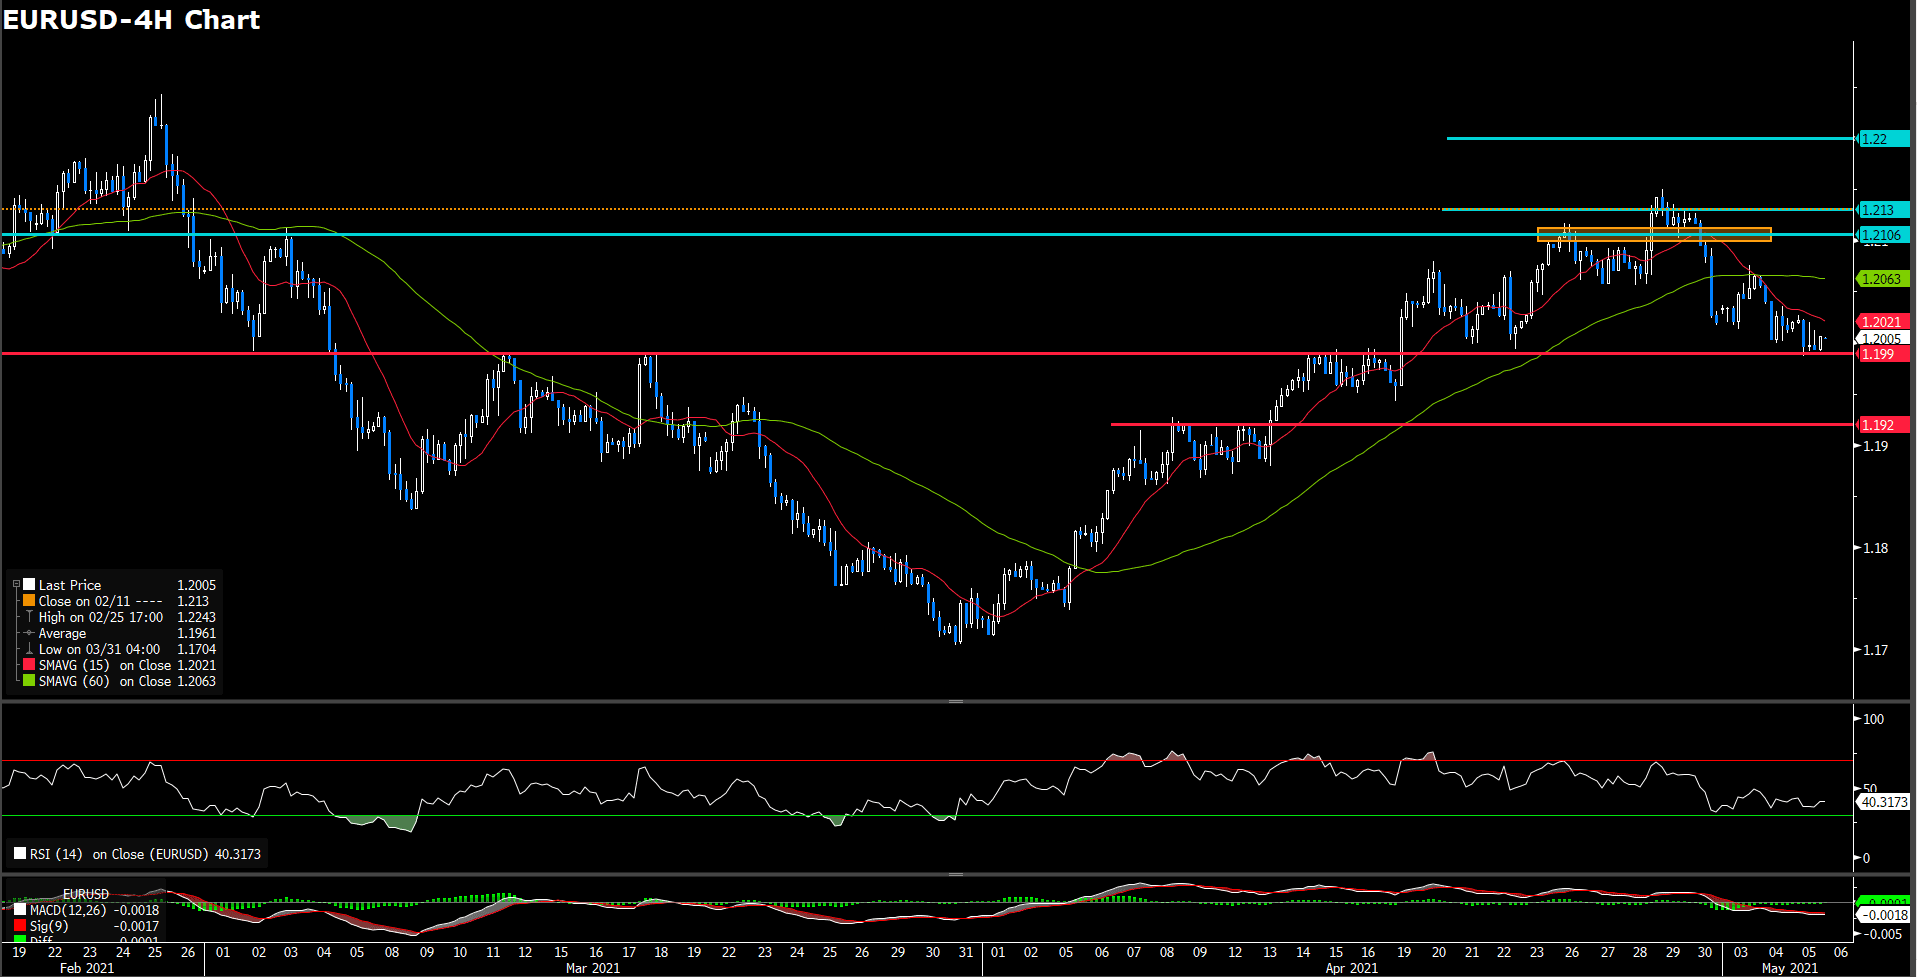
Euro dollar remains on lost traction to close the consecutive 2 day in negative, trading at 1.2003 around. The pair once dropped to its lowest level in more than two weeks at 1.1986 in the European session and seems found a support at 1.19~1.2 level. All of all, recently, the U.S. market continues to drive euro fiber movements while Europe lack of significant news catalyst. For technical aspect, RSI indicator shows 40 figures, suggesting a bearish momentum at least for short term. On average price view, 15-long SMA is maintaining a negative slope and 60-long SMA turned it slope to teeny-tiny downside intraday market.

We foresee market will continue whipsaw or choppy in a range between first support and resistance as it tamp down from 1.213 which was a top pattern in recently. On slid side, we see 1.199 to 1.2 has a strong support level which form by multi-month-long price cluster area where also a neckline for last bottom pattern. If market extend it downside traction, next support will eyes on 1.19-1.192 around.

Resistance: 1.2105, 1.213, 1.22

Support: 1.199, 1.19


USDJPY (4 Hour Chart)

Japan yen fell toward to psychological level at 109 stage after it fail to keep upward momentum above 109.45 that left the door open to a retreat when materialized amid a decline across the board of U.S. dollar. During the American session, it printed a fresh daily low at 109.13. As of writing, it trading at 109.198. For RSI side, indicator shows 52 figures which suggest neutral market sentiment. On the other hands, 15 and 60-long SMAs indicator are retaining it ascending movement notwithstanding 15-long one seems to lose accelerating traction.

We expect 109 still be a powerful support level as yen has successfully denfended in recent days. If yen could consecutive stand above first support level, we believe it could been deemed as a bull movement ahead. For upward favour, 109 level is immediately need to be defend naturally and 108.37 following. Its worth nothing that there has a downside resistance form above current stage as the yellow line. If yen could breakthrough the downside resistance, we see bullish momentum is upcoming.

Resistance: 110.412

Support: 109, 108.37, 107.936


USDCAD (Daily Chart)

Loonie resumed it downward traction and dropped below 1.2265 level which once slipped to a three-year-low at 1.225 level, trading at 1.22679 as of writing. The slide in loonie took place while broad-base U.S. dollar decline, amid risk appetite and lower U.S. yields following mixed U.S. data. For RSI side, indicator shows 34 figures which suggest a bearish momentum ahead for short term. On averaging price perspective, 15-long SMA indicator turn it slope to downward movement while 60-long SMA indicator remaining it descending slope.

Sum up above, we expect market will sourround in consolidation between 1.2269 to 1.238 as market seems misdirection with blurred price momentum. Albeit, if market doesn’t stand above the first resistance at 1.238 level, we believe it remain bearish momentum for long term.

Resistance: 1.238, 1.246, 1.2491

Support: 1.225


Economic Data

Currency

Data

Time (GMT + 8)

Forecast

GBP

Composite PMI (Apr)

16:30

60

GBP

Services PMI (Apr)

16:30

60.1

GBP

BoE Interest Rate Decision (May)

19:00

0.1%

USD

Initial Jobless Claims

20:30

540 K

Daily Market Analysis

Market Focus

Volatility gripped financial markets as a rout in some of the largest tech companies dragged down stocks. The dollar rose.

Mega cap such Apple Inc., Tesla Inc. and Amazon.com Inc. sent the Nasdaq 100 slumping, while the S&P 500 pared losses amid gains in commodity, financial and industrial shares. Treasury Secretary Janet Yellen rattled markets with a comment economist regarded as self-evident — that rates will likely rise as government spending ramps up and the economy responds with faster growth. Later in the day, Yellen said she wasn’t predicting or recommending rate hikes.

The debate on whether government spending could boost inflation comes at a time when stock valuations are hovering near the highest levels in two decades. Hedge funds have been bailing from equities at a pace not seen since the financial crisis, while shares have struggled to gain traction despite blowout corporate earnings.

Earlier Tuesday, a sharp drop in equity futures left traders scrambling for an explanation. Some of them speculated on military tensions between China and Taiwan, Singapore’s tougher coronavirus restrictions and Ferrari NV’s decision to postpone financial targets.

Investors also monitored the latest economic readings, with the U.S. trade deficit widening to a new record in March. Meanwhile, a senior White House economic aid demurred on the question of whether President Joe Biden will nominate Fed Chair Jerome Powell for a second four-year term, saying the decision on selecting the next central bank chief will come after a thorough “process.”

Treasury Secretary Janet Yellen said spending may spur modest rate hikes


Main Pairs Movement:

The U.S. dollar extended gains to the highest in two weeks and outperformed all of its Group-of-10 currency peers as Treasury Secretary Janet Yellen said interest rates may have to rise “somewhat” to prevent the economy from overheating. Stocks slipped amid a risk-off bias in the broader markets, while the New Zealand and Australian dollars led losses among counterparts.

EUR/USD -0.4% to 1.2017; euro crossed below $1.20 for the first time since April 22. Shared currency weighed down by EUR/JPY and option-related selling; one-month risk reversals least bullish in nearly a month and nearing par.

AUD/USD -0.8% to 0.7702; fell as much as 1.13%, the most since March 23. Fell below the 100-DMA of 0.7707. NZD/USD -0.9% to 0.7138; dropped as much as 1.2% to 0.7116, the lowest since April 14.

USD/JPY +0.2% to 109.27; earlier rose as much as 0.4%. USD/JPY 3-month implied vol touched a session high of 6.0725% after Yellen’s comments on rates.


Technical Analysis:

EURUSD (4 hour Chart)


Euro fiber once slipped below 1.2 for the first time in nearly two week notwithstanding the pair recovery a portion of daily weakness near market close, it still held negative 0.3%; trading at 1.2016 as of writing. What drive the pair losses amid DXY index gained traction in day market with it fueled by safe-haven demand in risk-aversion sentiment. For RSI side, indicator shows 39 figures, suggesting a room for bearish momentum at least for short term interval. On average price view, 15-long SMA is maintaining a negative slope and 60-long SMA turned it slope to flatter movement intraday market.

Overall, we foresee market will continue whipsaw or choppy in a range between first support and resistance as it tamp down from 1.213 which is a top pattern at current stage. On slid side, we see 1.199 to 1.2 has a strong support level which form by multi-month-long price cluster area where also a neckline for last bottom pattern. If market extend it downside traction, next support will eyes on 1.19-1.192 around

Resistance: 1.2105, 1.213, 1.22

Support: 1.199, 1.19


USDJPY (4 Hour Chart)

Japan yen have found a support as U.S. share market risk-on mode been trigger that ratch up by risk hedging demand, yen trading at 109.296 as of writing, while market inched up to recent high on 109.6 level. Market participants also await important U.S. macro data on Wednesday. For RSI side, indicator shows 56 figures, which suggest a slightly-bullish market sentiment. On the other hands, 15 and 60-long SMAs indicator are retaining it ascending movement notwithstanding seems to lose accelerating traction.

Overall, we expect 109 still be a powerful support level as yen has successfully denfended intraday. If yen could consecutive stand above first support level, we believe it could been deemed as a bull movement ahead. For upward favour, 109 level is immediately need to be defend naturally and 108.37 following

Resistance: 110.412

Support: 109, 108.37, 107.936


USDCAD (Daily Chart)

Loonie had breakthrough 1.23 level, in which was led by broad-base USD strength, and reached its highest level in nearly a week at 1.235. As of writing, the pair was drop down to 1.23 nearby. Meanwhile, WIT crude oil try to tested last peak at 66-67 level, edged up 2.55% in the day and close at 66.11. For RSI side, indicator correction from neutral area to 45.9 figure which suggest a bearish momentum ahead for short term. On averaging price perspective, 15-long SMA indicator turn it slope to upward movement while 60-long SMA indicator remaining descending slope.

Sum up above, we expect market will sourround in consolidation between 1.2269 to 1.238 as market seems misdirection with blurred price momentum. Albeit, if market doesn’t stand above the first resistance at 1.238 level, we believe it remain bearish momentum for long term.

Resistance: 1.238, 1.246, 1.2491


Economic Data

Currency

Data

Time (GMT + 8)

Forecast

USD

ADP Nonfarm Employment Change

20:15

742 K

USD

ISM Non-Manufacturing PMI

22:00

57.4

Oil

EIA Crude Oil Stock Change

22:30

0.051 M

Daily Market Analysis

Market Focus

Asian stocks look set to open modestly higher Tuesday after a muted session on Wall Street, where technology giants weighed on the market. The dollar dropped with Treasury yields.

Futures pointed higher in Australia and Hong Kong. Trading will be limited with Japan and China among markets closed for holidays. The S&P 500 Index closed near session lows, while Tesla Inc. and Amazon.com Inc. weighed on the Nasdaq 100. Benchmark 10-year Treasury yields dropped back to around 1.6% as Federal Reserve Chair Jerome Powell said the economic recovery remains patchy.

Commodities advanced, with silver leading gains in precious metals as the prospect of near-zero rates for longer boosted demand. Copper and oil climbed more than 1% amid broad rallies in energy and material stocks.

As a reminder of the fragility of economy and persist risks of excessive inflation, Monday’s data showed growth among U.S. manufacturers cooled in April, while a gauge of prices paid for materials jumped to the highest since 2008. Powell said progress in the recovery has been uneven across racial and income divides. New York Fed President John Williams said current conditions are “not nearly enough” for a shift in the monetary policy stance.


Main Pairs Movement:

The dollar lagged all its Group-of-10 currency peers as Treasury 10-year yields slipped following a report showing U.S. factory growth eased in April. The pound led gains, while the euro rose by the most in over a week.

Among G-10 peers, the Australian and New Zealand dollars were among the top three gainers as an index of commodities touched the highest since 2018.

GBP/USD +0.6% to 1.3909; rose as much as 0.8%, the biggest jump since April 19. Pound buoyed by short-dated call demand and EUR/GBPsales ahead of Bank of England policy meeting later this week. Sizable GBP options expire Tuesday and Wednesday at strikes of 1.3800 and 1.4000.

EUR/USD +0.4% to 1.2065; advanced as much as 0.5%, the most since April 23; poised for the first gain in three sessions; climbed above its 100-DMA of 1.2055. Intraday resistance lies around 1.2080, April 20 high.


Technical Analysis:

XAUUSD (4 hour Chart)


XAU/USD pair has been pulled up on Monday while DXY index fell to 90.982 and most importanly that 10 year U.S. Treasury yields slipped over come to 2% in the day which spiraling at 1.6% which seems to be a critical support level, gold trading at 1792.79 as of writing. For RSI side, indicator shows 67.6 figures, suggesting a space for bearish momentum at least for short term interval. On average price view, 15-long SMA is holding a positive slope and 60-long SMA turned it slope to ascending way intraday market.

From price action perspective, it is obviously there has a 2-month long powerful resistance the currently market at 1800 around capping. Moreover, relative strong indicator shows market is close to over bought sentiment. Therefore, we expect gold has lot of chances will be stopped at first immediately resistance. However, if market penetrate the first resistance, 1812 following.

Resistance: 1800, 1812

Support: 1759.7, 1754.53, 1722.76


USDJPY (4 Hour Chart)

Japan yen have a correction in the day as U.S. ISM Manufacturing PMI exceedingly worst-than-expectation with 60.7 versus prediction with 65. Intraday, market once edge up to recently high at 109.65 around then fell to test the firs immediately psychological support level at 109, trading at 109 as of writing. For RSI side, indicator has tamp down to 52 figures, which suggest a neutral market sentiment. On the other hands, 15 and 60-long SMAs indicator are retaining it ascending movement notwithstanding seems to lose accelerating traction.

In the lights of phenomenon, we expect market will lose a significant direction if it keep clinging at first support level. For upward favour, 109 level is immediately need to be defend naturally and 108.37 following

Resistance: 110.412

Support: 109, 108.37, 107.936


USDCAD (Daily Chart)

After trading around 1.23, loonie sucessive depressed around 1.2276. It slipped 0.14% in the day, amid WTI crude oil price bust out to recently high that rallied over 1.6% to 64.48, trading at 1.227 as of writing. The immense of selling pressure surrounding the greenback seems to be forcing loonie to tamp lower. At the meantime, the Canadian manufacturing sector continue to expand in Apr, albeit at a slower pace than March, data edging lower to 57.2 from last month 58.5. For RSI side, indicator bounced back from over sought zone to 34 figures which still suggesting a bearish momentum ahead for short term. On averaging price perspective, 15-long SMA indicator turn it slope to flatter movement while 60-long SMA indicator remaining descending slope.

Overall, if market not retesting the first resistance, we expect loonie will remain it bearish momentum for long term.

Resistance: 1.238, 1.246, 1.2491


Economic Data

Currency

Data

Time (GMT + 8)

Forecast

NZD

Employment Change (QoQ)(Q1)

06:45

0.2%

NZD

RBNZ Gov Orr Speak

07:00

USD

ADP Nonfarm Employment Change

21:00

805K

USD

ISM Non-Manufacturing PMI (Apr)

22:00

64.3

OIL

Crude Oil Inventories

22:30

-2.191 M

VT Markets The Adjustment Of Weekly Dividend Notification

Dear Client,

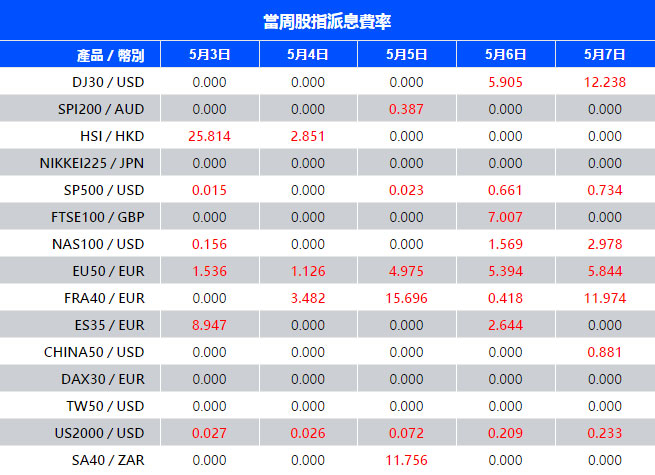
Warmly reminds you that the component stocks in the stock index spot generate dividends. When dividends are distributed, VT Markets will make dividends and deductions for the clients who hold the trading products after the close of the day before the ex-dividend date.

Indices dividends will not be paid/charged as an inclusion along with the swap component. It will be executed separately through a balance statement directly to your trading account, the comment for which will be in the following format “Div & Product Name & Net Volume ” .

Please note the specific adjustments as follows:

If you’d like more information, please don’t hesitate to contact [email protected].

Daily Market Analysis

Market Focus

Stocks dropped from a record as traders assessed corporate earnings, economic data showing potential inflation pressures and hawkish remarks from a Federal Reserve official. The dollar climbed.

The S&P 500 trimmed its biggest monthly advance since November, with energy and technology shares leading declines on Friday. Twitter Inc. tumbled as the social media company posted a sluggish start to the year in its advertising business. Despite living up to Wall Street’s profit expectations, Chevron Corp.retreated after disappointing investors who were anticipating a revival of buybacks.

Signs of excess risk-taking in markets show it’s time to start debating a reduction in bond purchases, said Robert Kaplan, president of the Dallas Fed, breaking ranks with Chairman Jerome Powell. Data showed personal incomes soared in March by the most in monthly records back to 1946, powered by fiscal stimulus. A key measure of consumer prices that the Fed officially uses for its target had the biggest increase since 2018.

The S&P 500 has had better months, but never before has a rally been so widespread, according to one measure tracked by Bloomberg. During 18 sessions in April through trading on Thursday, 95% or more of the index’s members were above their 200-day moving average.


Main Pairs Movement:

The dollar increased by the most in almost two months as the U.S. economy rebounds at a faster pace than others in Europe and Asia, leaving traders covering short bets and rebalancing portfolios as the month ends.

The dollar is now poised to end a three-week losing streak. President Joe Biden administration’s unprecedented spending packages are helping to boost economic growth, a positive for dollar bulls. But bears argue that America’s growth will eventually be overshadowed by a broader revival in the global economy and renewed appetite for riskier assets.

The greenback gained more support as Robert Kaplan, president of the Dallas Federal Reserve, said it’s time for the U.S. central bank to start debating whether to start pulling back on some of its asset purchases as growth quickens. Traders also cited 10-year Treasury yields holding near recent highs and profit-taking ahead of central bank meetings, with the Bank of England and the Reserve Bank of Australia set to meet next week.


Technical Analysis:

EURUSD (4 hour Chart)


GBP/USD pair came under strong downside stress during American session while US dollar index usher to above 91 level, traing at 1.38 as of writing. Major rival currencies against greenback were dragged down amid euro plummet after German GDP fail to beat estimation with -1.7% versus -1.5% expected. At the meantime, some trader said it seems to be a product of month-end flows into London fix. For RSI side, indicator shows 34 figures, suggesting a window for bearish momentum at least for short term interval. On moving average price, 15-long SMA is turning it head down to negative slope whilst 60-long SMA is turning flat move.

Sum up above, we see market is confronting a critical time at current stage as it seems to establish a “M” pattern in short term For price action, current stage at 1.3822 level indicate as neckline of “M” pattern, moreover, it’s also considered low bound for longer perspective as well. Therefore, we stay tune on immediate support at 1.3822, 1.3796 following.

Resistance: 1.39, 1.396, 1.4

Support: 1.3822, 1.3795


USDJPY (4 Hour Chart)

Japan yen is poised to upper side as it continue rallied which fueled by strong greenback, trading at 109.32. In the absence of a significant news pump, the furious pull up seemingly driven by weakness Fiber. For RSI side, indicator has ratched up to 68 figures, suggesting an room for upper movement. Moreover, 15-long SMAs accelerating it upward slope and 60-long SMA maintaining a smooth movement.

Overall, we expect market still have a room for bullish momentum which motivate the strong price action pattern notwithstanding RSI is poised to over bought area. On slid way, we see the priority support of price cluster at 109 and 108.37 following as neckline of longer view.   

Resistance: 110.412

Support: 109, 108.37, 107.936


USDCAD (Daily Chart)

Loonies snap days appreciation streak as pan-commodities market whispaw and greenback turn north territory, trading at 1.22865 level as of writing. Meanwhile, WTI crude oil had slipped over 2.1% to 63.5 level as market close. For RSI side, indicator still occupy the over sought territory at 28 figure, suggesting an over pessimetic sentiment at the moment.

Continue our recently perspective, we estill expect loonie will have an immense space for downward trend as it penetrated 2 years neckline. Moreover, we do not see any support level on lower bound in long term view.

Resistance: 1.238, 1.246, 1.2491


Economic Data

Currency

Data

Time (GMT + 8)

Forecast

EUR

German Manufacturing PMI (Apr)

15:55

66.4

USD

ISM Manufacturing PMI (Apr)

22:00

65.0

Daily Market Analysis

Market Focus

U.S. stocks rose to a record as investors digested the latest batch of corporate earnings and data that showed the American economy gained steam in the first three months of the year.

Amazon.com climbed after hours on a better-than-estimated revenue forecast, while Twitter sank amid a lackluster outlook. In regular trading, Apple wiped out its gains on concern that the iPhone maker may not sustain growth after a blockbuster quarter as it faces a tightening supply of chips.

The tech-heavy Nasdaq 100 broke a two-day losing streak. The volatility came as investors continued to assess major corporate results that overshadowed signs of a resurgence in the economy. Data released Thursday showed U.S. gross domestic product expanded at a 6.4% annualized rate in the first quarter, while applications for U.S. state unemployment insurance fell last week to a fresh pandemic low.

While the GDP figures may support the Federal Reserve’s strong assessment of the economy, the central bank is in no mood to halt aggressive support as it looks for even further progress in employment and inflation. Chair Jerome Powell on Wednesday dismissed worries about price surges or anecdotes of labor shortage, implying policy makers are prepared to run the economy hot for a while. President Joe Biden unveiled a $1.8 trillion spending plan targeted at American families, adding to the economic optimism.

With their plans, the Fed and Biden have delivered a boost to investor sentiment that has see-sawed in recent days between optimism over a string of robust economic data and caution amid high valuations and speculation about stimulus tapering by year-end.


Main Pairs Movement:

The dollar topped most Group-of-10 currency peers as 10-year Treasury yields rose to the highest in two weeks amid mounting inflation expectations and data showing U.S. economic growth is accelerating. The Canadian dollar outperformed as oil climbed and copper neared an all-time high.

Treasury 10-year yield up 3bps at 1.64%, paring a gain of as much as 8bps, as TIPS break evens touched the highest since 2013. Among G-10 peers, the greenback outperformed most except for the loonie and pound; the Swedish krona and Australian dollar lagged the pack.

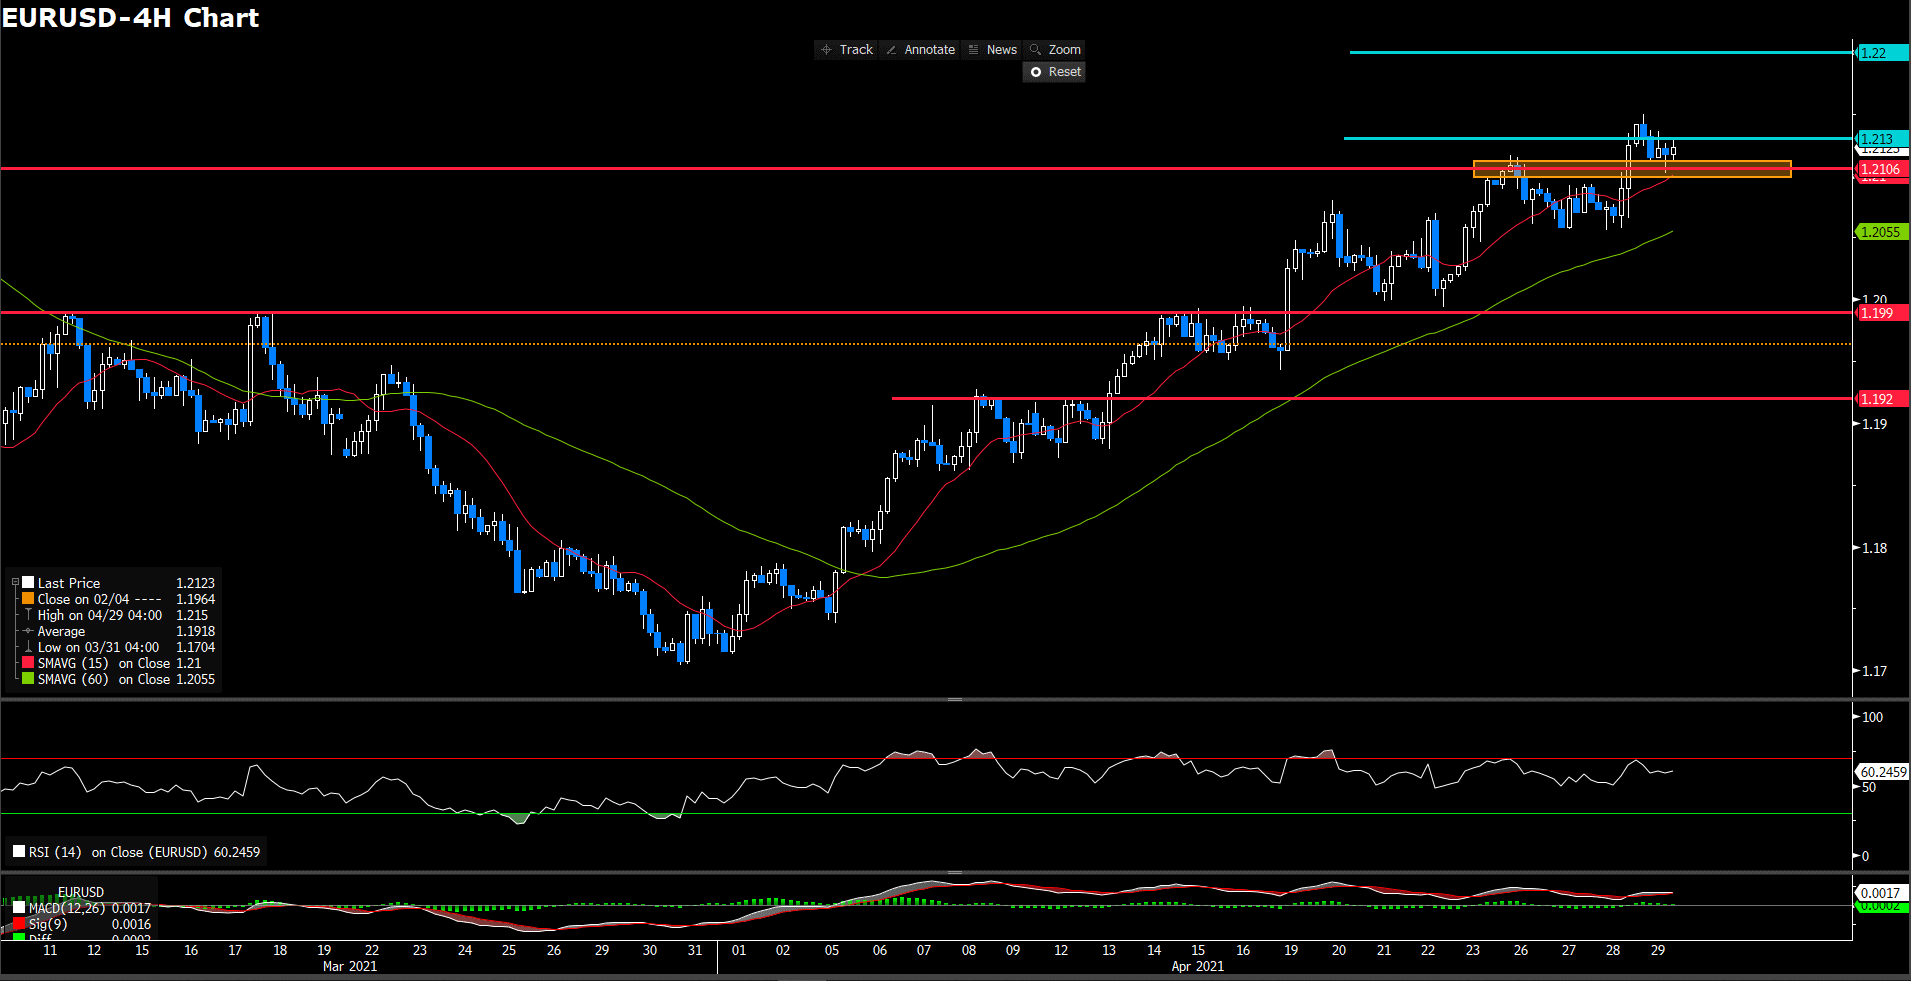
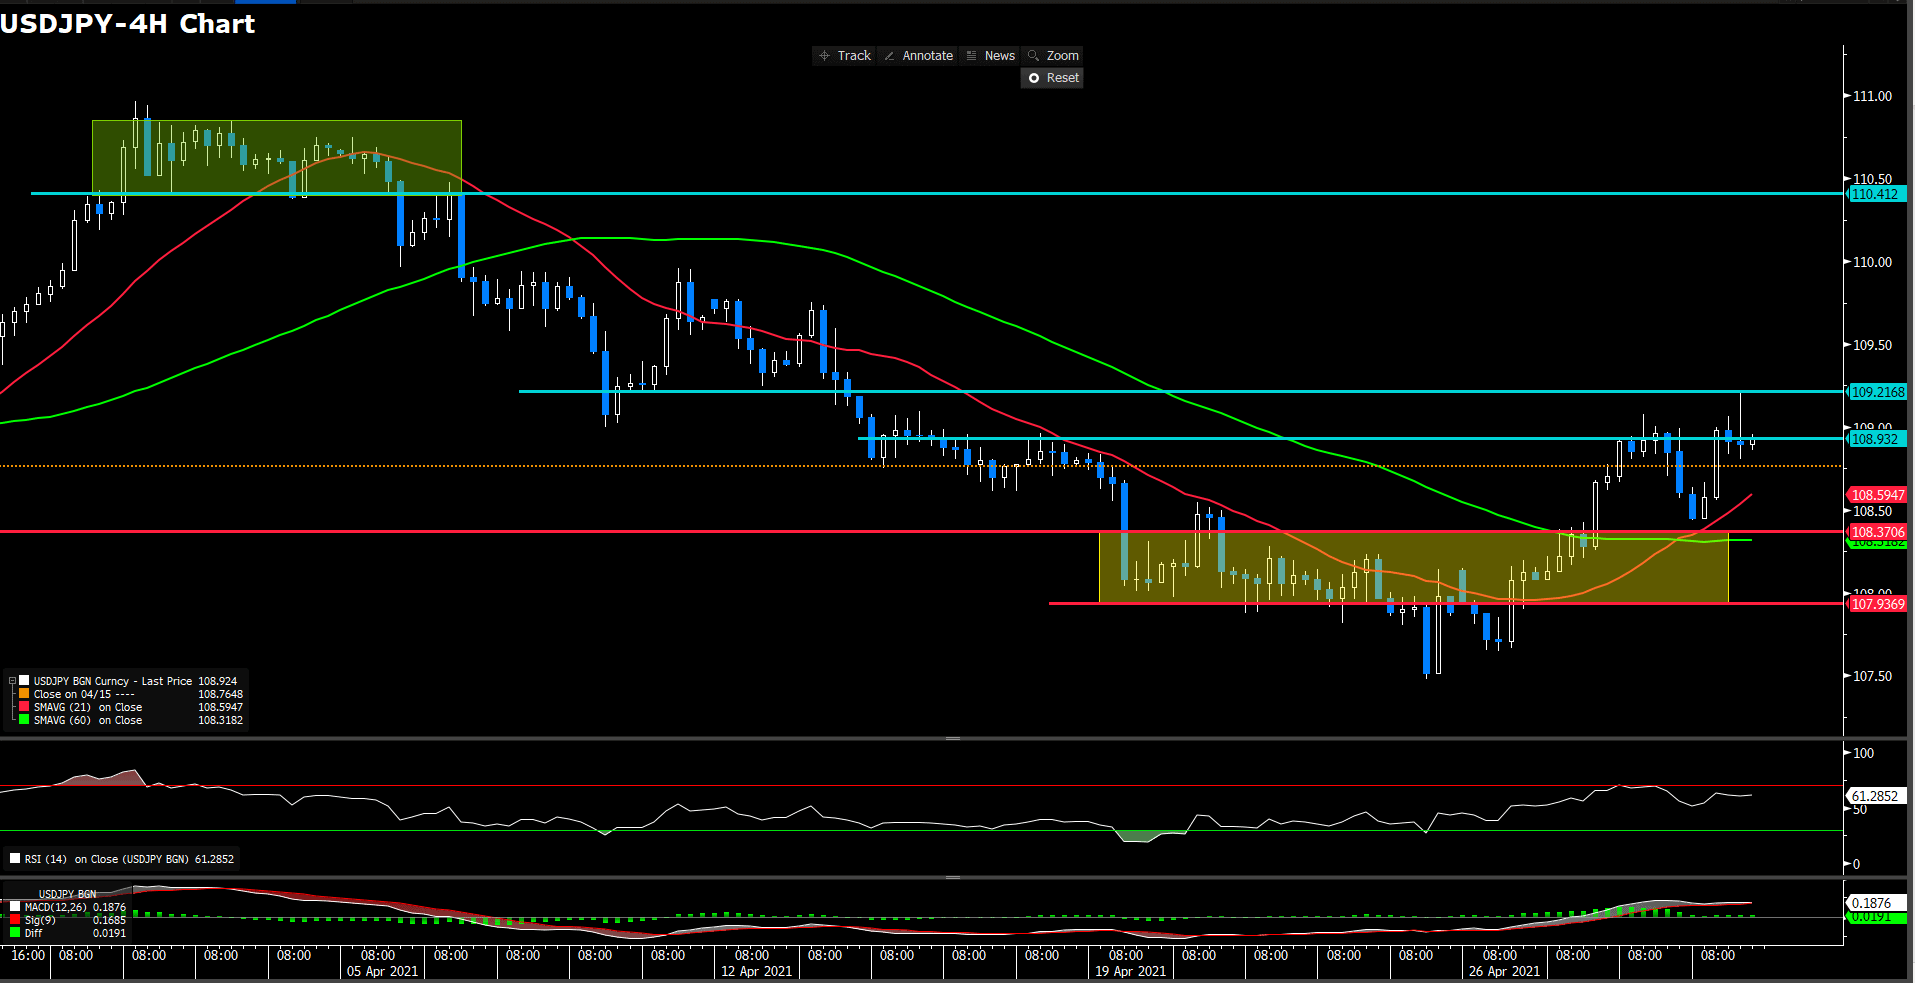
USD/JPY climbed 0.3% to 108.94; rose as much as 0.6% to 109.22, highest since April 13. EUR/USD -0.1% to 1.2119 after earlier hitting the highest since February; options suggest further spot gains may come at a slower pace.

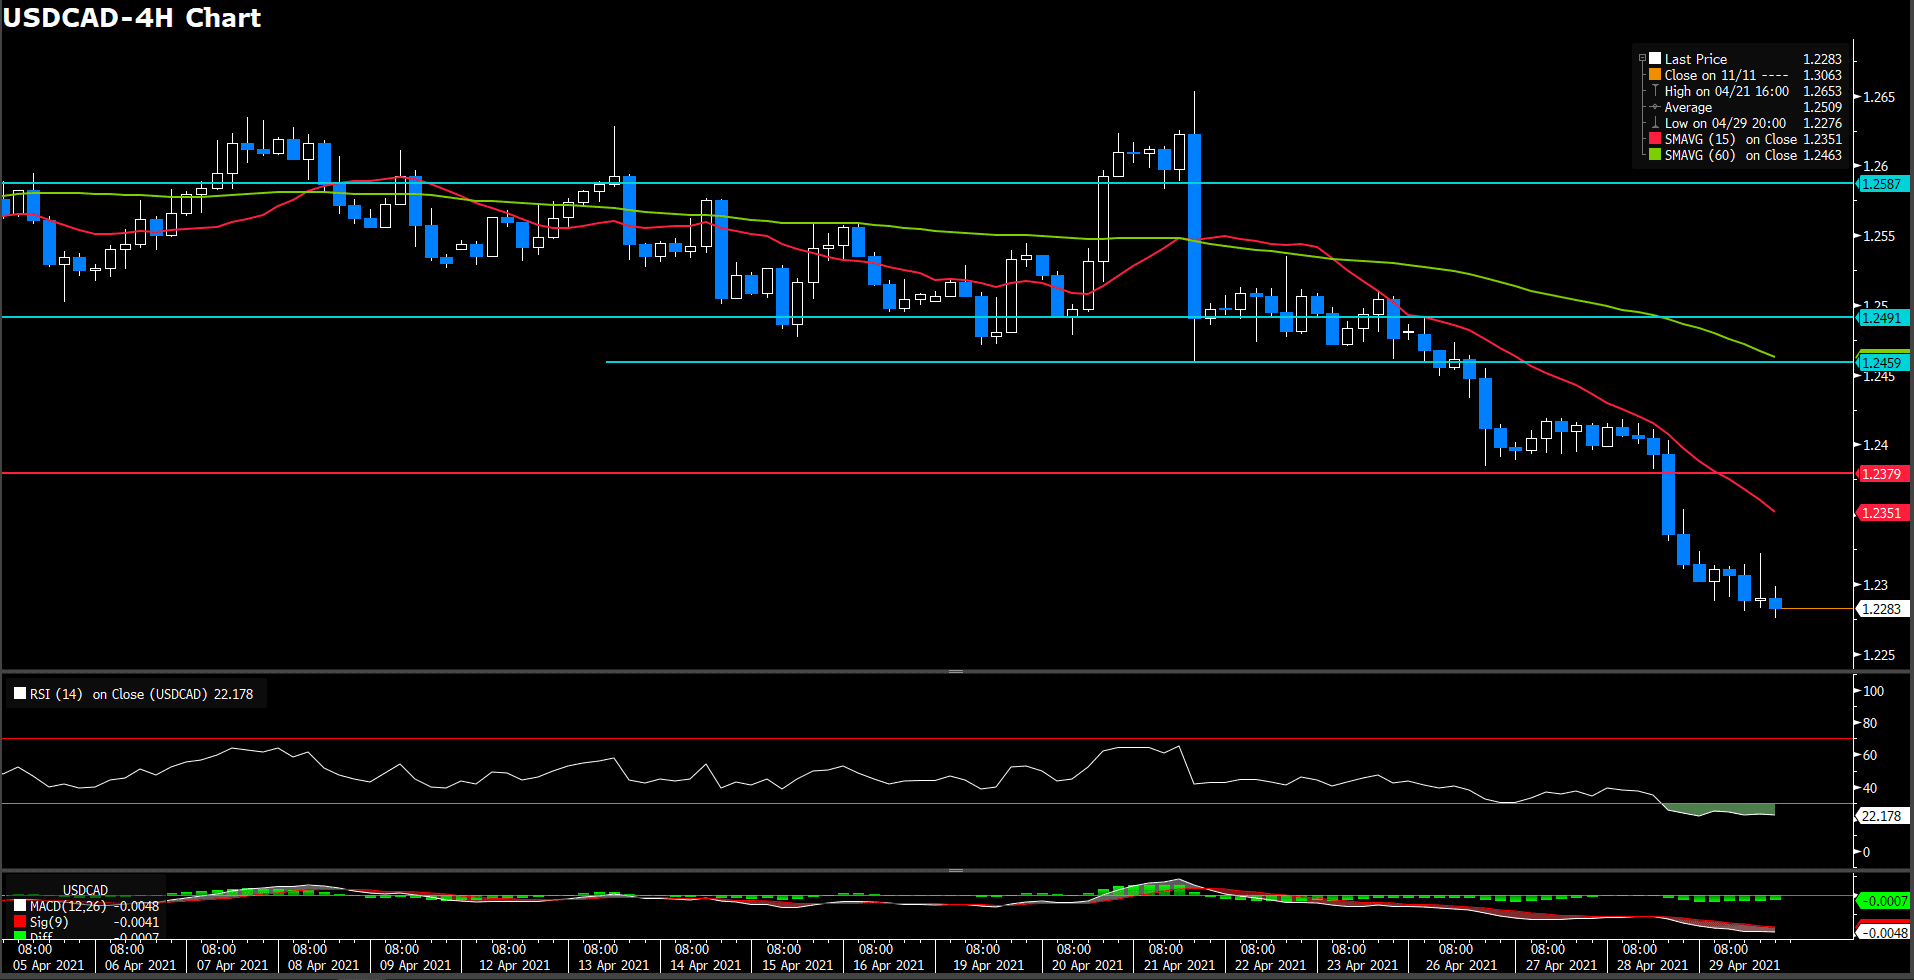
GBP/USD rose 0.1% to 1.3944, after earlier rising to the highest in over a week as UK PM facing a political risk. USD/CAD dropped 0.3% to 1.2283, earlier fell to 1.2281, lowest since February 2018; leads G-10 gains as WTI oil rises for third day.


Technical Analysis:

EURUSD (4 hour Chart)

Euro dollar retains monthly gains after reached top 1.2149 but stifle by 1.213 level while outerperformance U.S. data failed to push the greenback forward, trading at 1.213 as of writing. For RSI side, indicator shows 60.3 figures, suggesting a room for bullish momentum at least for short term. On moving average price, 15 and 60-long SMA indicator remain an ascending movement.

Overall, we expect there still have a upper-space as market sentiment remain a benign bullish momentum. Again, we need to eyes on euro dollar whether could emphatically stand above 1.2106 level.

Resistance: 1.213, 1.22

Support: 1.2106, 1.199, 1.192


USDJPY (4 Hour Chart)

Japan yen retreat yesterday weakness from Fed’s impact that once hit all day high 109.22 then slightly fell to 108.9 when market close. For RSI side, indicator has ratched up to 61 figures, suggesting an optimistic sentiment for bull movement. Moreover, 15-long SMAs has golden cross 60-long one although 60-long SMA remain a smooth movement.

In lights of day move, we foresee market is establishing a upward momentum as price action and market sentiment. In order maintaining bull move, neckline of “V” pattern should be the immediately defend level, 107.937 following. On up way, if yen could penetrate day high level, place at 109.22, it could spur more buy side demand.

Resistance: 108.93, 109.22, 110.412

Support: 108.37, 107.936


USDCAD (Daily Chart)

After breakthrough support at 1.238 level, loonie continue it downward momentum to nearly three year fresh low that trading at 1.228 as of writing. For moving average side, 15 and 60-long SMAs remaining a descending trend. For RSI side, indicator has slipped into the over sought territory at 22 figure, suggesting an over pessimetic sentiment at the moment.

Continue our recently perspective, we estill expect loonie will have an immense space for downward trend as it penetrated 2 years neckline. However, consecutive 2 days over sought sentiment of RSI indictor which we consider will have a mean reverse in imminet days. Otherwise, we do not see any support level on lower bound in long term view.

Resistance: 1.238, 1.246, 1.2491


Economic Data

Currency

Data

Time (GMT + 8)

Forecast

CNY

Manufacturing PMI (Apr)

09:00

51.7

CNY

Caixin Manufacturing PMI (Apr)

09:45

50.8

EUR

German GDP (QoQ)(Q1)

16:00

-1.5%

EUR

CPI (YoY)(Apr)

17:00

1.6%

CAD

GDP (MoM)(Feb)

20:30

0.5%

USD

Michigan Consumer Sentiment

22:00

87.4

Back To Top
server

Hello there 👋

How can I help you?

Chat with our team instantly

Live Chat

Start a live conversation through...

  • Telegram
    hold On hold
  • Coming Soon...

Hello there 👋

How can I help you?

telegram

Scan the QR code with your smartphone to start a chat with us, or click here.

Don’t have the Telegram App or Desktop installed? Use Web Telegram instead.

QR code