Gold prices in the United Arab Emirates fell on Thursday, based on FXStreet data. Gold was priced at AED 607.38 per gram, down from AED 611.27 on Wednesday.
Gold also dropped to AED 7,084.36 per tola from AED 7,129.69 a day earlier. Other listed prices were AED 6,073.80 for 10 grams and AED 18,891.65 per troy ounce.
How Local Gold Prices Are Calculated
FXStreet produces local gold rates by converting international prices using the USD/AED exchange rate and local units. The figures are updated daily at publication time and are for reference, as local market rates may differ.
Gold is commonly used as a store of value and for jewellery, and is also treated as a safe-haven asset. It is also used as a hedge against inflation and currency weakness, since it is not backed by any single issuer or government.
Central banks are the largest holders of gold and use it to diversify reserves. They added 1,136 tonnes worth about $70 billion in 2022, the highest annual total on record.
Gold often moves inversely to the US Dollar and US Treasuries, and can also move against risk assets such as shares. Its price is affected by geopolitics, recession concerns, interest rates, and shifts in the US Dollar, as it is priced in dollars (XAU/USD).
Market Outlook And Trading Considerations
The minor dip in gold prices should be viewed as a tactical entry point rather than a change in trend. We are seeing US inflation data from February hold stubbornly at 3.1%, keeping it above the Federal Reserve’s target. This persistent inflation continues to fuel the debate around the US Dollar’s next major move, which directly impacts gold.
After a year of holding interest rates steady throughout 2025, central bank commentary is now shifting towards potential rate cuts later in 2026. Gold, being a non-yielding asset, typically strengthens in an environment of falling rates. We should consider using long-dated call options to position for this anticipated easing cycle in the coming months.
Underlying support for gold remains exceptionally strong, driven by institutional buying. We saw central banks globally add a net 1,037 tonnes to their reserves last year in 2025, showing their continued appetite for the metal. This consistent demand creates a solid price floor, making strategies like selling out-of-the-money puts attractive for generating income while we wait for the next leg up.
We must also consider gold’s role as a hedge against market shocks. The VIX volatility index is currently trading at a low level around 14, suggesting a high degree of complacency in the stock market despite ongoing geopolitical risks. Maintaining exposure through gold futures or ETFs is a prudent way to protect portfolios from any sudden flight to safety.
Create your live VT Markets account and start trading now.
Start trading now – Click here to create your real VT Markets account
Written on March 12, 2026 at 8:59 am, by josephine
NZD/USD stayed weak for a third day, trading near 0.5900 in Asian hours on Thursday. The pair fell as the US Dollar stayed firm, as higher energy prices lifted inflation risk and reduced the chance of Federal Reserve rate cuts.
The US Dollar Index rose towards three-month highs and traded near 99.50. Markets are watching US Personal Consumption Expenditures data due on Friday for more policy signals.
Inflation Data Keeps Dollar Supported
US CPI data released on Wednesday showed inflation rising 0.3% month-on-month in February and 2.4% year-on-year. Core CPI rose 0.2% month-on-month and 2.5% year-on-year.
The New Zealand Dollar remained under pressure as risk appetite fell amid tensions linked to the Middle East war. Higher energy prices also added to New Zealand inflation concerns, with expectations that domestic price pressures may last longer and keep the Reserve Bank of New Zealand on a tighter policy path.
We are seeing a familiar pattern of risk aversion driving US Dollar strength. Looking back, we saw similar dynamics in early 2025 when Middle East tensions caused the DXY to approach 99.50. Now, with the DXY holding firm around 104.30, the environment continues to favor the dollar as a safe haven.
The US inflation picture remains a central concern for the Federal Reserve, much like it was last year. Back in February 2025, the annual CPI print of 2.4% seemed manageable, but recent data for February 2026 shows inflation is proving sticky at 2.8%, keeping rate cut expectations at bay. This sustained inflationary pressure suggests that betting on continued dollar strength through call options on USD or put options on risk-sensitive pairs is a viable strategy.
Risk Sentiment And Options Strategies
For the New Zealand Dollar, the situation is complicated by domestic factors. Just as we saw in 2025, surging energy prices are fueling inflation, forcing the Reserve Bank of New Zealand to maintain a hawkish stance with its cash rate holding at 5.5% for over a year now. This creates a tug-of-war, with global risk-off sentiment weakening the NZD while domestic rate policy offers support, implying potential for volatility.
The geopolitical risk premium in energy markets has not disappeared. The surge in oil prices we witnessed in early 2025 has established a new floor, with WTI crude now trading persistently above $85 a barrel, a significant jump from the sub-$75 levels seen before that conflict. This elevated price floor continues to feed into global inflation data, forcing central banks to remain cautious.
Given this backdrop, traders should consider strategies that benefit from both dollar strength and potential volatility in the kiwi. Buying NZD/USD put options provides a clear directional play on further downside for the pair. For those uncertain of direction but expecting a significant price move, a long straddle could capture profits from a breakout driven by either RBNZ policy surprises or escalating global risk aversion.
Create your live VT Markets account and start trading now.
Start trading now – Click here to create your real VT Markets account
Written on March 12, 2026 at 8:59 am, by josephine
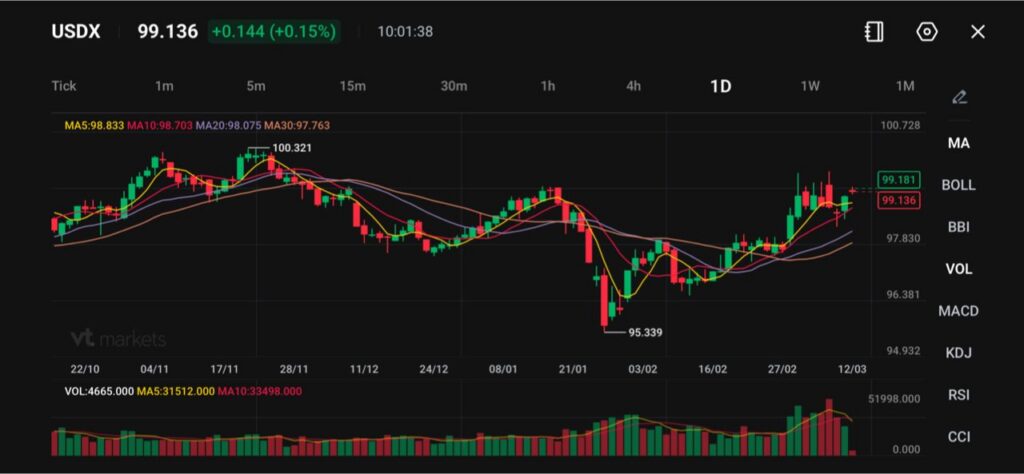
The US dollar index (USDX) trades around 99.136, up +0.144 (+0.15%), hovering near its strongest levels this year.
Brent crude surged above $100 per barrel, intensifying inflation concerns and lifting expectations for tighter central bank policy.
Markets are pushing back rate-cut expectations as oil-driven inflation risks grow, with traders increasingly pricing delayed easing from major central banks.
The US dollar extended its gains as oil prices surged, pushing the currency toward its strongest levels of the year. Traders have been moving back into the dollar as the global energy shock raises concerns about inflation and forces markets to rethink how quickly central banks can ease policy.
Rising oil prices increase energy costs across economies, which feeds into consumer prices and complicates the inflation outlook. This has strengthened the dollar as traders reduce bets on interest rate cuts and look for safety in the world’s reserve currency.
The dollar is the best haven bet as market volatility picks up during the Mideast conflict, according to Nathan Thooft of Manulife Investment Management, who says he’s shifted more of his investments to the US since hostilities erupted https://t.co/jG8GYsdd2X
The move has been broad across the currency market. The euro, yen, sterling and commodity-linked currencies all weakened against the dollar as energy volatility weighed on global risk sentiment.
If oil prices remain elevated, the dollar may continue to find support as markets adjust to the possibility that central banks keep policy tighter for longer.
Energy Dependence Shapes Currency Moves
Currency moves have largely reflected each economy’s dependence on imported energy. Countries that rely heavily on foreign oil and gas face worsening trade balances when energy prices surge.
This dynamic has pressured European and Asian currencies. Europe in particular faces greater exposure to energy shocks because of its dependence on imported oil and gas, which has weighed on the euro despite rising expectations that the European Central Bank may tighten policy.
A sharp swing in European money markets from bets on central bank interest-rate cuts to hikes has caught traders off guard, forcing some to exit options at hefty losses https://t.co/Ac4h2iAIm1
The Japanese yen also weakened toward the 159 per dollar level, approaching its weakest levels in nearly a year. Japan imports the vast majority of its energy needs, meaning higher oil prices quickly translate into economic pressure.
Commodity currencies have also felt the strain. The Australian and New Zealand dollars both slipped as traders reassessed global growth risks and rising inflation.
If energy prices remain volatile and supply disruptions persist, currencies tied to energy imports may continue to face pressure relative to the dollar.
Rate Expectations Shift Across Central Banks
The surge in oil prices has begun to ripple through interest-rate markets. Traders are increasingly questioning whether central banks can cut rates as quickly as previously expected if inflation pressures rise again.
Swaps markets now show expectations that some central banks could tighten sooner or delay easing cycles. The European Central Bank is increasingly expected to move earlier than anticipated, while the Reserve Bank of Australia may face renewed pressure to raise rates.
In the United States, traders have also scaled back expectations for rate cuts. Fed funds futures show markets pushing potential easing further into the year as inflation risks from energy prices rise.
A key measure of US inflation was tame at the start of the year. But another metric is shaping up to paint a very different picture https://t.co/xoKdT0a7Vt
If inflation expectations continue climbing alongside energy prices, central banks may adopt a more cautious policy stance, which would likely support the dollar and maintain volatility in global currency markets.
USDX Technical Outlook
The US Dollar Index (USDX) is trading near 99.14, up around 0.15%, as the dollar continues to hold its recent gains following the rebound from the 95.34 low earlier this year.
The index has been trending gradually higher over the past few weeks, reflecting renewed demand for the dollar amid heightened global uncertainty and shifting macro expectations.
From a technical standpoint, the index is currently trading above its key short-term moving averages. The 5-day moving average (98.83) and 10-day (98.70) are both trending upward and sitting just below the current price level, while the 20-day (98.07) and 30-day (97.76) remain further beneath the market.
This alignment indicates strengthening bullish momentum in the near term as the dollar attempts to extend its recovery.
Immediate resistance is located near 99.30–99.50, where recent rallies have stalled. A sustained break above this region could bring the index back toward the 100.00 psychological level, followed by the 100.32 area, which previously capped the broader advance.
On the downside, initial support is seen around 98.70–98.80, with stronger structural support near 98.00, where the 20-day moving average is currently positioned.
Overall, the short-term bias for the dollar remains moderately bullish, with the index consolidating near recent highs. A move above 99.50 would likely strengthen upward momentum toward the 100 handle, while failure to hold above the 98.70–98.80 support zone could trigger a deeper consolidation.
What Traders Should Watch Next
Oil price volatility and any renewed disruptions to shipping through the Strait of Hormuz.
Central bank messaging as inflation expectations rise alongside energy costs.
Currency reactions in energy-importing economies, particularly the euro and yen.
Whether USDX retests resistance near 100.321 as safe-haven demand strengthens.
Why is the US Dollar Strengthening Right Now? The US dollar is gaining support as oil prices surge and raise inflation concerns. Higher energy costs can delay interest rate cuts, which tends to strengthen the dollar because traders seek higher-yielding and safer assets.
What is the US Dollar Index (USDX)? The US Dollar Index (USDX) measures the strength of the dollar against a basket of six major currencies: the euro, Japanese yen, British pound, Canadian dollar, Swedish krona and Swiss franc.
Why Do Rising Oil Prices Support the Dollar? Higher oil prices increase inflation risks and push central banks to maintain tighter monetary policy. Since the United States is a net energy exporter, rising oil prices often benefit the dollar relative to currencies of energy-importing economies.
How Does the Strait of Hormuz Affect Currency Markets? The Strait of Hormuz is one of the world’s most important energy shipping routes. Disruptions there can push oil prices higher, increase inflation expectations and shift global capital flows toward safe-haven currencies like the dollar.
Why Are Interest Rate Expectations Changing? Surging energy prices increase inflation risks, making central banks more cautious about cutting interest rates. Markets are now pushing potential easing further into the year as policymakers monitor inflation pressures.
Start trading now – Click here to create your real VT Markets account
Written on March 12, 2026 at 8:59 am, by josephine
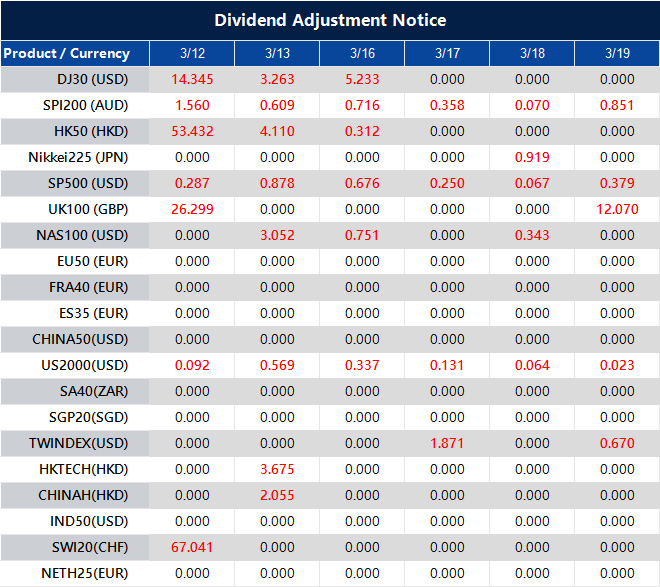
Please note that the dividends of the following products will be adjusted accordingly. Index dividends will be executed separately through a balance statement directly to your trading account, and the comment will be in the following format “Div & Product Name & Net Volume”.
Please refer to the table below for more details:
The above data is for reference only, please refer to the MT4/MT5 software for specific data.
If you’d like more information, please don’t hesitate to contact [email protected].
Since peaking on 30 October 2025, the Nasdaq (NQ) has traded in a sideways range. The fall from that peak completed wave (W) at 23,994.5, followed by a rally that ended wave (X) at 26,349.
After wave (X), the index turned down into wave (Y). Wave (Y) is described as forming a double three Elliott Wave correction.
Current Structure And Key Levels
From the end of wave (X), a decline completed wave W at 24,000. A new wave X then started as a zigzag, with wave ((a)) rising to 25,217.5.
Wave ((b)) is now under way as a pullback. It is correcting the move that began from the 9 March 2026 low.
If the pivot at 23,994.8 holds, the index may rise in wave ((c)) to finish wave X. After that, the broader move is expected to continue lower.
We see the current pullback from the March 9, 2026, high as a temporary and corrective phase. This dip appears linked to the recent February 2026 Consumer Price Index data, which at 3.4% came in slightly hotter than anticipated, causing some short-term profit-taking. As long as the Nasdaq holds above the critical 23,994.8 pivot level, the structure favors another move higher in the coming weeks.
This outlook suggests traders could position for a short-term rally, which we are labeling wave ((c)). Using strategies like buying call options or deploying bullish call spreads could capture this expected, but temporary, upward move. Conflicting economic signals, such as February’s solid job creation being offset by a rise in the unemployment rate to 4.1%, support the view that this will be a limited, corrective rally rather than the start of a new, sustained bull market.
Broader Risk And Downside Bias
The larger pattern since the peak on October 30, 2025, remains a complex correction that is ultimately expected to resolve to the downside. Traders should therefore watch for signs of this anticipated rally stalling, as that would signal the time to shift toward bearish positions like buying puts. The CBOE Volatility Index (VIX) hovering around 19 reflects this underlying uncertainty and suggests that significant risk remains after any near-term strength fades.
This type of choppy, sideways price action is not unusual after a major market top, reminiscent of the consolidation we saw in prior post-bull run periods. Looking back from our current standpoint, the high set in late 2025 marked a significant turning point into this corrective phase. The broader market continues to grapple with the prospect of interest rates remaining higher for longer than previously hoped, capping any significant upside potential for now.
Create your live VT Markets account and start trading now.
Start trading now – Click here to create your real VT Markets account
Written on March 12, 2026 at 8:02 am, by josephine
EUR/USD fell for a third session and traded near 1.1540 in Asian hours on Thursday, slipping below 1.1550. The move followed a firmer US Dollar, linked to higher energy prices that raised inflation risks and lowered the chance of Federal Reserve rate cuts.
US CPI data for February showed inflation rose 0.3% month-on-month and 2.4% year-on-year. Core CPI rose 0.2% month-on-month and 2.5% year-on-year.
Fed Outlook And Key Data
The figures supported expectations that the Fed may keep rates steady in the near term. Markets are now watching US Personal Consumption Expenditures (PCE) data due on Friday.
In Europe, markets are still pricing European Central Bank rate rises in 2026. ING analysts said euro rates remain sensitive to energy prices, with lower energy potentially pulling 2-year yields down.
ECB officials said they are watching energy-driven inflation risks in the Eurozone. They also said the ECB is ready to respond if higher energy costs linked to the Iran war keep inflation elevated.
We are seeing the US Dollar strengthen as surging energy prices, linked to the Iran war, push Brent crude above $105 a barrel. This is putting direct pressure on the EUR/USD pair, pushing it below the 1.1550 level. The market is now pricing out any chance of a near-term Federal Reserve rate cut, especially after last week’s US jobs report showed over 250,000 jobs were added in February.
Volatility And Strategy Considerations
This environment of geopolitical tension and central bank uncertainty suggests volatility is the primary trade for the coming weeks. The Cboe EuroCurrency Volatility Index (EVZ) has already climbed to a six-month high, and we expect it could climb further as traders await fresh inflation data. Buying options, such as straddles, on EUR/USD is a viable strategy to position for a significant price move without betting on a specific direction.
For those with a directional view, the path of least resistance appears to be a weaker euro, given the direct impact of high energy costs on the European economy. Unlike the temporary energy spike we saw in the autumn of 2025, this situation feels more persistent, making put options on the EUR/USD an attractive way to hedge or speculate on further declines. These options provide a defined-risk way to gain short exposure in what is becoming a very choppy market.
We must also monitor the European Central Bank, as officials sound increasingly ready to act against rising prices. European interest rate markets are now pricing in at least one ECB rate hike by the end of 2026, a sharp reversal from just a few months ago. This creates a complex dynamic, as any ECB action to fight inflation could also damage an already fragile Eurozone economy, potentially leading to even more currency weakness.
Create your live VT Markets account and start trading now.
Start trading now – Click here to create your real VT Markets account
Written on March 12, 2026 at 8:01 am, by josephine
Silver fell in Asia to below $84.00, then rebounded but did not extend gains. It traded just under the mid-$85.00s and was down 0.40% on the day.
Price action stayed below the 100-hour EMA near $86.15, which limited intraday rises. The near-term tone was neutral with a slight bearish tilt.
The MACD histogram turned marginally positive and the MACD line moved above the signal line, near the zero level. This pointed to only limited upside momentum after a prior drop.
The RSI was near 43 and remained below its midline, which suggested ongoing selling pressure. Resistance was first seen at $86.15, with the next level near $87.20 if price breaks higher.
Support sat near $85.30, then around $84.85, which held the latest rebound. A sustained move below $84.85 could open the lower $84.00 area, while a move above $86.15 could reduce the bearish bias.
The technical analysis was produced with help from an AI tool.
We are seeing that silver’s inability to hold gains above the mid-$85.00s points to underlying weakness. Any attempt to rally is quickly being sold off, particularly as it approaches the key resistance level around $86.15. This pattern suggests that sellers are currently in control of the short-term price action.
This price behavior is consistent with recent macroeconomic data. The US Dollar Index has remained firm above 105 following last week’s stronger-than-expected jobs report, creating headwinds for dollar-denominated commodities like silver. Furthermore, we note that manufacturing PMI data out of China for February 2026 came in at a contractionary 49.8, signaling a slowdown in industrial demand which is critical for silver.
For traders using options, this creates an opportunity to sell call credit spreads with a short strike above the $86.15 resistance level. This strategy would profit from either a continued decline in price or if silver simply remains range-bound below that key hurdle in the coming weeks. The limited upside momentum shown by the MACD indicator supports this neutral-to-bearish stance.
Those holding short futures positions should view the $84.85 level as the first critical support to watch. A decisive break below this price would confirm the bearish trend and likely lead to a test of the lower $84.00 area. Any sustained move back above the $86.15 mark would be our signal to reconsider bearish positions.
This current technical setup is reminiscent of the price action we observed during the third quarter of 2025. Back then, a similar failure at a key moving average preceded a significant leg down in price. We are watching carefully to see if history repeats itself, as the broader market conditions appear just as challenging now as they did then.
Start trading now – Click here to create your real VT Markets account
Written on March 12, 2026 at 8:01 am, by josephine
The US Dollar Index (DXY) was near 99.35 in Asian trading on Thursday, moving above 99.00. It edged higher as conflict in the Middle East escalated, with US weekly Initial Jobless Claims due later on Thursday.
Market focus remained on disruption risks around the Strait of Hormuz. Iran launched what was described as its most intense operation since the start of the war to try to halt traffic through the oil route, while Bahrain reported fuel tanks at one facility were targeted and an Iraqi port official said two foreign tankers were hit, caught fire, and leaked oil.
Inflation Data And Fed Expectations
In US data, the Consumer Price Index rose 0.3% month on month in February, compared with 0.2% previously, matching expectations. Core CPI rose 0.2% month on month, down from 0.3% before, also in line with estimates.
Annual CPI inflation rates were unchanged from January, leaving inflation above the Federal Reserve’s 2% target. Markets priced in nearly a 99.5% chance of no rate change at the Fed’s March meeting, according to CME FedWatch.
Looking back at the situation in early 2025, the escalating conflict in the Middle East was a clear signal for a flight to safety. The US Dollar Index (DXY) was pushing higher, reflecting this sentiment. At that time, we saw the DXY strengthen toward the 104 level through March and April 2025, confirming the safe-haven demand.
Derivative traders should have interpreted this as a cue to go long the US dollar. Buying call options on dollar-tracking ETFs like the Invesco DB USD Bullish Fund (UUP) would have been a direct way to profit from this trend. These positions would have benefited from both the geopolitical tension and the Federal Reserve’s steady hand on interest rates.
Oil Supply Risk And Volatility Hedges
The direct threat to the Strait of Hormuz pointed to a significant risk for global oil supply. We remember West Texas Intermediate (WTI) crude oil prices hovering in the low $80s per barrel range during that period. This made call options on crude oil futures or energy sector ETFs a logical trade to hedge against or speculate on a supply shock.
Such geopolitical uncertainty typically fuels market volatility, making the CBOE Volatility Index (VIX) a key instrument to watch. In March 2025, buying VIX call options would have been a prudent hedge against a broader market sell-off triggered by worsening conflict. As of today, the VIX is trading much lower, near 14, highlighting that this was a specific, event-driven opportunity.
With the market almost fully pricing in a hold from the Fed in March 2025, the focus shifted to the future path of interest rates. We now know the Fed began to signal rate cuts later that year, which ultimately happened. Astute traders at the time would have used options on Secured Overnight Financing Rate (SOFR) futures to position for this eventual pivot away from a hawkish stance.
Create your live VT Markets account and start trading now.
Start trading now – Click here to create your real VT Markets account
Written on March 12, 2026 at 8:01 am, by josephine
The People’s Bank of China (PBOC) set the USD/CNY central rate for Thursday at 6.8959. This compared with the prior day’s fix of 6.8917 and a Reuters estimate of 6.8853.
The PBOC’s main monetary policy aims are price stability, including exchange rate stability, and supporting economic growth. It also works on financial reforms, including opening and developing financial markets.
Pboc Governance And Independence
The PBOC is owned by the state of the People’s Republic of China and is not an autonomous body. The Chinese Communist Party Committee Secretary, nominated by the Chairman of the State Council, has key influence over management and direction, and Pan Gongsheng holds both that role and governor.
The PBOC uses tools including a seven-day Reverse Repo Rate, the Medium-term Lending Facility, foreign exchange interventions, and the Reserve Requirement Ratio. The Loan Prime Rate is China’s benchmark interest rate and affects loan, mortgage, and savings rates, as well as the Renminbi exchange rate.
China has 19 private banks, including digital lenders WeBank and MYbank. In 2014, China allowed domestic lenders fully capitalised by private funds to operate in the state-led financial system.
The People’s Bank of China has set the USD/CNY rate weaker than expected at 6.8959, signaling a tolerance for a weaker yuan. This move diverges from market estimates and suggests a deliberate policy direction from the central bank. For derivative traders, this opens up possibilities for strategies betting on a higher USD/CNY exchange rate in the short term.
Market Implications And Trading Considerations
This decision follows recent data showing China’s exports grew by only 2.3% in the last quarter, missing forecasts and indicating sluggish external demand. A weaker currency can help make Chinese goods more competitive abroad and support the manufacturing sector. Traders should watch for the upcoming industrial production figures, as another weak print could encourage the PBOC to guide the yuan even lower.
Looking back, we saw similar managed depreciation in early 2025 when the economy was facing headwinds from a property sector slowdown. During that period, option volatility on the yuan increased by over 15% in a single month. This history suggests that buying straddles or strangles on USD/CNY could be a viable strategy to profit from expected price swings.
The central bank’s actions also have significant implications for commodity futures, as China is the world’s largest consumer. A weaker yuan makes dollar-denominated imports like crude oil and iron ore more expensive for Chinese buyers, which could temper demand. Consequently, traders should consider hedging long positions in industrial commodities that are sensitive to Chinese consumption.
We know the PBOC uses a broad set of tools, including the Loan Prime Rate (LPR), to manage economic growth. With the currency being allowed to weaken, the market may start to price in a potential cut to the LPR in the coming quarter to further stimulate the economy. Any such move would likely add more downward pressure on the yuan, reinforcing the current trading outlook.
Create your live VT Markets account and start trading now.
Start trading now – Click here to create your real VT Markets account
Written on March 12, 2026 at 8:00 am, by josephine
Oman ordered all vessels to leave its main oil export terminal at Mina Al Fahal as a precaution, Bloomberg reported on Thursday. The terminal handles about 1 million barrels per day (bpd) of Omani crude exports.
The order followed drone strikes on fuel tanks at Oman’s Salalah Port on Wednesday, with other drones intercepted. Bahrain’s Interior Ministry said on Thursday that Iran targeted fuel tanks at a facility in Muharraq Governorate, one of Bahrain’s four administrative regions.
Oil Prices Surge On Supply Risk
Oil prices rose after the reports. West Texas Intermediate (WTI) was up 7.35% on the day at $93.32 at the time of writing.
With crude prices jumping on the news from Oman and Bahrain, we are seeing a significant geopolitical risk premium being added to the market. The evacuation of a terminal handling around 1 million barrels per day creates immediate uncertainty over physical supply. We believe traders should consider buying short-dated call options to capitalize on any further panic-driven price spikes in the coming days.
This situation is especially serious given the market’s current tightness. Recent data from early March 2026 showed global commercial inventories sitting at their lowest level in nearly two years, providing very little cushion for supply shocks. This lack of a buffer means that even small disruptions can have an outsized impact on price, supporting a bullish outlook on crude futures for the immediate term.
We have seen this scenario before, recalling the market’s reaction in 2022 following the escalation of the conflict in Ukraine. Back then, WTI crude futures surged over 30% in just two weeks, illustrating how quickly prices can move when a major supply region is threatened. This history suggests that selling volatility or taking outright short positions is extremely dangerous until there is more clarity on the actual supply impact.
Trading And Volatility Considerations
The sharp increase in fear will cause a spike in implied volatility, making options contracts more expensive. This makes strategies like buying straddles or strangles appealing, as they profit from large price movements in either direction without needing to guess the ultimate outcome. Traders who expect a large move but are unsure of the direction should find these positions valuable in the current environment.
Looking ahead, we will be monitoring tanker traffic data around Mina Al Fahal to see if the evacuation translates into a real, sustained drop in exports. Any statements from major importing nations about potential releases from strategic reserves could also calm the market, as we saw in a smaller-scale event in 2025. If oil flows resume quickly, this price surge may be temporary, creating an opportunity to bet on prices falling back down.
Create your live VT Markets account and start trading now.
Start trading now – Click here to create your real VT Markets account
Written on March 12, 2026 at 8:00 am, by josephine