Daily Market Analysis

Market Focus

US Indices rebounded sharply today as investors stepped in to buy the dip after a huge plummet from delta variant fears sell- off. The Dow Jones up-surged 1.6%, 549.95 points after the previous 725 points- decline on Monday. The S&P 500 climbed 1.52% and the technology heavy- weighted Nasdaq 100 rose 1.57%. This comeback rally activated through the session as a bounce in the Treasury yields above 1.20% soothed some pandemic concerns that would potentially ruin the economic recovery.

Inflation seems to continue be a problem in the market, but the Federal Reserve looks to stay in hawkish stance. While the breakeven rate curve shifted lower, inflation expectation remains uncomfortably high. As of now, five- year breakeven rate is trading at 2.45%, which is above the Fed’s 2% target for the next five years.

The world largest cryptocurrency, Bitcoin, suffered a brutal month so far as Bitcoin is now trading near the bottom of 2021 trading range. Some analysts observed that it can be the winter for Bitcoin back in 2018, when the price declined by three- quarters. The winter of Bitcoin can potentially flush out a lot of speculations.


Main Pairs Movement:

The Aussie halted 4- day drop, rising 0.1% to 0.7334, as stock markets stabilized and crude oil price bounced back a bit, helping revive risk assets. However, the pandemic problem continues to be a huge issue in Australia; half of Australian is still in lockdown as the delta variant spreads across the country.

The yuan finally rose after 3- day slide as risk assets rebound, buying from the dip after a tumultuous trading session on Monday. The yuan climbed 0.1% at 6.4883 against the US dollar,

EURUSD dropped 0.17% to 1.17765, the fresh low since April even major indices rebounded after Monday’s slide.

The Pound declined 0.39% against the US dollar amid the delta variant spreads in the UK. The UK lifted all Covid-19 restriction this week, as a result, the reopening of the UK economy remained doubtful.


Technical Analysis:

GBPUSD (4-hour Chart)

Sterling once fell to the daily lowest at 1.357, refreshing another low point in recently, price was closed around 1.3625 aftermath. At the moment, the rapid spread of the Delta variant in the U.K. and prospects of further deterioration weigh on the pound as current stage. For technical aspect, RSI indicator remain setting beneath 30 at over sought territory which suggest a bearish movement for short term. On the other side, 15- and 60-long SMAs both retained downward movement. If market continuously go down, we expect the first immediately support will be 1.36 as pyscholigically spot. On contrast, the first resistance is setting at 1.3665.

Resistance: 1.3665, 1.3745, 1.3896

Support: 1.36


AUDUSD (4- Hour Chart)

Aussie had a choppy move in the daily market while once fails to overcome yearly low of 0.7299, currently close around 0.733. The Delta Covid variant break out and reflation fears keep pricing the market sentiment. Meanwhile, copper and oil market rebound from yesterday desperate that gave aussie a breathing room. From the technical perspective, despite RSI indicator close at 33 figure, suggesting pair would under bearish movement for short run. For moving average side, 15 and 60 long SMA countinue it descending way to lower low. To the downside, if pair fails to trade above recently low at .7323 level, it could hand over the fist to next lower stage over even below .7300 level.

Resistance: 0.7415, 0.7492

Support: 0.7323, 0.73


EURUSD (4- Hour Chart)

The euro fiber is posting lower lows on a daily basis, and the near-term picture is still bearish as it is throughing in fit and start decending price pattern. For technical side, RSI indicator show 42 figure that hovered by upward impetus from short term, furthermore, getting close to neutral territory. For moving average perspective, 15 long SMA indicator moving along with the price closely as slightly downward movement and 60 long SMA seems losing tailwind momentum, in other word, it getting a flat way.

Base on aforementional, we deem market is rejuvenating to upper stage if market could outstrip the first resistance at 1.1804 around. Moreover, if price could propel to higher, than next price level would eye on 1.1848~1.188.

Resistance: 1.1804, 1.1848, 1.188

Support: 1.1766, 1.17


Economic Data

Currency

Data

Time (GMT + 8)

Forecast

AUD


Retail Sales (MoM)

09:30

-0.5%

USD

Crude Oil Inventories

22:30

-4.466M

Daily Market Analysis

Market Focus

Stocks slumped around the world as investors rushed into haven assets after the delta coronavirus variant cast a pall over the economic recovery, while tension between the U.S. and China escalated. In a reversal of the reopening trade that has powered this year’s equity rally, cyclical companies bore the brunt of the rout on Monday. Commodity, financial and industrial shares led losses in the S&P 500, which fell the most in two months. The Dow Jones Industrial Average had its biggest decline since October, while small caps extended a slide from March’s peak to nearly 10%. After recently plunging to pre-pandemic levels, the CBOE Volatility Index, or VIX, soared.

The resurgence of Covid-19 is unsettling global investors, who are considering whether new lockdown restrictions will sap the economic rebound and reverse an equity rally that had driven stocks to a record. Matt Miskin, co-chief investment strategist at John Hancock Investment Management, told Bloomberg Television that the move to “higher-quality assets” such as Treasuries is justified. Americans should avoid traveling to the U.K. because of a surge in that nation’s spread of Covid-19, U.S. government and health officials warned.

“Risk aversion is firmly in place as the Delta Covid variant spread is triggering a flight to safety,” wrote Edward Moya, senior market analyst at Oanda. “Equities were ripe for a pullback given Wall Street was in agreement that this is ‘as good as it gets’ for peak earnings, economic growth, monetary stimulus. It is hard to hold risky assets over the short-term now.”

Geopolitical jitters also resurfaced on Monday after the U.S., the U.K. and their allies said the Chinese government has been the mastermind behind a series of malicious ransomware, data theft and cyber-espionage attacks against public and private entities — including the sprawling Microsoft Exchange hack earlier this year.


Main Pairs Movement:

The dollar index flirts with the 93.00 level amid the spreading risk-off sentiment across global markets. The greenback beat most of its major rivals except for JPY, which also boosted by the risk aversion. The upcoming Summer Olympics on Friday may also be a strong catalyst.

The euro pair slumped during the early European session and regained some of its losing grounds after the opening of the American trading hours, closing the day with a mild loss; commodity-linked currencies plummeted as the poor performance of stocks and commodities. Both antipodean pairs dropped over 0.5%, while Loonie surged over 1% as CAD being weighed by the severe decline in the oil price.

Cable experienced a huge plunge yesterday mostly due to the pessimistic Brexit news. News over the weekend suggested that the UK will demand the EU more flexibility over the Northern Ireland Protocol. UK Brexit Minister David Frost is said to be preparing an announcement on the matter this week. When asked about the protocol, Frost said that it will always have to be a treaty due to the special situation of Northern Ireland, adding that “the question is what is the content.”

US 10-year Treasury Bond Yield dropped below 1.200%, the first time since February. Gold price was volatile, with the yellow metal once priced below $1800 a troy ounce but ended the day with mild gains. Crude oil prices plunged amid the dismal market mood and the announcement of the OPEC+, which finally reached a deal to increase output, coupled with slowing demand. WTI trades at $66.30 a barrel, and Brent settles at $68.90.


Technical Analysis:

GBPUSD (4-hour Chart)

Sterling once fell to the daily lowest at 1.3654, the level was last spot in Feb 2021. At the moment, the dollar hovered momentum from its safe-haven demand as market worry the variant virus is getting out of hand, while UK is suffering from Brexit woes. News over the weekend suggested the UK will demand the EU more flexibility over the North Ireland Protocol. Furthermore, UK has reported rougly 40K new contagions and 10 death as country lfted most Covid-10 restriction in freedom day. For technical aspect, RSI indicator has drop below 30 that showing sterling steeping in a diabolical over sought sentiment. On the other side, 15- and 60-long SMAs has death cross in earlier session that also cripple the bull side.

If market continuously go down, we expect the next down side support will found in 1.36 as pyscholigically spot. However, as the overly plummet in a day market and reached the over sought territory, we can’t rule out the market will gain a slightly robound. Therefore, the first resistance is setting at price cluster zone at 1.3745 which also a critical support level during the last consolidation pattern.

Resistance: 1.3745, 1.3896

Support: 1.3665, 1.36


AUDUSD (4- Hour Chart)

Aussie got struck badly by risk-off sentiment by variant virus then the lowest point in more than seven months after governor extended lockdown measires to contain pandemic outbreak, and pan-commodities market were having a oneruos condition as well. Copper future market has slumped over 2.8% intraday and other industrial metals also downbeat. From the technical perspective, despite RSI indicator was record 31.6 figure, pair remaining a vital situation. Meanwhile, 15 and 60 long SMA retaining descending way to lower low. To the downside, if pair fails to trade above recently low at .7323 level, it could hand over the fist to next lower stage over even below .7300 level.

Resistance: 0.7415, 0.7492

Support: 0.7323, 0.73


USDJPY (4- Hour Chart)

Japan yen once dipped to 109.06 level, which last time seen since May 26, as market were driven by risk aversion mode while variant worries rose. At the same time, the Dow Jone shed over 900 points, its largest one-day for the year, as heating U.S. inflation fueled speculation the Fed will revoke monetize support ealier than expect. U.S. Treasuries yield overwhelming to 1.176 with contraction -1.2% rougly in daily. Japan will release National inflation data during the upcoming Asian session.

For technical side, RSI indicator show 35 figure that hover some upside momentum for short term, yet still under bearish expectation. Other than this, 15 and 60 long SMAs indicators are retaining downward slope. In the light of suggestion, we still expect yen will extend the bearish movement at least for short run. On the downside, we foresee 109.36 will be the first immediately support, if break throught the first pivot support, yen wound hobble move to the 109.04 level

Resistance: 109.713, 110.1571

Support: 109.36, 109.04


Economic Data

Currency

Data

Time (GMT + 8)

Forecast

AUD

RBA Meeting Minutes

09:30

N/A

CNY

PBoC Loan Prime Rate

09:30

N/A

USD

Building Permits (Jun)

20:30

1.7M

Daily Market Analysis

Market Focus

US market fell as the concern of inflation raised and the Treasury yields fell for a three-consecutive week. Energy and materials shares led the S&P500 lower while Amazon extended its retreat from all-time highs, sending the Nasdaq 100 lower on Friday. US stocks market erased an earlier gain this week after a report showed the University of Michigan’s preliminary sentiment index dropped to 80.8 in July from 85.5 in June. Investors wondered how long the US Fed could remained dovish stance as many countries, including Canada and New Zealand, are turning hawkish.

一張含有 文字 的圖片

自動產生的描述

OPEC+ and its allies agreed to increase more oil supplies to the market, boosting output by 400,000 barrels daily each month from August; this compromise eventually ended a two- week spat between the United Arab Emirates and Saudi Arabia. In the meantime, the compromise or the truce also eases a looming supply squeeze and reduces the risk of an inflationary oil price surge.

China signals to end $2 trillion US stock listing juggernaut. These years, many technology firms have flocked to the US stock market, due to a friendly regulatory environment in one of the world’s biggest economies. However, with the US- China tension heats up, China decides to increase the requirement for all businesses trying to go public in another countries. As a result, Hong Kong will become as an alternative for Chinese companies who plan to list in other countries.

Main Pairs Movement:

The British Pound edged lowered, trading in the near July’s lows at 1.3755 at the end of the week as the Covid-19 cases resurged to another record. While the pound was down, the US dollar regained strength after the US Retail Sales surpassed expectations by 0.6%.

The precious metal, gold, erased gains, declining 0.94%, as the Fed Chair Jerome Powell defended the stimulus plan, suggesting that it is still too early to scale back stimulus despite the inflation runs at uncomfortable levels at the moment.

The Aussie dropped 0.77%. on Friday as the US dollar regained strength amid risk. Sentiment and the better- than- expected US economic data. In the absence of high- tier Australian economic releases, the USD’s market valuation continues to impact the currency pair.

USDCAD climbed 0.67% to its highest level since April at 1.2615. Not only the US economic data has driven the US dollar, but also the falling crude oil prices have fueled USDCAD’s upside on Friday.

Technical Analysis:

XAUUSD (Daily Chart)

Gold flirst with daily lows, trading around 1815 region. Gold pulls back from weekly tops after hitting the resistance at 1829 and the upper bound of the bollinger band. The outlook remains bullish on the daily chart as gold continues to trade steadily above the 20 Simple Moving Average. In the meantime, the MACD sustains its positive tone, lending supports to bulls. One thing to consider is that the retreat from the highs is not caused by the overbought scenario. To the upside, if a break of the resistance level at 1829 is successful, then gold will have some potential to move further north, 1876. The downside pressure will occur if gold trades below the 20 Simple Moving Average.

Resistance: 1829, 1876

Support: 1770, 1676

EURUSD (4- Hour Chart)

EURUSD battles around 1.1800 after mixed US economic data. From the technical perspective, EURUSD looks to consolidate slightly below the 50 Simple Moving Average, suggesting that the pair is suffering from the downside momentum on the 4- hour chart at the moment. Additionally, the RSI is ouside of the oversold territory, indicating that there are rooms for more falls. To the downside, if the pair fails to trade above the bearish SMA, then it will have potential to aim for the next support at 1.1704. On the upside, the pair needs to trade above the SMA in order to change its current bearish stance.

Resistance: 1.1837, 1.1919, 1.1985

Support: 1.1704

GBPUSD (4- Hour Chart)

GBPUSD is pressured below 1.3800 level after the release of US Retail Sales, which upbeats the estimates. GBP suffers from downside on the 4- hour chart, trading below the 20 and the 50 Simple Moving Averages whilist having a negative MACD. The pair is expected to continue falling as the RSI has not yet reached the oversold territory, giving rooms to decline further. However, the decline of GBPUSD might not persist as the pair has reached the lower bound of the bollinger band, which is due to a pullback. That being said, the price action looks to fall in between 1.38 and 1.3744 for the next trading days.

Resistance: 1.3926, 1.4000

Support: 1.38, 1.3744, 1.3675

Economic Data

Currency

Data

Time (GMT + 8)

Forecast

GBP

MPC Member Haskel Speaks

18:00

N/A

BRL

BCB Focus Market Readout

19:25

N/A

VT Markets The Adjustment Of Weekly Dividend Notification

Dear Client,

Warmly reminds you that the component stocks in the stock index spot generate dividends. When dividends are distributed, VT Markets will make dividends and deductions for the clients who hold the trading products after the close of the day before the ex-dividend date.

Indices dividends will not be paid/charged as an inclusion along with the swap component. It will be executed separately through a balance statement directly to your trading account, the comment for which will be in the following format “Div & Product Name & Net Volume ” .

Please note the specific adjustments as follows:

If you’d like more information, please don’t hesitate to contact [email protected].

Daily Market Analysis

Market Focus

U.S. stocks declined and Treasury yields turned lower again as Fed Chair Jerome Powell’s persistent dovishness raises concern about the sustainability of the economic recovery. Communication services, energy and technology shares weighed on the benchmark S&P 500. Growth favorites that led the recent rally such as Amazon.com and Google parent Alphabet dropped from recent all-time highs, sending the Nasdaq 100 lower (-0.70%, or -101.82). Dow Jones plummeted intraday but rebounded and closed the day with mild gains (+0.15%, or +53.79).

For a second day, Federal Reserve Chairman Jerome Powell defended the central bank’s stance to keep providing support to the U.S. economy even as inflation runs at uncomfortable levels. “This is a shock going through the system associated with the reopening of the economy and it’s driven inflation well above 2%, and of course we’re not comfortable with that,” Powell told the Senate Banking Committee Thursday.

The Fed chair called the price developments “unique” in history and said the central bank is closely watching to see whether its forecast that the high inflation will prove temporary is correct, or whether it threatens to be longer lasting. “So we’re really trying to understand the base case and also the risks,” he said.

This was Powell’s second round of testimony this week on Capitol Hill. On Wednesday, he was peppered with questions about surging prices from lawmakers serving on the House Financial Services Committee. Powell said the surge in inflation so far had been concentrated in a limited number of areas, such as used car prices, and reiterated that he expects those increases to be transitory.

Jerome Powell speaks during a Senate Banking Committee hearing in Washington on July 15.” To the extent that it’s temporary it wouldn’t make sense to react to it,” he said, though officials don’t know how much longer price pressures from these sources would remain elevated. “We also don’t know whether there are other things that will come forward and take their place,” he said.

The Fed is currently buying $120 billion of assets per month — $80 billion of Treasury securities and $40 billion of mortgage-backed debt – and has pledged to keep up that pace “until substantial further progress” has been made toward its goals of maximum employment and 2% inflation.


Main Pairs Movement:

Lower than expected Chinese growth undermined the market’s sentiment at the beginning of the day. The sour mood extended during US trading hours, with the dollar making the most out of it, gaining ground against most of its major rivals.

US Federal Reserve chief Jerome Powell testified for a second consecutive day on monetary policy before Congress. His dovish stance added to the dismal sentiment, alongside mostly soft US data.

The euro pair hovers around 1.1800 while Cable approaches 1.3800, after flirting with 1.3900 earlier in the day. Michael Saunders, a policymaker from the Bank of England said that during the upcoming months, they would discuss whether to curtail the current assets purchase program and/or take further policy action next year. He clarified that if the “bank rate does rise in the next year or so, it is likely that any rise would be relatively limited.”

Commodity-linked currencies also edged lower, with both antipodean pairs dropped around 0.75%, and CAD being the worst performer against the greenback amid persistent oil weakness. WTI extended its slide and finished the day around $71.50 a barrel, while Brent dropped around 1.72% in the previous day and trades at 73.24 as of writing.

Gold prices consolidated weekly gains, ending the day at $1,828.50 a troy ounce. US 10-year Treasury Bond yield proceeded yesterday’s decline, plummeting near the 1.30 level.


Technical Analysis:

XAUUSD (Daily Chart)

Gold remains positive after benefiting from the Fed’s dovish monetary policy. Gold extends its bullish tone toward 1830, the highest since June. From the technical aspect, as gold continues to trade above the 20 simple moving average, its near- term trend is bullish. To the upside, if a break of 1829 is successful, then the upside momentum is expected to extend further north toward 1876 since the RSI is far away from the 70 reading; at the same time, the upside momentum is supported by a strongly positive MACD. On the other hand, gold will become negative tone if it falls below the 20 SMA, around 1790 level.

Resistance: 1829, 1876

Support: 1770, 1676


EURUSD (4- Hour Chart)

EURUSD remains pressured around 1.1800 level as the Fed Powell maintains dovish stance. The pair holds near its daily lows, turning its near- term momentum into a negative tone on the 4- hour chart. After declining below the 20 and 50 simple moving averages, the pair fails to attempt running above them. EURUSD remains bearish as the RSI has not yet reached the oversold territory, providing rooms to extend further south. If the selling interests continue, then the pair has some potential to head toward the support at 1.1704. On the other hand, the pair needs to climb above the simple moving averages first in order to reclaim its bullish tone.

Resistance: 1.1837, 1.1919, 1.1985

Support: 1.1704


GBPUSD (4- Hour Chart)

GBPUSD trades below 1.3850 after the Bank of England urges cutting some supports to the UK economy. From the technical perspective, after trading in between the resistance of 1.3926 and the support at 1.38, GBPUSD looks to consolidate this week so far. The short- term momentum turns bearish as the pair trades below the 20 simple moving averages and the midline of the bollinger band on the 4- hour chart. To the downside, the pair is expected to head toward the immediate support level at 1.38; if a break of the hurdle occurs, then the pair will have some potential to move further south, contesting 1.3744.

Resistance: 1.3926, 1.4000

Support: 1.38, 1.3744, 1.3675


Economic Data

Currency

Data

Time (GMT + 8)

Forecast

NZD

CPI (QoQ) (Q2)

06:45

0.8%

JPY

BoJ Monetary Policy Statement

11:00

N/A

JPY

BoJ Outlook Report (YoY)

11:00

N/A

JPY

BoJ Press Conference

11:00

N/A

EUR

CPI (YoY) (Jun)

17:00

1.9%

USD

Core Retail Sales (MoM) (Jun)

20:30

0.4%

USD

Retail Sales (MoM) (Jun)

20:30

-0.4%

VT Markets Notification of Server Upgrade

Dear Client,

As part of our commitment to providing the best reliability and service to our customers, we are planning an upgrade in our server on July 17th 2021.

As a result, we will be conduct maintenance according to the schedule below.
Start date and time: 2021-07-17 15:00 GMT+3(Server time)
End date and time: 2021-07-17 19:00 GMT+3(Server time)

The impact can only make customers be unable to log in to the MT4 /MT5 software temporarily, and that won’t affect any order which has been opened.

After the upgrade, clients can login to MT4/ MT5 software using the server which is shown in the account activation mail.

No action is required by our customers. Your services will come back online at the end of the maintenance.

Thank you for your patience and understanding with regard to this important initiative.

If you have any questions, our team will be happy to answer your questions.Please mail to [email protected] or contact the service online.

Daily Market Analysis

Market Focus

US equities edged slightly higher on Wednesday as Fed Chair Jerome Powell reiterated that current price surge is temporary. The Nasdaq and Dow Jones Industrial Average index both climbed 0.13%, while the S&P 500 index gained little as 0.05%. On the earnings front, Bank of America failed to delivery upbeat earnings, while Wells Fargo & Co. beats analyst estimates. The 10-year US Treasury yield retreated 7 basis points to 1.35%.

During Powell’s testimony in the House, he repeatedly said the Fed believes price increases are linked to recovery in pandemic most impacted industries, and the central bank stands ready to change its policy if inflation expectation overshoot. Regarding demand and supply mismatch in the labor market, he commented such mismatch should be temporary, noting that extra unemployment insurance will soon expire for most states, so it won’t be a factor for much longer. Powell was also asked about the increase in house prices, one of the most critical sectors that elevated recent US CPI. He said the Fed has limited capacity to do anything about it, and purchase of MBC should not cause any material impact to housing market.

Bank of Canada kept interest rate unchanged at 0.25%, and here are Bloomberg’s key takeaways from its monetary policy report:

 The central bank will cut its bond purchases by a third to C$2 billion a week.
 Governor Tiff Macklem emphasized that many drivers of higher inflation are temporary and include supply bottlenecks that will be resolved.
 There’s still a lot of room for growth in the labor market.
 Macklem said nothing would change investors perceptions of divergence with Fed. And he seems to be fine with BoC as an outlier.


Main Pairs Movement:

Kiwi dollar soared 1.28% on Thursday as RBNZ announced it will reduce monetary stimulus. Governor Adrian Orr said it will halt bond buying under its Large-Scale Asset Purchase program by July 23rd. This surprising move prompt speculators to expect some sort of rate hikes as early as this August.

Hawkish announcement from Bank of Canada initially delivery a decent boost to the Canadian dollar, gained as much as 0.68%. However, the oil-linked currencies pared all of its gains as crude oil price tanked. The UAE has finally reached a preliminary deal to resolve its standoff with OPEC+, newly set baseline for UAE is 3.65 million barrels a day from May 2022, marked a 0.48 million barrels increase from current level. The increase in overall supply weighed down on the WTI and Brent crude oil futures, plunged 2.82% and 2.26% respectively.

US dollar was on the back foot against its G-7 peers, with the dollar index dipping 0.37%. The retreat was attributed to Powell’s comment to water down heated discussion of potential early Federal Reserve asset purchase tapering, explicitly stated “While reaching the standard of ‘substantial further progress’ is still a ways off, participants expect that progress will continue.”


Technical Analysis:

XAUUSD (Daily Chart)

The precious metal, gold, jumps to one- month tops, 1820 region, after the Fed Chair Jermone Powell’s dovish comments. After three days of consolidation, gold seems to have confirmed a near- term bullish trend. The upside momentum is expected to keep up its strength as the positive MACD is getting solid and the RSI is not yet in the overbought territory, providing gold rooms to extend further north. The next resistance is pegged near 1829; if a breach of 1829 is successful, then it will head toward the next hurdle at 1876 before reclaiming the 1900. To the downside, the near- term trend will turn bearish if gold trades below the midline of the bollinger band or the 20 SMA, around 1787 region.

Resistance: 1829, 1876

Support: 1770, 1676


EURUSD (4- Hour Chart)

EURUSD recaptures 1.1820 level after the Fed Powell’s dovish comments. From the technical perspective, EURUSD pulls back after reaching the lower bound of the bollinger band on the 4- hour chart; however, the intraday bias remains bearish since the pair still trades below the 20 and 50 simple moving averages. At the moment, the pair is contesting its minor resistance at 1.1837; if the pair can breach 1.1837, then the bias will become bullish. The pair has some potential to penetrate as the RSI has not reached the overbought territory, giving some rooms to move upward. That being said, the recovery can extend, but needs to trade beyond a critical Fibonacci resistance level at 1.1837.

Resistance: 1.1919, 1.1985

Support: 1.1837, 1.1704


GBPUSD (4- Hour Chart)

GBPUSD trades toward 1.3900 amid the UK’s strong inflation data and Powell’s dovish comments. From the technical aspect, the intraday bias turns neutral after the previous slides. The support pivot at 1.3800 successfully holds the ground, resulting in a momentum change in GBPUSD. As the time of writing, the pair hovers around, 1.3858, the midline of the bollinger band; the pair is lack of directions as the MACD is currently neutral and the RSI reading is around 50. If a break of the midline of the bollinger band occurs, then the pair will have some potentials to contest the next immediate resistance at 1.3926; on the other hand, if the pair fails to breach the midline, then it will potentially head toward 1.38, turning back to bearish mode.

Resistance: 1.3926, 1.4000

Support: 1.38, 1.3744, 1.3675


Economic Data

Currency

Data

Time (GMT + 8)

Forecast

AUD

Employment Change (Jun)

09:30

30K

CNY

GDP (YoY) (Q2)

10:00

8.1%

CNY

Industrial Production (YoY) (Jun)

10:00

7.8%

GBP

Average Earnings Index +Bonus (May)

14:00

7.1%

GBP

Claimant Count Change (Jun)

14:00

N/A

USD

Initial Jobless Claims

20:30

360K

USD

Philadelphia Fed Manufacturing Index (Jul)

20:30

28

USD

Fed Chair Powell Testifies

21:30

N/A

Daily Market Analysis

Market Focus

U.S. stocks fell to reverse course on Tuesday, with the S&P 500 pulling back from a record high as investors monitored an early batch of corporate earnings results. Inflation was also back in focus as new data showed consumer prices surged by the most since 2008 in June. Dow Jones retreated 0.31%, or 106.93, to 34889, and Nasdaq declined 0.38%, or 55.59, to 14677.65.

一張含有 文字 的圖片

自動產生的描述

Six months into his presidency, Joe Biden is revealing a hard-edged China policy that suggests relations between the world’s two biggest economies are only going to get worse.

A spate of U.S. actions in recent days — including a warning to American businesses in Hong Kong, new import controls for the Xinjiang region and talks about a digital trade agreement that would exclude Beijing — underscore that Biden plans to extend and deepen President Donald Trump’s more confrontational approach.

Biden administration officials say the U.S. strategy is a reaction to China’s own aggressive behavior. That stance will force tough choices for investors and companies caught in the middle of what Biden himself has defined as a defining battle of the 21st century, and may come as a surprise to those who expected a softer touch under the Democratic president.

“It’s very clear that the U.S. under the Biden administration is going to continue with the trend that we saw during the Trump administration and before,” said David Loevinger, managing director of emerging markets at TCW Group Inc. “There’s some disappointment — investors had expected a different approach.”

Beijing officials may have expected a difference, too, after the tumult of the Trump years. But in Washington, Biden administration officials point to a series of hostile actions by President Xi Jinping’s government that they say forced the U.S. hand, adding that the challenge now is to keep the relationship in the realm of competition, not conflict. Recent actions on both sides show how hard that will be to achieve.


Main Pairs Movement:

The dollar approaches its monthly high against most major rivals, boosted by climbing US inflation. The US Consumer Price Index was upwardly revised in June to 5.4% YoY, much higher than the expected 4.9%. The core reading also rose from 3.8% to 4.5%. The figures revived speculation about a tighter monetary policy, despite policymakers work hard on cooling down such expectations.

The euro pair reached a fresh multi-month low of 1.1780, holding nearby ahead of the Asian opening. Cable hovers around 1.3820, while the antipodean pairs near their yearly low, with Aussie at 0.7440 level and Kiwi below 0.7000.

Loonie extended further north regardless of higher oil prices. WTI moved above $75.00 a barrel amid expectations of a further draw in US inventories. Brent also climbed to $76.50 a barrel as speculation of tighter supply due to the OPEC+’s disagreement on higher output.

Gold prices were quite volatile after the release of US inflation figures, but the yellow metal is ending the day pretty much unchanged at around $1,808 a troy ounce.

The focus shifts to Semi-Annual US Fed chair Jerome Powell testifies, as well as RBNZ and Bank of Canada’s Interest rate decisions, and British inflation figures.

On the other hand, the coronavirus Delta variant is dominant in the Northern Hemisphere and the number of new cases is on the rise in the US and Europe. Fears about it delaying the economic comeback weigh on investors’ mood.

Cryptocurrencies act dully in recent days ahead the largest unlocking of Grayscale Bitcoin Trust share. On July 17, 16,240 bitcoin worth of GBTC becoming available to trade, and fears of a potential sell-off looms as Bitcoin has declined 4.35%, and Ethereum has fallen 9.3% since the start of the week.


Technical Analysis:

XAUUSD (Daily Chart)

From the technical aspect, the dominant trend remains bullish on the daily chart as it continues trading within the upper region of the bollinger band, even though it seems to enter into a consolidated phase recently. The upside momentum is favored by the positive MACD and the neutral RSI of 50, giving gold some potential to move further north. If the upside momentum is sustained, then gold is expected to move toward 1829; afterward, the momentum might confront pressures as it will reach the upper bound of the bollinger band. To the downside, if gold trades below the midline of the bollinger band, it will head toward 1770.

Resistance: 1829, 1876

Support: 1770, 1676


EURUSD (4- Hour Chart)

EURUSD heads toward 1.1800 region as the US dollar gains strength after the Core CPI data. On the 4- hour chart, intraday bias has turned to the downside as the price action is below the 20 and the 50 SMAs, indicating that the bulls vanish at the moment. Additionally, the double top pattern also confirms the bearish mode of the pair. From the technical indicator, current MACD is negative, which lends supports to bears; however, the bearish momentum looks to weaken at the moment as the RSI is near oversold condition, signaling that the bears might need a break before heading to the next immediate support at 1.1704.

Resistance: 1.1919, 1.1985

Support: 1.1837, 1.1704


GBPUSD (4- Hour Chart)

GBPUSD stablizes above 1.38 amid the US upbeat Core CPI and the UK’s reopening. From the technical perspective, the dominant trend for GBPUSD has turned into the downside as the double top pattern has been formed on the 4- hour chart. During the second peak, the RSI was not in the overbought territory; by this, it confirms a start of the bearish momentum for the pair. Moreover, the bearish momentum is also supported by a negative MACD while the pair is trading in the lower area of the bollinger band. All in all, GBPUSD is expected to head toward the next support level at 1.38; if a break of 1.38 is successful, then the pair has some potential to continue trade toward 1.3744.

Resistance: 1.3926, 1.4000

Support: 1.38, 1.3744, 1.3675


Economic Data

Currency

Data

Time (GMT + 8)

Forecast

NZD

RBNZ Interest Rate Decision

10:00

0.25%

NZD

RBNZ Rate Statement

10:00

N/A

GBP

CPI (YoY) (Jun)

14:00

2.2%

USD

PPI (MoM) (Jun)

20:30

0.6%

CAD

BoC Monetary Policy Report

22:00

N/A

CAD

BoC Interest Rate Decision

22:00

0.25%

USD

Crude Oil Inventories

22:30

-4.359M

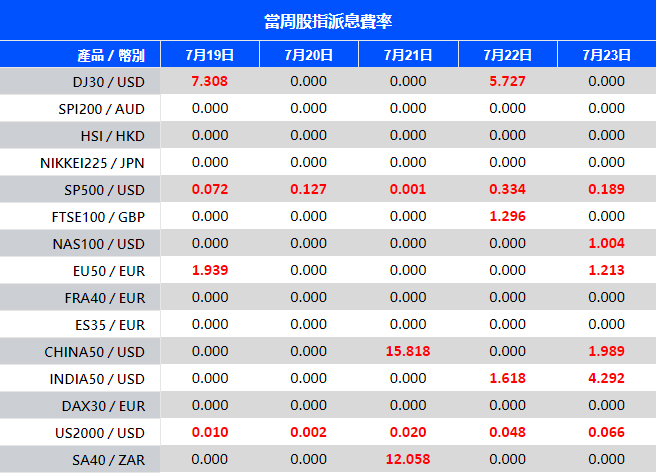
VT Markets The notification of new product launched

Dear Client,

To provide our clients with a wealth of trading options, VT Markets will launch new products on July 19, 2021.

The details as shown in the table below.

The above data is for reference only, please refer to the MT4/MT5 software for specific data.

If you’d like more information, please don’t hesitate to contact [email protected].

Daily Market Analysis

Market Focus

US equities market broke record high as investors are optimistic about earnings season. The three big indices climbed around 0.35% on Monday. Financials shares led the gains within S&P 500 index, while Consumer Staples stocks lagged slightly behind. Large banks such as Bank of America, Goldman Sachs, and JPMorgan will kick off earnings season this week.

White House officials are proposing a digital trade agreement with Indo-Pacific economies including Canada, Japan, Malaysia, Australia, New Zealand and Singapore. Such agreement aims to curb China’s influence in the region, and get the United States back in the trade game in Asia. According to Bloomberg, the deal could set out rules on the use of data, trade facilitation and electronic customs arrangements.

ECB President Christine Lagarde told investors to buckle-up for new guidance on monetary stimulus in 10 days. She said that “given the persistence that we need to demonstrate to deliver on our commitment, forward guidance will certainly be revisited.” Lagarde also mentioned the current 1.85 trillion-euro bond-buying plan to run at least until March 2022, and hinted ECB might adopt fresh measures after the emergency bond program ends.


Main Pairs Movement:

US dollar was best performer among its G-7 peers as high inflation pressure continues to favor the greenback. The New York Fed’s Survey of Consumer Expectations for June indicates expected inflation over the next 12 months rose to 4.8%. Despite Fed’s effort to ease hyperinflation fears, but inflationary data are popping out from every corner in the economy, constantly rising skepticism on Federal Reserve’s transitory talks. Such anxiety will persist until investors see a deceleration in inflation tracked index such as CPI and PPI.

Gold price is sitting comfortably above $1800 amid worries of spreading delta variant. However, the mutated virus should not be a strong supporter to move the precious metal since health authorities around the World are much more capable to contain COVID-19 with the help of lockdowns and vaccines.

Oil prices retreated on Monday with the Brent and WTI futures dipped 0.52% and 0.62% respectively. Demand for crude oil was on a downhill in South Asian countries during nationwide lockdown. According to Bloomberg, Indonesian motor fuel demand will drop by 8% in the third quarter compared with May, while Malaysia will witness a plunge of 17% over the same period.


Technical Analysis:

XAUUSD (Daily Chart)

Gold remains depressed amid the US dollar’s strength; however, the downside seems limited. On the daily chart, gold hovers above the midline of the bollinger band during the American session. It seems that gold needs to condolidate before heading toward the resistance 1829; the near- term outlook remains bullish as the MACD is leaning up and the RSI reading is around 48, outside of the overbought region, giving gold spacious rooms to head upward. If gold successfully breaks its current consolidation, it is expected to see another pause around 1829 because 1829 is not only the resistance but also the upper bounce of the bollinger band, due to a bounce back.

Resistance: 1829, 1876

Support: 1770, 1676


EURUSD (4- Hour Chart)

EURUSD trades around 1.1850 level as the US dollar recovers strength. A new rise in Covid-19 cases and US inflation figures are awaited. From the technical perspective, the 20 simple moving average contains advances while EURUSD has bounced from the bullish 10 SMA on the 4- hour chart. In the meantime, the pair has breached the descending trend line, which indicates that the bullish momentum has been formed in the near- term. As the RSI reading falls outside of the overbought territory, the pair still has some potential to move further north toward its resistance at 1.1919.

Resistance: 1.1919, 1.1985

Support: 1.1837, 1.1704


GBPUSD (4- Hour Chart)

The British Pound slides toward 1.3870 against the US dollar as the UK might raise the restriction due to the rising cases of Covid-19. On the 4- hour chart, short- term outlook remains positive as GBPUSD still stays above the previous descending trend line, meaning that the bullish momentum still exists. The bullish mode is supported by a positive MACD as well as a RSI of 58, suggesting that the upside still has some potentials. It is expected to see the price action toward its resistance at 1.3926, then it will either consolidate or pullback as the RSI will likely to surpass 70 during that time. After, if a break of 1.3926 is successful, then it will head to 1.4000, a psychological resistance.

Resistance: 1.3926, 1.4000

Support: 1.38, 1.3675


Economic Data

Currency

Data

Time (GMT + 8)

Forecast

USD

Core CPI(MoM)(June)

20:30

0.4

Back To Top
server

Hello there 👋

How can I help you?

Chat with our team instantly

Live Chat

Start a live conversation through...

  • Telegram
    hold On hold
  • Coming Soon...

Hello there 👋

How can I help you?

telegram

Scan the QR code with your smartphone to start a chat with us, or click here.

Don’t have the Telegram App or Desktop installed? Use Web Telegram instead.

QR code