Back

From the Oil Crisis to Today: How Wars Drive Gas Prices

Key Takeaways

  • Conflicts involving major oil-producing regions often trigger spikes in global oil and gas prices.
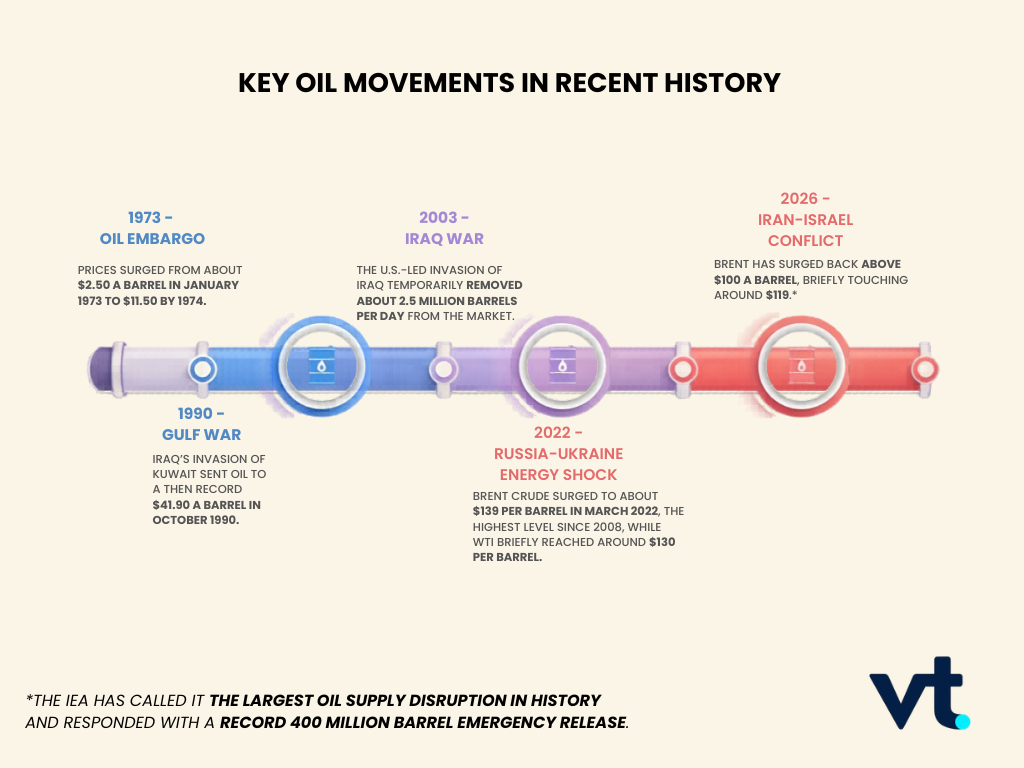
  • Historical events such as the 1973 oil embargo and the Gulf War show how quickly geopolitical shocks can move energy markets.
  • The Iran–Israel conflict has raised similar concerns because the Middle East remains central to global oil supply.

Fuel prices are closely tied to global geopolitics. When conflicts occur in energy-producing regions, oil markets often react quickly, pushing crude prices higher and eventually raising gas prices for consumers.

This dynamic has played out repeatedly throughout modern history. From the 1973 oil crisis to more recent geopolitical conflicts, wars that threaten oil production or transport routes have often triggered energy price shocks.

Today, concerns about the Iran–Israel conflict and gas prices reflect a familiar pattern. Markets are once again watching developments in the Middle East closely because the region remains a major source of global oil supply.

Understanding how wars affect energy markets can help explain why fuel prices often rise during periods of geopolitical tension.

The 1973 Oil Crisis: The First Global Energy Shock

One of the most significant examples of war driving fuel prices higher occurred during the 1973 oil crisis.
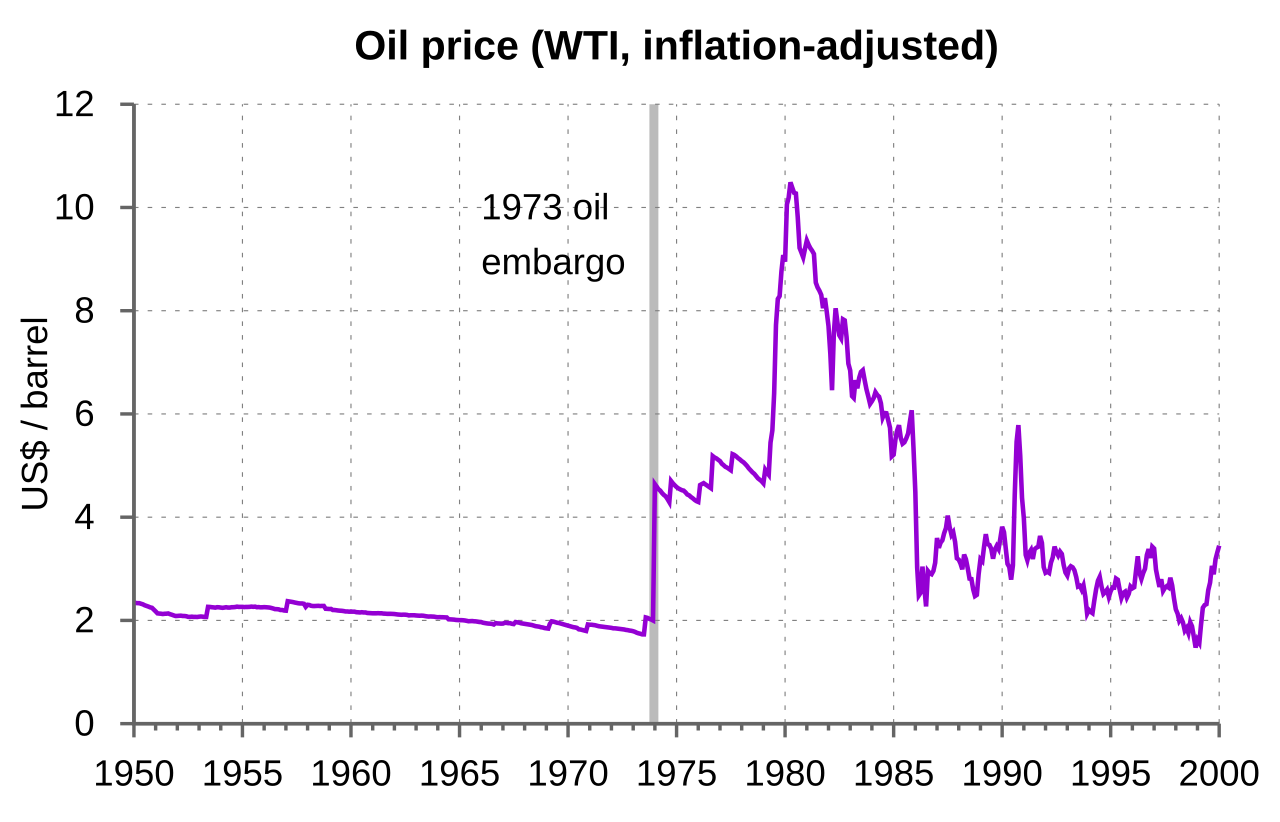
Source: Wikipedia

Following the Yom Kippur War between Israel and several Arab states, members of the Organization of Petroleum Exporting Countries (OPEC) introduced an oil embargo against nations that supported Israel.

The consequences were immediate.

Oil prices quadrupled within months, fuel shortages spread across Western economies, and long lines formed at petrol stations. The surge in energy costs contributed to inflation, economic slowdown, and lasting changes in global energy policy.

The crisis demonstrated how geopolitical tensions in the Middle East could rapidly destabilise energy markets and push gas prices higher worldwide.

The Gulf War and Oil Market Volatility

Another major example occurred during the 1990 Gulf War, when Iraq invaded Kuwait.

At the time, both countries were major oil producers. The invasion raised fears that oil production across the region could be disrupted.

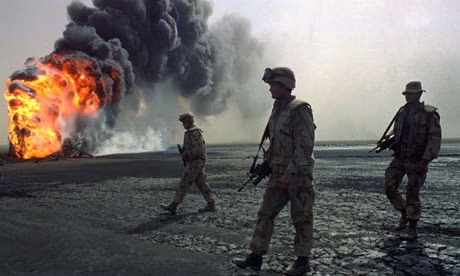
Source: The Guardian

As uncertainty spread through energy markets, oil prices surged sharply within weeks. Traders anticipated potential supply shortages and began pricing in geopolitical risk.

Although production eventually stabilised after international intervention, the episode reinforced an important lesson for energy markets. Even the threat of conflict in major oil-producing regions can drive significant price volatility.

The Russia–Ukraine War and the Modern Energy Shock

More recently, the Russia–Ukraine war triggered another major energy price surge.

Russia is one of the world’s largest producers of oil and natural gas. When the conflict began in 2022, global energy markets reacted quickly to fears of supply disruptions and sanctions targeting Russian exports.

Oil prices climbed sharply and natural gas prices surged across Europe. Fuel costs rose worldwide, contributing to inflation and forcing governments and central banks to respond to rising energy bills.

The crisis demonstrated once again how closely global fuel prices are linked to geopolitical stability.

Why the Iran–Israel Conflict Matters for Oil Markets

The current Iran–Israel conflict has renewed concerns about gas prices because of the Middle East’s critical role in global energy supply.

Several factors make the region particularly important for oil markets.

Strategic shipping routes

One of the most important is the Strait of Hormuz, a narrow passage between Iran and Oman. Roughly one-fifth of the world’s oil shipments pass through this route each day.

Any disruption to shipping traffic in the Strait of Hormuz could affect global oil supply and push crude prices higher.

Regional oil production

The Middle East remains one of the largest oil-producing regions in the world. Countries across the Gulf export millions of barrels of oil each day to global markets.

Escalating conflict in the region raises the risk that production or transport infrastructure could be disrupted.

Market psychology

Energy traders often react to geopolitical risks before supply disruptions actually occur. Even the possibility of escalation can cause oil prices to move higher as markets attempt to price in uncertainty.

This is why news about the Iran–Israel war and gas prices often appear together in financial headlines.

Why Oil Prices Affect Gas Prices

Crude oil typically represents the largest component of the price consumers pay at the pump.

When oil prices rise because of geopolitical tensions, refiners pay more for raw crude. Those costs move through the supply chain, eventually raising petrol and diesel prices for drivers.

As a result, global conflicts that push oil prices higher often lead to higher gas prices as well.

Oil movements have more than just an influence on gas prices. Read more about how oil prices play a role in the AI revolution here.

What History Suggests About Future Gas Prices

History shows that geopolitical conflicts often trigger temporary spikes in oil prices and fuel costs.

However, the long-term impact can vary depending on several factors:

  • Whether oil supply is actually disrupted
  • How long the conflict lasts
  • How quickly producers adjust output to stabilise markets

In many cases, prices stabilise once markets gain confidence that supply will remain stable. In other situations, prolonged tensions can keep energy markets volatile for extended periods.

Because the global economy depends heavily on oil, geopolitical developments will likely continue to influence fuel prices for years to come.

The Bottom Line

From the 1973 oil embargo to the Russia–Ukraine war, history shows that geopolitical conflicts often lead to spikes in oil and gas prices.

The Iran–Israel conflict has raised similar concerns because of the Middle East’s central role in global energy supply and the importance of shipping routes such as the Strait of Hormuz.

While the long-term impact on gas prices will depend on how events unfold, one lesson from history remains clear. When conflict threatens global energy supply, oil markets react quickly, and fuel prices often follow.

For more market commentary, explore the latest Analysts’ report on VT Markets.

Refresher

  1. Why does the Iran–Israel war affect gas prices?
    The Iran–Israel war affects gas prices because conflicts in the Middle East can disrupt global oil supply and shipping routes. When traders fear supply shortages, crude oil prices often rise, which can then push petrol and diesel prices higher.
  2. Does war always make gas prices go up?
    War does not always lead to higher gas prices, but it often does when the conflict involves major oil-producing regions or key transport routes. Markets tend to react quickly to supply risks, even before actual disruptions happen.
  3. Why do Middle East conflicts affect fuel prices worldwide?
    Middle East conflicts affect fuel prices worldwide because the region plays a major role in global oil production and export flows. Important routes such as the Strait of Hormuz handle a large share of global oil shipments, so any threat to supply can raise prices internationally.
  4. How quickly do oil price spikes affect petrol prices?
    Oil price spikes can affect petrol prices within days or weeks, depending on the country and the fuel supply chain. The final impact depends on refining costs, transport costs, taxes, and how quickly retailers adjust pump prices.
  5. Have wars caused major fuel price spikes before?
    Yes. Historical examples include the 1973 oil crisis, the 1990 Gulf War, and the 2022 Russia–Ukraine war. In each case, geopolitical conflict created supply fears that pushed oil and fuel prices higher.
  6. What is the connection between oil prices and gas prices?
    Oil prices are a major component of gas prices because crude oil is refined into petrol and diesel. When crude oil becomes more expensive, the cost of producing fuel usually rises as well, which can lead to higher prices at the pump.
  7. Could gas prices fall even if the conflict continues?
    Yes. Gas prices can fall if markets believe supply will remain stable, if oil producers increase output, or if demand weakens. Fuel prices depend on market expectations as much as on the conflict itself.
  8. Why do traders watch the Strait of Hormuz so closely?
    Traders watch the Strait of Hormuz because it is one of the world’s most important oil shipping routes. Any disruption there can slow global energy flows and quickly push oil prices higher.

Start trading now – Click here to create your real VT Markets account

Intervention worries lift the yen slightly; USD/JPY eases in Asia, ending three-day rise near 159.40-159.45

USD/JPY met selling pressure in the Asian session on Friday, ending a three-day rise and slipping back from the 159.40–159.45 year-to-date high. It fell to around 159.00, with limited follow-through on the downside. The yen moved back to levels that prompted rate checks in January, raising talk of official action to slow further weakness. This weighed on USD/JPY alongside a modest dip in the US dollar, though a larger fall in the pair has not developed.

Energy Prices And Boj Constraints

Japan’s reliance on energy means higher crude oil prices could lift consumer prices and weigh on growth. This could complicate the Bank of Japan’s move away from easy policy and reduce demand for the yen, supporting USD/JPY. The US dollar has also been supported by fewer expectations for near-term Federal Reserve rate cuts. Middle East tensions and the closure of the Strait of Hormuz have kept oil prices high, adding to inflation risks that could delay US rate cuts and underpin USD/JPY. Markets are waiting for the US Personal Consumption Expenditures (PCE) Price Index later today for guidance on rate policy. Despite the pullback, USD/JPY is still set for a fourth straight weekly gain. The current pressure we are seeing on the yen feels familiar, especially as USD/JPY tests the 165.00 level. This situation brings back memories of last year when similar levels around 159.00 prompted rate checks from Japanese authorities. Given the risk of intervention, buying spot is dangerous, but the fundamental weakness of the yen persists.

Positioning And Options Strategy

This weakness is largely because the Bank of Japan’s hands are tied, a problem we also saw in 2025. Japan’s latest core inflation figures are still hovering at 2.5%, well above the target, which complicates any policy moves. The stagflationary threat from rising energy costs remains a key factor preventing traders from making aggressive bets on a stronger yen. On the other side, the US Dollar remains supported as hopes for further Federal Reserve rate cuts this year fade. After a few initial cuts, persistent inflation has led markets, as reflected by the CME FedWatch Tool, to price in a less than 20% chance of a rate cut in the next meeting. This interest rate difference between the US and Japan continues to act as a strong tailwind for the USD/JPY pair. For derivative traders, this environment suggests buying call options on USD/JPY to capture further upside while capping potential losses from a surprise intervention. The defined risk of an options contract is preferable to the unlimited risk of a short yen position if the Ministry of Finance suddenly steps in. We should pay close attention to rising implied volatility, as it signals the market’s growing fear of such an event. Furthermore, the recent climb in WTI crude oil prices back to $85 a barrel mirrors the energy price surge we observed last year. As an energy-dependent nation, this puts direct pressure on Japan’s economy and its currency. This reinforces the core view that any dips in USD/JPY are likely to be short-lived and viewed as buying opportunities. Create your live VT Markets account and start trading now.

Start trading now – Click here to create your real VT Markets account

S&P 500 Faces A Harder Macro Backdrop

Key Points

  • SP500 trades at 6690.15, up +6.53 (+0.10%), but price remains below MA10 6783.72, MA20 6832.41, and MA30 6856.65.
  • Traders are no longer fully pricing even one Fed rate cut this year, versus two rate cuts at the end of February.
  • Brent surged more than 10% at one point to $101.59 per barrel, while the dollar has gained over 2% against six major rivals since the war began.

The S&P 500 is trying to stabilise, but the macro backdrop has turned more hostile. Markets are now adjusting to the prospect of a longer Middle East war, oil prices staying near the $100 per barrel area, and a more stubborn inflation outlook.

That mix has pushed traders toward a stagflation framework, where growth slows while price pressure stays high. Reuters reported that Wall Street fell sharply on Thursday as crude surged and traders reassessed the path for rates and growth.

That is a difficult setting for equities. Higher oil acts like a tax on consumers and businesses. It squeezes margins, weakens confidence, and pushes bond yields higher at the same time. If the shock lasts, traders may continue trimming exposure to broad equity indices rather than rushing back into dip-buying.

If oil holds near $100 and yields stay firm, the S&P 500 may struggle to build a lasting rebound and could remain vulnerable to rallies that fade.

Rate-Cut Hopes Have Reversed Fast

The biggest shift sits in rates. Traders are no longer fully pricing even one rate cut from the Federal Reserve this year, compared with pricing two rate cuts at the end of February. That is a major reset in a short period.

Fed funds futures have pushed easing expectations further out, with traders increasingly questioning whether the Fed can cut while energy-driven inflation risk remains elevated.

The pressure is not limited to the US. For the European Central Bank, money markets have fully priced a rate hike by July and a 70% chance of a second increase by December, compared with a roughly 40% chance to a rate cut before year-end in February.

Euro area Bund yields have risen to their highest level in almost 2-1/2 years, while the US two-year Treasury yield hit a six-month high.

For equities, this matters because it changes valuation support. If traders stop expecting cuts, the market loses one of its main cushions.

If central banks keep sounding wary on inflation next week, the S&P 500 may remain under pressure, especially in rate-sensitive sectors.

The Oil Shock Still Drives the Tape

Oil remains the central driver. Brent rose more than 10% at one point to $101.59 per barrel, and Reuters reported it was later up 7.9% at $99.21 in Asia trade even after the IEA agreed to release a record 400 million barrels from strategic stockpiles. The market response stayed muted because traders still doubt policy measures can fully offset the supply disruption.

Oil volatility also remains extreme. Reuters reported the Cboe oil volatility index, OVX, surged to 121.01, its highest level since the early stage of the COVID shock in 2020. That tells you traders still see wide daily ranges and poor visibility.

Even the better news has only softened the damage, not removed it. The US issued a 30-day waiver for countries to buy sanctioned Russian oil and petroleum products stranded at sea, but the reaction stayed limited because the broader bottleneck in Middle East energy flows has not been solved.

If oil volatility stays elevated and Hormuz traffic remains impaired, equities may keep trading with a heavy tone and higher downside sensitivity to headlines.

Dollar Strength Adds Another Headwind

The only clear safe haven through this stretch has been the US dollar. The dollar index has gained over 2% against six major rivals since the war began, according to Reuters. That matters for US equities because a stronger dollar can tighten financial conditions and pressure multinational earnings.

A firmer dollar also reflects global stress. Traders are buying dollars because they want liquidity and protection from the inflation shock. That tends to happen when risk appetite weakens across both bonds and stocks.

If the dollar keeps climbing, it may add another layer of pressure to the S&P 500, especially for globally exposed sectors such as tech and industrials.

Technical Analysis

The S&P 500 is trading near 6,690, edging up 0.10% on the session as the index attempts to stabilise after the recent decline from the 7,017 peak. The broader structure suggests the market has shifted from its earlier upward momentum into a short-term corrective phase, with price now testing lower support levels.

Technically, the index remains below several key short-term moving averages. The 5-day moving average (6,745) and 10-day (6,783) are positioned above the current price and trending lower, indicating continued pressure on the upside.

The 20-day moving average (6,832) and 30-day (6,856) also sit above the market, reinforcing the near-term bearish bias as the index trades beneath this cluster of resistance.

Immediate support is located around 6,650–6,670, an area that recently attracted buyers after the sharp drop. A break below this zone could expose further downside toward 6,550–6,600, where previous demand emerged earlier in the trend.

On the upside, initial resistance now sits around 6,740–6,780, followed by stronger resistance near 6,830, where the 20-day moving average is currently positioned.

Overall, the S&P 500 appears to be undergoing a short-term consolidation after failing to hold above 7,000. Unless the index can reclaim the 6,780–6,830 region, the near-term outlook may remain cautious, with the market vulnerable to additional downside pressure before a clearer directional move emerges.

What Traders Should Watch Next

Next week’s run of central bank meetings matters because policymakers now need to address inflation, rates, and slower growth at the same time. These meetings are a prime market focus, as the interest-rate outlook has been reshaped by the war and energy shock.

In the very near term, traders should watch three things: whether oil can stay below the recent panic highs, whether yields keep rising, and whether the S&P 500 can recover the first resistance band near 6745.50 and 6783.72. If those do not improve together, this bounce may stay shallow.

Learn more about trading Indices on VT Markets today.

FAQs

  1. Why Are Stagflation Risks Being Discussed in Markets Again?
    Stagflation refers to a mix of slow economic growth and high inflation. Markets are raising this risk because oil prices surged above $100 per barrel, which can raise energy costs while also weakening global growth.
  2. How Do High Oil Prices Affect Stock Markets?
    Higher oil prices increase production and transport costs for companies while also reducing consumer spending power. This combination can squeeze corporate profits and weigh on equity markets such as the S&P 500.
  3. Why Are Investors Pulling Back Rate-Cut Expectations?
    Rising energy prices increase inflation risks, making central banks more cautious about cutting interest rates. Markets are now no longer fully pricing even one Fed rate cut this year, compared with two rate cuts priced at the end of February.
  4. Why Are ECB Rate Expectations Moving Higher?
    Money markets now fully price a European Central Bank rate hike by July and a 70% probability of a second hike by December. In February, traders had attached roughly a 40% chance to a rate cut before year-end, showing how sharply expectations have shifted.
  5. How Does a Stronger Dollar Affect the S&P 500?
    A stronger dollar can weigh on US equities because it tightens financial conditions and reduces overseas earnings for multinational companies when profits are converted back into dollars.
  6. Did the Strategic Oil Reserve Release Calm Markets?
    The International Energy Agency agreed to release 400 million barrels from strategic reserves. While this helped stabilise prices slightly, markets remain cautious because supply disruptions linked to the Middle East conflict have not fully resolved.

Start trading now – Click here to create your real VT Markets account

Amid Asian trade, the Australian dollar strengthens near 0.7090 as markets anticipate a March RBA hike

AUD/USD rose to about 0.7090 in Asian trading on Friday after falling by more than 1% in the prior session. The move came as markets focused on expectations of tighter Reserve Bank of Australia policy. A Reuters poll showed 23 of 30 economists expect the RBA to lift the Official Cash Rate to 4.10% on March 17, while seven expect no change. This differs from February’s poll, which pointed to the rate staying at 3.85%.

Rate Expectations And Market Pricing

The poll’s median forecast now sees the cash rate at 4.35% by the end of 2026. Markets are pricing a 70% chance of a 25-basis-point rise next week in cash rate futures. ING’s Francesco Pesole described the Australian Dollar as one of the best-performing G10 currencies, helped by expectations of further RBA tightening and higher oil prices. He said the pair could move towards 0.7200 if equity markets stay stable, while stretched positioning could raise the risk of a pullback after the decision. Traders are also awaiting US inflation data, with January’s Personal Consumption Expenditures Price Index due later on Friday. Other scheduled releases include the first revision to fourth-quarter GDP growth and March consumer confidence. We are looking back at the sentiment from early 2025, when expectations for aggressive Reserve Bank of Australia rate hikes were running high and the AUD/USD was trading near 0.7100. At the time, markets were pricing a high probability of a rate hike in the upcoming March 2025 meeting. That hawkishness was driven by a belief that the RBA needed to move rates significantly higher to control inflation.

How The Outlook Shifted Into 2026

Following that period, the RBA did indeed hike in March 2025, but only by 25 basis points to 3.60%, disappointing the more aggressive forecasts. The Australian dollar actually weakened over the subsequent months as the US Federal Reserve continued its own hiking cycle more assertively. By the end of 2025, we saw the RBA cash rate reach 4.35% while the Fed Funds Rate stood higher at a peak of 5.50%. Now, in March 2026, the situation is very different as both central banks have been on a prolonged pause for several months. With Australia’s last quarterly inflation report for 2025 coming in at an annual rate of 4.1% and the latest US inflation figures still hovering over 3%, expectations for imminent rate cuts have been pushed out. This has created a period of lower volatility in the currency pair, with AUD/USD trading in a tighter range around the 0.6650 level. For traders, this suggests that strategies profiting from range-bound price action are now more attractive. Selling short-dated strangles, an options strategy that profits if the AUD/USD stays between two set prices, could be effective in the current environment. The market is no longer pricing in major policy surprises from either the RBA or the Fed in the immediate future. However, we must remain aware of external factors that could disrupt this stability. Iron ore prices, a key Australian export, have softened in early 2026, recently falling from over $130 to around $115 per tonne. A further decline in commodity prices could pressure the Australian dollar downwards, even if interest rate expectations remain stable. Create your live VT Markets account and start trading now.

Start trading now – Click here to create your real VT Markets account

Reuters poll finds most economists expect the RBA to lift Australia’s cash rate to 4.10% on March 17

A Reuters poll on Friday found 23 of 30 economists expect the Reserve Bank of Australia to raise the Official Cash Rate to 4.10% on 17 March. Seven economists expect no change, compared with February’s poll that pointed to a steady rate at 3.85%. The median forecast now puts the cash rate at 4.35% by end-2026. At the time of writing, AUD/USD was up 0.12% on the day at 0.7085.

Rba Policy Framework

The RBA sets Australia’s interest rates and monetary policy through 11 scheduled meetings a year, plus emergency meetings if needed. Its mandate includes keeping inflation at 2–3% and supporting currency stability, full employment, and economic welfare. Raising rates tends to support the Australian Dollar, while lower rates tend to weaken it. Other tools include quantitative easing and quantitative tightening. Inflation and broader economic data can affect expectations for policy settings and, in turn, the currency. Indicators such as GDP, manufacturing and services PMIs, employment, and consumer sentiment can feed into these expectations. Quantitative easing involves creating Australian Dollars to buy assets such as government or corporate bonds, which often weakens the AUD. Quantitative tightening ends net asset buying and reinvestment of maturing proceeds, which can support the AUD.

Market Backdrop And Implications

Looking back to this time in 2025, we saw a strong consensus forming for the Reserve Bank of Australia to raise its cash rate. That Reuters poll from a year ago showed an expectation for a hike to 4.10%. Today, the situation is more nuanced as the cash rate has been holding steady at 4.35% for the past six months. The main driver now is the conflict between sticky inflation and slowing growth. The latest data for the fourth quarter of 2025 showed headline inflation at 3.5%, which is still stubbornly above the RBA’s target band. This persistence keeps the possibility of another rate hike on the table for policy makers. However, we are seeing signs that past rate increases are cooling the economy. The national unemployment rate has ticked up to 4.2% in the latest report, and the last GDP figures showed only modest growth. This data suggests the RBA may be hesitant to tighten policy further and risk a more significant downturn. This uncertainty about the RBA’s next move suggests volatility in interest rate markets will increase. Derivative traders should consider strategies that profit from a large move, regardless of direction, such as buying options on bond futures ahead of the next RBA meeting. The pricing of such options indicates the market is anticipating a more decisive policy signal soon. For the currency, the AUD/USD is trading near 0.6650, much lower than the 0.7085 level seen this time last year. Given the potential for a sharp reaction to any RBA guidance, using currency options to hedge or establish new positions with defined risk is a prudent approach. A hawkish surprise could trigger a rally, while any dovish pivot would likely send the pair lower. Create your live VT Markets account and start trading now.

Start trading now – Click here to create your real VT Markets account

WTI trades near $95.75 after Iran insists on keeping Hormuz closed amid US-Israel-Iran tensions

WTI traded near $95.75 in early Asian trading on Friday, moving above $95.50. Prices rose amid a closure of the Strait of Hormuz linked to conflict involving the US, Israel, and Iran. US crude oil prices have risen more than 40% since the start of the war. The International Energy Agency (IEA) said the conflict was creating the largest supply disruption in the history of the global oil market.

Strait Of Hormuz Closure

Iran’s new supreme leader, Mojtaba Khamenei, said the Strait of Hormuz should remain closed. He also said US military bases in the region should be shut or face attack. The IEA announced on Wednesday it will release 400 million barrels from strategic reserves. The release is intended to add short-term supply and limit sharp rises in oil prices. With the Strait of Hormuz effectively closed, a chokepoint for nearly 21 million barrels of oil per day is now blocked. We see a fundamental conflict between a severe physical supply disruption and a large, but temporary, strategic release from the IEA. This situation creates extreme uncertainty and, therefore, high implied volatility in the options market. The geopolitical risk premium is now exceptionally high, and we believe any price dips will be seen as buying opportunities. The 400 million barrel IEA release is historic, but it cannot replace the indefinite loss of a major global shipping lane. Traders should consider buying call options or bull call spreads to profit from further price increases driven by fears of a prolonged conflict.

Options Strategies Amid Volatility

When we look back to the large strategic reserve releases of 2022, they put a temporary cap on prices but did not solve the underlying structural supply issues from the war in Ukraine. That release, while significant at the time, was much smaller than the 400 million barrels currently pledged. This time, the sheer size of the announced supply might lead to a sharp, albeit brief, price drop if any good news emerges. This unprecedented release creates a ceiling on crude prices, making it risky to be outright long on futures contracts at these levels near $96. Traders who anticipate that the IEA’s action will overwhelm the market’s panic could look at put options. These instruments would provide a way to profit if the supply injection successfully pushes prices back down toward the low $90s. Given the two powerful and opposing forces at play, the most predictable outcome is continued, wild price swings. This suggests that derivative strategies that profit from high volatility, such as long straddles or strangles, should be considered. These positions will be profitable if the oil price makes a significant move in either direction, which seems highly likely in the coming weeks. Create your live VT Markets account and start trading now.

Start trading now – Click here to create your real VT Markets account

OCBC strategists say oil-led inflation and growth threats keep Asian currencies, including Singapore dollar, vulnerable despite IEA reserves release

OCBC strategists said Asian foreign exchange, including the Singapore dollar, remains exposed to oil-driven inflation and growth risks despite the IEA’s plan to release 400mn barrels from oil reserves. They said the release is intended to limit oil price spikes, but warned that Iran has mentioned a level of USD200 per barrel. They said oil from reserves may take time to reach the open market because of logistics and shipping limits. They also said markets may still face a short-term squeeze if supply disruptions occur alongside existing production cuts. They said the reserve release may help reduce panic and smooth volatility, but does not remove the risk of near-term oil price spikes. They added that Asian currencies, including SGD, may still face pressure. They said the Monetary Authority of Singapore is unlikely to act early, but a sustained rise in energy prices could reduce its tolerance for waiting. Their economists estimated that moving average crude prices from about USD63/bbl to USD92/bbl could raise 2026 headline inflation from roughly 1.3% to about 1.8% year on year. They said market pricing has started to reflect tentative expectations of tighter policy. We see that Asian currencies remain exposed to risks from high oil prices, despite efforts to calm the markets with strategic reserve releases. Brent crude is currently trading near $95 a barrel, which keeps the threat of inflation very real for an energy-importing nation like Singapore. This situation makes the Singapore Dollar vulnerable to pressure in the near term. Given this uncertainty, we should expect higher volatility in the USD/SGD currency pair over the next few weeks. This environment suggests that buying options could be a prudent strategy to trade the potential for large price swings without committing to a single direction. The cost of these options, or their premium, has already started to rise, indicating that the market is bracing for movement. For those anticipating a short-term oil spike, positioning for a weaker Singapore Dollar seems logical. We remember how markets reacted during the initial energy price shock back in 2022, where risk-off sentiment tended to strengthen the US dollar against other currencies. A move towards the 1.3700 level for USD/SGD is plausible if oil tensions escalate. Conversely, we must also consider the reaction from the Monetary Authority of Singapore (MAS). Singapore’s latest core inflation data for February 2026 already showed a 2.1% year-on-year increase, which may reduce the central bank’s patience with rising energy costs. A longer-term play could involve buying SGD call options with expiries three to six months out, betting that the MAS will be forced to tighten policy and strengthen the currency. For traders managing existing portfolios, this is a crucial time to hedge against currency risk. Using instruments like futures contracts or options can protect against unexpected moves in the Singapore Dollar driven by oil market volatility. This is particularly important for any business operations with costs denominated in US dollars.

Start trading now – Click here to create your real VT Markets account

Iran’s new supreme leader, Mojtaba Khamenei, urged keeping the Strait of Hormuz closed to pressure enemies

Iran’s new supreme leader, Mojtaba Khamenei, said the closure of the Strait of Hormuz should continue as a tool to pressure an enemy, CNBC reported on Thursday. He also said all US military bases in the region should be closed immediately or face attack. Khamenei said attacks on US bases would continue, while also stating Iran seeks goodwill with neighbouring countries. US Treasury Secretary Scott Bessent said the US Navy will escort oil tankers through the Strait of Hormuz when militarily possible.

Heightened Regional Tensions

CNN reported that the Pentagon and the National Security Council said they underestimated Iran’s readiness to close the Strait in response to US strikes. CBS News reported on Friday that the US fired at an Iranian vessel that approached the USS Abraham Lincoln aircraft carrier too closely. Following the reports, crude oil prices rose. West Texas Intermediate (WTI) was up 9.68% on the day at $95.88. WTI stands for West Texas Intermediate, one of three main crude benchmarks alongside Brent and Dubai Crude. It is sourced in the US and distributed via the Cushing hub. The sudden jump in WTI crude oil to over $95 is the market pricing in a severe supply shock, as the Strait of Hormuz handles about 21 million barrels per day, roughly 20% of global consumption. This immediate spike suggests we should prepare for sustained high volatility in energy markets. We must anticipate that prices could test triple-digit levels very quickly if the situation escalates.

Options And Volatility Implications

We can look back to the market reaction in early 2022 after the start of the conflict in Ukraine, when Brent crude briefly touched nearly $140 a barrel. The current crisis has a more direct and immediate impact on physical supply, suggesting the ceiling could be just as high, if not higher. Derivative positions should account for the possibility of rapid, headline-driven moves toward those previous highs in the coming weeks. The spike in oil prices has caused a surge in implied volatility, making options contracts on crude futures significantly more expensive. While long call options are a direct way to bet on rising prices, their inflated cost increases risk. Traders should therefore also consider strategies like bull call spreads to reduce the initial cash outlay while maintaining upside exposure. We expect a clear divergence in equities, creating opportunities for derivative trades outside of the energy complex. Call options on the energy sector ETF (XLE) are a logical play, as producer profits will surge with higher oil prices. Conversely, put options on transportation and airline stocks are attractive, as rising fuel costs directly squeeze their margins. This energy shock complicates the global inflation picture, which had just started to cool in late 2025 after years of pressure. The US inflation rate, which had fallen to 2.8% in the last quarter, will almost certainly reverse course, forcing the Federal Reserve to reconsider its planned interest rate cuts. This creates downside risk for the broader market, suggesting protective puts on indices like the S&P 500 could be prudent. Create your live VT Markets account and start trading now.

Start trading now – Click here to create your real VT Markets account

During early Asian trading, gold slipped under $5,100 as firmer oil lifted inflation fears, boosting dollar yields

Gold (XAU/USD) fell below $5,100 and traded near $5,090 in early Asian trading on Friday. The decline continued alongside a stronger US Dollar and higher US Treasury yields. The US Personal Consumption Expenditures (PCE) Price Index for January is due later on Friday. The data is expected to affect views on inflation and US interest rates.

Middle East Risk And Safe Haven Demand

Iran’s new supreme leader, Mojtaba Khamenei, said the Strait of Hormuz should remain closed and that Iran will continue attacks on Persian Gulf neighbours, according to Bloomberg. US President Donald Trump called Iran “a nation of terror and hate” and said the situation is “moving along very rapidly” towards his pledge of limited military involvement. Market focus remains on developments in the Middle East. A longer conflict can increase demand for safe-haven assets such as gold. At the same time, higher oil prices linked to the conflict have raised inflation fears in the US. This can support expectations that the Federal Reserve keeps interest rates higher for longer, which can favour interest-bearing assets over gold. When we were looking at the situation in early 2025, the threat of the Strait of Hormuz closing sent a shock through the energy markets. We saw WTI crude prices spike to over $110 a barrel in that first quarter, which directly fueled the inflation fears mentioned. This forced the Federal Reserve to maintain its restrictive monetary policy throughout most of last year.

Rates Volatility And Gold Positioning

The conflict created a tough environment for gold, trapping it between safe-haven demand and the pressure of high interest rates. While geopolitical bids kept a floor under the price, the strong dollar and attractive bond yields capped any significant rally past the $5,250 level for months. This created a period of high volatility but limited directional movement for the precious metal. Now, as of March 2026, the intense military posturing in the Persian Gulf has cooled, bringing more stability to oil supply routes. We’ve seen WTI crude settle into a range around $85 a barrel, supported more by recent OPEC+ production discipline than by active conflict risk. This has allowed inflation to ease, with the latest February CPI report showing a headline figure of 2.8%, moving closer to the Fed’s target. Given this drop in geopolitical tension, implied volatility in the energy sector has fallen significantly. The CBOE Crude Oil Volatility Index (OVX), which soared above 50 during the 2025 scare, is now trading in the much calmer mid-20s. Traders should consider strategies that benefit from this lower volatility, such as selling options premium on major energy ETFs. With inflation moderating, the market’s focus has shifted from rate hikes to the timing of the first Fed rate cut, which is now anticipated in the second half of 2026. This changing interest rate outlook removes a major headwind for non-yielding assets like gold. Long-dated call options on gold futures could be an effective way to position for upside as monetary policy begins to ease later this year. Create your live VT Markets account and start trading now.

Start trading now – Click here to create your real VT Markets account

Commerzbank says Malaysia’s oil-exporter role supports MYR as January output rises 5.9%, boosted by semiconductors, exports

Malaysia’s industrial production rose 5.9% year-on-year in January, above the Bloomberg consensus of 5.0% and up from 4.8% in December. It was the strongest reading since July 2024. The rise was linked to export-focused manufacturing and demand for semiconductors. Output is expected to remain supported this year by global demand for both leading-edge and trailing-edge semiconductors, alongside investment in data centres.

Ringgit Stability And Oil Support

The Malaysian ringgit (MYR) has been relatively stable compared with other Asian currencies during a rise in oil prices. Malaysia’s net crude oil exporter position has helped provide support. Domestic refineries meet about 66% of Malaysia’s refined oil demand. Malaysia still imports petroleum products, which remains an area of exposure. The MYR may still be affected by weakness in regional currencies. It may be less exposed to further increases in oil prices than some regional peers. Looking back to early 2025, we were encouraged by industrial production hitting its strongest point since mid-2024, driven by a booming semiconductor sector. However, the latest data from January 2026 shows this growth has moderated to a more subdued 3.5% year-on-year. This suggests the initial export surge may be losing some momentum.

Implications For Hedging Strategy

The Malaysian ringgit benefited from its oil exporter status when Brent crude was pushing past $95 a barrel in late 2025. With prices now easing to around the $88 mark, that supportive cushion is diminishing, making the currency more sensitive to other factors. This shift in oil’s influence is a key change from the view we held over a year ago. Considering the softening industrial output and the pullback in crude prices, the MYR’s relative stability from 2025 appears less certain. The USD/MYR exchange rate has already drifted from 4.65 to 4.75 over the last year, showing this emerging weakness. We should therefore consider buying short-dated USD/MYR call options to hedge against or speculate on further ringgit depreciation in the coming weeks. Adding to this outlook is Bank Negara Malaysia’s recent commentary, which hints at potential rate cuts later in the year if growth continues to slow. This contrasts with the situation in early 2025 when stable rates were a given. This monetary policy divergence could further pressure the ringgit against regional currencies whose central banks remain more hawkish. Create your live VT Markets account and start trading now.

Start trading now – Click here to create your real VT Markets account

Back To Top
server

Hello there 👋

How can I help you?

Chat with our team instantly

Live Chat

Start a live conversation through...

  • Telegram
    hold On hold
  • Coming Soon...

Hello there 👋

How can I help you?

telegram

Scan the QR code with your smartphone to start a chat with us, or click here.

Don’t have the Telegram App or Desktop installed? Use Web Telegram instead.

QR code