Back

Gold Slips to Weekly Loss as Dollar Strengthens

Key Points

  • Gold futures fall 0.6% to $5,095.30 a troy ounce, pushing bullion toward a weekly loss.
  • The U.S. dollar index rises 0.3% to 100.06, increasing pressure on dollar-denominated commodities.
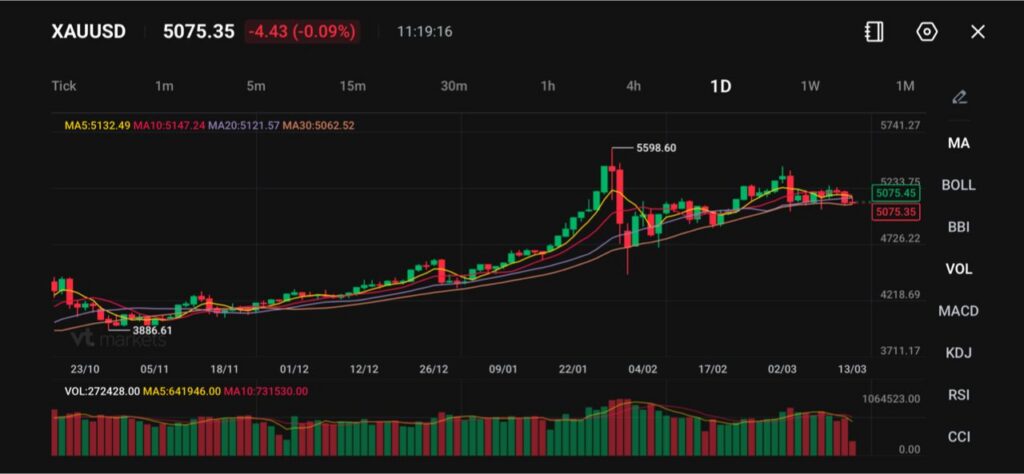
  • XAUUSD trades at 5075.35, down -4.43 (-0.09%), with MA5 5132.49, MA10 5147.24, MA20 5121.57, and MA30 5062.52.

Stronger Dollar Pressures Bullion

Gold prices weakened as the U.S. dollar continued to strengthen, pushing bullion toward a weekly loss. Futures in New York slipped 0.6% to $5,095.30 a troy ounce, while spot gold hovered around 5075.35, down -4.43 (-0.09%).

A stronger dollar often creates headwinds for gold. When the U.S. dollar index rises to 100.06, up 0.3%, dollar-denominated commodities become more expensive for international buyers. This tends to reduce demand from outside the United States and can weigh on bullion prices.

The dollar’s strength also reflects broader risk dynamics. Traders have moved into the currency as geopolitical tensions and volatile energy markets increase uncertainty.

If the dollar holds near 100.06 or continues climbing, gold may struggle to regain upward momentum in the near term.

Oil Prices Complicate The Inflation Picture

Rising oil prices have introduced another challenge for bullion. Higher energy costs can increase inflation expectations, which complicates the outlook for Federal Reserve policy.

Analysts at ANZ note that the dollar has strengthened partly because the United States is a net energy exporter, meaning rising oil prices can support the U.S. economy relative to energy-importing regions.

This dynamic shifts capital toward the dollar while creating pressure on gold. When energy prices rise, traders may anticipate higher interest rates or a delay in rate cuts as central banks try to contain inflation.

If oil prices remain elevated, markets may continue adjusting expectations for U.S. monetary policy, which could keep pressure on gold.

Fed Policy Uncertainty Weighs On Gold

Uncertainty surrounding Federal Reserve policy remains a central theme for bullion traders. Higher oil prices increase the possibility that inflation pressures return, which could complicate the timing of interest rate cuts.

Gold tends to perform best when interest rates fall or when traders expect easier monetary policy. When rate cuts appear less certain, yields can rise and reduce the appeal of non-yielding assets such as gold.

Markets are therefore balancing two competing forces: geopolitical risks that support safe-haven demand, and monetary policy uncertainty that limits upside momentum.

If incoming data suggests inflation remains sticky, expectations for rate cuts may fade further and gold could remain under pressure despite ongoing geopolitical tensions.

Technical Analysis

Gold (XAUUSD) is trading near 5,075, slightly lower on the session, as the metal continues to ease after the earlier rally that pushed prices to a peak around 5,598.60.

The recent price action suggests the market is undergoing a consolidation phase, with momentum cooling as traders digest the strong gains seen earlier in the year.

From a technical perspective, gold is currently hovering around its short-term moving averages. The 5-day moving average (5,132) and 10-day (5,147) sit just above the current price, indicating mild downward pressure in the near term. Meanwhile, the 20-day moving average (5,121) is close to the market and beginning to flatten, while the 30-day moving average (5,062) remains below current levels and continues trending upward, suggesting that the broader bullish structure is still intact.

Immediate support is located near 5,050–5,070, where the market is currently attempting to stabilise. A break below this zone could expose further downside toward 4,950–5,000, which represents a stronger structural support area.

On the upside, initial resistance appears near 5,130–5,150, followed by a more significant resistance zone around 5,250–5,300, where recent rallies have stalled.

Overall, gold appears to be consolidating within a broader uptrend, with the current pullback likely reflecting short-term profit-taking rather than a full reversal.

Holding above the 5,000 psychological level would keep the longer-term bullish outlook intact, while a sustained move back above 5,150 could signal renewed upward momentum.

What Traders Should Watch Next

  • Movements in the U.S. dollar index, particularly if it remains above 100.06.
  • Oil price trends and their impact on inflation expectations.
  • Federal Reserve communication and incoming economic data that could influence rate-cut timing.
  • Whether gold futures continue trading below $5,100 a troy ounce or stabilise near current levels.

Learn more about trading Precious Metals on VT Markets here.

FAQs

  1. Why Are Gold Prices Falling This Week?
    Gold is under pressure from a stronger US dollar, rising oil prices, and uncertainty over Federal Reserve interest-rate policy. These factors have pushed New York gold futures down 0.6% to $5,095.30 a troy ounce, putting bullion on track for a weekly loss.
  2. How Does a Stronger US Dollar Affect Gold Prices?
    Gold is priced in US dollars. When the US dollar index rises to 100.06, up 0.3%, gold becomes more expensive for overseas buyers. This can reduce global demand and weigh on bullion prices.
  3. Why Are Rising Oil Prices Important for Gold?
    Higher oil prices increase inflation risks. If inflation rises again, the Federal Reserve may delay rate cuts or maintain a tighter policy. Higher interest rates tend to reduce the appeal of non-yielding assets such as gold.
  4. Why Does the US Dollar Benefit From Higher Oil Prices?
    The United States is a net energy exporter, meaning higher oil prices can support the US economy relative to energy-importing regions. This dynamic strengthens the dollar and indirectly pressures gold.
  5. Why is Federal Reserve Policy So Important for Gold?
    Gold performs best when interest rates fall or when markets expect easier monetary policy. If rate cuts become less likely, bond yields can rise and reduce the appeal of holding gold.

Start trading now – Click here to create your real VT Markets account

In January, the UK’s total trade balance improved sharply, shifting from a £4.34B deficit to £3.922B surplus

The UK’s total trade balance moved from £-4.34 billion to £3.922 billion in January. This change shifted the balance from a deficit to a surplus. This unexpected swing to a £3.9 billion trade surplus in January is a significant positive for the UK economy. It suggests a much stronger export performance than anyone anticipated. We should therefore consider buying call options on the British Pound, particularly against the US Dollar (GBP/USD), to capitalize on a likely appreciation in the coming weeks.

Implications For Monetary Policy

This strong economic signal complicates the outlook for the Bank of England. Through much of 2025, we saw the market pricing in interest rate cuts, but this data reduces the pressure for such a move, especially with inflation having remained sticky just above 2.5% late last year. Consequently, we should adjust positions in short-term interest rate futures to reflect a lower probability of a rate cut in the second quarter. A stronger pound, however, creates a headwind for the UK’s largest companies. Given that over 75% of FTSE 100 revenues are generated overseas, a rising GBP exchange rate will negatively impact their earnings when converted back into sterling. It may be prudent to buy put options on the FTSE 100 index as a hedge against this currency effect on corporate profits. The sheer size of this data surprise will increase market uncertainty and price swings. Implied volatility in GBP options is likely to rise from the subdued levels we saw at the start of the year. This presents an opportunity to profit from the volatility itself, perhaps by purchasing straddles on GBP/EUR, which would benefit from a large price move in either direction.

Positioning And Risk Management

Create your live VT Markets account and start trading now.

Start trading now – Click here to create your real VT Markets account

Britain’s non-EU trade deficit narrowed to £3.46bn from £10.994bn, according to trade balance data

The UK’s non-EU trade balance was £-3.46bn in January. This compares with £-10.994bn in the previous period. The data shows the UK’s non-EU trade gap narrowed in January. The figures relate to trade in goods and services with countries outside the EU.

Implications For Sterling Strength

Given the sharp narrowing of the UK’s non-EU trade deficit in January, we should anticipate renewed strength in the Pound Sterling. This improvement, from a nearly £11 billion deficit in December 2025 to under £3.5 billion, is a significant positive signal for the currency. In the coming weeks, this suggests a bullish outlook for GBP against major pairs like the Dollar and the Euro. We should therefore consider positioning through derivatives for a rise in Sterling’s value. Buying call options on GBP/USD with expiry dates in April or May 2026 would allow us to profit from an upward move while capping our potential losses. This strategy is supported by the fact that the pound has been sensitive to positive economic surprises over the last year. This trade data is especially important when we consider the current economic environment. With UK inflation data from February 2026 showing consumer prices are still stubbornly high at 3.4%, this strong trade figure gives the Bank of England more reason to delay interest rate cuts. A higher-for-longer rate environment is typically supportive of a currency. This may also be a good time to look at FTSE 100 index futures. Many of the index’s largest companies are multinational exporters, and a more favourable trade balance hints at stronger international earnings. We saw a similar pattern in the second half of 2025, where better-than-expected export data provided a temporary lift to UK equities.

Key Risk Drivers To Monitor

However, we must watch the upcoming retail sales figures for February to understand the full picture. If the trade deficit narrowed because of a collapse in imports, it could signal weak domestic consumer demand, which would undermine this positive view. But if it was driven by a surge in exports, our bullish stance on the pound and UK stocks will be confirmed. Create your live VT Markets account and start trading now.

Start trading now – Click here to create your real VT Markets account

In January, Britain’s goods trade deficit came in at £14.45B, beating forecasts of £22.2B

The UK goods trade balance was £-14.45bn in January. This was above the expected figure of £-22.2bn. The better-than-expected January trade balance figure of -£14.45 billion points to a more resilient UK economy than we initially priced in. This smaller deficit suggests exports are holding up or imports are moderating, both fundamentally positive for Sterling. We should therefore anticipate a firmer floor for the British Pound in the near term.

Trade Balance Implications For Sterling

This positive data point, when viewed alongside the recent February inflation report which showed core CPI remaining sticky at 2.4%, strengthens the case for the Bank of England to maintain its current hawkish stance. We should adjust interest rate derivative positions to reflect a lower probability of a rate cut before the third quarter. This is a marked change from the sentiment at the end of 2025 when the market was pricing in earlier cuts. For those trading foreign exchange derivatives, this suggests a more bullish outlook on the Pound against the Euro (GBP/EUR). Recent manufacturing PMI data from the Eurozone has been soft, with Germany’s February figure coming in at 42.5, indicating continued contraction. This divergence supports strategies like buying GBP/EUR call options or selling out-of-the-money puts to position for further Sterling strength. Looking at equity derivatives, the improved economic picture could benefit domestically-focused stocks. We may see increased demand for call options on the FTSE 250 index, which is a better barometer of the UK’s internal health than the more international FTSE 100. Back in 2024, we saw similar domestic resilience briefly boost the mid-cap index before global headwinds took over. However, we must remember this is January data, and the key will be whether this strength continued into February and March. Looking back at the volatility in shipping costs we saw in 2025, any renewed supply chain pressure could quickly reverse this positive trend. It is wise to use options spreads to define risk rather than taking on unlimited exposure.

Risk Management And Forward Signals

Create your live VT Markets account and start trading now.

Start trading now – Click here to create your real VT Markets account

UK manufacturing output rose 0.1% month-on-month in January, missing forecasts anticipating 0.2% growth

UK manufacturing production rose by 0.1% month on month in January. This was below the 0.2% forecast. The release measures monthly changes in output from the UK manufacturing sector. The January figure follows the latest available reading from the prior month’s series.

January Data Signals Early Slowdown

That January manufacturing production miss, coming in at 0.1%, set a cautious tone for the first quarter of 2026. While it is older data, it was the first sign of a slowdown that subsequent figures have confirmed. More recent preliminary PMI data for February also dipped to 47.1, reinforcing this view of a struggling industrial sector. This sustained weakness puts pressure on the Bank of England to consider a more dovish stance in its upcoming meetings. We are now pricing in a higher probability of a rate cut by the third quarter, a shift from the ‘higher for longer’ narrative we saw at the end of 2025. This situation is reminiscent of the policy pivot we observed in late 2024 when growth concerns began to outweigh inflation fears. Consequently, we are looking at bearish strategies on the British pound, particularly against the US dollar. Implied volatility on GBP/USD options has ticked up as traders anticipate more downside potential. Recent data shows the pound has already weakened by 1.5% against the dollar since the start of February. For the FTSE 100, the outlook is mixed, creating opportunities for relative value trades. The weaker pound is a tailwind for the index’s large international earners, which account for over 75% of its total revenue. However, domestically focused companies in the FTSE 250 are likely to underperform due to the sluggish UK consumer demand.

FTSE Positioning And Relative Value

Create your live VT Markets account and start trading now.

Start trading now – Click here to create your real VT Markets account

USD/CAD hovers near 1.3640; prior gains fade as softer oil pressures the Canadian Dollar, despite export leverage

USD/CAD held near 1.3640 in Asian trading on Friday, after rising by more than 0.25% in the prior session. The Canadian Dollar was steady as oil prices eased. WTI slipped slightly after jumping more than 9% in the previous session, trading near $95.00 a barrel. US crude prices are up more than 40% since the war began.

Strait Of Hormuz Risk Escalates

Oil prices may keep rising after the Strait of Hormuz was effectively closed during an escalating conflict involving the US, Israel and Iran. The International Energy Agency said the US-Israeli war on Iran is “creating the largest supply disruption in the history of the global oil market.” Iran’s new supreme leader, Mojtaba Khamenei, said the Strait of Hormuz closure should continue as a “tool to pressure the enemy.” He also warned that US military bases in the region should close immediately or face possible attacks. USD/CAD declines may be limited if the US Dollar stays supported by expectations the Federal Reserve will leave rates unchanged next week. The benchmark federal funds rate is currently 3.50%–3.75%. Markets are also awaiting January’s Personal Consumption Expenditures Price Index later on Friday. Attention is also on the first revision of fourth-quarter US GDP growth and March consumer confidence.

Usd Cad Tug Of War

The market is seeing a major tug-of-war on the USD/CAD pair around the 1.3640 level. We have West Texas Intermediate crude holding near $95 a barrel, which should be driving the Canadian dollar much stronger. However, the flight to safety amid the Mideast conflict is keeping the US dollar in high demand. The closure of the Strait of Hormuz is the dominant factor, choking off roughly a fifth of the world’s daily oil supply, a disruption unseen in decades. Historically, events like the 1973 oil crisis caused prices to quadruple, and Iran’s new leadership suggests this supply disruption is a long-term policy. This ongoing shock means we must prepare for oil prices to remain elevated or even climb higher. On the other side, the Federal Reserve’s firm stance on holding interest rates at 3.50-3.75% provides a strong floor for the greenback. The ongoing war is creating immense risk-off sentiment, pushing capital into US assets for safety. This counteracts the positive pressure on the loonie from oil prices. Given this uncertainty, we believe trading direction outright is extremely risky, and the focus must shift to volatility. Implied volatility on USD/CAD options has surged, with currency volatility indexes showing a more than 30% jump since the conflict escalated last month. Strategies that benefit from large price swings, such as long straddles, are becoming more attractive for hedging against sharp, unpredictable moves. We are witnessing a breakdown in the typical inverse correlation between oil prices and the USD/CAD pair. Looking back at data from 2025, that relationship was consistently strong, but the current safe-haven demand for the US dollar is overriding it. This means historical models based purely on oil prices are likely to be unreliable in the coming weeks. Create your live VT Markets account and start trading now.

Start trading now – Click here to create your real VT Markets account

Early Asian trade lifts NZD/USD above 0.5850, though Middle East tensions may limit further gains

NZD/USD edged up to about 0.5855 in early Asian trade on Friday, with gains limited by ongoing conflict in the Middle East. Markets are waiting for the US Personal Consumption Expenditures (PCE) Price Index for January later on Friday. Donald Trump said stopping Iran from getting nuclear weapons and threatening the Middle East is more important than oil costs. Iran’s new supreme leader, Mojtaba Khamenei, said Tehran would seek to keep the Strait of Hormuz effectively closed, which could support demand for the US Dollar.

Us Pce Report In Focus

The January PCE report is the Federal Reserve’s preferred inflation measure and may affect rate expectations. Headline PCE is forecast at 2.9% year on year, with core PCE at 3.1%. A softer inflation reading could weigh on the US Dollar and support NZD/USD. CME FedWatch data shows markets pricing a 99% chance the Fed will keep rates unchanged at its next meeting. RBNZ Governor Anna Breman said policy is likely to stay accommodative for some time due to a fragile economy. Markets are pricing at least two Official Cash Rate hikes by end-2026, linked to an energy-price shock from Middle East conflict. The New Zealand Dollar often moves with RBNZ policy, rate differences versus the US, Chinese economic conditions, and dairy prices. It also tends to rise in risk-on markets and fall during periods of market stress.

Central Bank Policy And Risk

The push and pull between central bank policies and global risk are keeping NZD/USD under pressure. We are seeing the US Dollar maintain its strength, driven by a robust US labor market that added 250,000 jobs in February and core PCE inflation that is stubbornly holding around 2.9%. This persistent data reduces the likelihood of near-term Federal Reserve rate cuts, making the dollar more attractive. Last year, we saw markets begin to price in rate hikes from the Reserve Bank of New Zealand due to the energy price shock from Middle East conflicts. This has been validated by recent data, as New Zealand’s Q4 2025 CPI came in at 3.8%, well above the RBNZ’s target band. Supporting the Kiwi, however, the latest Global Dairy Trade auction saw prices jump 3.5%, providing a much-needed boost to export sentiment. Given these conflicting signals, implied volatility on NZD/USD options has been rising, making strategies that benefit from price movement or defined ranges more appealing. Traders anticipating a break higher on RBNZ hawkishness could consider buying call spreads to cheaply position for a move towards the 0.6000 level. Alternatively, those expecting continued range-bound action could look at selling strangles to collect premium as long as the pair remains contained. The Kiwi’s sensitivity to Chinese economic performance remains a key vulnerability. The most recent Caixin Manufacturing PMI from China printed at a disappointing 49.8, signaling a slight contraction and weighing on the New Zealand Dollar. This reliance on Chinese demand means traders should use any rallies in the pair to consider protective put options as a hedge against further negative data from New Zealand’s largest trading partner. Create your live VT Markets account and start trading now.

Start trading now – Click here to create your real VT Markets account

During Asian trading, XAG/USD regains $85, ending two-day losses, though weekly performance remains broadly flat

Silver (XAG/USD) rose in the Asian session on Friday and moved back above $85.00. It has ended a two-day fall and is set to finish the week little changed. On the 4-hour chart, price remains below the descending 200-period Simple Moving Average (SMA). The Relative Strength Index (RSI) has lifted towards 48, while the MACD stays below its signal line and below zero, with a negative histogram.

Technical Picture And Key Levels

A clearer move below the rising support trend line is still needed before stronger selling positions are considered. If that break occurs, silver may fall towards $82.00 and then $80.00. Resistance is near the 200-period SMA at about $85.70. A sustained move above $85.70 could lead towards $87.00 and then $88.50, while moves below $85.70 may face selling. Looking back at the analysis from around this time in 2025, we recall the struggle silver had below the $85.70 moving average. Today, on March 13, 2026, with the metal trading closer to $78, those former price levels now represent significant overhead resistance. The market sentiment has shifted from cautious optimism to a more defined bearish pressure. Recent statistics support this cautious stance, as the Global Solar Council’s Q1 2026 report indicated a slight contraction in industrial silver demand for the first time in three years. Furthermore, data shows major silver ETFs have seen net outflows of over 15 million ounces since the start of the year, suggesting investment demand is waning. This weak fundamental backdrop reinforces the technical selling pressure we are seeing. For derivative traders, this suggests that the $80.00 and $82.00 levels, which were viewed as potential support last year, are now ceilings. Selling call options with strike prices at or above $82.00 could be a viable strategy to generate income over the coming weeks. This approach would profit from price stagnation or a further decline in the price of silver.

Options Positioning And Risk Scenarios

However, we are now testing a long-term rising support trendline that has held firm for several years. A break below the current $78 level could accelerate selling, similar to the sharp drop we experienced in late 2023 after a key technical failure. Therefore, buying put options with a $75 strike could serve as a cheap hedge against a significant downturn. On the other hand, we must watch for any surprising strength, especially with the latest US inflation report due next week. A sustained break back above the old $85.70 resistance level from the 2025 analysis would invalidate the current bearish view. In that scenario, traders would quickly need to cover short positions and consider buying calls to ride a new wave of momentum toward last year’s highs. Create your live VT Markets account and start trading now.

Start trading now – Click here to create your real VT Markets account

During Asian trading, GBP/USD recovers to 1.3370 as the Dollar index eases before PCE inflation data

GBP/USD recovered some of the prior session’s falls and traded near 1.3370 in Asian hours on Friday. The move came as the US Dollar Index eased after rising by almost 0.5% on Thursday. Traders are waiting for the US Personal Consumption Expenditures (PCE) Price Index for January, due later on Friday. Markets are also watching the first revision to fourth-quarter US GDP growth and March consumer confidence.

Middle East Tensions Support Dollar Demand

Middle East tensions have supported demand for the US dollar, alongside higher oil prices. Iran’s new supreme leader, Mojtaba Khamenei, said the closure of the Strait of Hormuz should remain a “tool to pressure the enemy”, and warned that all US military bases in the region should be closed or face potential attacks. Futures markets and economists expect the Federal Reserve to keep rates unchanged at next week’s meeting, with the federal funds rate at 3.50%–3.75%. Markets are also pricing in a Bank of England rate cut next week, though higher oil prices have added uncertainty and may lead to delays. We are seeing a familiar pattern emerge that reminds us of early 2025. The US Dollar is gaining strength from geopolitical risks, much like it did during the tensions over the Strait of Hormuz last year. This safe-haven demand is being reinforced by renewed instability in the Middle East, which has pushed Brent crude oil prices back above $95 a barrel. The case for a stronger dollar is supported by recent inflation data. February’s Personal Consumption Expenditures (PCE) index in the US came in at a stubborn 2.9%, making it unlikely the Federal Reserve will signal any rate cuts soon. This echoes the period in 2025 when the Fed held its benchmark rate firm at 3.50%–3.75%, supporting the greenback.

BoE Pressure Builds Policy Divergence

Conversely, the Bank of England is facing a different economic picture. With UK inflation having fallen to 2.2% and recent GDP figures showing near-stagnant growth, the BoE is under pressure to cut rates at its upcoming meeting. This policy divergence is creating a clear path for potential GBP/USD weakness, a scenario we watched develop closely last year. Given this divergence, we believe traders should consider buying put options on GBP/USD to position for a potential decline towards the 1.3200 level. Last year, we saw how quickly the pair could move when central bank expectations shifted against the pound. The current setup, with a hawkish Fed and a dovish BoE, presents a similar opportunity. The upcoming central bank meetings introduce significant event risk, suggesting higher volatility ahead. We remember how implied volatility on currency pairs jumped during the geopolitical flare-ups of 2025. Therefore, using options strategies like straddles, which profit from a large price move in either direction, could be a prudent way to trade the uncertainty. Create your live VT Markets account and start trading now.

Start trading now – Click here to create your real VT Markets account

Australia’s Energy Minister announced up to 762 million litres from reserves to offset Iran-related fuel disruptions

Australia will release up to 762 million litres of fuel from its reserves after easing stockholding rules. The move is intended to manage fuel supply disruptions linked to the Iran conflict. The government also plans to cut minimum fuel stockholding obligations by up to 20%. The change is designed to increase flexibility during the disruption.

Market Reaction And Current Pricing

West Texas Intermediate (WTI) was down 1.05% on the day at $93.85 at the time of writing. We saw how Australia’s decision back in late 2025 to release fuel reserves initially pushed West Texas Intermediate prices down. This was a classic short-term reaction to a supply-side announcement, as the market priced in the immediate availability of more fuel. That dip to around $93 proved to be temporary as the underlying supply chain risks from the Iran conflict remained. Looking at the market today, March 13, 2026, WTI is trading closer to $88 per barrel after a volatile start to the year. Recent data from the U.S. Energy Information Administration now points to a potential global supply surplus of nearly 500,000 barrels per day for the second quarter. This forecast is creating downward pressure and suggests the initial supply panic from last year has been absorbed. The key for us in the coming weeks is the elevated implied volatility in the options market. The CBOE Crude Oil Volatility Index (OVX) is hovering around 37, which is significantly higher than the levels below 30 we saw before the conflict escalated in 2025. This environment suggests selling options premium through strategies like iron condors or strangles could be profitable, assuming no major escalation. We should also remember the lessons from the massive strategic reserve releases that occurred back in 2022. Historically, these government actions provide a temporary ceiling on prices but do not fix the fundamental geopolitical problems driving the risk. Therefore, any sharp price drops in the coming weeks on further supply news could be viewed as buying opportunities for longer-dated futures contracts.

Geopolitical Risks And Shipping Constraints

Our primary focus must now shift back to the geopolitical situation and tanker traffic through the Strait of Hormuz. Shipping data from early March 2026 shows insurance premiums for vessels in the region are still 15% higher than they were a year ago. Any actual disruption to passage there would immediately override inventory data and send prices sharply higher. Create your live VT Markets account and start trading now.

Start trading now – Click here to create your real VT Markets account

Back To Top
server

Hello there 👋

How can I help you?

Chat with our team instantly

Live Chat

Start a live conversation through...

  • Telegram
    hold On hold
  • Coming Soon...

Hello there 👋

How can I help you?

telegram

Scan the QR code with your smartphone to start a chat with us, or click here.

Don’t have the Telegram App or Desktop installed? Use Web Telegram instead.

QR code