VT Markets: The adjustment risk of Constituent stocks in DAX30.

Dear our honorable clients:

VT markets provides major economies’s primary stock index from all over the world for contract transactions, including DAX30 index releases from Deutsche Börse Group.

In order to increase DAX30’s market competitive ability, since 2020 November Deutsche exchange continuing to impose more rigorous membership condition including profit eligibility criteria and financial report.
Recently, they announced a big revolution:

DAX30’s constituent stock will increase 10 more stocks which make blue chip DAX index from 30-40.

What is 【German DAX30 index】?
DAX30 index is combine with 30 biggest market value of international enterprise in German. In some circumstances, it represents Germany economy’s status.

These company are all required to listed in Frankfurt Stock Exchange (FWB), as result it also called (Frankfurt index)

Current constituent stocks of DAX30 are as follow:

German is the biggest economy in Europe, European Central Bank’s headquarters is also at German Frankfurt, DAX30 is as important as FTSE100 and Franch FRA-40 in Securities Index.

In this adjustment, added what kind of constituent stock?
In this adjustment to increase the visionary of Deutsche Börse Group, they add ten well-known companies as follow:

1. Airbus SE
2. Brenntag SE
3. HelloFresh SE
4. Porsche Automobil Holding
5. PUMA SE
6. Qiagen N.V.
7. Sartorius AG Vz
8. Siemens Healthineer AG
9. Symrise AG
10. Zalando SE

Is there any influence on investors in increasing constituent stocks?
1. After the adjustment, you can still hold on to your position.
2. The contract name (DAX30) and the specification in the contract will maintain as usual.

What kind of influence will be if the increased number of the constituent stocks?

1. The increase of the constituent stock means the market movement of diverse and liquidity will be improved.

2. From the influence of stock price: The number of constituent stocks increases can reduce the effect from the sudden individual stock price fluctuates sharply, let the long-term index price trend to steady.

We predict that DAX30 market price will not fluctuate by the increasing number of constituent stock.
However, Investors should pay attention at the investors emotions causes by this adjustment, and market change.

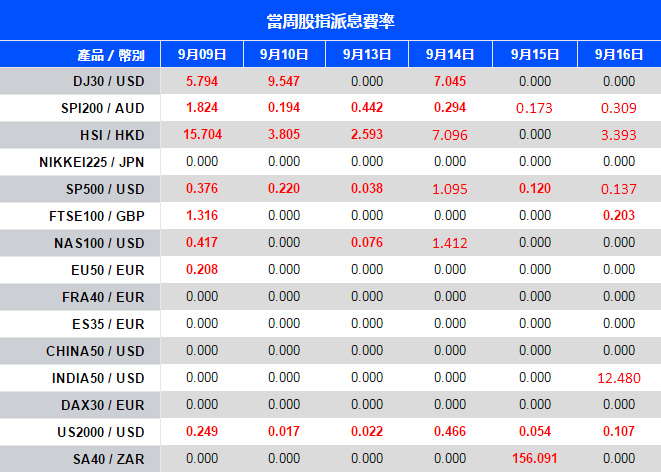
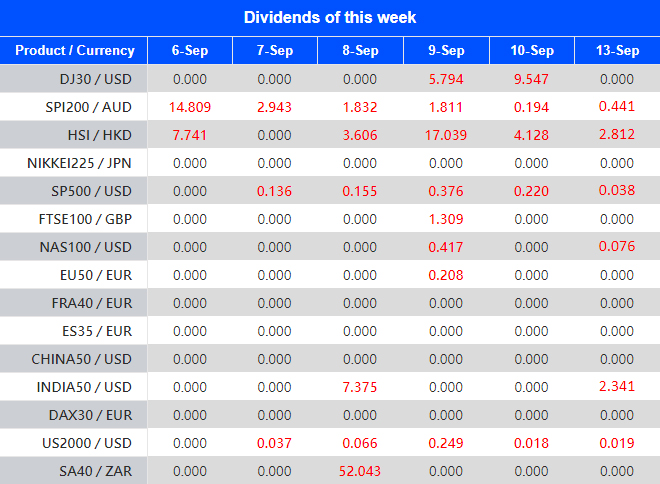
3. From the perspective of the distribution of shares: we can find that in the weekly update of the “Dividend Assignment Adjustment of the Week” data, DAX30 has maintained a value of 0 for a long time.

This is not because DAX30 does not pay dividends, but the dividends distributed by Deutsche Börse DAX30 will be directly reinvested in the stock market.

This is also the biggest difference between DAX30 and other stock indexes.

As result, DAX30 when the constituent stocks pay dividends, the price change of DAX30 will be slightly more severe than other stock indexes.

The increase in constituent stocks is accompanied by an increase in the frequency of dividend assignments, and price changes due to dividends may be more frequent.

Warming tips:
The adjustment will be Monday September 20, if you still hold on to DAX30 position before the market is closed at 4 AM on September 18 Saturday (GMT+8), please make sure that there is sufficient available margin in your account to deal with the market risk that may exist when the market opens on Monday.

If you have any questions, our team will be happy to answer your questions. Please mail to [email protected] or contact the service online.

Daily Market Analysis

Market Focus

US stocks advanced today, ending a five-day slide. Energy group gave a remarkable performance among all. Crude oil prices surged approximately 1.5% on Monday, which leads to a 2.94% gain for energy companies. OPEC Monthly Report released on Monday predicted a stronger demand for its crude oil on a combination of rising fuel consumption and output disruptions elsewhere. Industrial metals also rose, as the price of aluminum reached the highest level in 13 years at $3000 a ton.

Health care companies, on the contrary, are the worst performing group on Monday. Moderna Inc slipped 6.60% on a daily basis, which weighed on the Nasdaq 100 index and kept it in negative territory. On top of that, market sentiment soured over the past few weeks, as investors concerned about the spread of Delta variant around the world will obstruct economic growth. Retail and travel stocks declined.

Market focus now shift to US core CPI data, which is scheduled to be released on Tuesday. Investors will use the reading to assess expectations about the timing of bond tapering and interest rate hikes. The CPI measures price change from the perspective of the consumer. It is a keyway to measure changes in purchasing trends and inflation.

Meanwhile, President Joe Biden’s $3.5 trillion tax-and-spending plan faced challenges. House Democrats on Monday released a package of tax increases that falls short of President Joe Biden’s ambition. The Democratic proposal from the Ways and Means Committee would raise the top corporate tax rate to 26.5% and the top rate on capital gains to 25%, both less than what Biden had proposed. Including a 3.8% Medicare surtax on high earners, the top capital gains rate would be 28.8%.

In Asia, Chinese technology stocks plunged as Beijing officials wants to break up Alipay, the app owned by Ant Group which has more than 1bn users, and create a separate app for the company’s highly profitable loans business.


Main Pairs Movement:

Most USD based currency pairs saw declines on Monday, as the Greenback continues its strong upward momentum. The U.S. Dollar Index (DXY) saw a combined gain of 0.18% since last Friday, and a combined gain of 0.46% over the past week. A slower than expected economic recovery and the imminent release of CPI data this week has provided strong tailwind for the Dollar. As a key inflation signal, the CPI data release, scheduled for the 14th, will provide a clearer outlook to the Fed’s bond tapering schedule.

On Monday, house Democrats have pieced together their initial proposal for a new wave of corporate tax increases over the next few years. The Democrats are aiming for a 26% increase on corporate tax rates, to 26.5% compared to 21% currently, a 3% surtax on individuals earning over 5 million dollars a year, and a newly raised capital gains tax. This new tax bill proposal by the Democrats is their first step to achieving President Joe Biden’s tax agenda that he set during last year’s campaign.

This Tuesday’s scheduled U.S. core CPI release by the BLS will bring substantial volatility to the currency market. Inflationary sentiment will be highly related to this report, and investors will be looking for any clues about the Fed’s bond tapering schedule.


Technical Analysis:

GBPUSD (4-hour Chart)

The GBP/USD pair gained slightly on Monday, crawling back some of the losses on Friday; however, once American trading hours began, Cable saw a steap drop then a rapid recovery but saw resistance at 1.384. The greenback, supported by elevated producer price figures for August, remains bullish, suppressing Cable at its current price level and creating strong resistance at the 1.3895 price level, which has been unsuccesfully tested by Cable three times over the last month. Key CPI statistics are due on Tuesday, and if inflation remains high, the Federal Reserve could move up its bond tapering schedule.

For technical aspect, RSI indicates 51, as of writing, suggesting bullish sentiment. Currently, Cable sits at the center of the bollinger bands with no clear movement direction after hitting the upper band on the 10th.

Resistance: 1.3857, 1.3884, 1.3958

Support: 1.3756, 1.3680, 1.3602


USDCAD (4- Hour Chart)

The USD/CAD pair did not see much price movement during the European trading session, the pair hovered between 1.266 and 1.269; however, once the American trading session began, the pair saw strong selling pressure and dropped as much as 0.29% to the day’s low of 1.266 over the first three hours of trading. The pair recovered towards the end of the American trading session and gained back 0.25% and the pair is trading at 1.267, as of writing. The upward movement of WTI has provided some level of support for the loonie, but the strength of the greenback seems to offset the momentum provided by oil’s price rise.

For technical aspect, RSI indicates 55 figures, suggesting that there is some bullish buying. The pair currently sits at the middle of the Bollinger Bands and is trading above the 50, 100, and 200 day moving average.

Resistance: 1.2708, 1.2834, 1.2912

Support: 1.2581, 1.252, 1.2494


AUDUSD (4- Hour Chart)

The AUD/USD pair began the day dropping 0.13%, but quickly recovered after the American trading session began. The pair met resistance at around the 0.737 price level and has since retraced back to around the 0.735 price level, as of writing. The pair snapped its week long losing streak and has now found some support at the 0.735 prive level. The strong Dollar has supressed the pair’s growth, and this week could lead to more bulling greenback movements as CPI data for August is due this Tuesday. Higher than expected U.S. CPI data could, once again, bring strong downward pressure for AUD/USD.

For technical aspect, RSI indicator 44 figures as of writing, suggesting mild bearish sentiment ahead. Currently, the pair sits in the lower half of the Bolliner bands, while resistance for the pair sits at the middle of the Bollinger bands. As indicated earlier, higher than expected U.S. CPI data would put strong bearing pressure on the pair, thus lower support levels sit at 0.7285 and 0.7222

Resistance: 0.7468, 0.7534

Support: 0.735, 0.7285, 0.7285, 0.7222


Economic Data

Currency

Data

Time (GMT + 8)

Forecast

GBP

Unemployment Rate (July)

14:00

4.6%

CHF

PPI (Aug)

14:30

USD

Core CPI MoM (Aug)

20:30

0.3%

USD

Core CPI YoY (Aug)

20:30

4.2%

USD

CPI MoM (Aug)

20:30

0.4%

CAD

Manufacturing Sales MoM (Jul)

20:30

-1.2%

Daily Market Analysis

Market Focus

U.S. equities notched their biggest weekly decline since mid-June in volatile trading as investors assessed the latest read on the economy after more strategists weighed in with cautious comments on the market.

The S&P 500 fell 0.8%, pushing its loss for the holiday shortened week to 1.7%. Apple Inc. was the biggest decliner in the Dow Jones Industrial Average on Friday, after a court ordered the iPhone maker to make a change to the way it generates money from its App Store. Gold posted its first weekly decline since early August after data on U.S. producer prices rekindled debate over when the Federal Reserve will pull back on stimulus.

Markets have been volatile as the continued spread of Covid-19 has undermined the economic recovery and lifted supply-shock inflation, even as central banks reaffirm an accommodative stance. In the U.S., equities have been whipsawed amid mixed economic data and a lack of clarity on the Fed’s timeline for reducing its asset purchases. On Friday, data showed the producer price index for final demand, a key measure of inflation, increased more than expected last month.

Strategists from almost all the top Wall Street banks have come out this week with a nervous message about the U.S. stock market. The common themes in their analysis include valuations at historical extremes, a near non-stop rally for seven months, an economy that looks soft and the imminent tapering of Fed stimulus.

Apple dropped 3.3%, the most since earl May. A federal judge said Friday that the company must let app developers steer consumers to outside payment methods.

In Europe, the Stoxx 600 fell 0.3%, with telecommunications and utilities underperforming, while miners and technology led the gainers. The European equities benchmark posted a second weekly loss, the first time that’s happened since the end of April, as investors reduced their risk on concern that central bank stimulus measures might get pulled back quickly.


Main Pairs Movement:

Most commodity currencies gained against the dollar after a call between U.S. President Joe Biden and Chinese leader Xi Jinping boosted risk sentiment, despite U.S. stocks fluctuating on growth concerns.

Traders on Friday were also focused on trade tensions with China. The Biden administration is weighing a new investigation into Chinese subsidies after the U.S. president urged China’s Xi Jinping to cooperate on a phone call.

The Canadian dollar touched a session high after the country’s employment report showed job growth beating estimates, rising 90.2K versus the 68.2K forecast; USD/CAD is edging lower to 1.2658, after dropping as much as 0.6%.

EUR/USD edges lower to 1.1816; pair rose as much as 0.2% to 1.1851 earlier end to active week of hedging. Swiss franc and Japanese yen weakened against the dollar Friday; USD/JPY advances 0.2% to 109.93. The pound shrugged off data showing the U.K.’s economic rebound ground to a halt in July, with focus on a hawkish tilt from the Bank of England; GBP/USD gains less than 0.1% to 1.3844


Technical Analysis:

GBPUSD (4-hour Chart)

The GBP/USD pair advanced on Friday, reaching a fresh weekly high around 1.3888 level. But the pair failed to preserve its bullish traction afterwards, retreating back during American trading hours. The cable was last seen trading at 1.3851, rising 0.11% on the day as of writing. The Bank of England Governor Andrew Bailey’s hawkish comments on Wednesday provided some bullish momentum for GBP/USD, he said that half of the MPC members believe the basic conditions for a rate hike had been met.

For technical aspect, RSI indicator 58 figures as of writing, suggesting bull-movement ahead. The MACD also rises above the signal line, which means the pair is likely to experience upward momentum. In conclusion, we think market will be bullish. As for the Bollinger Bands, the price is now sitting between the upper band and the moving average, which also indicates a bull market.

Resistance: 1.3892, 1.3949, 1.3983

Support: 1.3751, 1.3680, 1.3602


USDCAD (4- Hour Chart)

The USD/CAD pair was surrounded by heavy selling pressure during European trading hours, touching a three-day low on Friday. Fortunately, the pair have rebounded back to 1.264 level after American session began, offsetting half of its losses for the day. The pair is trading at 1.2643 at the time of writing, posting a 0.16% loss on a daily basis. The larger-than-anticipated drop in the unemployment rate in Canada, which down to 7.1% in August, giving a boost for the Canadian dollar. On top of that, crude oil prices surged 2.4% for the day, which also set the bullish tone for the commodity-linked loonie.

For technical aspect, RSI indicator 51 figures as of writing, suggesting that there is no obvious trend now. But the Bollinger Bands shows that the price rises from the lower band and it’s moving toward the SMA line, which indicates a bull market. In conclusion, we think market will be bullish as the pair heads to test the 1.2673 resistance, a break above that level will open the door for additional near-term profits. The next resistance sits at 1.2728.

Resistance: 1.2673, 1.2728

Support: 1.2583, 1.2552, 1.2520


AUDUSD (4- Hour Chart)

The AUD/USD pair gave a remarkable performance in the first half of the day, rising above 0.7405 level. But it’s a whole different story once the American session begins. The pair lost its bullish momentum and dropped sharply, eliminating most of its profits for the day. A rebound witnessed in US dollar weighed on the AUD/USD, as the market mood turns cautious ahead of the weekend. Therefore, the demand of the safe-haven dollar is increasing. At the time of writing, the pair is trading at 0.7365, rising merely 0.01% for the day.

For technical aspect, RSI indicator 43 figures as of writing, suggesting tepid bear-movement ahead. For Bollinger Bands, price is falling from the upper band and crossing below the moving average, as a result, the lower band becomes the loss target. In conclusion, we think market will be bearish as the pair is now heading to test the 0.7345 support.

Resistance: 0.7427, 0.7455

Support: 0.7345, 0.7285, 0.7222, 0.7106


Economic Data

Currency

Data

Time (GMT + 8)

Forecast

OIL

OPEC Monthly Report

19:00

VT Markets The Adjustment Of Weekly Dividend Notification

Dear Client,

Warmly reminds you that the component stocks in the stock index spot generate dividends. When dividends are distributed, VT Markets will make dividends and deductions for the clients who hold the trading products after the close of the day before the ex-dividend date.

Indices dividends will not be paid/charged as an inclusion along with the swap component. It will be executed separately through a balance statement directly to your trading account, the comment for which will be in the following format “Div & Product Name & Net Volume ” .

Please note the specific adjustments as follows:

Note: The above data is for reference only, the actual execution data may be changed, please refer to the MT4 software for details.

If you’d like more information, please don’t hesitate to contact [email protected].

Daily Market Analysis

Market Focus

U.S. stocks fell in volatile trading as mixed economic data kept investors on edge about the timing of stimulus tapering even as the relentless spread of the Covid-19 delta variant undermines global growth. The S&P 500 notched a fourth straight decline after erasing an intraday gain that had brought it to within 0.4% of its all-time high. The dollar weakened and 10-year U.S. Treasury yields declined. European equities fell, with the Stoxx 600 erasing the initial advance it saw after the European Central Bank said it will slow its emergency support but keep policy accommodative.

The European Central Bank will slow the pace of its pandemic bond-buying program in the final quarter of 2021, a shift President Christine Lagarde insists isn’t a move heralding a wind-down in stimulus for the euro-region’s still-vulnerable recovery.

Lagarde spoke after the Governing Council decided it will conduct purchases at a “moderately lower pace” than the roughly 80 billion euros ($95 billion) of monthly acquisitions deployed in the past two quarters. She justified the decision by saying the euro region’s “increasingly advanced” rebound could be maintained with less monetary help.

The president also cautioned that the global spread of the delta variant could yet delay the full reopening of the economy. Officials, who revealed new forecasts showing inflation will still undershoot their target, reiterated a pledge to keep the 1.85 trillion-euro program running until March 2022 or later if needed, signaling they’re not yet ready to discuss ending the measure.

The ECB’s move to persist with stimulus contrasts with major central banks elsewhere, a differing stance Lagarde’s comments implicitly emphasized. The U.S. Federal Reserve and the Bank of England have signaled their intention to gradually unwind crisis-era aid.

The timetable for slower purchases in the next three months now makes the Dec. 16 meeting a crucial one for the future of the central bank’s stimulus programs. While the president said the decision was unanimous, keeping that consensus may be a challenge among policy makers whose judgments on the threat posed by inflation are known to differ.


Main Pairs Movement:

Cable shined amid a quiet day in the forex space, gained 0.5%. The surge in Cable is more convincing from a technical perspective rather than a fundamental one. That said, Cable’s fundamental outlook is mixed. On the positive side, BoE Governor Bailey and other MPC members see minimal condition to consider rate hike has been met. But, upcoming increase in tax rate proposed by Prime Minister Borris Johnson may weigh on the Sterling.

Euro dollar was mostly muted on Thursday despite ECB’s announcement of winding down monthly asset purchases to 60 to 70 billion euros. In the past two quarters, the PEPP program devoted 80 billion euros every month to help prop up the united economy. As health authorities around the world started to roll out vaccination in the beginning of the year, Euro Zone has seen COVID-19 infections dropped significnatly as of late, and economic activities are set to return to normal. However, ECB is still a long way from nudging interest rate to above 0% as President Largarde repeatedly reminded that this is NOT a “taper”.

We have seen relatively strong performance in safe-haven dollar, the Japanese Yen and Swiss Franc, climbed 0.49% and 0.54% respectively. The move was consistent with a drop in US Treasury yields, with the 10-year yield down 0.38%. An increase in demand for hedging may foreshadow a retreat risk appetite in the financial market as concerns of a freshly emerged variant, which has come be known as the ‘Mu’ variant, may pose challenge to current recovery around the globe. The lastest WHO report suggest ‘Mu’ variant can surpass immune defence and cause infection. More importantly, it is already making its presence internationally, and has spread to over 49 US states and 40 different countries worldwide.


Technical Analysis:

CHFJPY (Daily Chart)

CHFJPY is edging its way toward the lower bound of a big ascending tunnel, and threatened for a breakout to the downside. Prices continues to be choppy in the past few days after neck-line of a double-top pattern, coincided with the purple descending trendline, managed to cap further upward moves.

Given price is gradually deviating from a heavily guarded resistance zone bove, the odds are favouring sellers. In order to establish a convincing bearish reversal, sellers will have to breach support line at 119.2 and the aforementioned ascending trendline. If succeeded, we could be looking at further downside space at 117.4 and 115.74, levels that were last seen in April.

Resistance: 120.55, 122.8

Support: 119.2, 118, 116.9


GBPUSD (Daily Chart)

Cable shrugged off bearish moves in the last three days, advanced 0.5% on Thursday. This pair registered a long lower wick yesterday as price plunged as much as 0.43%, then rebounded on 61.8% Fibonacci support of 1.373, and settled above SMA20. The fact that price failed to penetracte SMA20 is leading up today’s surge.

In a broader picture, we could see Cable broke above a three-month descending trendline, then retraced downward to validate the breakthrough was solid. Now the bullish reversal is coming close to completion, the last obstacle would be previous high of 1.3874. Further in the north, big resistance sits around 1.396 and 1.41, the former has been keeping Cable subdued since June.

Resistance: 1.387, 1.396, 1.41

Support: 1.373, 1.367, 1.357


EURJPY (Daily Chart)

Selling bias for EURJPY is being carried over on Thursday, plunged 0.36%. This pair has formed a small double-top pattern, and today’s leg lower aided to finish up the formation. There is limited downside space to capitalize on. As we highlighted in the daily chart, bulls has set up a defense zone around 129.3 and 129.5. This zone could collaborate with SMA20 to provide robust support to EURJPY.

On the upside, bulls will look to contest recent high of 130.56. If conquered, doors will be wide open to potential upward move to 132.2. Conversely, any radical downside plunges will be bounded by 128.38.

Resistance: 130.56, 132.2, 134.13

Support: 129.3-129.5, 128.38


Economic Data

Currency

Data

Time (GMT + 8)

Forecast

GBP

GDP (MoM)

14:00


GBP

GDP (YoY)

14:00


GBP

Manufacturing Production

(MoM) (Jul)

14:00

0.1%

GBP

Monthly GDP 3M/3M Change

14:00


RUB

Interest Rate Decision

(Sep)

18:30

7.00%

USD

PPI (MoM) (Aug)

20:30

0.6%

CAD

Employment Change

(Aug)

20:30

100.0K


Daily Market Analysis

Market Focus

U.S. equities retreated as investors reassessed valuations in light of global economic risks including the spread of the Covid-19 delta variant and reductions in central bank stimulus.

The Nasdaq 100 was headed toward its biggest drop in two weeks, with losses in megacaps including Apple Inc. and Facebook Inc. contributing most to the decline. The S&P 500 fell for a third day since it closed at a record on Sept. 2. The Dow Jones Industrial Average extended its retreat from last month’s all-time high to more than 1.5%. Europe’s Stoxx 600 dropped to a three-week low. Cryptocurrency-exposed stocks slumped as a selloff in Bitcoin continued.

Wednesday’s declines came as money managers from Morgan Stanley to Citigroup have turned cautious on U.S. equities. Many investors have begun to see relative U.S. valuations as excessive even as growth elsewhere suffers from renewed Covid lockdowns and travel curbs. They doubt the world is ready for an eventual tapering of central-bank stimulus even as inflation accelerates due to supply shocks. End-of-year seasonality and valuation concerns are adding to the gloomy mood.

In Europe, growth concerns were compounded by speculation that the European Central Bank is getting ready to slow down emergency stimulus. Meanwhile, the continued spread of Covid-19 is curbing economic activity around the world. The Philippines backtracked on easing curbs in the capital region, while Japan may extend state of emergency orders. Taiwan identified a delta variant outbreak in New Taipei City.


Main Pairs Movement:

The recent rebound witnessed in US dollar continued on Wednesday, as greenback reached the highest level since August 27 during American session. The US dollar’s strength was mainly caused by the broader market risk sentiment, investors worried that the surge in delta variant cases around the world could obstruct the global economic recovery, therefore benefitted the safe-haven US dollar. The DXY index is at 92.662 as of writing, rising 0.15% on a daily basis. The greenback finds demand amid the souring market mood. Furthermore, US JOLTs Job Openings released on Wednesday gave a better-than-expected reading. And Fed’s John Williams also suggested that it’s appropriate to start tapering this year.

EUR/USD and GBP/USD both declined on Wednesday amid stronger US dollar across the board, trading at 1.1823 and 1.3780, respectively. EUR/USD was trading lower on Wednesday, once falling under 1.1805 level and posted a 0.12% loss on the day as of writing. Market focus now shifts to the European Central Bank’s interest rate decision on Thursday.

USD/JPY edged lower today, as the pair failed to preserve its upward traction in early trade and took a hit right after the European session began. The pair is trading at 110.23 and posted a 0.02% loss on the day as of writing.

Gold slipped on Wednesday, as the bearish momentum last for the third consecutive day. The raising demand of US dollar and a risk-off environment keep putting selling pressure on gold. The precious metal is now trading at 1788.82, losing 0.29% on a daily basis. WTI Crude Oil, on the contrary, soared more than 1.4% on Wednesday.


Technical Analysis:

GBPUSD (4-hour Chart)

The GBP/USD pair declined on Wednesday, touching a fresh weekly low during European trading hours. Despite trying to bounce back above 1.3790, it is still lower for the day. The cable was last seen trading at 1.3777, losing 0.06% on the day as of writing. The recent rally in US dollar keep weighing on the British Pound. Meanwhile, British Prime Minister Boris Johnson plans to introduce a new 1.25% health and social-care levy on earned income, which also limit any meaningful recovery for the GBP/USD pair.

For technical aspect, RSI indicator 42 figures as of writing, suggesting tepid bear-movement ahead. The MACD indicator also shows a negative histogram which indicates a bearish signal. In conclusion, we think market will be bearish. But for the Bollinger Bands, price seems to rise back inside the band after falling out of the lower band, therefore, invstors should look for signs of trend reversal.

Resistance: 1.3857, 1.3892, 1.3958

Support: 1.3731, 1.3680, 1.3602


USDCAD (4- Hour Chart)

The USD/CAD pair advanced on Wednesday, reaching the highest level since August 23 for a time. The pair rallied after the BoC interest rate decision was released, but then slipped deeper back to 1.2648, eliminating most of its profits. The pair is trading at 1.2670 at the time of writing, posting a 0.19% gain on a daily basis. The Bank of Canada decided to keep its overnight rate unchanged at 0.25% and the QE program is also maintained at C$ 2 billion per week. The dovish monetary policy provide some positive momentum for the USD/CAD pair.

For technical aspect, RSI indicator 68 figures as of writing, suggesting the buying power is relatively stronger. The MACD indicator also shows a positive histogram which indicates a bull market. In conclusion, we think market will be bullish as the pair heads to test the 1.2708 resistance, a break above that level will open the door for additional near-term profits. The next resistance sits at 1.2834.

Resistance: 1.2708, 1.2834, 1.2949

Support: 1.2581, 1.2520, 1.2494


AUDUSD (4- Hour Chart)

The AUD/USD pair was trading higher in early trade on Wednesday, but the bullish momentum didn’t last long. The pair dropped to fresh seven-day low and dipped further during American session. A stronger US dollar across the board leaves the AUD/USD pair in the negative territory. On top of that, the RBA released its interest rate decision on Tuesday, as they kept the benchmark interest rate at 0.1%, same as market’s forecast. But the delta outbreak made the central bank decide to extend the bond purchases, which weighed on the Australian dollar. At the time of writing, the pair is trading at 0.7379, losing 0.06% on the day.

For technical aspect, RSI indicator 43 figures as of writing, suggesting tepid bear-movement ahead. The MACD also falls below the signal line, which means the pair is likely to experience downward momentum. In conclusion, we think market will be bearish as the pair is now testing the 0.7356 support. For Bollinger Bands, the price is now sitting between the moving average and the lower band, which also indicates a bear market.

Resistance: 0.7468, 0.7534

Support: 0.7356, 0.7285, 0.7222


Economic Data


Currency

Data

Time (GMT + 8)

Forecast

EUR

Deposit Facility Rate (Aug)

19:45

-0.50%

EUR

ECB Marginal

Lending Facility

19:45


EUR

ECB Monetary

Policy Statement

19:45


EUR

ECB Interest Rate

Decision (Aug)

19:45


USD

Initial Jobless Claims

20:30

335K

EUR

ECB Press Conference

20:30


USD

Crude Oil Inventories

23:00

-4.612M


Daily Market Analysis

Market Focus

The S&P 500 and Dow Jones Industrial Average declined, while gains in heavyweight tech stocks including Netflix Inc., Amazon.com Inc. and Apple Inc. pushed the Nasdaq 100 higher even as about seven out of every 10 stocks in that gauge dropped. European markets slipped as investors speculated that euro-zone policy makers may get ready to roll back stimulus. The greenback strengthened for a second day amid rising bond yields and softer commodity prices. Bitcoin plunged as El Salvador became the first country to adopt it as legal tender Tuesday.


一張含有 文字 的圖片

自動產生的描述


The largest cryptocurrency fell as low as $43,050 in New York Tuesday, before paring losses. Bukele said his country had taken advantage of the crash to “buy the dip”, adding 150 coins to take its total holding to 550, worth about $26 million.

El Salvador’s plan represents the biggest test for Bitcoin in its 12-year history. Both enthusiasts and detractors of cryptocurrencies are monitoring the experiment to see if a significant number of people want to transact with Bitcoin when it circulates alongside the U.S. dollar, and whether it brings any benefits to the violent, impoverished Central American nation.

If the experiment is a success, other countries may follow El Salvador’s lead. Its adoption will get an initial boost from the government’s Bitcoin wallet Chivo, which comes pre-loaded with $30 worth of the currency for users who register with a Salvadoran national ID number.

Businesses will be required to accept Bitcoin in exchange for goods and services and the government will accept it for tax payments. The plan is the brainchild of El Salvador’s 40-year-old president, who says it will draw more people into the financial system and make it cheaper to send remittances

“This is brave new world stuff,” said Garrick Hileman, head of research for the London and Miami-based Blockchain.com. “We are in unchartered waters with this launch, but I’m glad to see this experiment happen overall, and I think we’ll learn a lot from it.”


Main Pairs Movement:

The US dollar traded higher after surge in delta-variant infections weigh on risky currencies, the dollar index climbing 0.37% on Tuesday. According to Reuters’ data, there were more than 20,800 people died from the coronavirus in the United States in the last two weeks, that is a 67% increase from prior two weeks. Situations in Australia and New Zealand are not so encouraging as both governments look to extend lockdowns further in the second half of 2022.

USDCAD surged 0.9% amid weaker oil prices. The Bank of Canada will announce its interest rate decision on Wednesday. Though Governor Tiff Macklem hinted their intention to lift interest rate in the second half of this year, but investors doubt that they will act in September. That said, BoC is likely to path their way toward a rate hike during tomorrow’s meeting.

Euro was the most resilient currency against the dollar greenback during Tuesday’s session albeit dropped 0.25%. The shared currency was underpinned by market optimism surrounding ECB’s meeting on Thursday. Analysts expect ECB to undergo a debate to cut its current PEPP weekly purchase of 80 billion euros to 60 billion euros. Given ECB’s past unpleasant experience at failing to achieve 2% inflation target, July’s overshoot of 2.2% Harmonized Index of Consumer Index marked a milestone for policy makers. And with the PEPP comes to an end on March 22, 2022, central bankers need to the afterlife of a ultra-loose monetary policy.


Technical Analysis:

EURUSD (Daily Chart)

Euro dollar was restrained from advancing beyond 1.189, retreated mildly on Tuesday. It successfully capalized on decent upside gains after conquering a dynamic resistance at SMA20. However, the stubborn road block at 32.8% Fibonacci of 1.189 continues to ward off bulls’ attempt to break above.

We expect the single currency to trade marginally lower against the dollar prior to ECB’s critical policy announcement on Thursday. With market participants look to hear a less dovish tone from the ECB, a lower price could provide some leeway for upward surge.

On the downside, nearest support line sits around 1.18, followed by 1.166. Up in the north, bulls could contest 1.198 and 1.1207 if they could take out 1.189.

Resistance: 1.189,1.196, 1.2

Support: 1.18, 1.166


NZDCHF (Daily Chart)

NZDCHF remains bullish despite snapping a ten-winning streak. This pair broke above a seven-months downward tunnel with robust buying bias. Though some may think current price is overstreched, and some sort of pullback should unfold soon. But we believe bulls could at least challenge resistance at 38.3% Fibonacci of 0.6567 before it could stage a retreat toward 0.65 or 0.644. The RSI indicates price is on the cusp of stepping into overbought zone, which provides incentive for buyers to continue to drive price higher, and as soon as price is overheated, they could exit current longs.

The fact that NZDCHF had a convincing breakthrough on SMA20 on the weekly chart has signaled a bullish reversal. All in all, we see further upside gains in NZDCHF in a longer investment horizon. A modest retreat could be very healthy to sustain such bullish trend.

Resistance: 0.6567, 0.6645, 0.677

Support: 0.65, 0.644, 0.6353


XAUUSD (Daily Chart)

Gold plunged to two weeks’ low at $1795 after failing to surpass a stern resistance at $1835.

Current retreat could be seen as a validation of $1795 support, which acted as a neckline for previous double-top pattern. This horizontal support could also collaborate with dynanmic SMA20 to eke out Gold price. That said, the odds are favouring buyers, and we expect another contest of $1835 to take place soon.

However, it is still unclear whether it could gather enough momentum for a solid upward breakout in the near term. We would not be surprised if the yellow metal enters consolidation mode for the rest of September given the lack of price movers in the market. Investors already knew the Federal Reserve will not taper until November or December.

Resistance: 1860, 1910, 1950

Support: 1797, 1768, 1728


Economic Data


Currency

Data

Time (GMT + 8)

Forecast

JPY

GDP (QoQ) (Q2)

7:50

0.4%

USD

JOLTs Job Openings (Jul)

22:00

10.000M

CAD

BoC Interest Rate Decision

22:00

0.25%

CAD

Ivey PMI (Aug)

22:00


GBP

Inflation Report Hearings 

23:00


CAD

BOC Press Conference

Tentative


Daily Market Analysis

Market Focus

Global stocks rose for a seventh day and U.S. equity-index futures rallied as investors bet slower hiring in the world’s largest economy may delay a tapering of Federal Reserve stimulus. Aluminum hit a decade high amid political unrest in Guinea.

MSCI Inc.’s gauge of world stocks gained for a fourth day even as U.S. markets were closed for Labor Day. In Europe, the Stoxx Europe 600 Index rose the most in six weeks, led by technology shares. Contracts on the S&P 500 Index climbed 0.2%. Aluminum supplier Norsk Hydro ASA jumped to a 13-year high in Oslo. Gold bounced between losses and a gain of 1.9%.

The latest U.S. jobs report threw traders’ calculations awry after they braced for an announcement of tapering at the Fed’s September meeting. The world’s largest economy added only 235,000 jobs in August — the smallest gain in seven months — boosting chances of a delay in that announcement.

“Expectations of a delay in Fed tapering as well as a new administration in Japan is supporting equity markets and we expect this to continue,” said Sebastien Galy, senior macro strategist at Nordea Investment Funds. “Buy-on-dip is as robust as ever, taking negative news such as U.S. nonfarm payrolls as good news which is typical of an advanced carry trade.”

Aluminum hit the highest in over a decade as political unrest in Guinea fueled concerns over supply of the raw material needed to make the metal. A unit of the military seized power and suspended the constitution, raising the possibility of disruption to bauxite shipment from the key global supplier.


Main Pairs Movement:

After slumping to a three-week low last Friday, the US dollar rebounded back on the first day of new trading week. The strong selling pressure on US dollar last Friday was caused by disappointing Nonfarm Payrolls data, as the report missed the market expectation of 750,000 by a wide margin. The DXY index is at 92.222 as of writing, rising 0.11% on a daily basis. Trading conditions remain thin due to the Labor Day holiday in the US. But concerns about slowing global growth supported the safe-haven currency, therefore, lifted the greenback up to post a moderate comeback.

EUR/USD and GBP/USD both declined on Monday amid stronger US dollar across the board, trading at 1.1868 and 1.3834, respectively. EUR/USD was trading lower on Monday, once falling under 1.1860 level and posted a 0.08% loss on the day as of writing. The European Central Bank will release its interest rate decision on Thursday.

USD/JPY advanced today, as the pair gained positive traction first, then steadily hovering around 109.8 level during American session. The pair is trading at 109.84 and posted a 0.014% gain on the day as of writing.

Gold slipped on Monday, as the raising demand of US dollar weighed on the metal throughout the day. Gold’s movement seems to be a correction of last Friday’s upsurge. The precious metal is now trading at 1822.94, losing 0.17% on a daily basis. WTI Crude Oil, in a similar way, dropped more than 0.4% on Monday.


Technical Analysis:

GBPUSD (4-hour Chart)

The GBP/USD pair declined on the first day of a new trading week, dropping below 1.3820 level at one time. The pair was surrounded by selling pressure and failed to bounce back during American trading hours. The cable was last seen trading at 1.3828, losing 0.25% on the day as of writing. The bearish movement witnessed in GBP/USD is result from the raising demand of US dollar. Meanwhile, looming Brexit concerns between the UK and the European Union over the Northern Ireland protocol also weighed on the British Pound. For technical aspect, RSI indicator 55 figures as of writing, suggesting tepid bull-movement ahead. But the MACD indicator shows a negative histogram and a death cross, which indicates a bearish signal.

In conclusion, we think market will be bearish as long as the 1.3892 resistance line holds. As for the Bollinger Bands, price is falling from the upper band and crossing above the moving average, as a result, the lower band becomes the loss target.

Resistance: 1.3892, 1.3958

Support: 1.3767, 1.3731, 1.3680, 1.3602


USDCAD (4- Hour Chart)

The USD/CAD pair was trading higher on Monday, then failed to climb higher during European session. The pair is trading at 1.2530 at the time of writing, posting a 0.05% gain on a daily basis. Following last two week’s slip, USD/CAD rebounds slightly amid stronger US dollar and the selling pressure witnessed in crude oil prices. For technical aspect, RSI indicator 39 figures as of writing, suggesting bear-movement ahead. For the Bollinger Bands, the price is now sitting between the lower band and the moving average, which also indicates a bear market.

In conclusion, we think market will be bearish as the pair is heading to retest the 1.2494 support, a break below that level will open the door for additional near-term losses. And the next support is at 1.2453. On top of that, the Bank of Canada will announce its interest rate decision on Wednesday, as the market expect BoC to raise rates in the second half of 2022 when inflation consistently hit 2%.

Resistance: 1.2559, 1.2638, 1.2708

Support: 1.2494, 1.2453, 1.2422


AUDUSD (4- Hour Chart)

The AUD/USD pair retreated on Monday and tooked a hit in early trade during Asian trading hours. It has been hovering around 0.7435 since then. The raising demand of US dollar and concerns about Delta cases are both putting pressure on AUD/USD. Victoria and New South Wales remain under lockdowns as Covid cases continue to rise. At the time of writing, the pair is trading at 0.7433, losing 0.22% on the day. For technical aspect, RSI indicator 66 figures as of writing, suggesting that the market is near the overbought zone, investors should note for possible selling signals. The MACD also falls below the signal line, which means the pair is likely to experience downward momentum.

In conclusion, we think market will be bearish as long as the 0.7478 resistance line holds. For Bollinger Bands, the pair is now falling from the upper band after touching it, which indicates a bear market. Furthermore, Reserve Bank of Australia will release its interest rate decision on Tuesday, the focus will be whether the RBA delays its tapering plans due to Covid-19 epidemic.

Resistance: 0.7478, 0.7534

Support: 0.7395, 0.7356, 0.7285


Economic Data

Currency

Data

Time (GMT + 8)

Forecast

AUD

RBA Interest Rate Decision

(Sep)

12:30

0.10%

AUD

RBA Rate Statement

12:30


EUR

German ZEW

Economic Sentiment

(Sep)

17:00

30.0


VT Markets The Adjustment Of Weekly Dividend Notification

Dear Client,

Warmly reminds you that the component stocks in the stock index spot generate dividends. When dividends are distributed, VT Markets will make dividends and deductions for the clients who hold the trading products after the close of the day before the ex-dividend date.

Indices dividends will not be paid/charged as an inclusion along with the swap component. It will be executed separately through a balance statement directly to your trading account, the comment for which will be in the following format “Div & Product Name & Net Volume ” .

Please note the specific adjustments as follows:

Note: The above data is for reference only, the actual execution data may be changed, please refer to the MT4 software for details.

If you’d like more information, please don’t hesitate to contact [email protected].

Daily Market Analysis

Market Focus

Disappointment over the U.S. August payroll report is all but certain to push Federal Reserve policy makers to delay considering a move to scale back asset purchases at their Sept. 21-22 meeting.

The addition of 235,000 jobs last month, falling well short of forecasts and the smallest jobs gain in seven months, suggests U.S. central bankers will need to see additional gains before starting to slow bond buying, economists said Friday following the Labor Department release.

Officials wants to see “substantial further progress” in jobs and inflation, and the hiring slowdown — blamed on a flare-up in Covid-19 cases — means moves in November or December are now more likely.

Stocks barely budged after Bloomberg News reported that Democratic lawmakers are considering slapping an excise tax on stock repurchases or treating them as taxable dividends as a way to offset some spending proposals.

On the face of it, that could see corporations slow the flood of cash into buybacks — some $370 billion already this year — that some argue props up share prices. But a possible proposal by one party, even the one with control of both legislative bodies, is a very long way from becoming law.

And if it did become enacted, the chances that the tax would have a meaningful impact on stocks remains low, money managers argued. With government spending and Federal Reserve largesse juicing the economy, dip-buyers have yet to let the S&P 500 Index decline by much more than 4% this year before swooping in.

The S&P 500 was little changed near an all-time high in trading volume 20% below the 30-day average, with many investors starting early on the three-day weekend.


Main Pairs Movement:

Non-US currencies flourished against the US dollar amid a devastating jobs report on Friday. August’s Non-Farm Payrolls figure printed 235,000, far missing anticipated 750,000. The concerning data indicated recovery in the labor market remains stalled. Spiking delta variant infections could contribute to the slowdown.

Today’s ugly NFP figure may foreshadow September’s number, which the Federal Reserve is desperately praying for. Given the importance between school season and parents’ availability, September’s NFP will critically determines the fate of Fed’s tapering program. It has to deliver a perfect report, similar to the one in July, in order to start unwinding its asset purchases.

Gold gained 1% to close the day around $1830. Judging from the performance in the US labor market, Gold should be well placed in an upward trajectory. However, big Gold ETF’s holding is somewhat contrary to current trend. The SPDR Gold ETF reduces holdings in the yellow metal by 103,000 ounces for the week of August 30th, the lowest volume recorded since last April. This suggests current incline in price may be temporary or pure speculative, and position could reverse quickly.


Technical Analysis:

XAUUSD (Daily Chart)

Gold climbed to one-month high of $1830 amid disappointing jobs data in the United States. The precious metal has made a remarkable comeback from a mini flash crash on August 9th, surged nearly 9% from the lowest point in the past six-months. Price is battling with a stubborn resitsance at $1830 handle. However, the sustained pressure is likely to ease this time around.

The big miss in NFP report provided strong incentives for central bank policy makers to further delays the timing of tapering asset purchases, which in turn deepens market concerns of short term inflation outrunning Fed’s policy. For the time being, price will rest around $1830 to close the week. But given the pessimism surrounding today’s NFP report, we believe plenty of institutional investors will at least increase the hedge positions in Gold, therefore lifting price. In the north, Gold will look to break $1830, and advance to 23.6% Fibonacci resistance of $1860. The high of $1910 may be a bit overstrenched in the near term, but could definitely be a target for further Fed’s dovish tone.

Resistance: 1860, 1910, 1950

Support: 1797, 1768, 1728


GBPUSD (Weekly Chart)

Cable pulled off a remarkable run since last March’s big plunge, but has been trapped in consolidation zone between 1.39 and 1.36 recently. This pair gained 0.93% during this week thanks to weaker dollar demand.

After spending two-months trading beneath the SMA20 on the weekly chart, it finally has another opportunity to contest this dynamic resistance. Furthermore, a decending trendline failed to cap price under, which could signal the beginning of a bullish reversal. We still need today’s strong momentum to carry over to next week in order to complete a trend reversal.

On the upside, buyers could be eyeing to take down 1.4 hurdle, which opens up doors to May’s high of 1.423. Downside risk will be cushioned by 1.374, followed by 1.36.

Resistance: 1.4, 1.423

Support: 1.374, 1.36


NZDCHF (Daily Chart)

NZDCHF is on the tenth winning streak, rose 4.5% in two weeks. This pair broke above a seven-months downward tunnel with robust buying bias. It is about to hit the upper bollinger band, which conincides with 38.3% Fibonacci of 0.6567. We expect it to briefly touch this level before any pullbacks could materialize. The RSI indicates price is on the cusp of stepping into overbought zone, and could help to cool off an overheated bull.

All in all, we see further upside gains in NZDCHF in a longer investment horizon. A modest retreat could be very healthy to sustain such bullish trend. On the south, a good rebounding point would be 50% Fibonacci support of 0.65, followed by 0.644.

Resistance: 0.6567, 0.6645, 0.677

Support: 0.65, 0.644, 0.6353


Economic Data

Currency

Data

Time (GMT + 8)

Forecast

EUR

German Factory Orders (MoM) (Jul)

14:00

-1.0%

EUR

IHS Markit Construction PMI (Aug)

15:30

GBP

Construction PMI (Aug)

16:30

56.9

Back To Top
server

Hello there 👋

How can I help you?

Chat with our team instantly

Live Chat

Start a live conversation through...

  • Telegram
    hold On hold
  • Coming Soon...

Hello there 👋

How can I help you?

telegram

Scan the QR code with your smartphone to start a chat with us, or click here.

Don’t have the Telegram App or Desktop installed? Use Web Telegram instead.

QR code