Daily Market Analysis
Market Focus
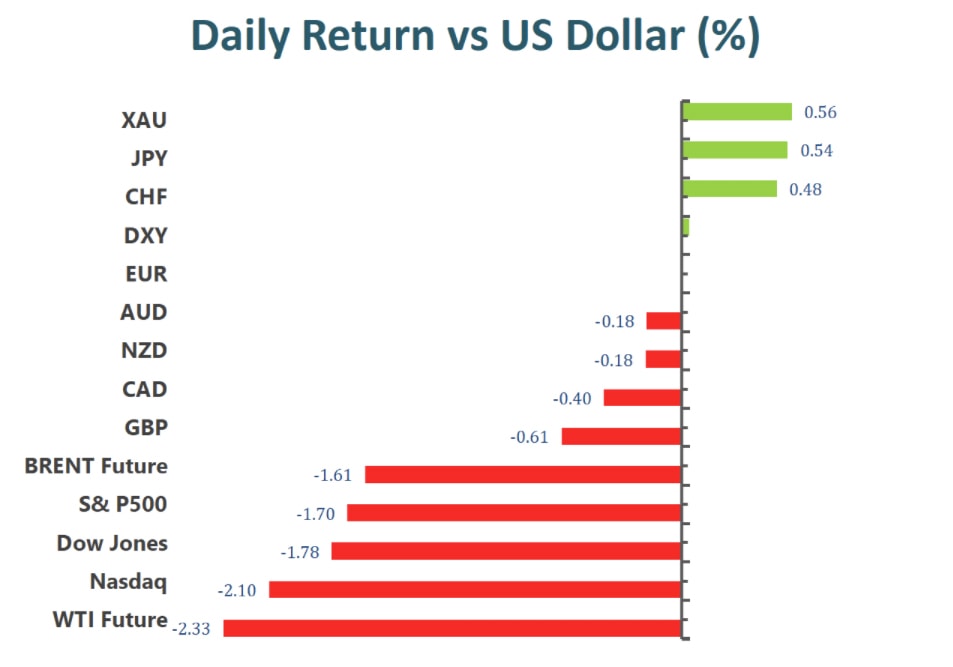
US stocks advanced on Wednesday, even though Federal Reserve officials signaled that bond tapering would probably start in November at the earliest. During a press conference, Fed Chair Jerome Powell also said that mid-2022 could be the end of tapering, which means if Fed announces tapering in November, it will create an eight-month taper process. Stock markets ignored Fed’s tapering hints amid mixed details. On top of that, Gold and oil both rose, as the decline in crude oil inventories was more than expected.
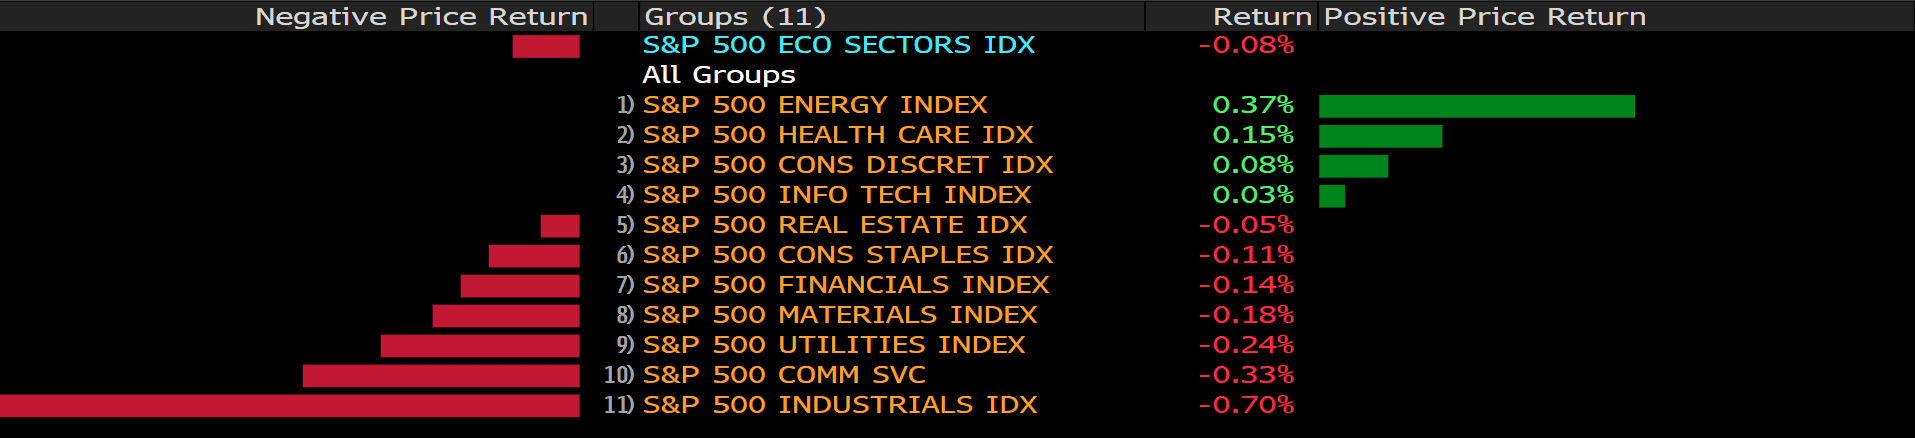
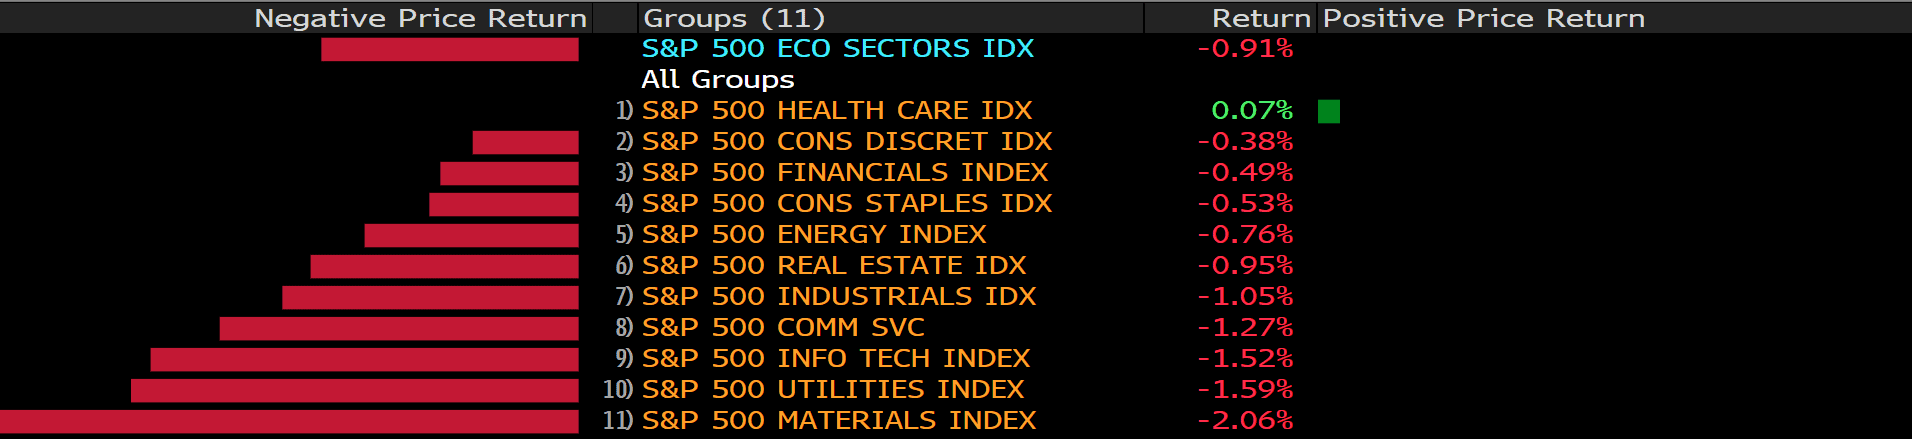
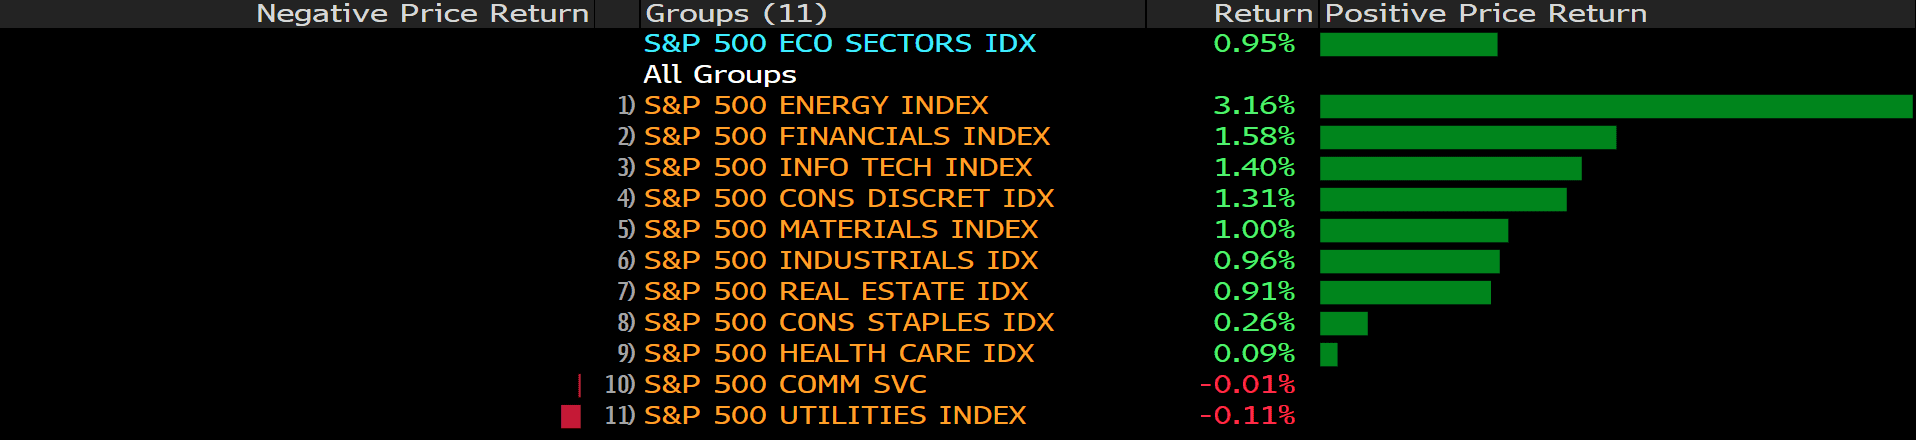
The benchmarks, S&P 500, Dow Jones and Nasdaq both rose on Wednesday. S&P 500 was up 1% on a daily basis, the index rebounded from a two-month low and recorded the biggest climb since July. Wednesday was also the first time for S&P 500 to finish in positive territory in five trading sessions. Nine out of eleven sectors posted a gain as the energy and financials sectors are the best performing among all groups, rose 3.16% and 1.58%, respectively. The Nasdaq gained the most of 1.02%.
The Federal Reserve kept interest rate unchanged at 0.25%, same with market’s expectations. But the policymakers are divided over the rate hike, now expecting a start from either 2022 or 2023 versus the previous support for 2023. For investors now, the timeline of bond tapering and any shifts in expectations for rate hike are crucial information.
In Asia, stock markets declined on Wednesday amid concerns about Evergrande group’s debt crisis. But China avoided a major selloff after the country’s central bank boosted its injection of short-term cash into the financial system. In Japan, BOJ left its interest rate policy unchanged, Japanese yen dropped.
Main Pairs Movement:
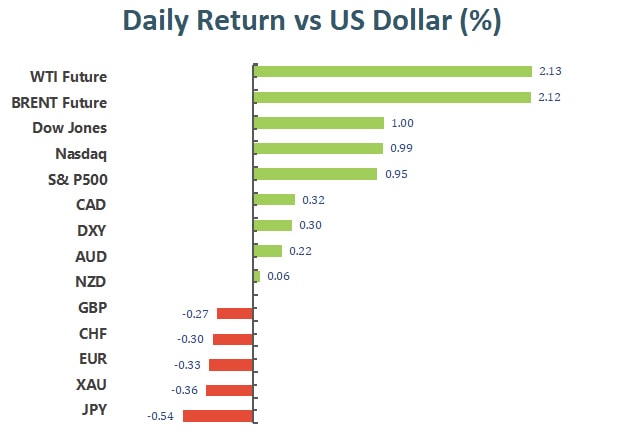
Despite lingering effects from China’s Evergrande credit issue, markets advanced on Wednesday’s trading as investors turn their attention to the Fed’s bond tapering timetable and interest rate projections. As of writing, all major U.S. indices have gained from yesterday’s slump. The two-day meeting of the FOMC yielded a marginally more hawkish tone of the Fed and a potential start date for scaling back pandemic era monetary measurements. The minutes of the meeting also indicated a potential rate hike projected to start, as early as, 2022 as long as the Fed’s employment and inflation goals continue to be met.
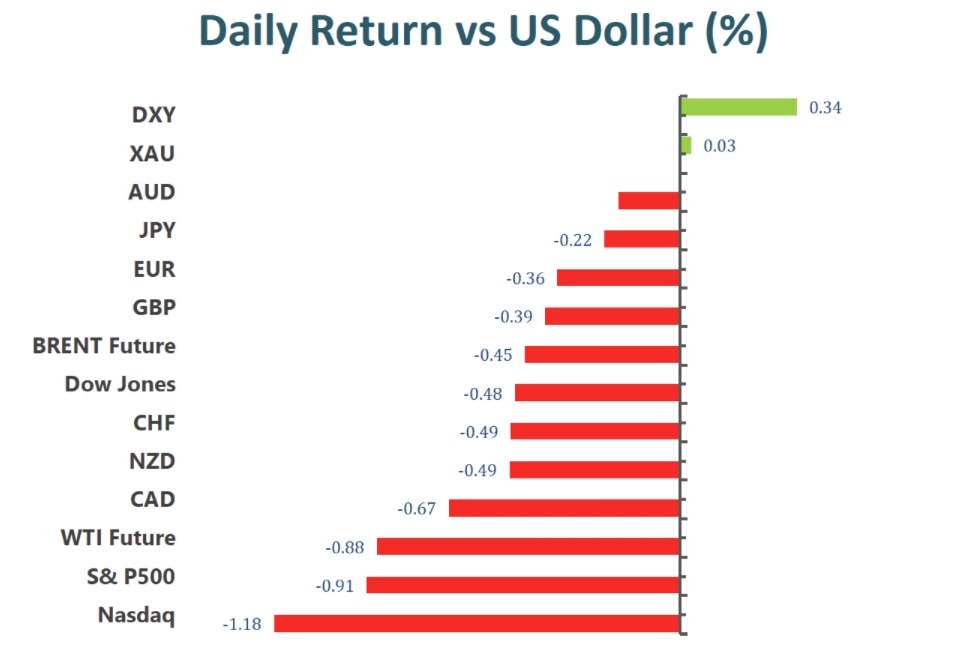
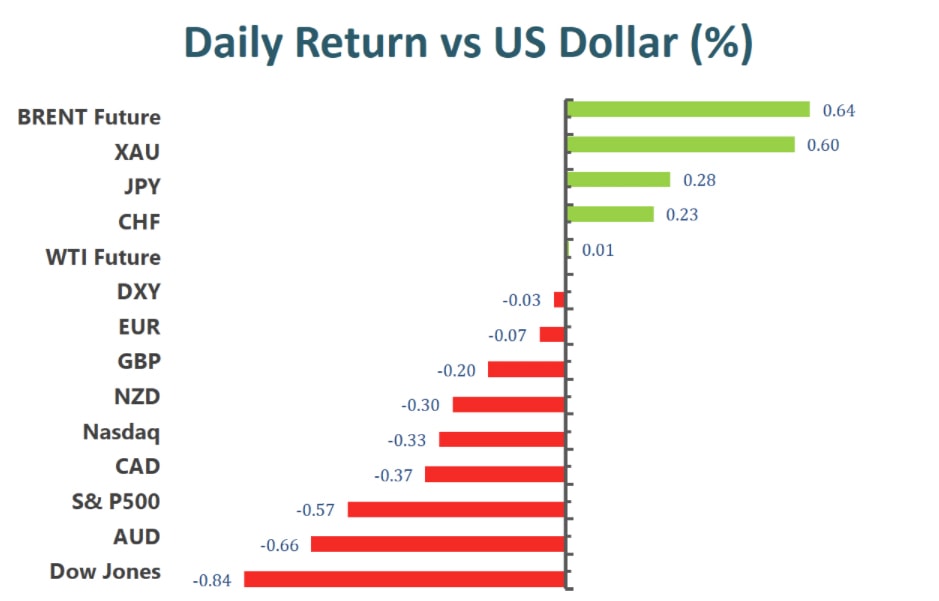
The U.S. dollar index slipped at the release of the FOMC minutes, thus benefiting most currency pairs against the dollar; however, when Fed Chair Jerome Powell gave his speech, market sentiment changed quickly, and the dollar soared, hurting currencies against the dollar.
Technical Analysis:
GBPUSD (4-hour Chart)
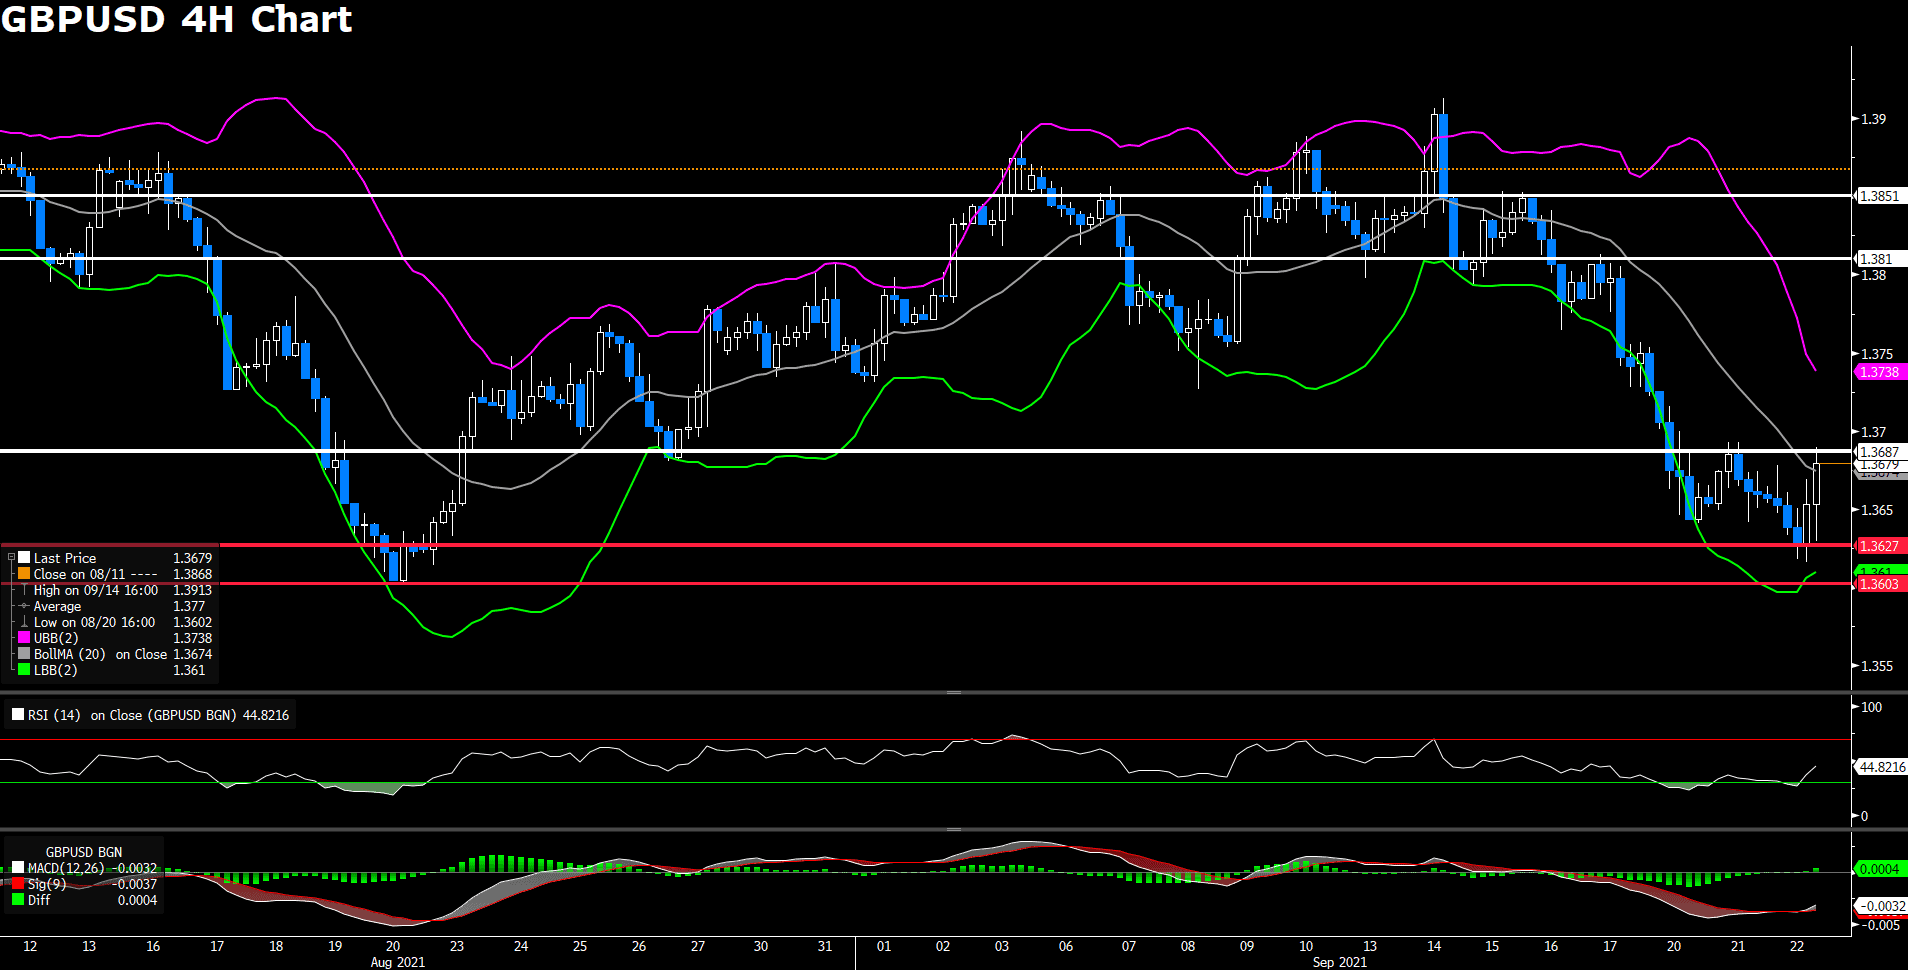
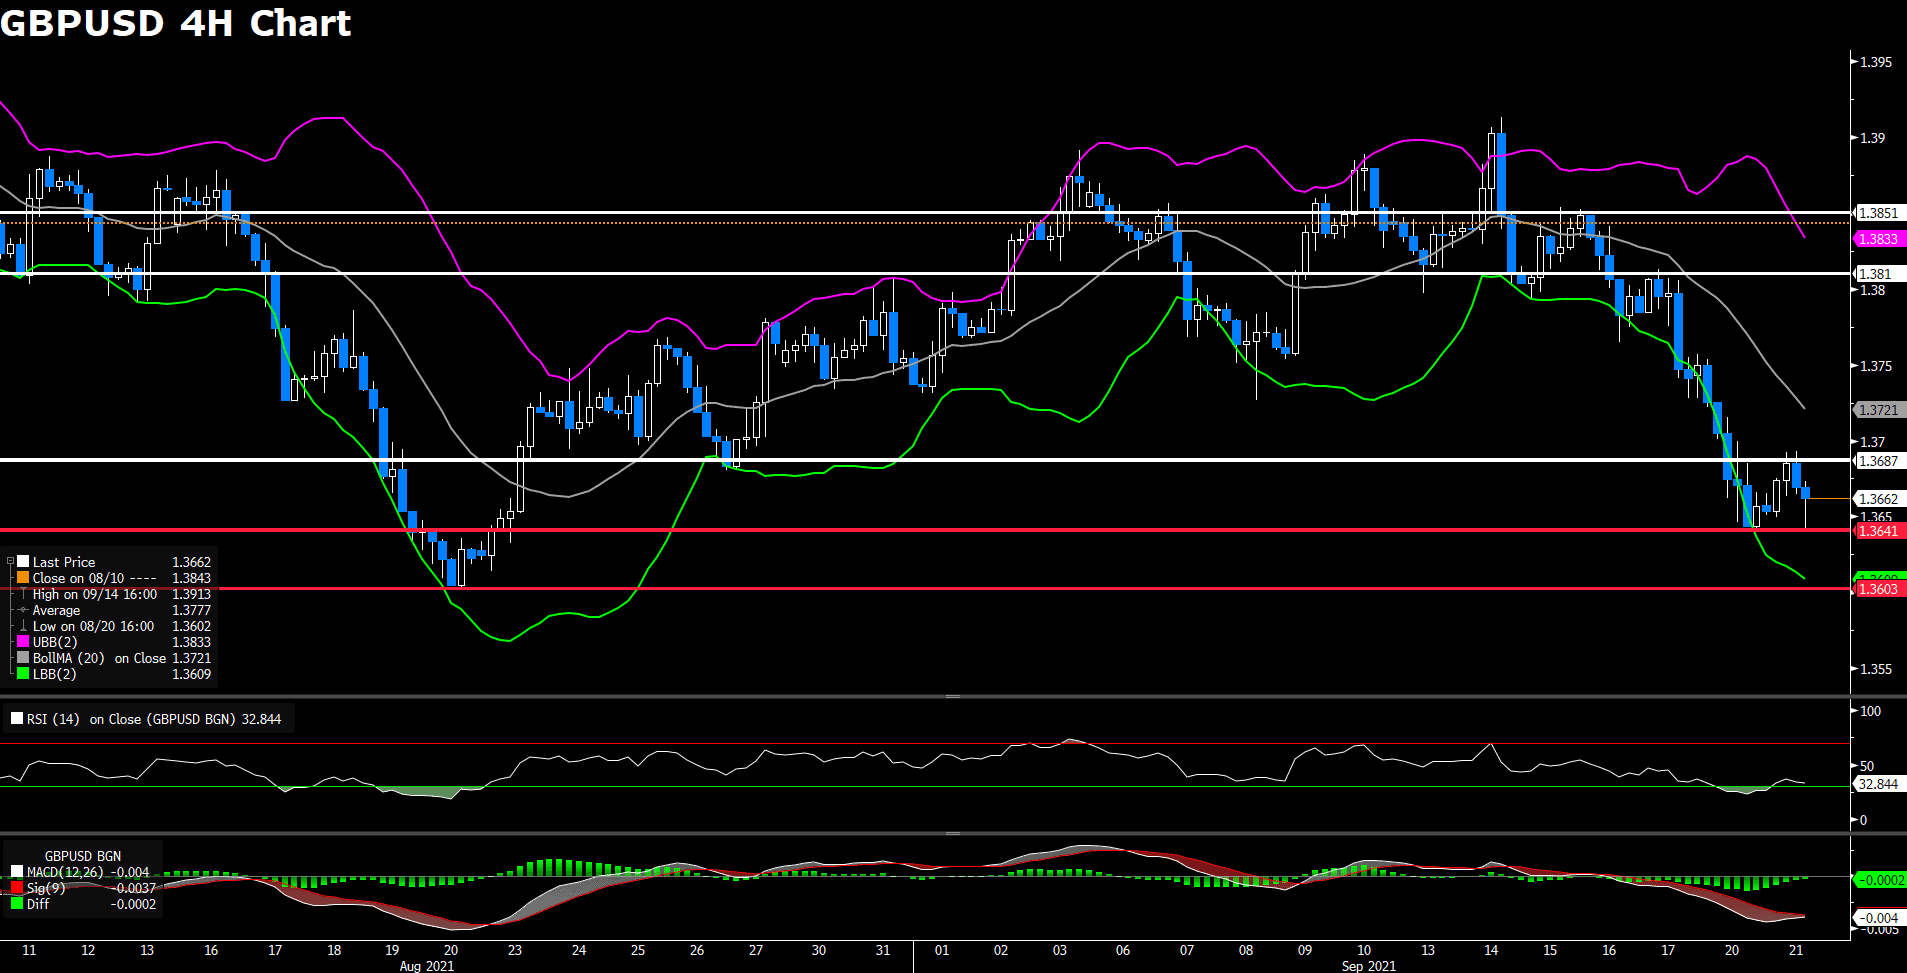
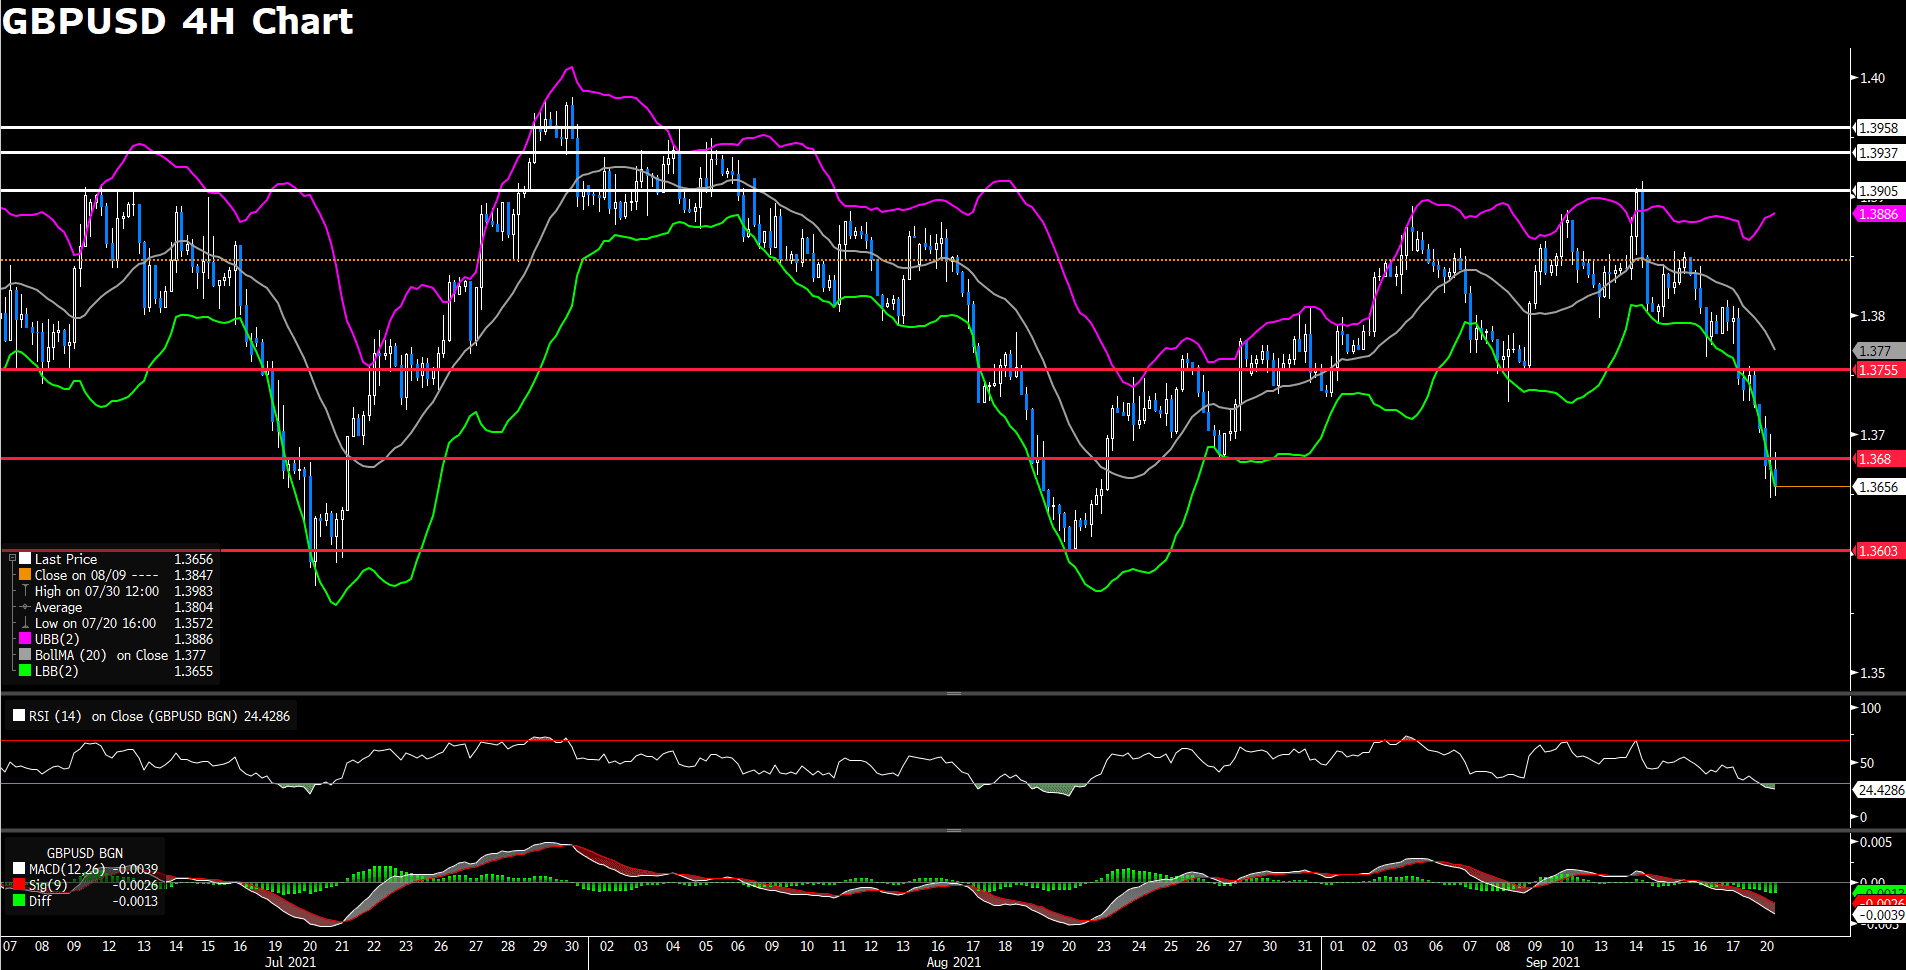
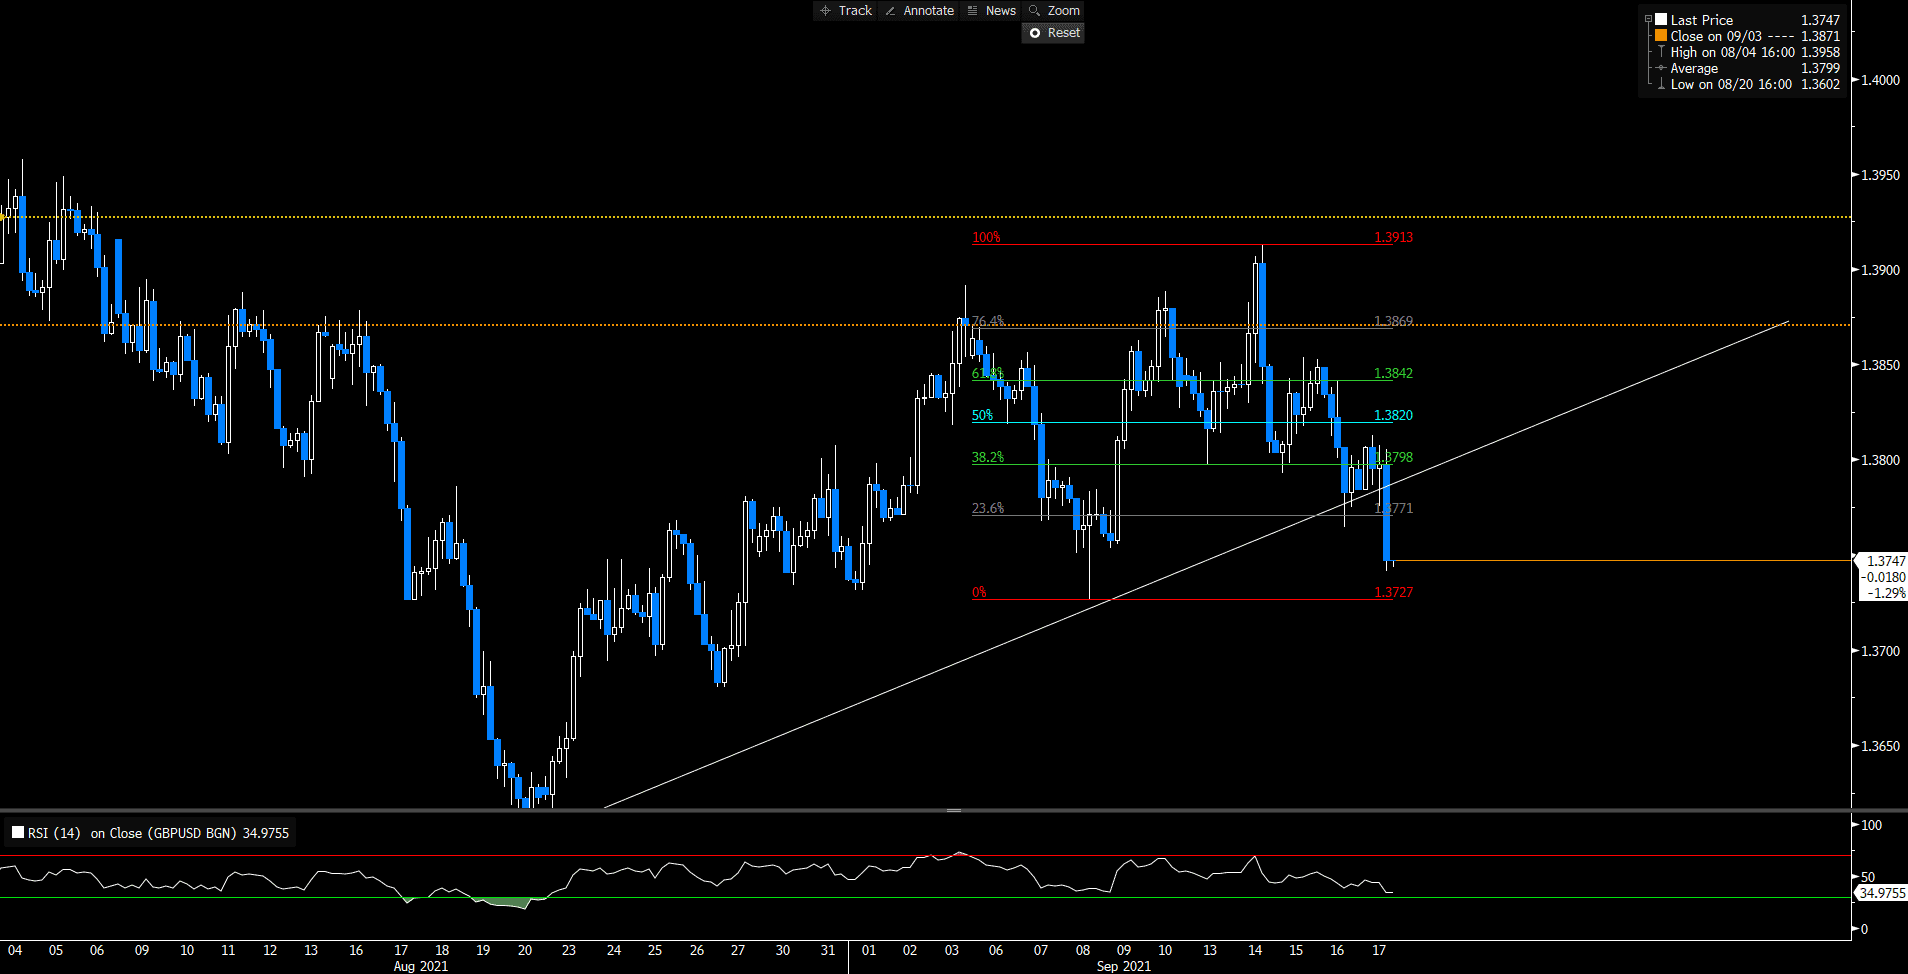
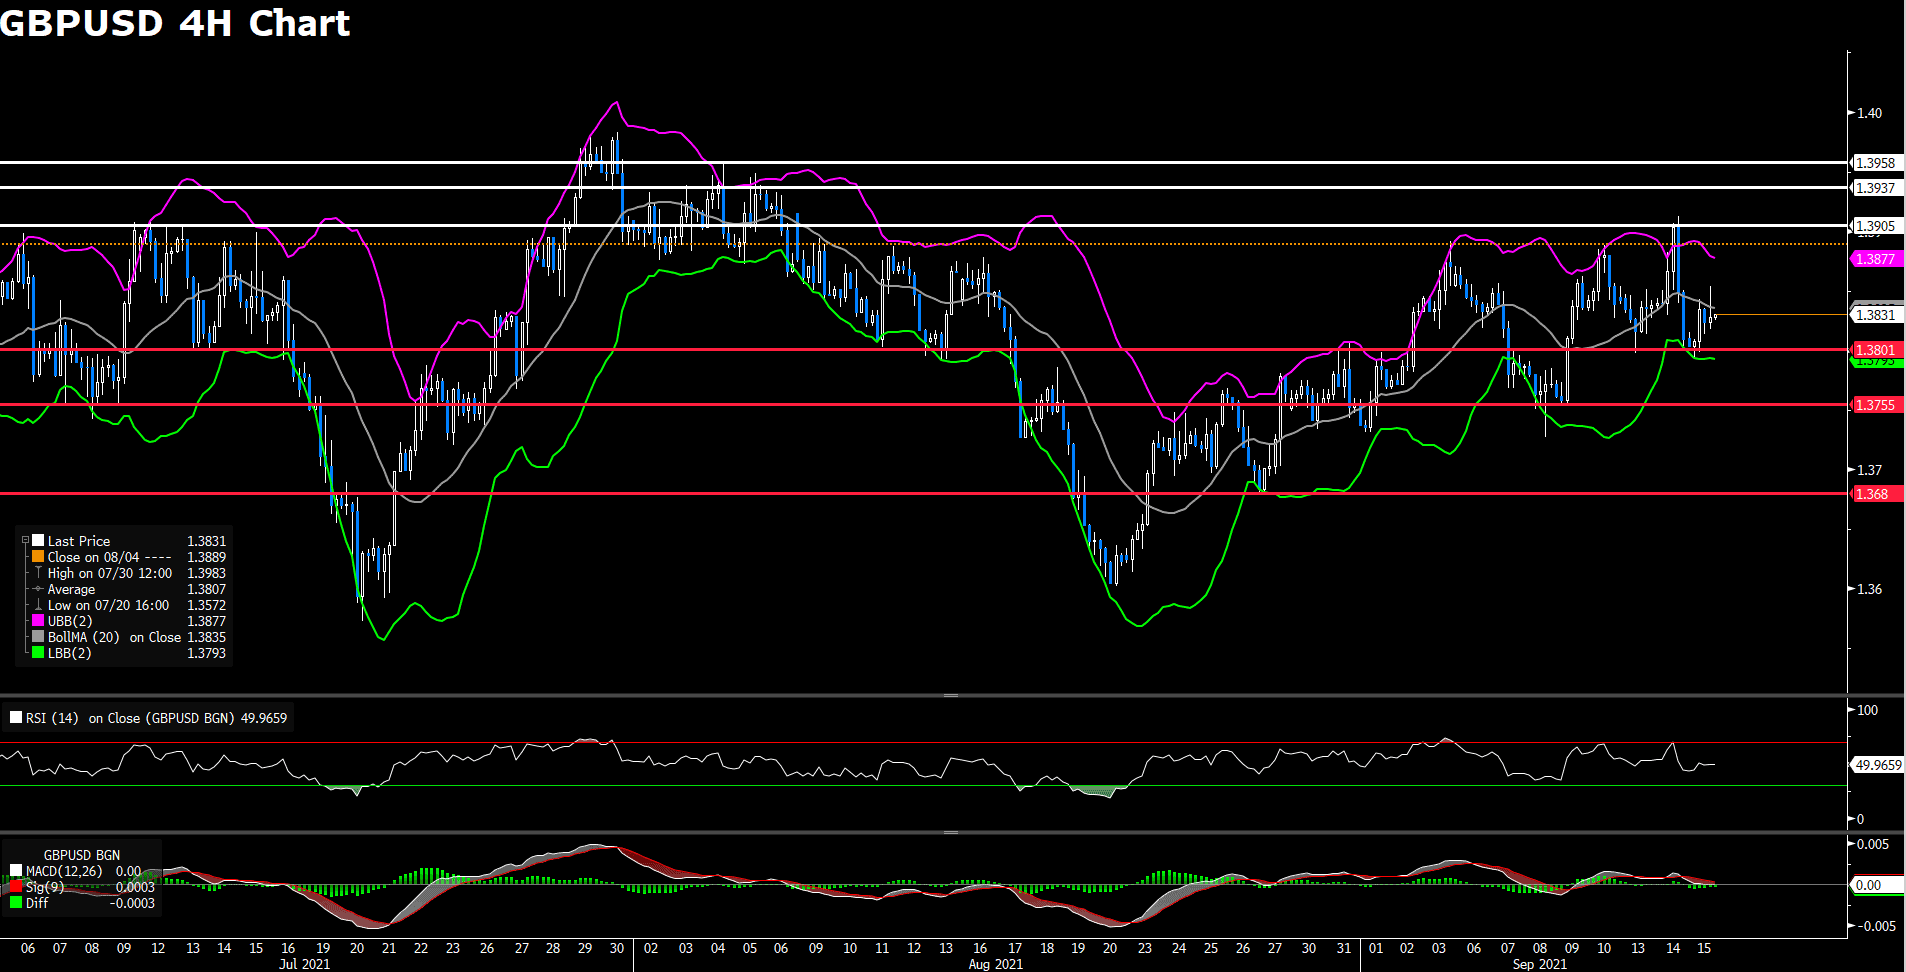
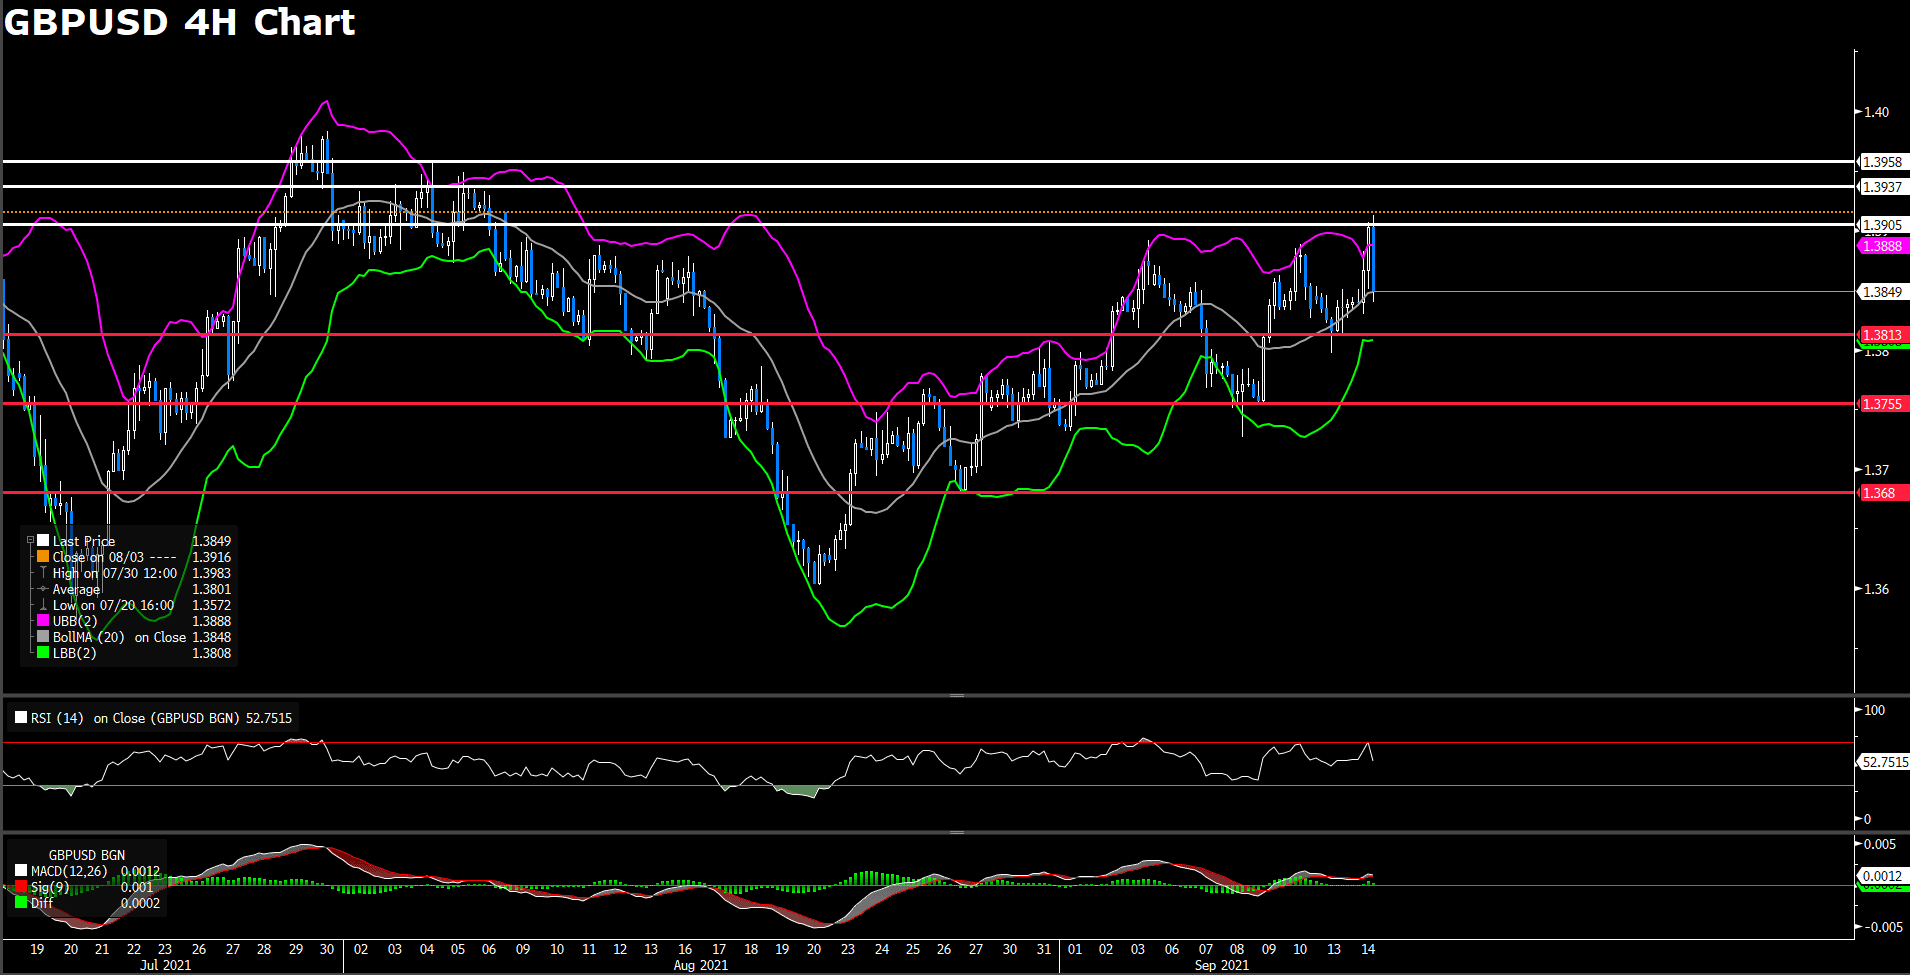
Cable began trading lower at the start of the European session, but the pair will find support at around the 1.362 price level. Cable quickly rebounded from the session’s low once the American trading session began, and the pair saw a quick boost once the FOMC minutes were release. The dollar weakened against the backdrop of the Fed’s, newly found, hawkish tone, despite the Fed’s commitment to keep near term bond purchsing measures unchanged.
From the technical aspect, Cable traded below our estimated support level of 1.3641 for the first half of the trading day, but the American trading session brought the pair back to positive territory. The near term resistance level of 1.3687 remains unbroken;however, Fed Chair Jerome Powell’s speech, scheduled for later today, might compromise that resistance level if the Greenback continues to weaken against the pound. RSI for the pair indicated a neutral 42, as of writing. Cable is, currently, trading above the 50, 100, and 200 day SMA.
Resistance: 1.3687, 1.381, 1.3851
Support: 1.3627, 1.3603
USDCAD (4- Hour Chart)

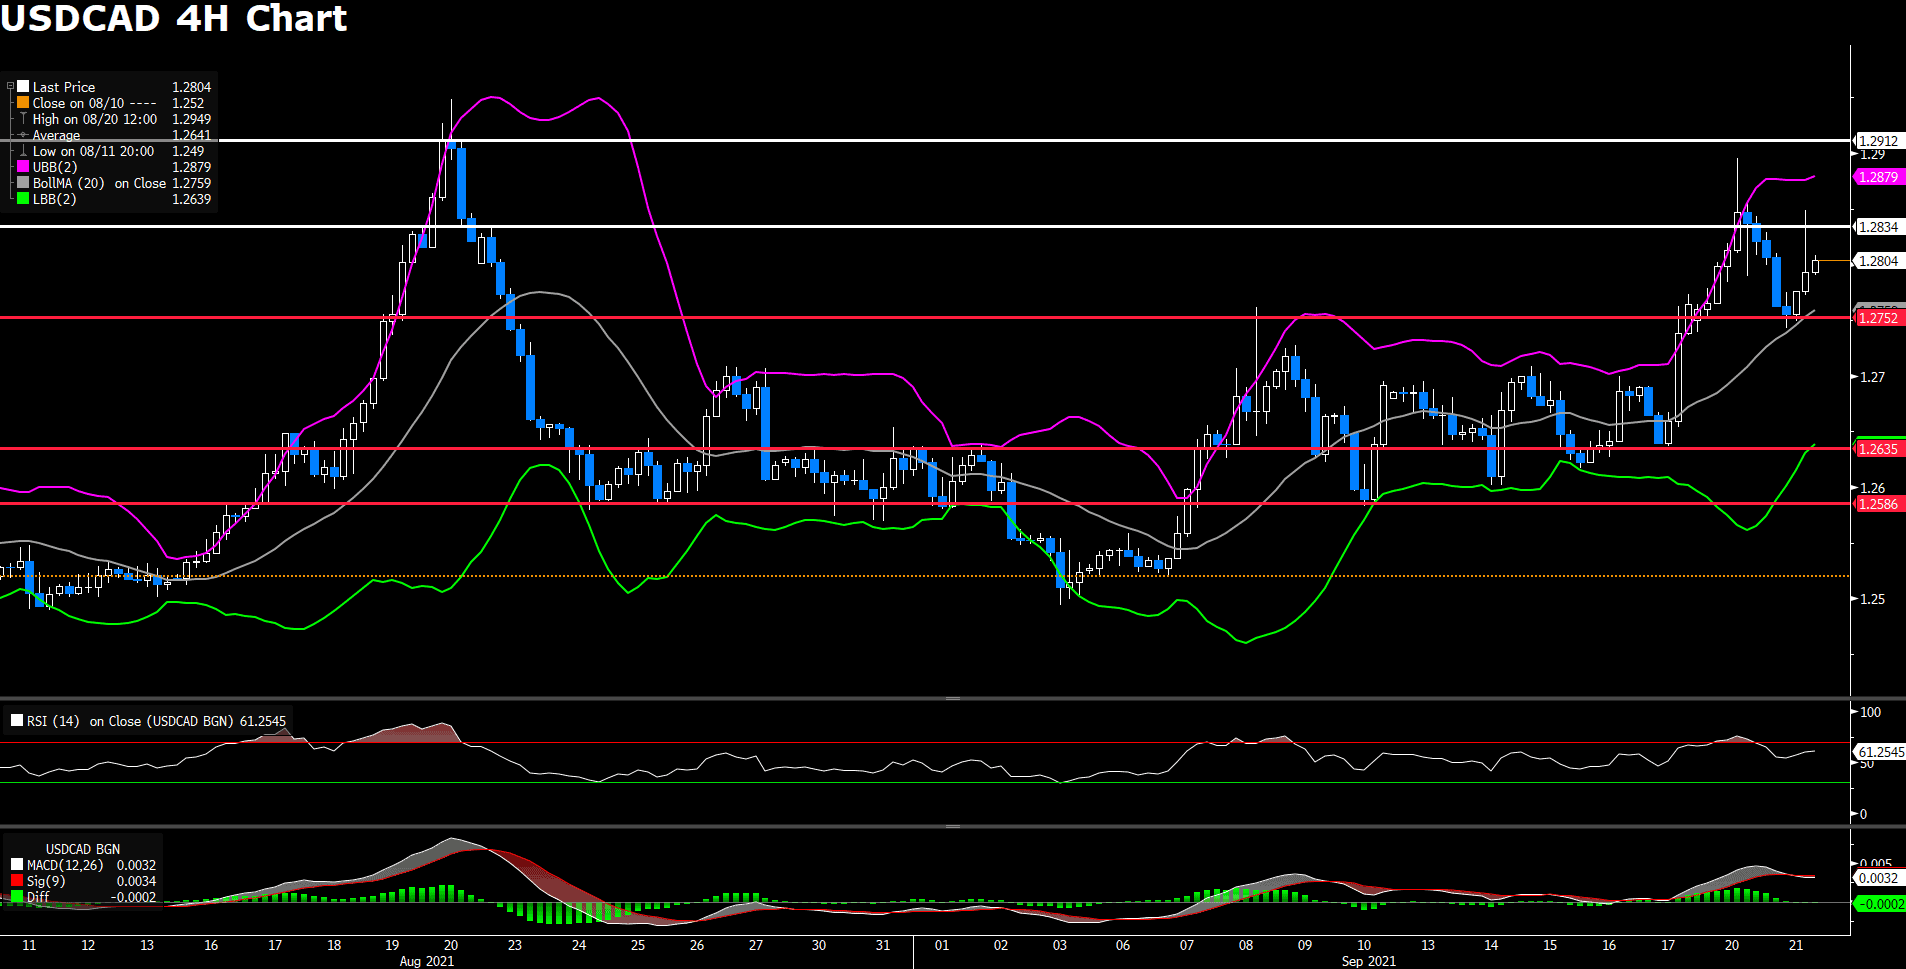
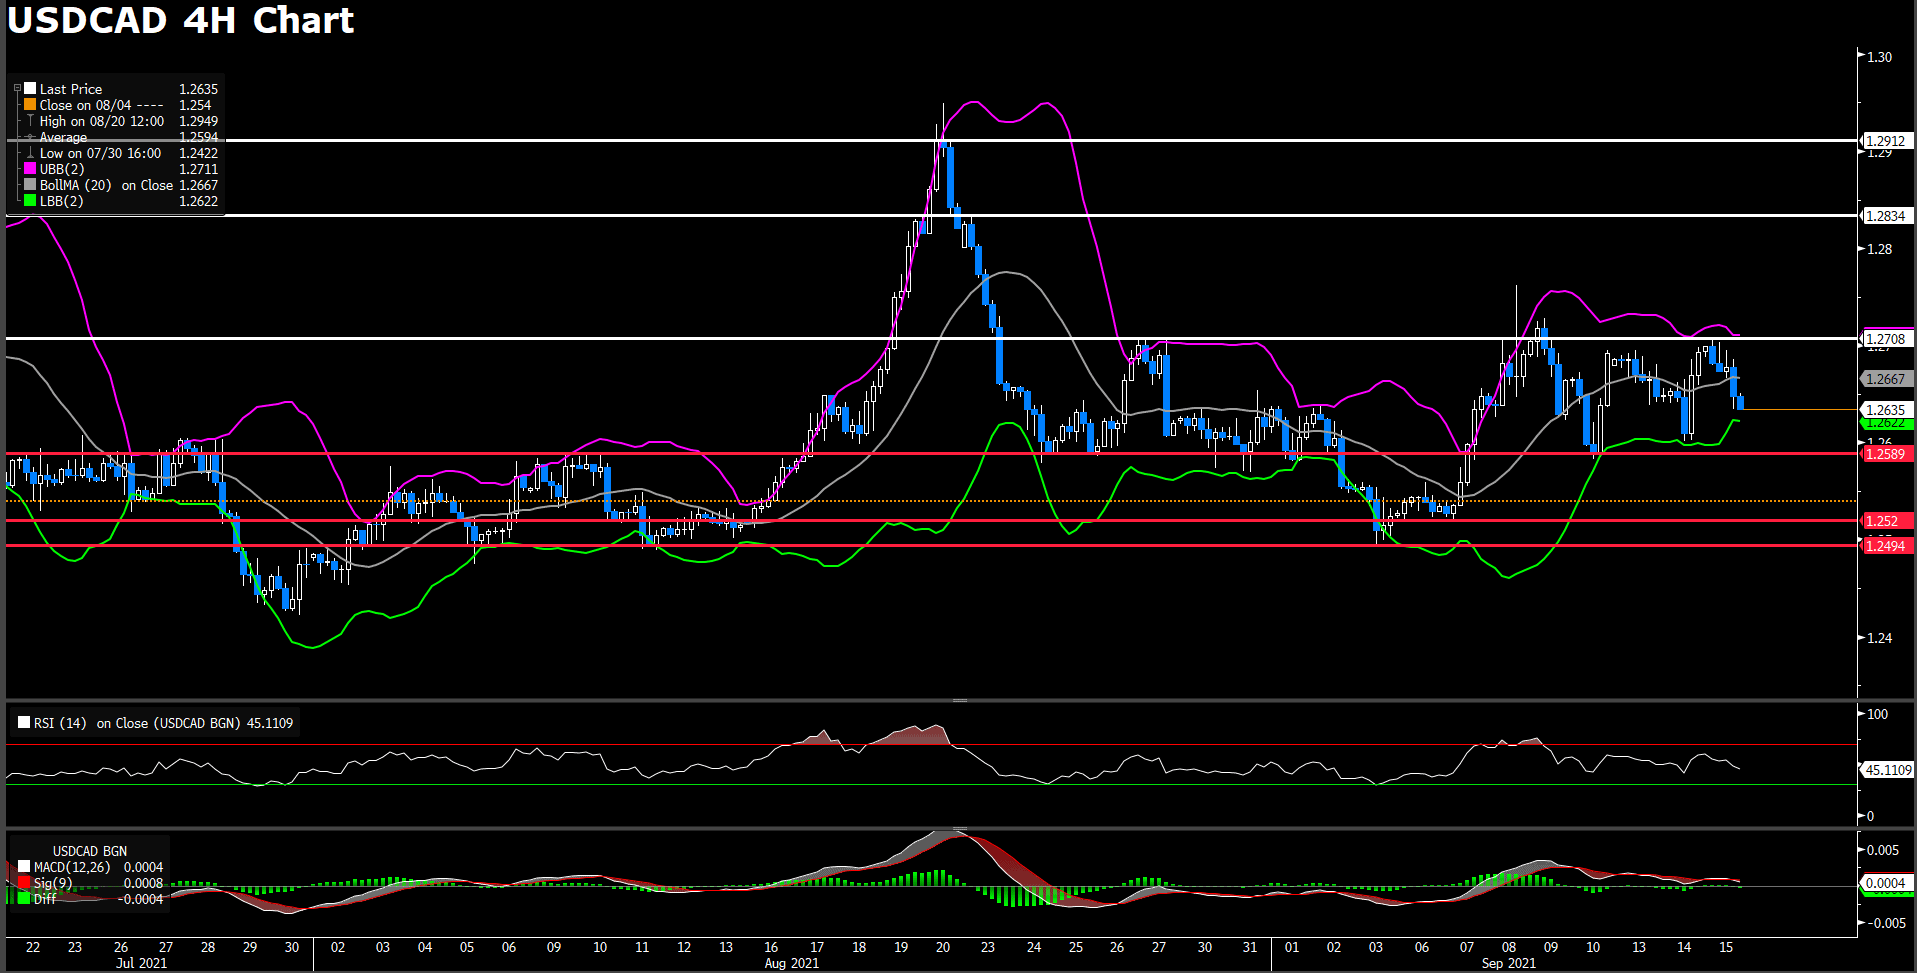
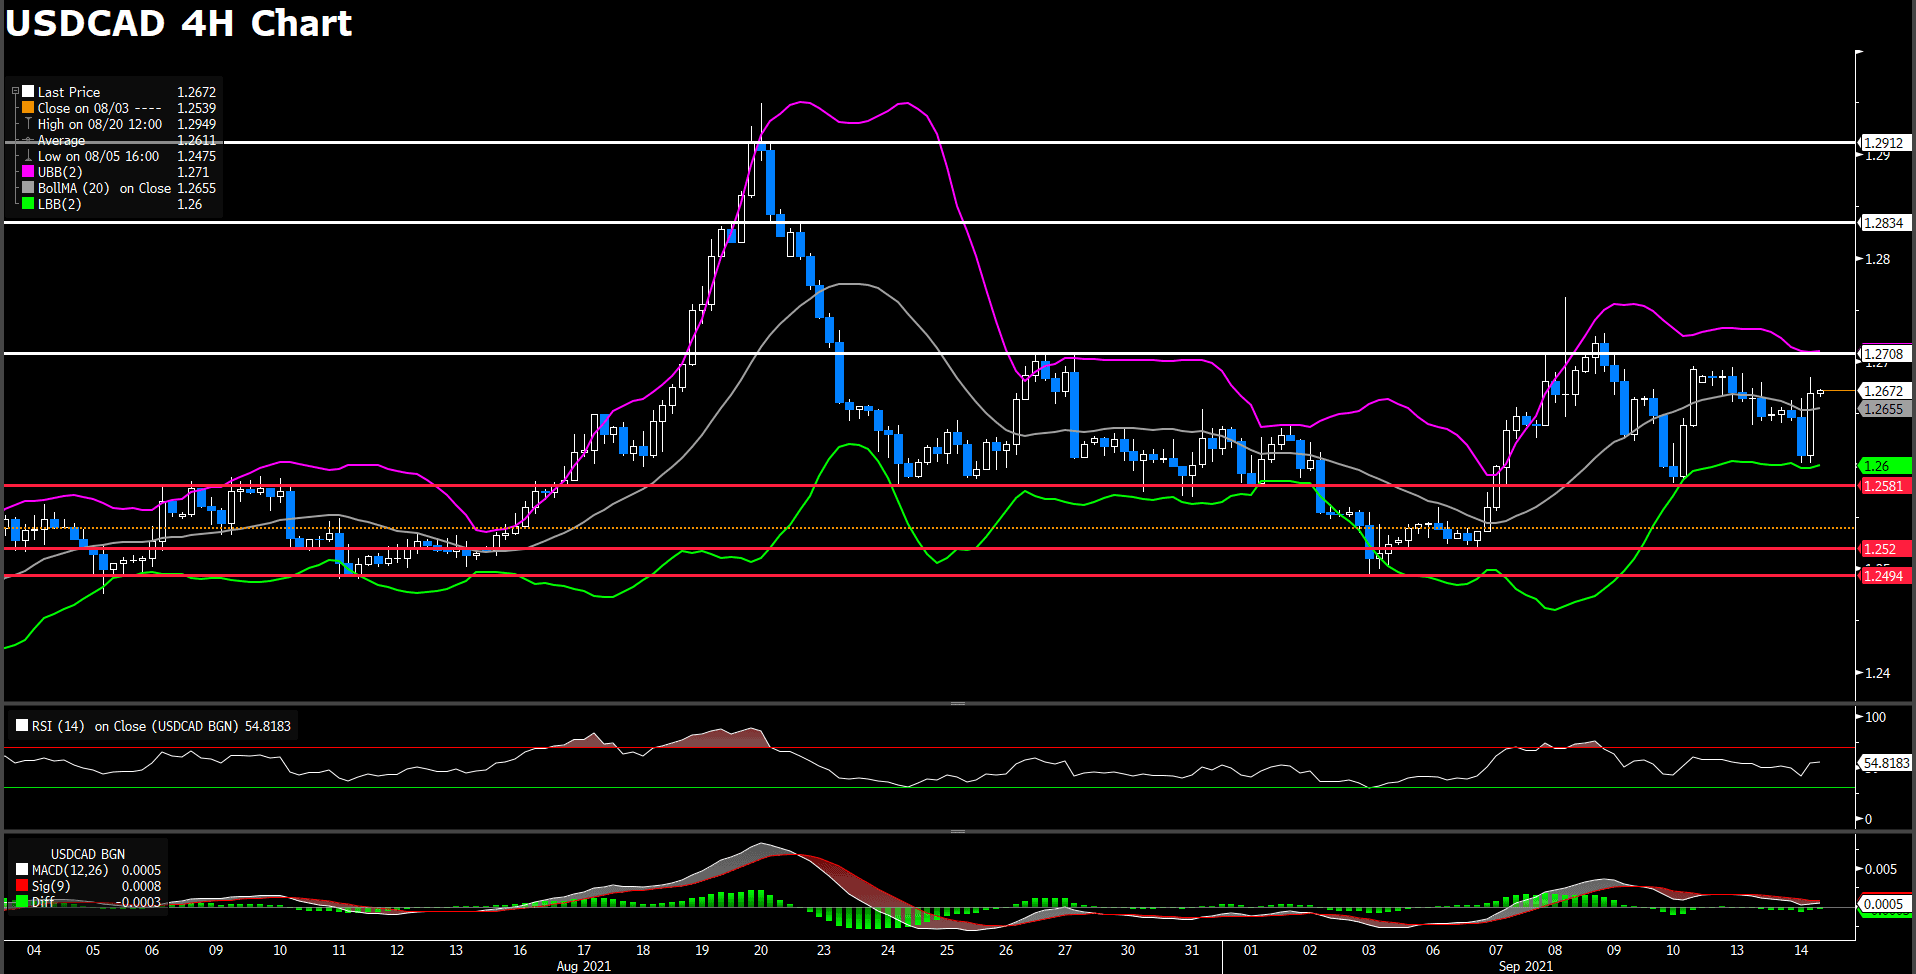
An upbeat market sentiment has strengthened the loonie against the dollar. Ahead of the FOMC minutes release, USD/CAD was, once again, rejected from the resistance level of 1.2834; however, once the minutes were released, the dollar weakened and brought the pair below our previously estimated support level of 1.2752.
From the technical aspect, USD/CAD continues to see downward pressure near the 1.28 price level. The 1.2752 support level did not hold for the pair as the dollar continues to weaken on the back of the FOMC’s announcements. As of writing, RSI for the pair sits at 52, indicating neutral buying; furthermore, the pair is trading above the 50, 100, and 200 day SMA.
Resistance: 1.2834, 1.2912
Support: 1.2752, 1.2635, 1.2586
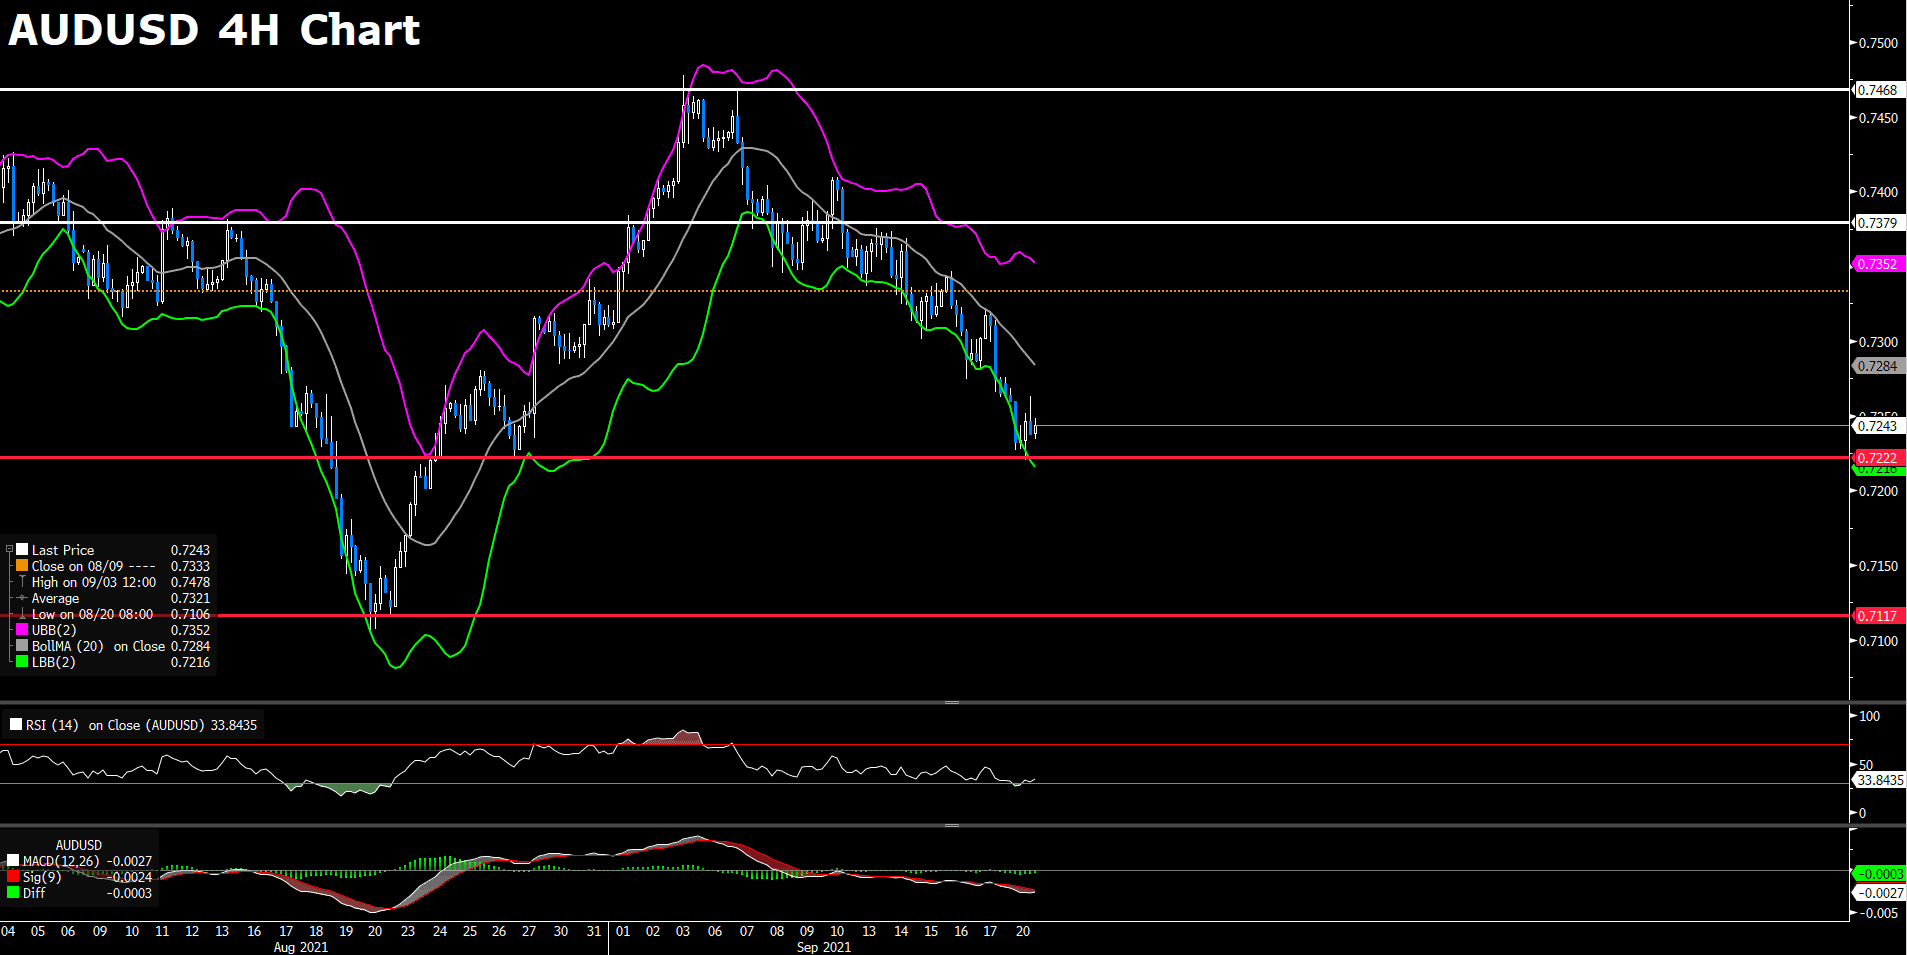
AUDUSD (Daily Chart)

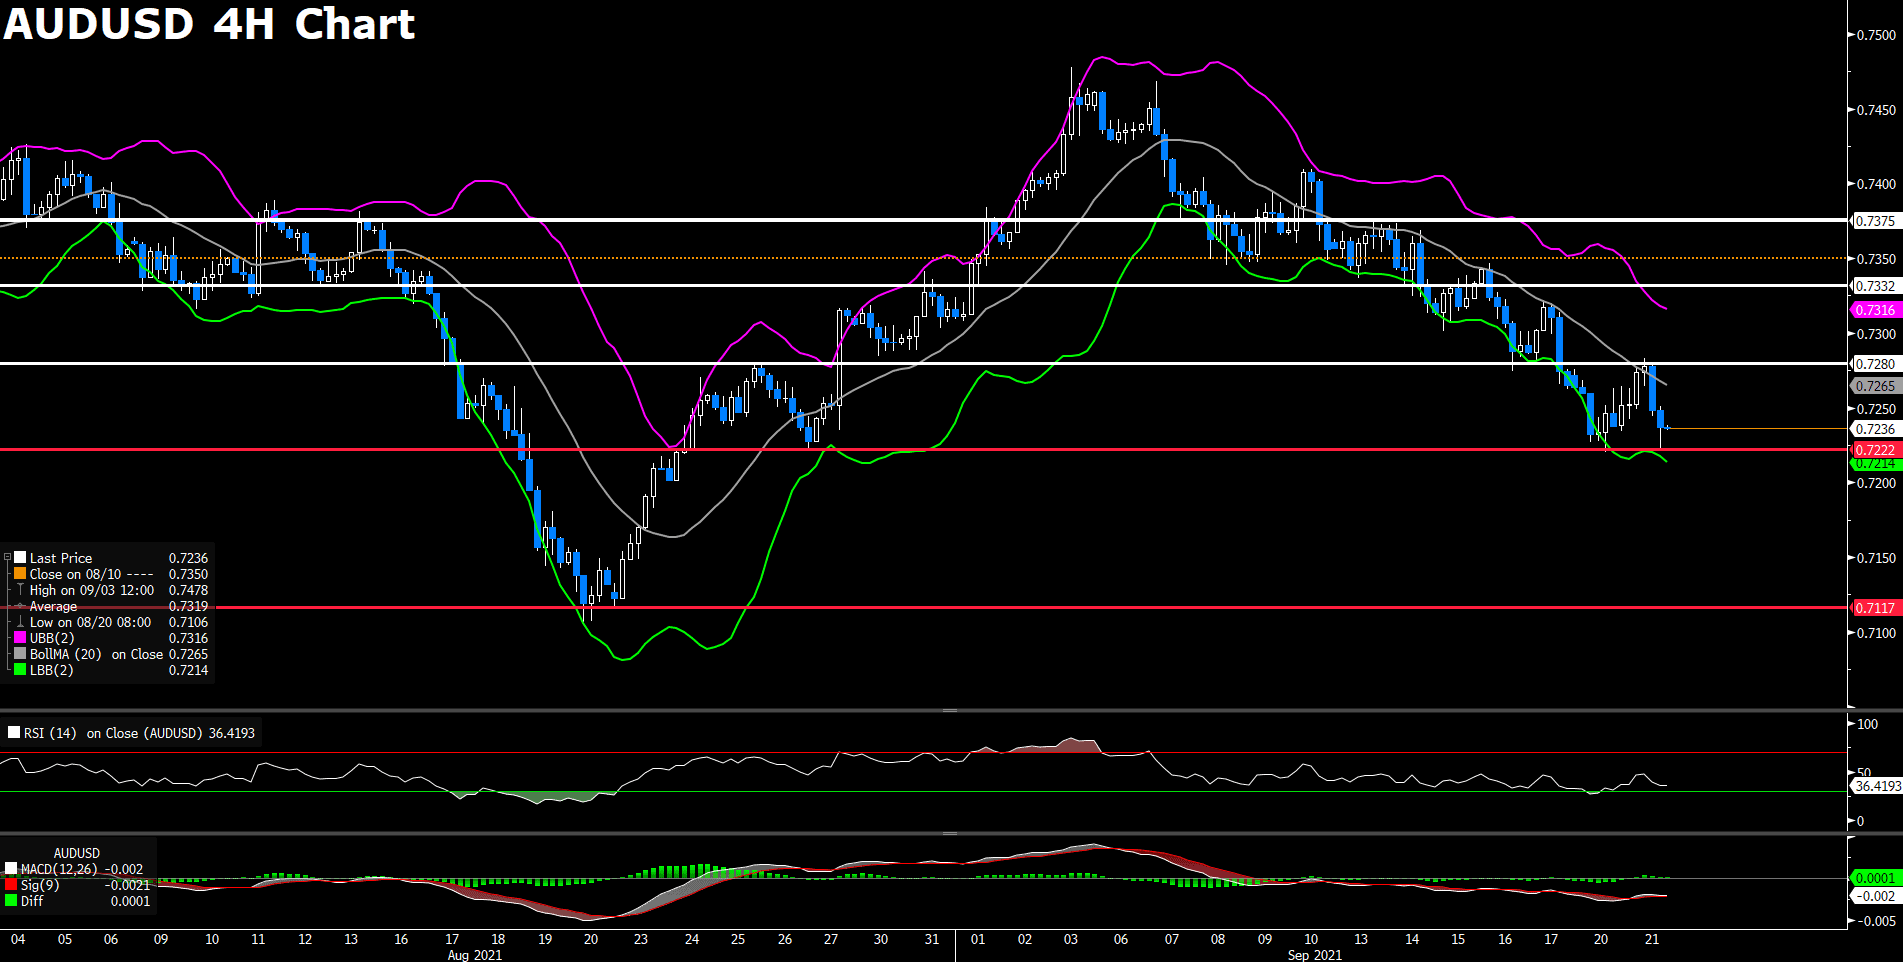
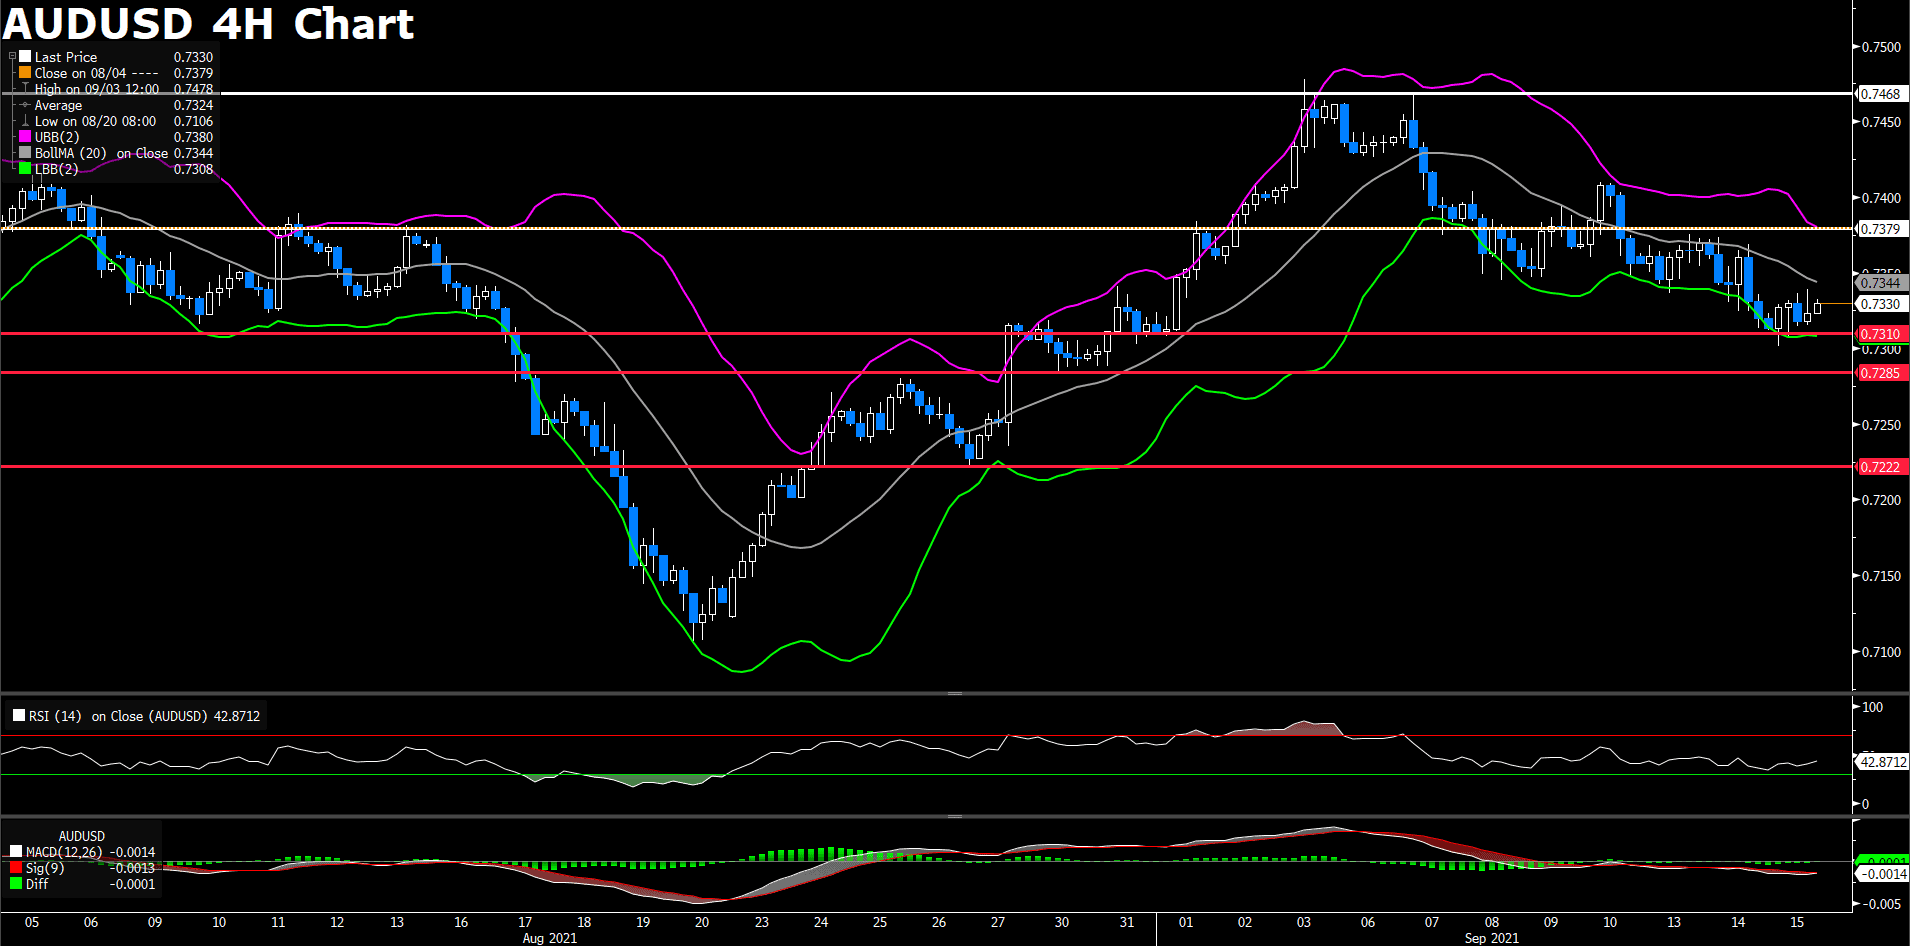
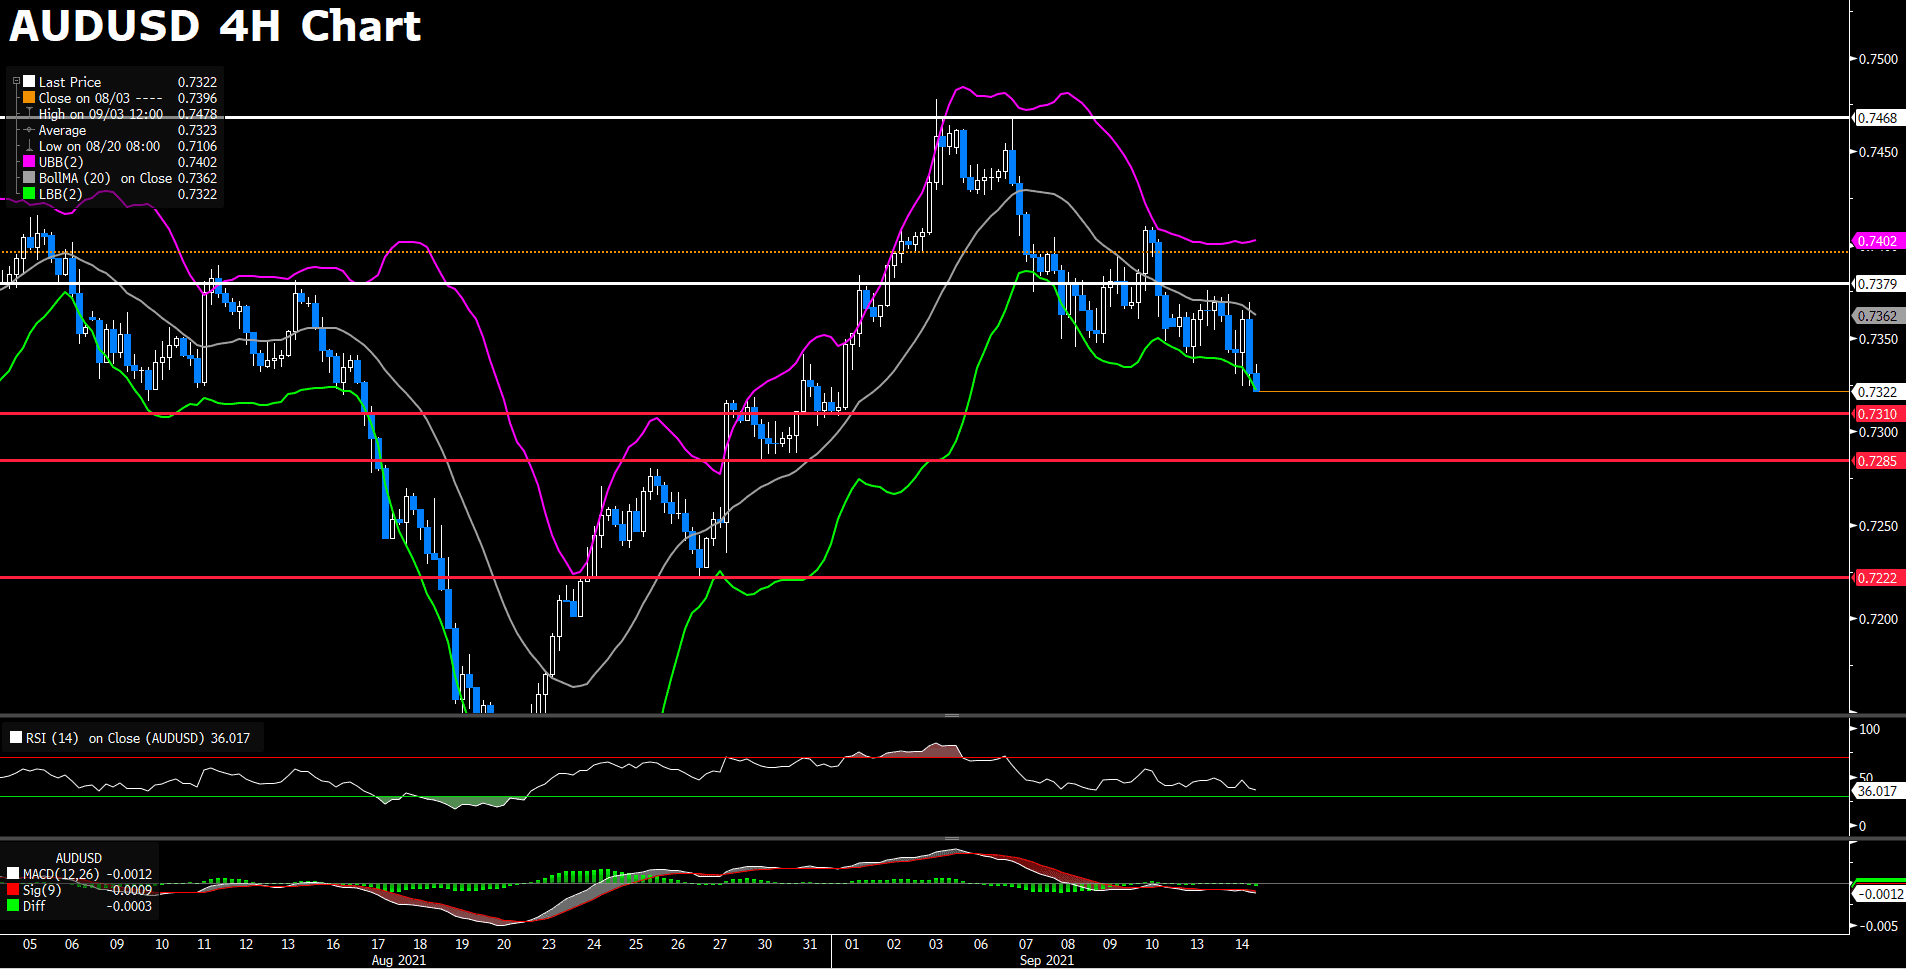
AUD/USD continues to be range bound between 0.722 and 0.728. The FOMC minutes release brough a short spike to AUD/USD, but the spike was not sustainable and the pair is again traindg lower, as of writing. The Auddis dollar continues to be depressed due to poor employment figures and the strong economic ties between China and Australia. The increasingly hawkish tone of the Fed also provides a negative outlook for the pair.
From the technical aspect, AUD/USD successfully defended the 0.7222 support level in the early part of the trading session; however, this support level will be tested again as the dollar begins to gain strength after FED chair Jerome Powell’s speech. As of writing, RSI for AUD/USD sits at 42, and the pair is trading below the 50, 100, and 200 day SMA.
Resistance: 0.728, 0.7332, 0.7375
Support: 0.7222, 0.7117
Economic Data
|
Currency |
Data |
Time (GMT + 8) |
Forecast |
||||
|
USD |
FOMC Economic Projections |
02:00 |
– |
||||
|
USD |
FOMC Statement |
02:00 |
– |
||||
|
USD |
Fed Interest Rate Decision |
02:00 |
0.25% |
||||
|
BRL |
Interest Rate Decision |
05:00 |
6.25% |
||||
|
SGD |
CPI (Aug) |
13:00 |
2.4% |
||||
|
EUR |
Manufacturing PMI |
16:00 |
60.3 |
||||
|
GBP |
Composite PMI |
16:30 |
– |
||||
|
GBP |
BoE MPC Meeting Minutes |
19:00 |
– |
||||
|
USD |
Initial Jobless Claims |
20:30 |
320K |
||||
|
CAD |
Core Retail Sales (MoM) |
20:30 |
-1.5% |