Start trading now – Click here to create your real VT Markets account
Back
Start trading now – Click here to create your real VT Markets account
Start trading now – Click here to create your real VT Markets account

Key Points
The Nikkei 225 is trying to recover, but the backdrop remains difficult. Broader Asian equities moved higher on Tuesday, and Japan’s Nikkei 225 rose 0.3% as traders pushed for a second day of gains. Still, the wider tone remains cautious as markets try to price the economic damage from the US-Iran war and the policy response it may trigger.
This is not a clean risk-on move. Chris Weston of Pepperstone said the rally still feels like a positioning squeeze rather than the start of a fresh directional trend. That fits the Nikkei well. The index is trying to bounce, but traders still face high oil prices, a weak yen, and a packed week of central bank meetings.
If global risk sentiment improves and oil stops climbing, the Nikkei may extend its rebound. If energy prices stay high and markets keep doubting the bounce, upside may remain limited.
For the Nikkei, oil is one of the biggest macro risks. Brent crude rose 2.7% to $102.89 a barrel after several US allies rejected calls to send warships to escort tankers through the Strait of Hormuz. Since about one-fifth of global energy shipments move through that route, any prolonged disruption matters.
Japan is highly exposed to higher imported energy costs. That can hurt margins for manufacturers, transport firms, and consumer-facing businesses. It can also weigh on household spending if energy bills rise.
This is why the Nikkei can lag even when some global markets recover. Higher oil is not just an inflation story for Japan. It is also a growth headwind.
If Brent stays above $100, the Nikkei may continue to face pressure from weaker earnings expectations and tighter financial conditions.
The currency picture also matters. The Japanese yen weakened 0.2% to 159.415 per dollar, staying just shy of the 160 level despite verbal warnings from Japanese authorities.
A weaker yen can help exporters in normal times, but this situation is less straightforward. When oil prices are high, the weaker currency also makes imported energy more expensive. That weakens one of the Nikkei’s usual supports from yen depreciation.
Bank of Japan Governor Kazuo Ueda said underlying inflation was gradually accelerating toward the bank’s 2% target. Even so, analysts expect the bar for intervention to be higher because of rising oil prices. That leaves the market in a difficult spot, where the yen stays weak while inflation risks rise.
If USDJPY pushes closer to 160, volatility in Japanese equities may increase, especially if traders start to question whether authorities will step in.
This week’s central bank calendar is packed, and that matters for the Nikkei. The Reserve Bank of Australia was first up, with economists expecting a second hike this year to 4.1%. After that, attention turns to the Federal Reserve, European Central Bank, Bank of England, and Bank of Japan.
The Fed funds market shows a 99.1% probability that the Federal Reserve will remain on hold at the end of its two-day meeting on Wednesday. That suggests traders expect caution rather than a strong policy shift.
For Japanese equities, the issue is not just what the BoJ says. It is how all major central banks respond to an energy shock that could lift inflation and slow growth at the same time. If policymakers turn more hawkish, equities may struggle. If they sound calm and patient, the Nikkei may find some relief.
If central banks emphasise inflation risk over growth concerns, the Nikkei may remain under pressure. If they signal patience and avoid hawkish surprises, the index may stabilise.
The Nikkei 225 is trading near 54,053, down roughly 0.68% on the session as the index continues to struggle after failing to hold above the 60,077 peak reached earlier in the quarter. The recent pullback suggests the market remains in a corrective phase following the strong rally seen earlier in the year.
Technically, the index remains below several key moving averages. The 5-day moving average (53,977) is close to the current price but flattening, while the 10-day (54,392) sits slightly above the market and continues to trend lower. Meanwhile, the 20-day moving average (56,020) and 30-day (56,228) remain significantly above current levels, reinforcing the near-term bearish pressure as the index trades beneath this cluster of resistance.
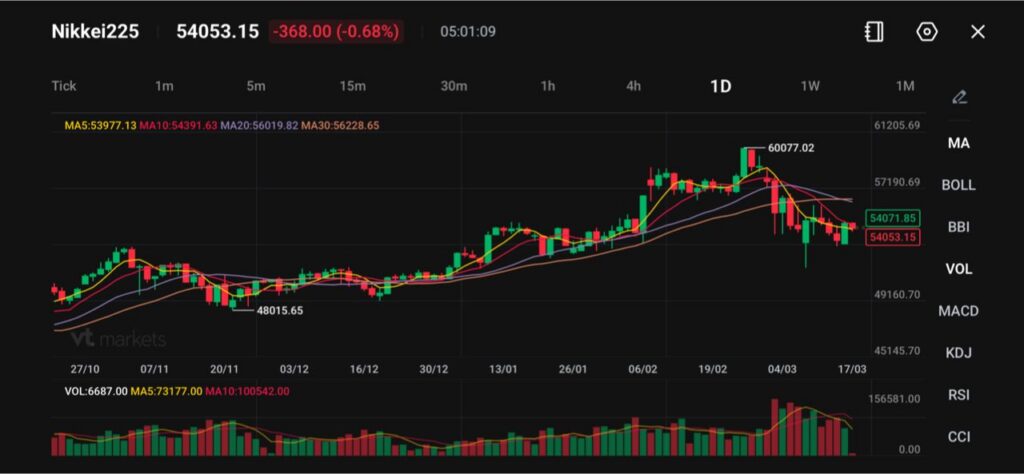
Immediate support appears around the 53,800–54,000 region, where prices are currently attempting to stabilise. A break below this area could expose further downside toward 52,500–53,000, where previous buying interest has emerged. On the upside, initial resistance is located near 54,400, followed by stronger resistance around 56,000, where the 20-day moving average sits.
Overall, the Nikkei appears to be consolidating after the sharp rejection near 60,000, with the broader trend turning cautious in the short term. Unless the index can reclaim the 54,400–56,000 region, momentum may remain limited, leaving the market vulnerable to further downside consolidation before a clearer directional move develops.
The Nikkei now sits at the intersection of three major forces: oil above $100, USDJPY near 160, and central banks trying to respond to a war-driven inflation shock without overreacting.
That makes the next move less about one headline and more about whether all three start easing at once. If oil cools, the yen stabilises, and central banks avoid a hawkish tilt, the Nikkei may recover further. If those pressures stay in place, the index may keep trading with a fragile tone.
Learn more about trading Indices on VT Markets today.
What is Driving the Nikkei 225 Right Now?
The Nikkei 225 is being driven by a mix of rising oil prices, a weaker yen, and global central bank expectations, all of which are shaping investor sentiment.
Why Does Higher Oil Pressure the Nikkei?
Japan is a major energy importer. When oil prices rise above $100 per barrel, it increases costs for businesses and consumers, which can weigh on corporate earnings and economic growth.
How Does a Weak Yen Affect the Nikkei?
A weaker yen can support exporters by making Japanese goods cheaper overseas. However, when oil prices are high, it also increases import costs, which can offset those benefits.
Why is USDJPY Near 160 Important?
The 160 level is seen as a key psychological threshold. If the yen weakens further, it could increase volatility and raise the risk of intervention from Japanese authorities.
What Role Do Central Banks Play in the Nikkei’s Outlook?
Global central bank decisions influence liquidity, interest rates, and risk appetite. A more hawkish stance could pressure equities, while a cautious or neutral tone may support the Nikkei.
Start trading now – Click here to create your real VT Markets account
Start trading now – Click here to create your real VT Markets account
Start trading now – Click here to create your real VT Markets account
Dear Client,
To ensure fair trading conditions and manage market volatility during major economic announcements, VT Markets will apply temporary leverage adjustments on certain trading products during specific news periods and market opening/closing.
This mechanism will be introduced in phases starting from 19 March 2026, with full implementation across all servers and clients by 20 March 2026.
These adjustments are designed to protect clients from abnormal market fluctuations, sudden liquidity changes, and extreme price movements that may occur during high-impact news releases.
1. Products Affected
The temporary leverage adjustment may apply to the following products:
• Forex
• Gold
• Silver
• Oil
• Indices
• Commodities (including XPT and XPD)
2. Adjusted Leverage During News Releases and Market Opening/Closing
During the specified news period, maximum leverage will be adjusted as follows:
Forex: 200
Gold: 200
Silver: 50
Oil: 20
Indices: 50
Commodities: 5
Please note that each product with leverage already below the above will not be affected.
3. News Events That Can Trigger the Adjustment
Leverage adjustments may be applied during major economic announcements including:
• FOMC Interest Rate Decisions
• CPI (Consumer Price Index)
• GDP
• PMI / NMI
• PPI
• Retail Sales
• Non-Farm Payroll (NFP)
• ADP Employment Data
• Crude Oil Inventories
The above data is for reference only. Other significant macroeconomic releases from major economies may also be included.
Please refer to the table below for details of the upcoming events and affected instruments:
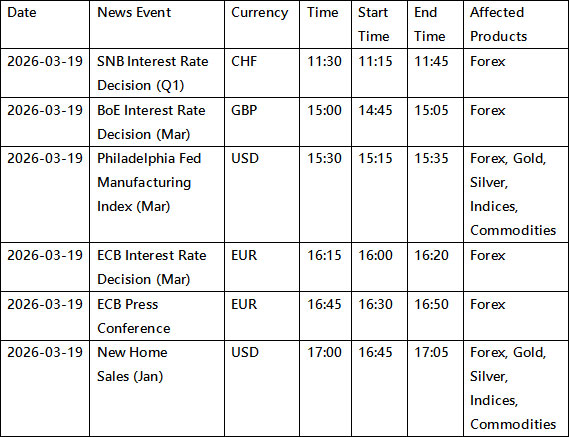
All dates and times are stated in GMT+3 (MT4/MT5 server time).
4. Affected Period of News Releases and Market Opening/Closing
Temporary leverage adjustments apply during the following periods:
Economic News Period
• 15 minutes before the announcement
• 5 minutes after the announcement
Market Opening / Closing Period
• 3 hours before the weekly market closing (Friday)
• 30 minutes after market reopening (Monday)
• 30 minutes before daily market closing (Monday – Thursday)
After the above period ends, leverage will automatically return to the original leverage.
5. Important Rules
• The adjustment only affects new positions open during the adjustment period.
• Positions opened before the adjustment period will not be affected.
• Once the adjustment period ends, original leverage will resume automatically.
6. Example Scenarios
Example 1 – Position Opened Before the Adjustment Period
A client opens a Gold position at $3,000 before the news period.
Account leverage: 1:500
Margin required:
3000 × 100 ÷ 500 = $600
Since the position was opened before the news period, the leverage remains unchanged.
Example 2 – Position Opened During the News Period
A client opens a Gold position during the news period.
Leverage is temporarily reduced from 1:500 to 1:200
Margin required:
3000 × 100 ÷ 200 = $1500
Once the news period ends, the leverage setting will revert to the original level.
Example 3 – Product With Lower Default Leverage
A client trades an index product with leverage 1:20.
Since the leverage is already below 1:50, the news-period adjustment does not apply, and margin requirements remain unchanged.
We strongly encourage clients to take these temporary leverage adjustments into account when planning trading strategies during high-impact economic events.
If you have any questions, please contact our support team: [email protected]
Start trading now – Click here to create your real VT Markets account
Start trading now – Click here to create your real VT Markets account
Start trading now – Click here to create your real VT Markets account
Start trading now – Click here to create your real VT Markets account
Hello there 👋
Hello there 👋
Scan the QR code with your smartphone to start a chat with us, or click here.
Don’t have the Telegram App or Desktop installed? Use Web Telegram instead.


