Daily Market Analysis
Market Focus
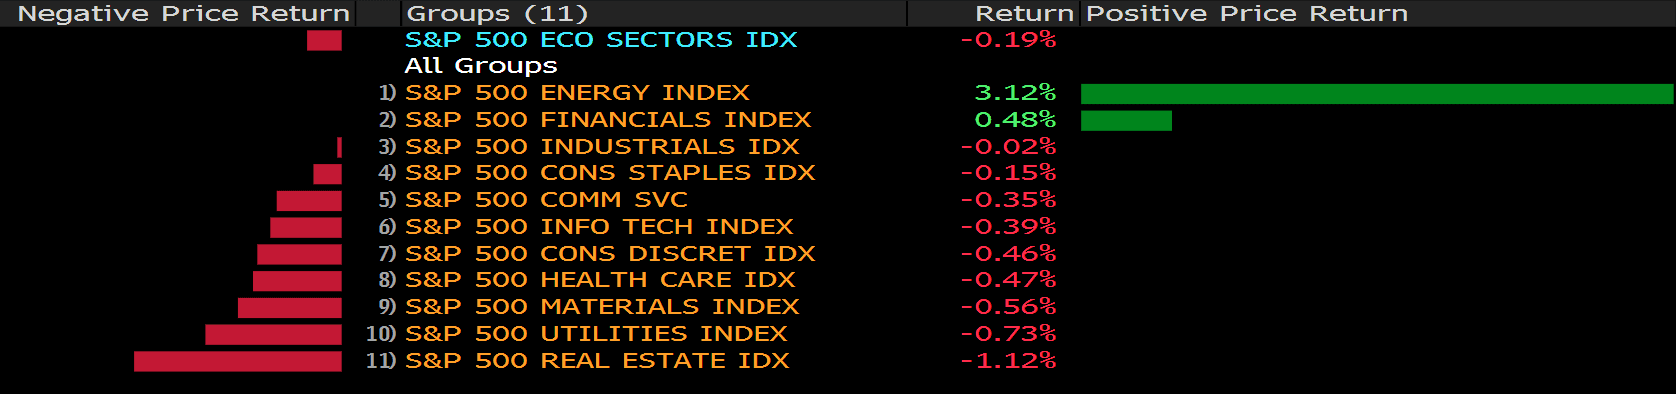
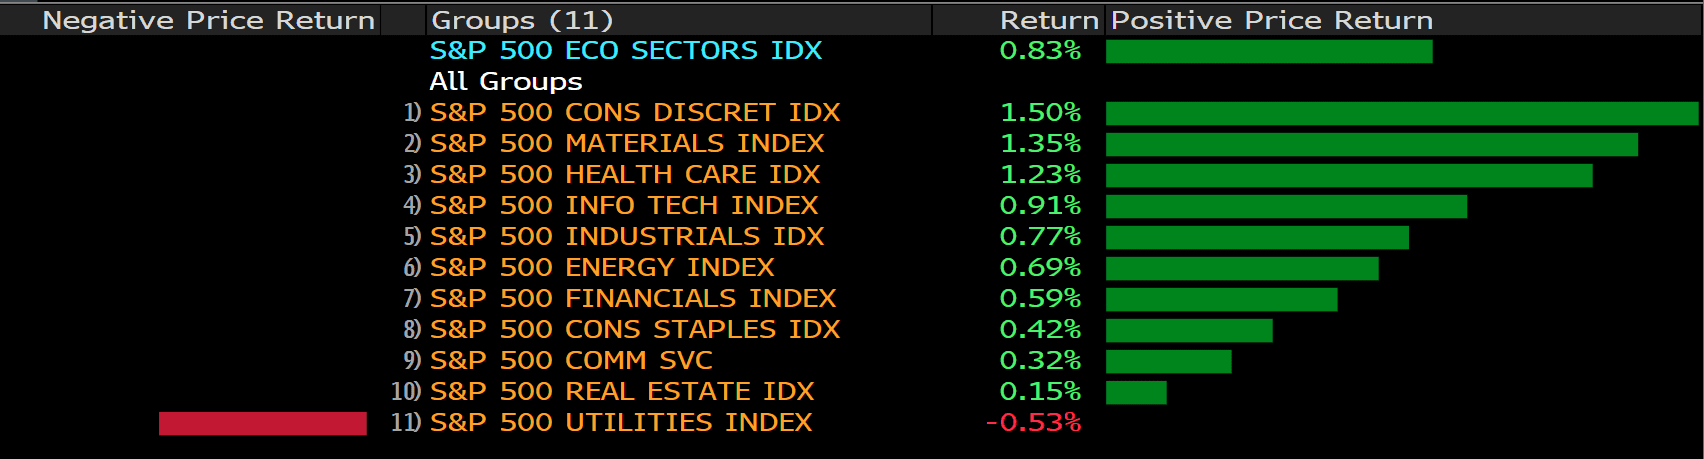
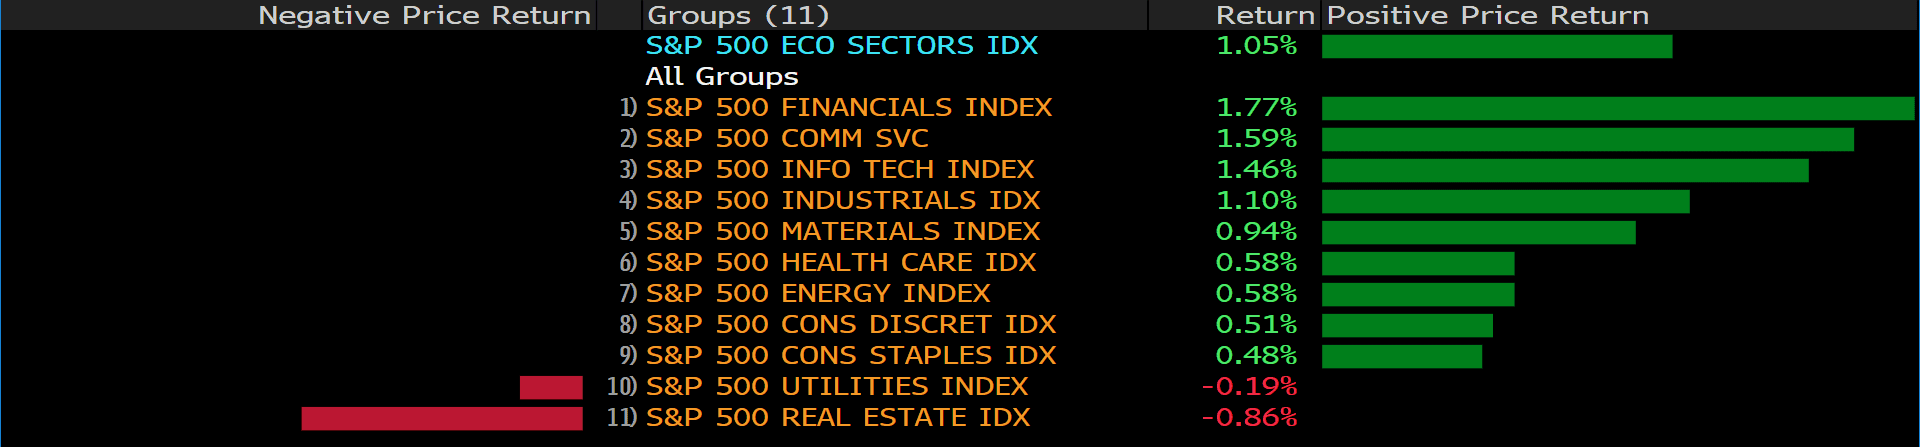
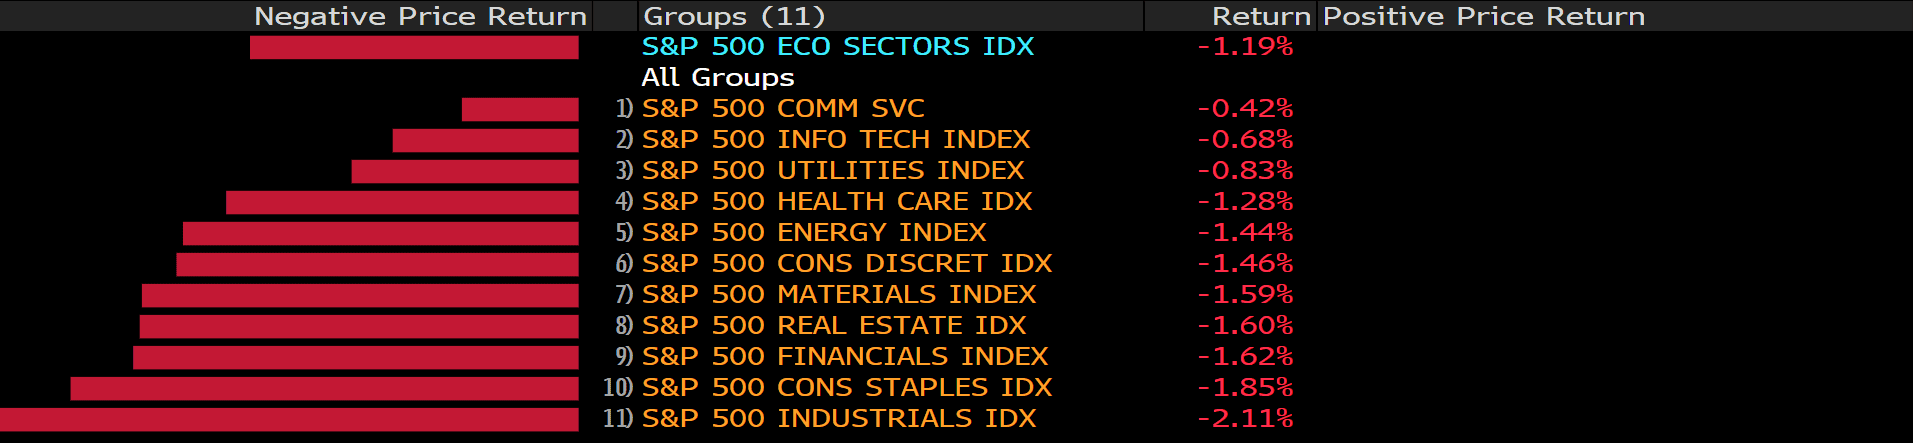
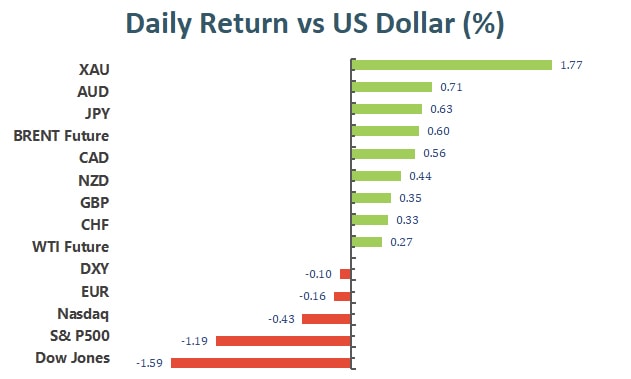
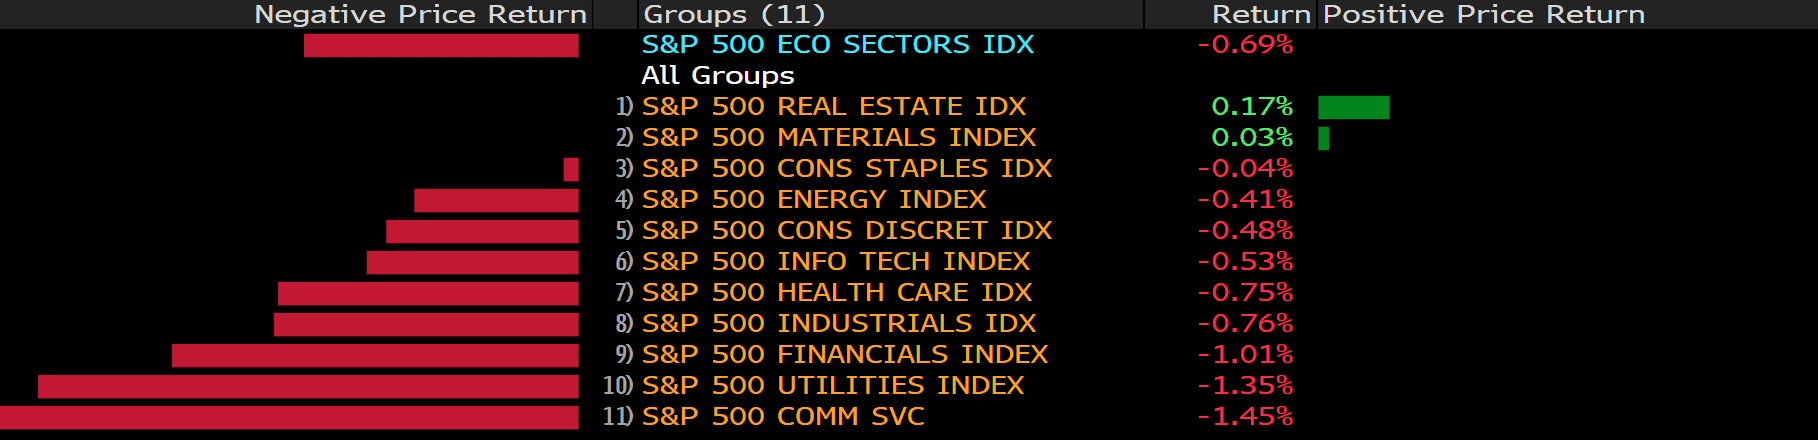
US markets started the week with gloomy mood as the Dow Jones shed 0.7%, and the S&P 500 dropped 0.7% while the Nasdaq Composite dipped 0.6%. Stocks were mostly positive for most of the day, but selling pressure increased in the final hour, with the major indices closing the session at their lows.
US 10- year Treasury yield has risen above 1.6% as markets tried to digest a disappointing job data from last Friday. The majority of the markets believed that the latest job report did not change the fact that the Federal Reserve’s outlook for tapering its bond purchases later this year.
Singapore has announced to open its border to more countries for quarantine- free travel. The move has shown that the country is preparing to reach a new normal to live with coronavirus. It is significant as Singapore is one of the world’s biggest travel and finance hubs.
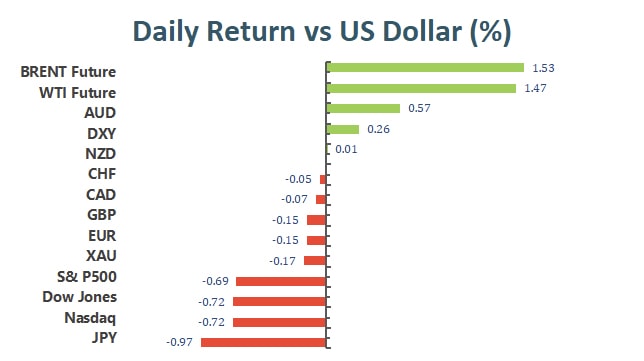
Main Pairs Movement:
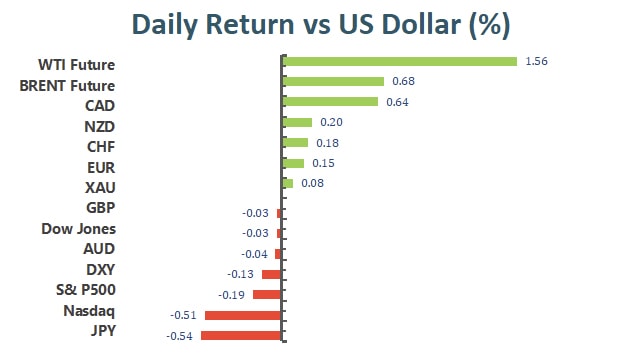
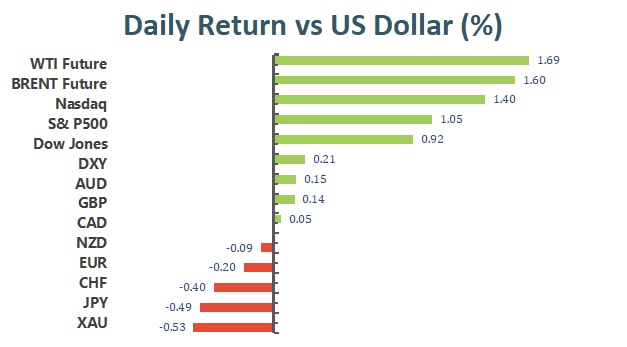
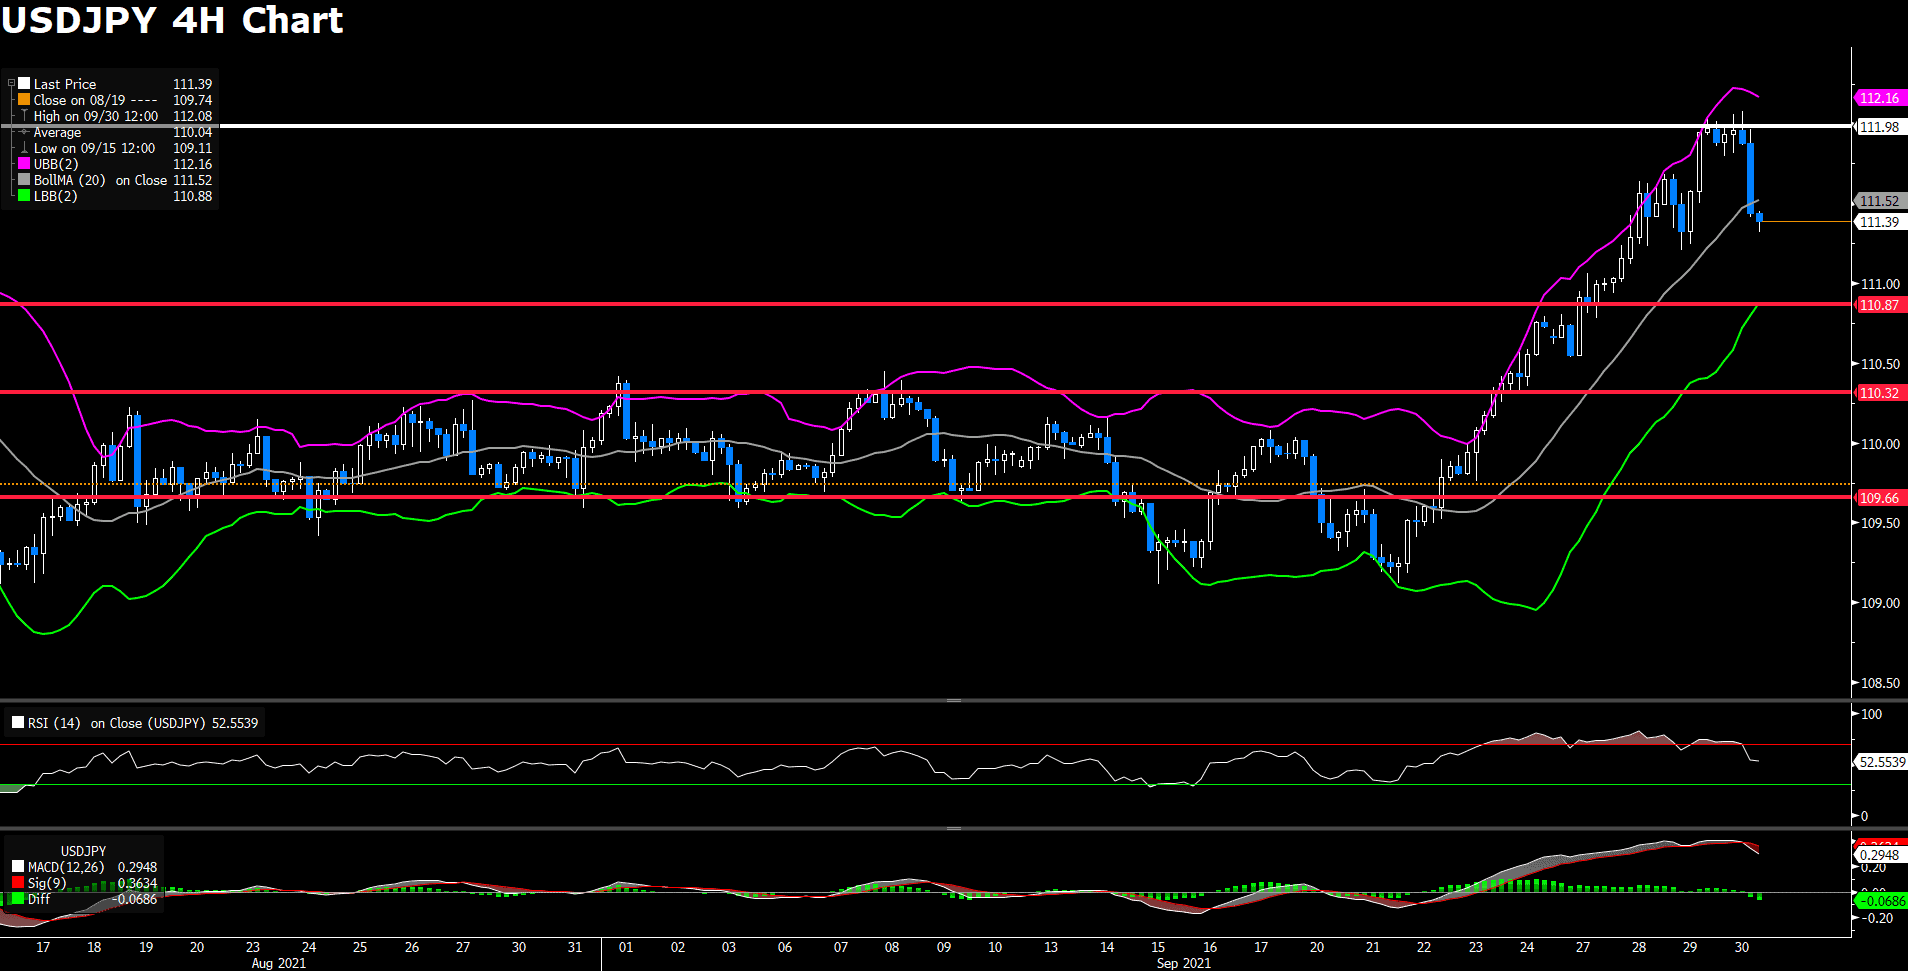
USDJPY printed a fresh high since 2018, trading at 113.482, up 0.97% on Monday. With Japanese bond rates well anchored while the Bank of Japan continued to keep policy rates on ice, the potential fact of the US Fed’s tapering should bring the US dollar stronger, favoring higher dollar- yen rate.
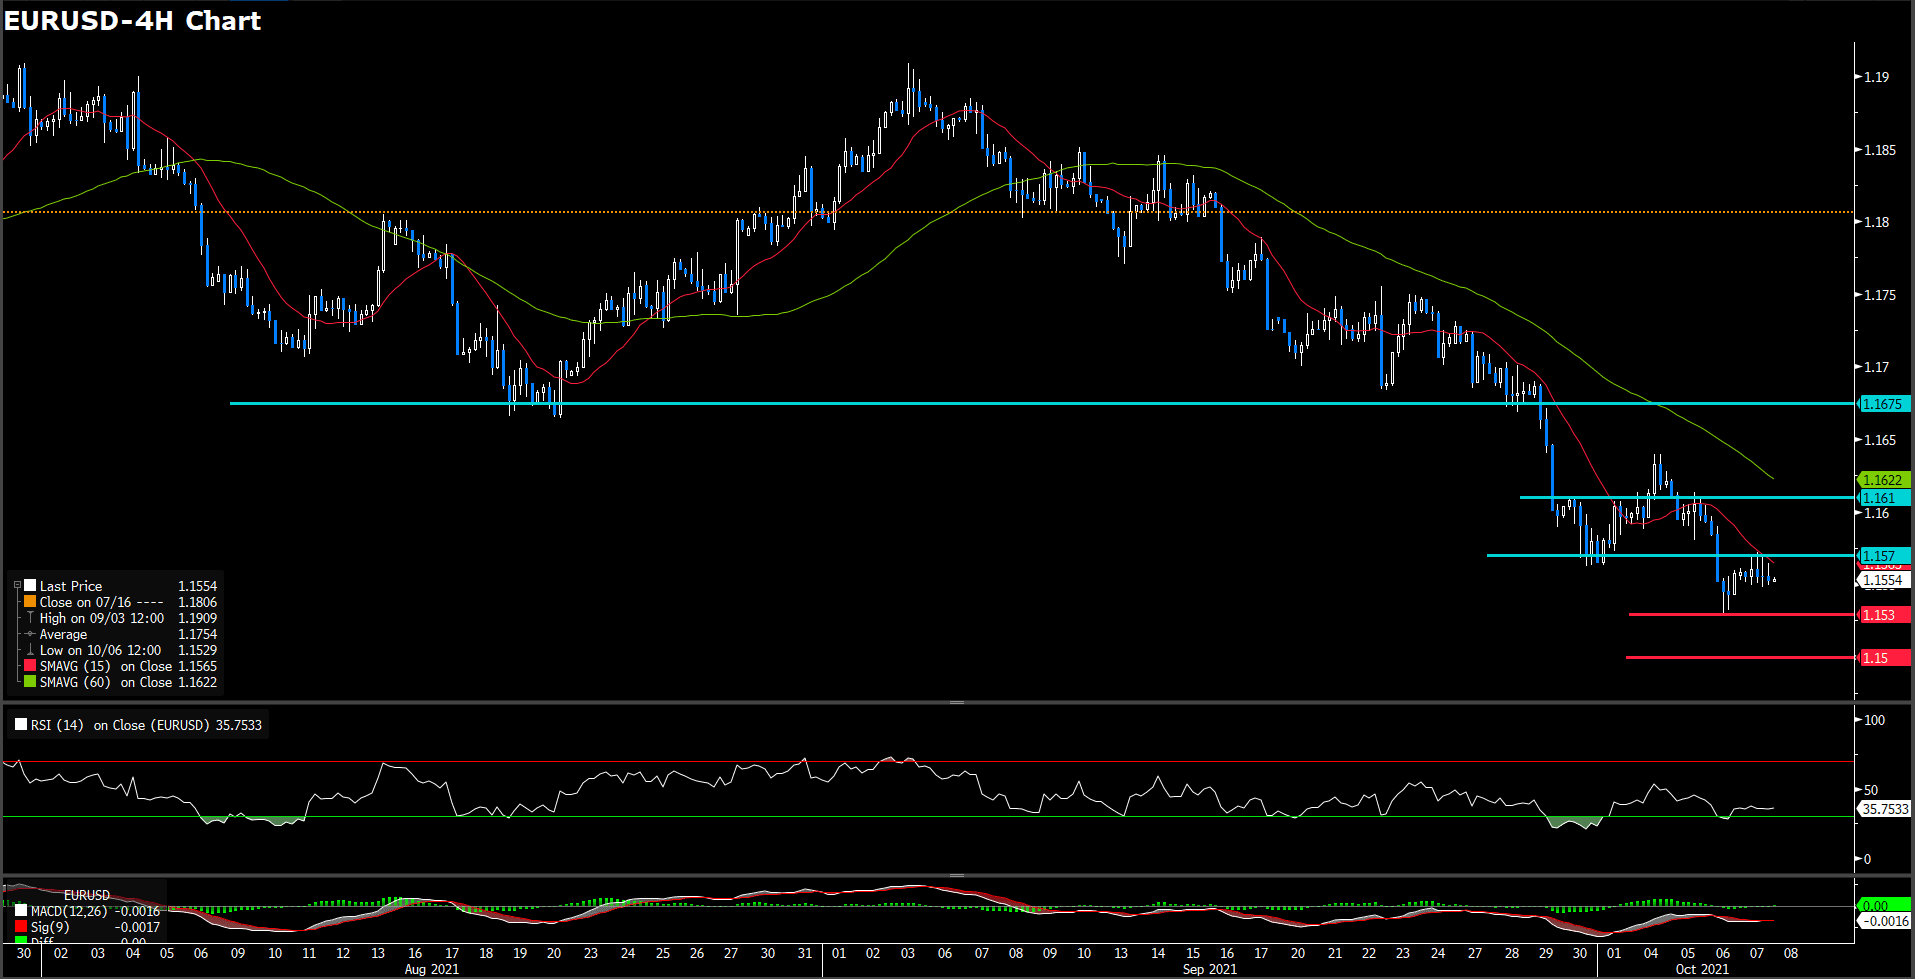
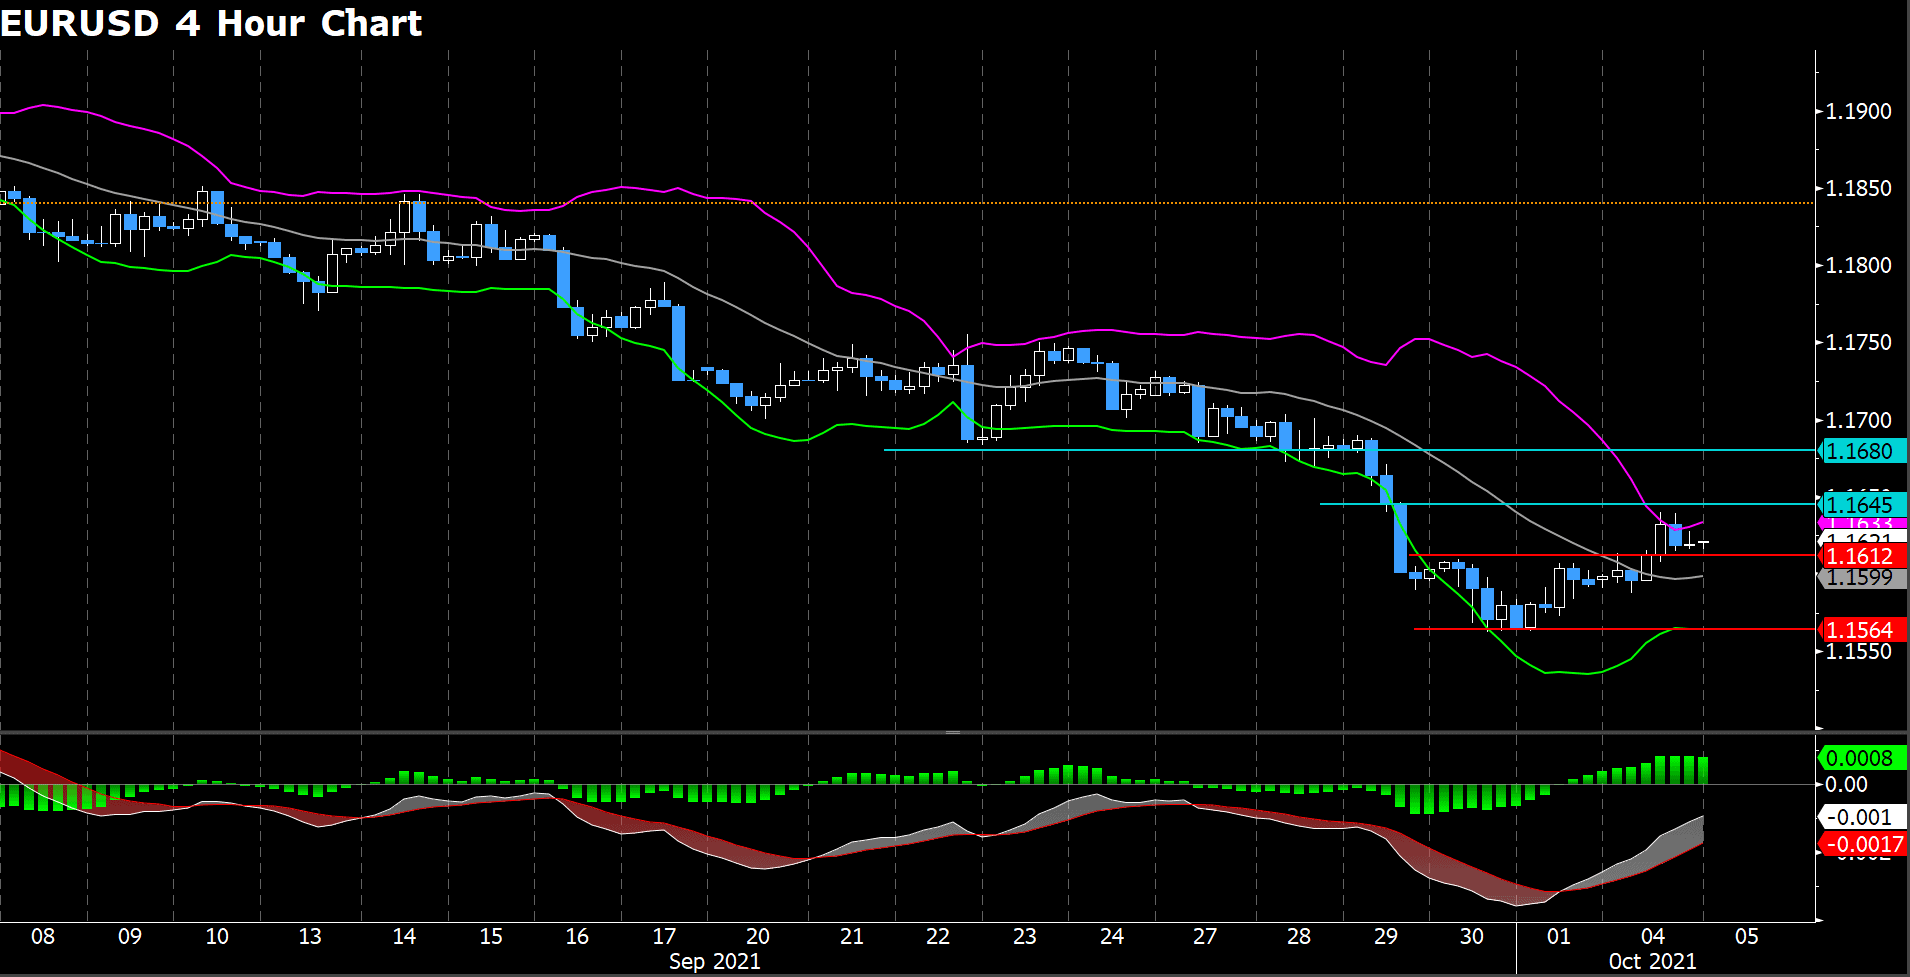
EURUSD seesaw between gains and losses on Monday, trading at 1.15494. The currency pair would be mostly driven by the dollar this week as the European calender is scarce, only including a couple of ECB’s speakers.
AUDUSD traded 0.52 higher, closing at 0.73427. The Australian dollar was stronger against the dollar on Monday as it was on the back of Iron ore prices.
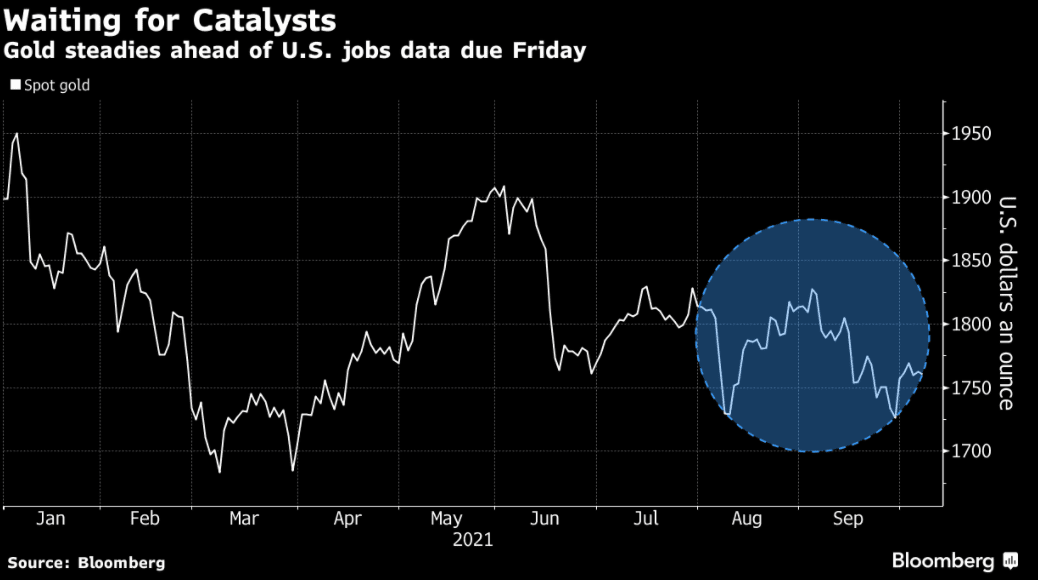
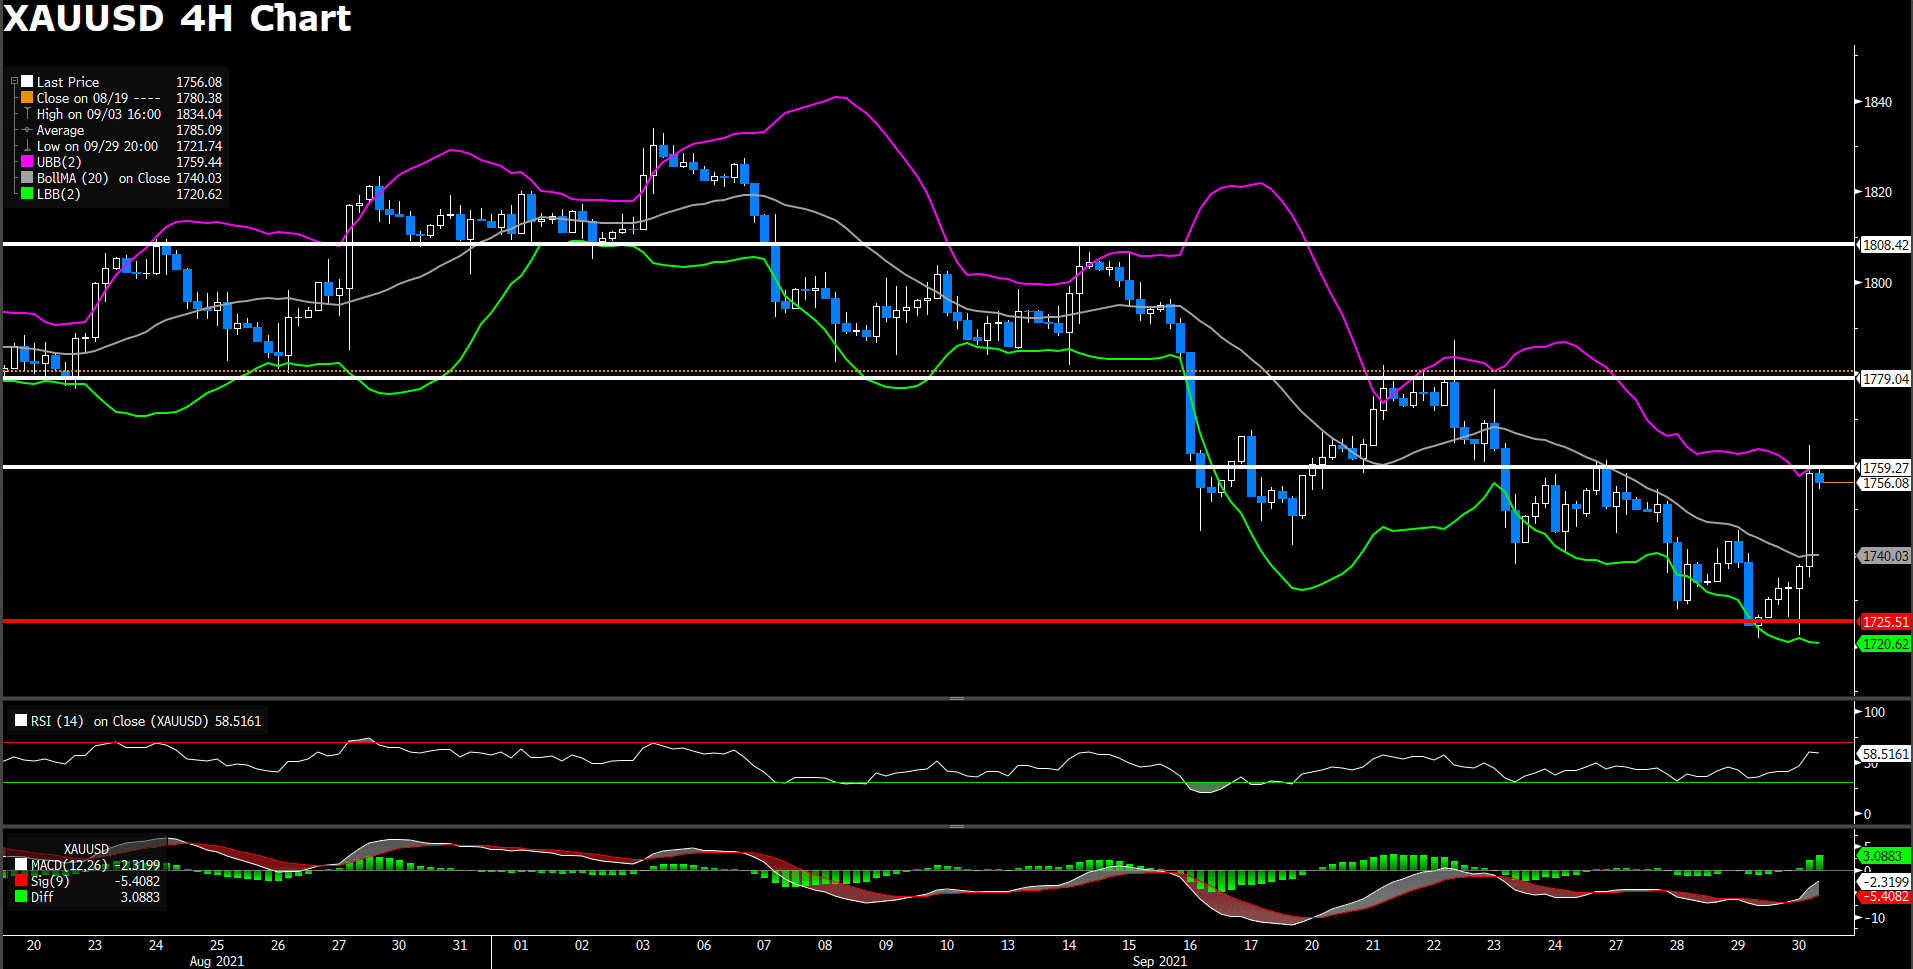
Gold price was consolidating on Monday, trading at $1,754. The bullion of gold was limited as markets awaited on the report of consumer spending and inflation for the days ahead of the FOMC.
Technical Analysis:
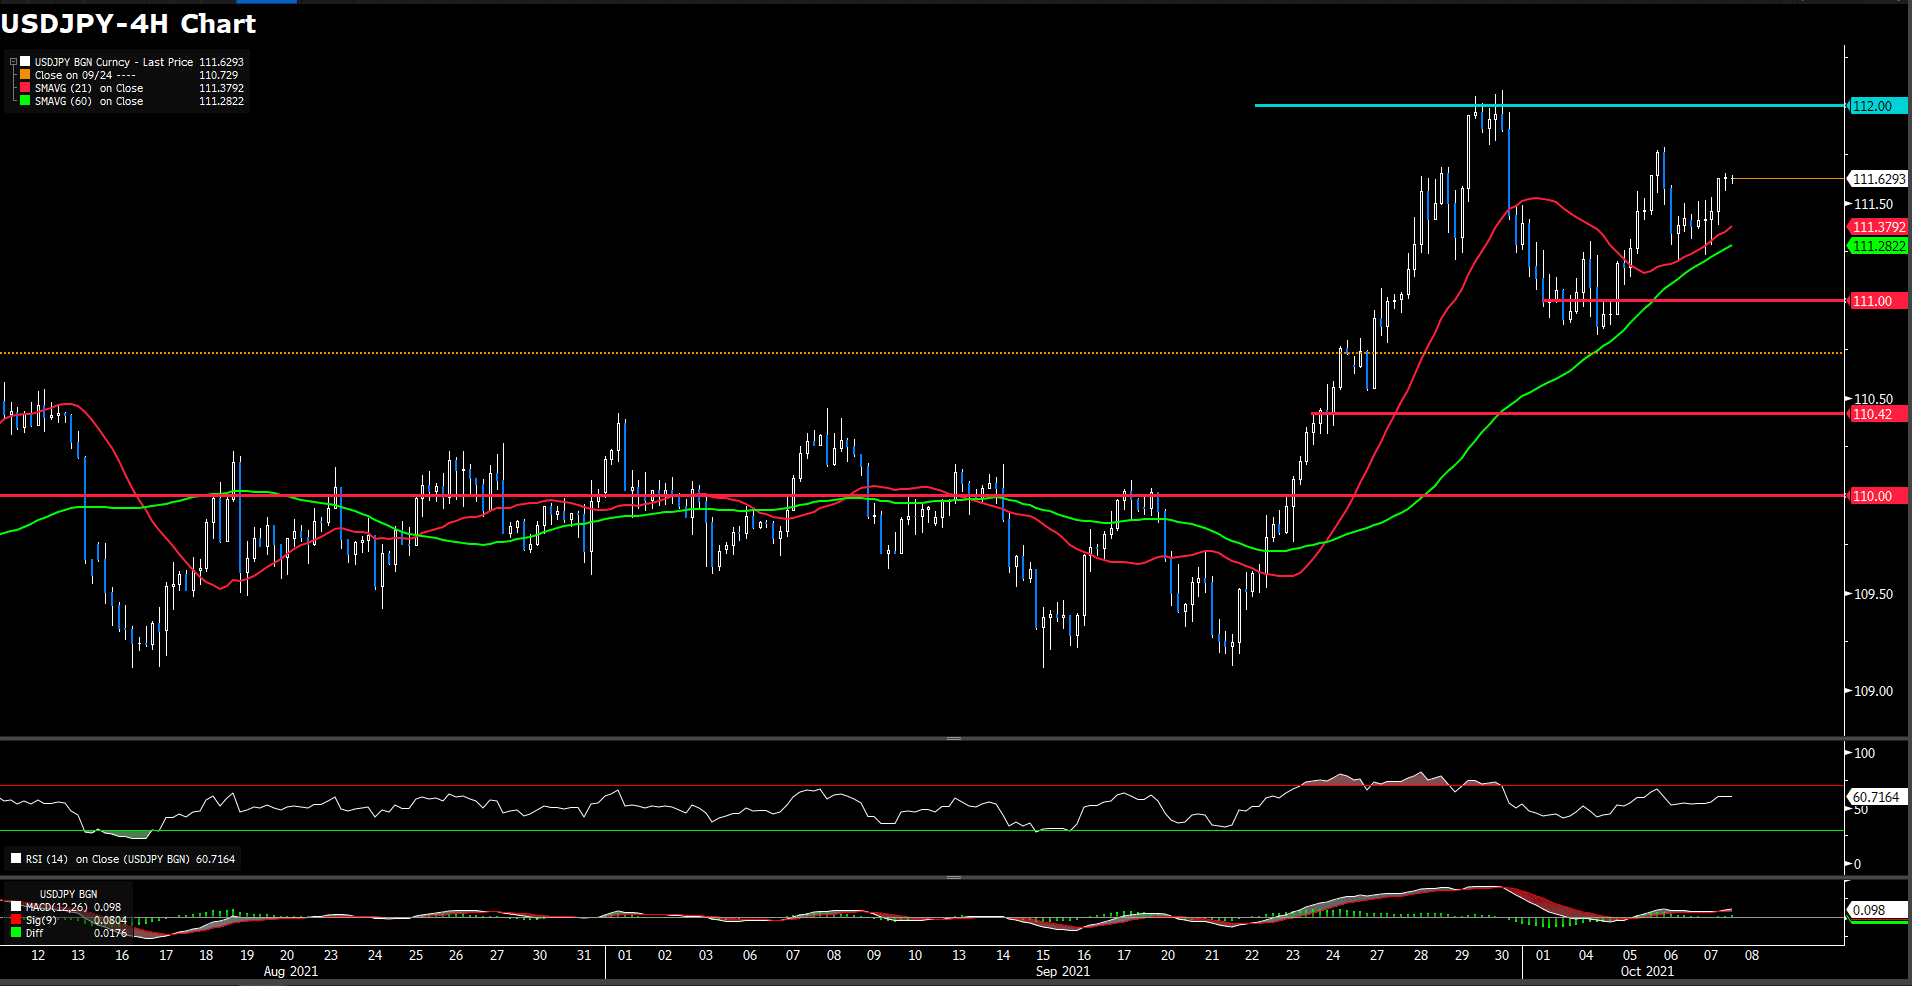
USDJPY (Daily Chart)

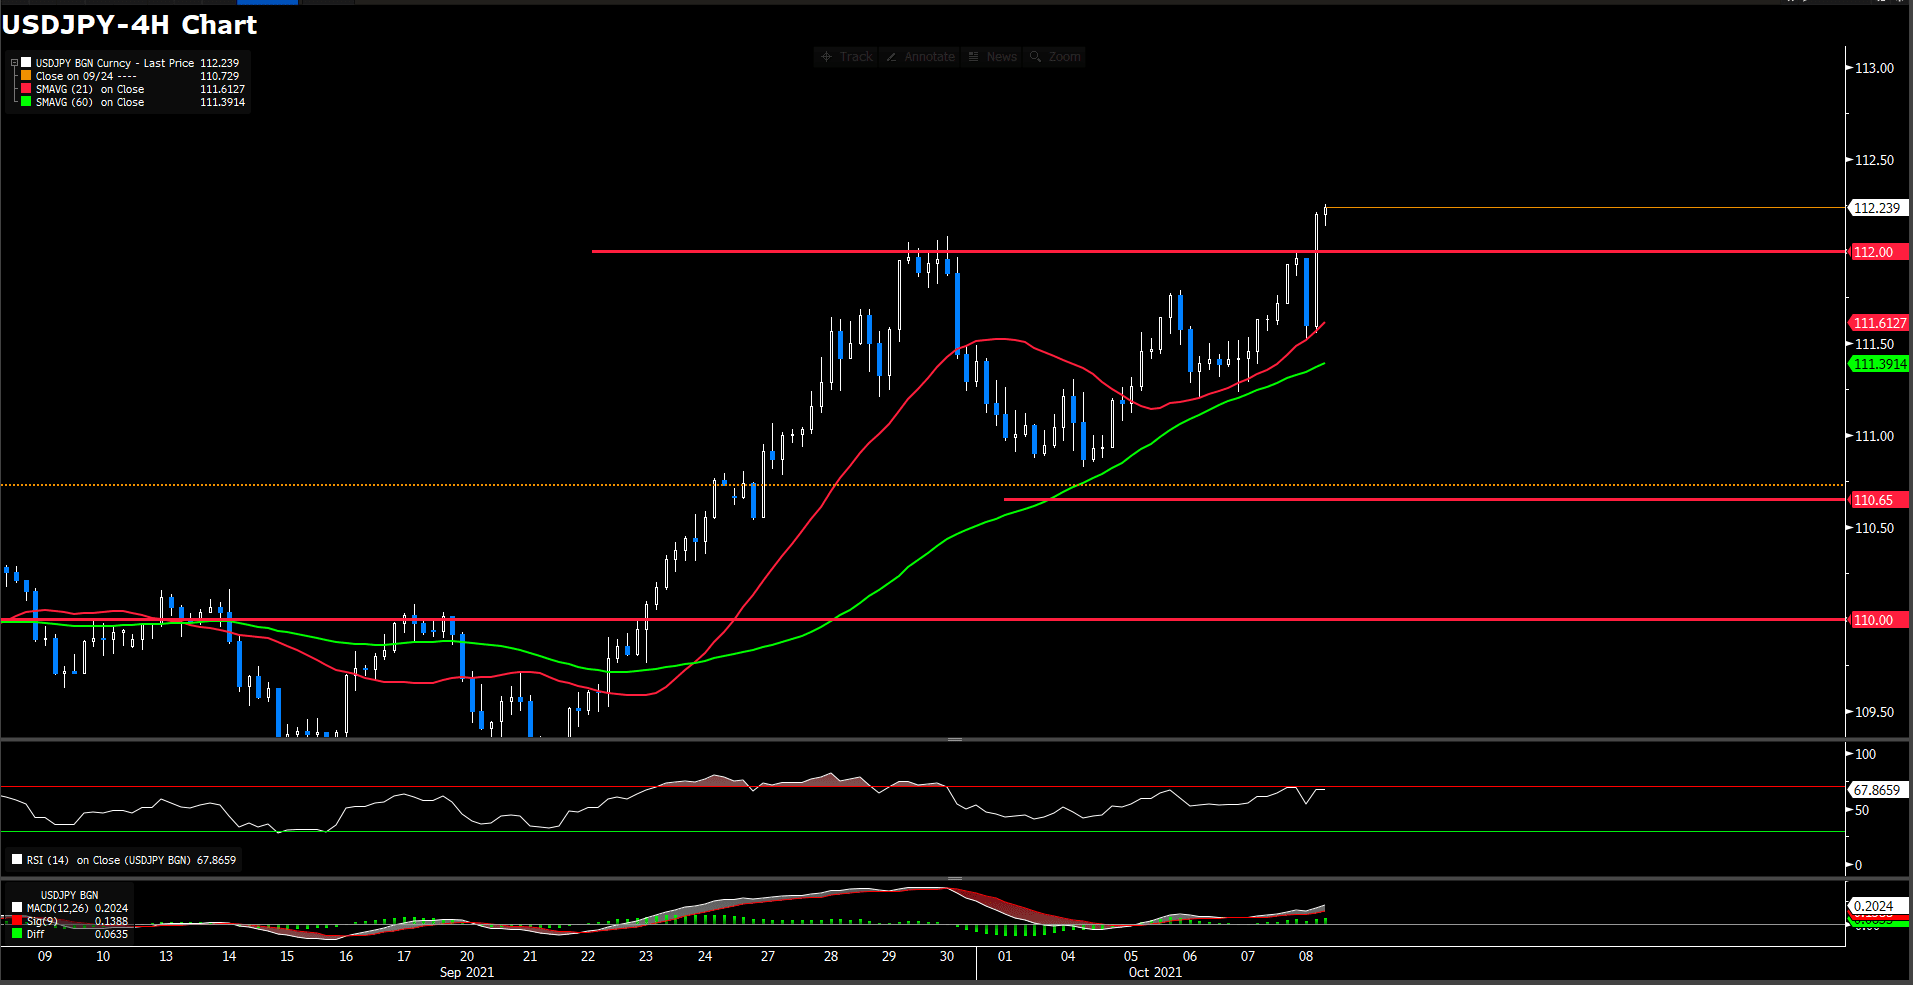
The Japan Yen is soaring during the New York session, trading at 113.38 as of writing, up over 1% in the day market. The risk-on environment, as witnessed by U.S. stock indices trading in the green, post gains between 0.43% and 0.86%. Also, the U.S. T-bond yields, with the 10-year benchmark note rate rising above the 1.6% threshold, exert upward pressure on the yen.
On technical side, RSI indicator show 79 figures that show overly bought sentiment in short-term. On moving average side, 15-and 60-long moving average are remaining the ascending traction.
All of all, yen has break through a critical resistance at 112 recently that we believe market will high probably tick up to higher level while it could maintain smooth momentum. One thing conccern is only by market has exaggerated bounce up in short term that we could not rule out market will have a correction.
Resistance: 114.55 (Oct. 2018 high), 118.60 (Jan. 2017 high)
Support: 112.00, 110.65, 109.15
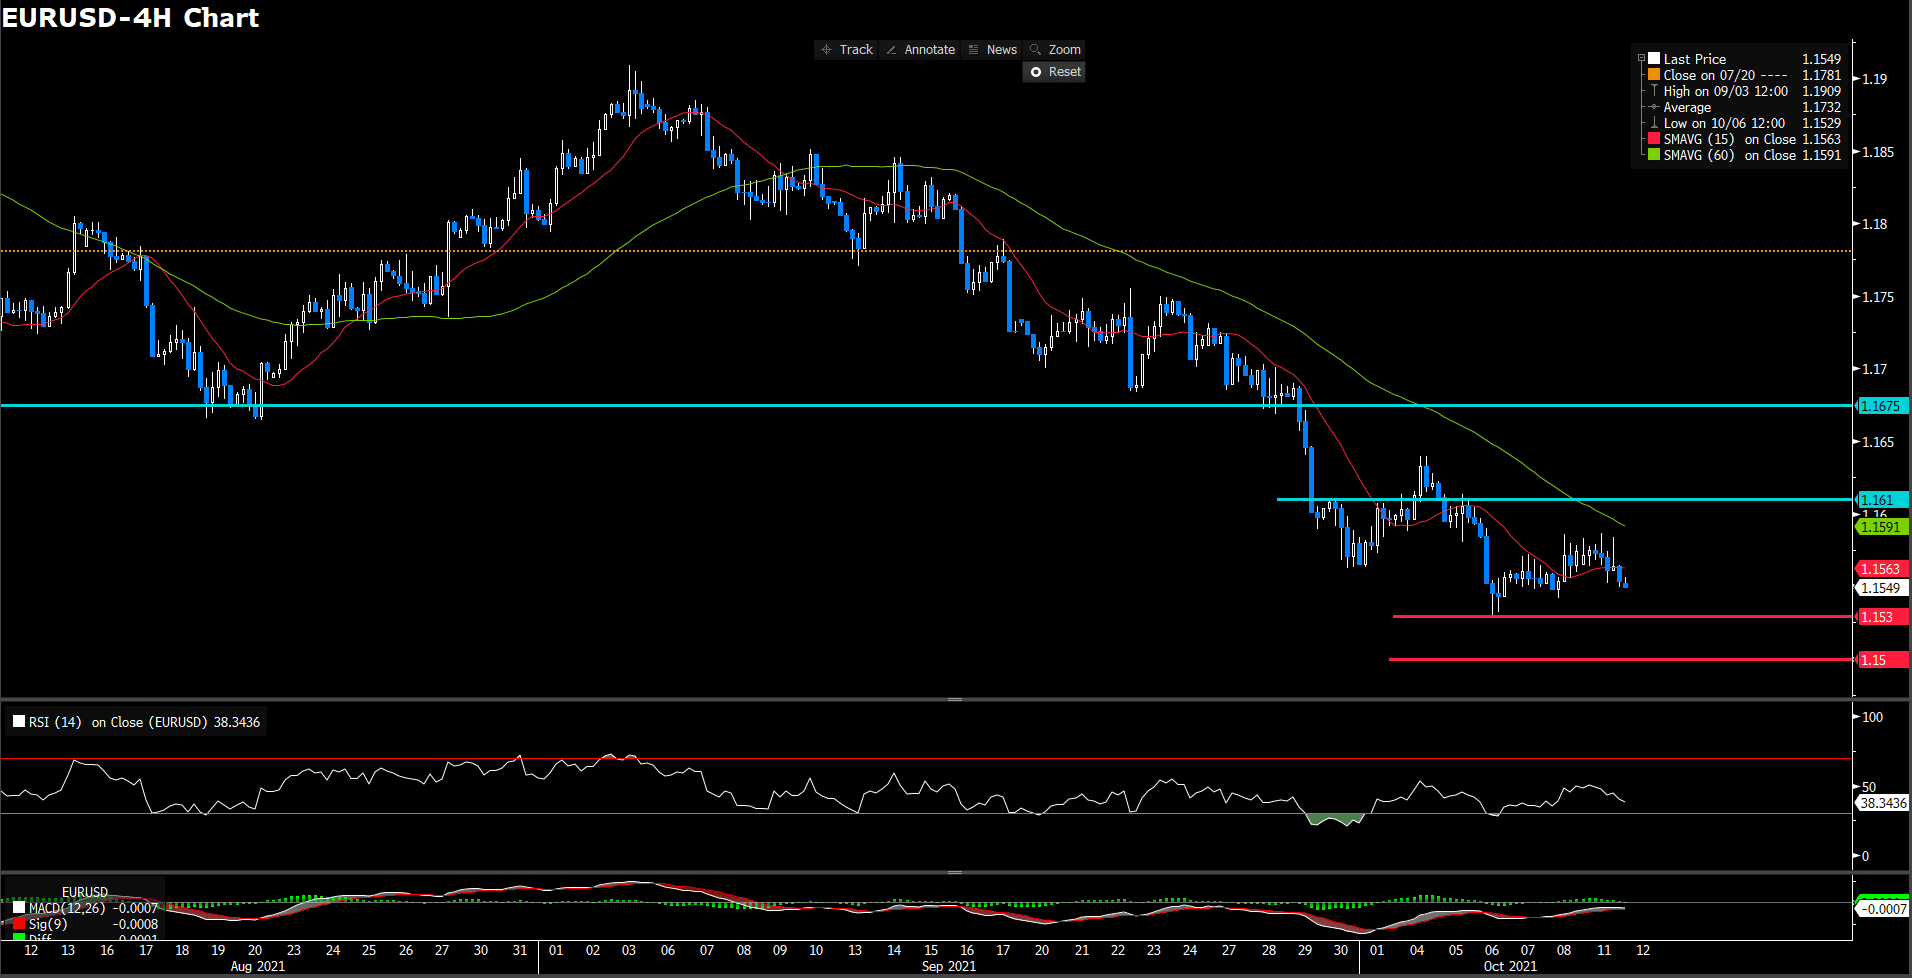
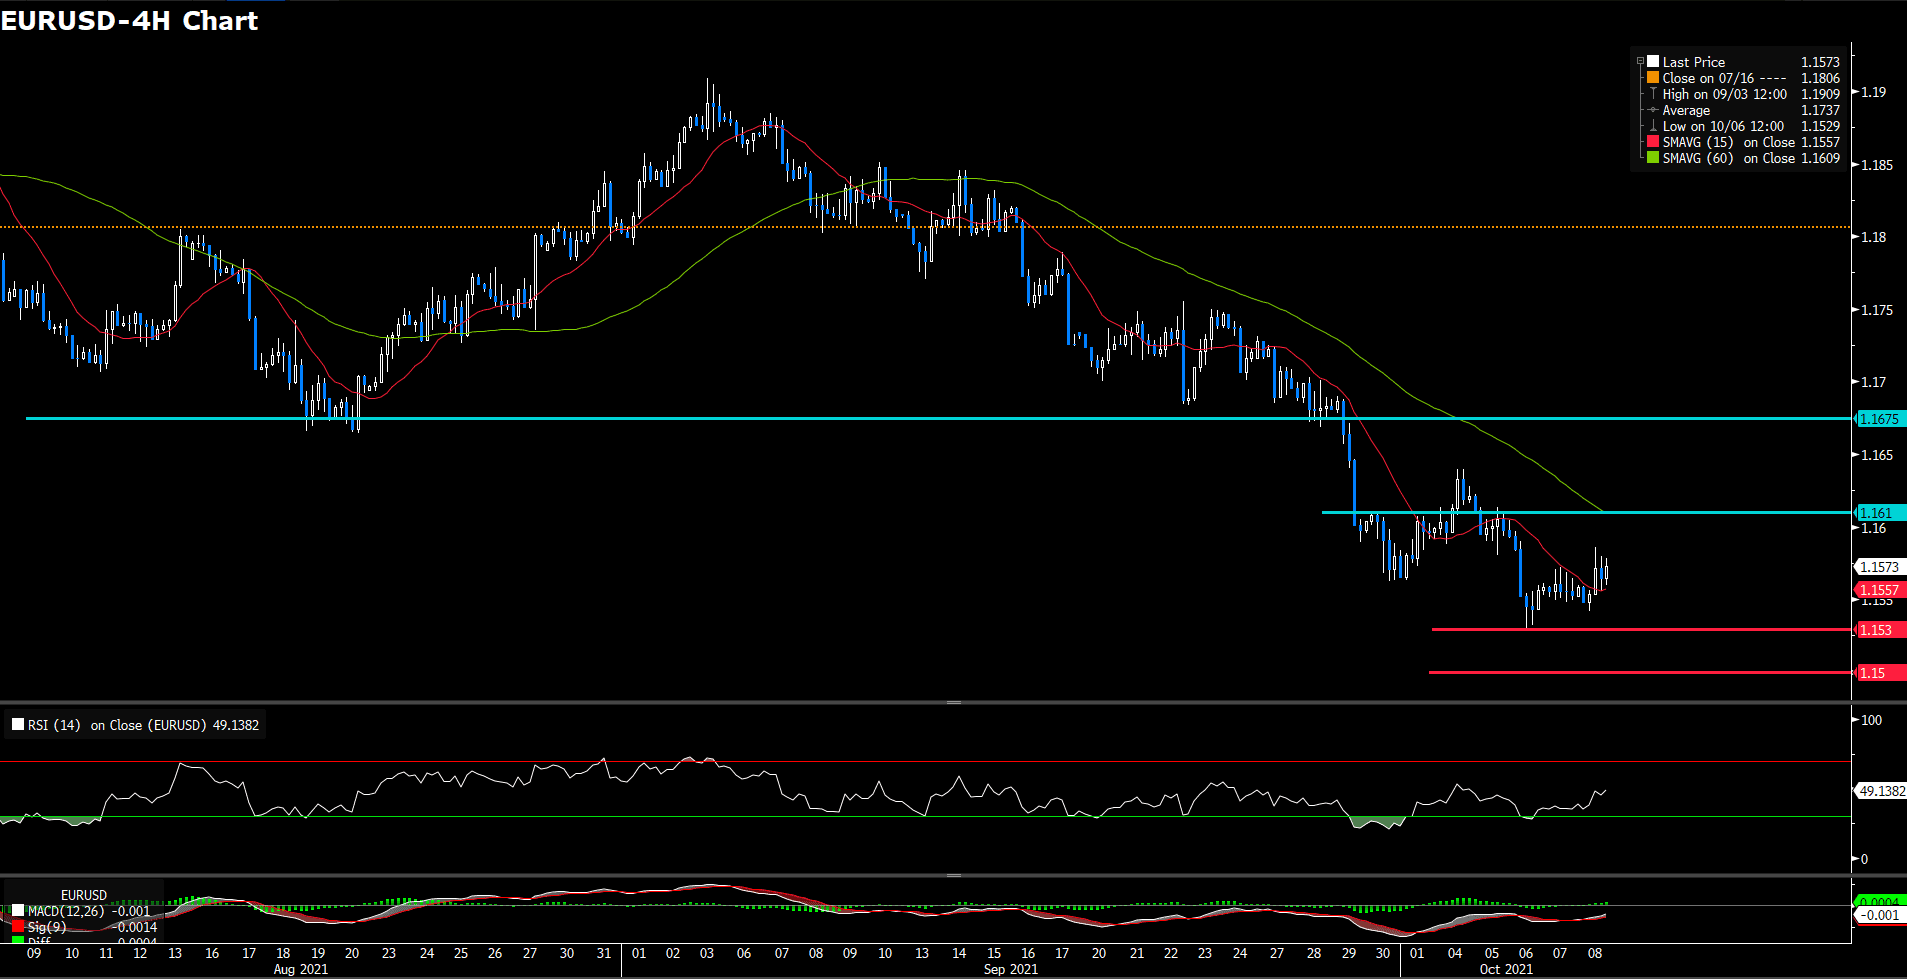
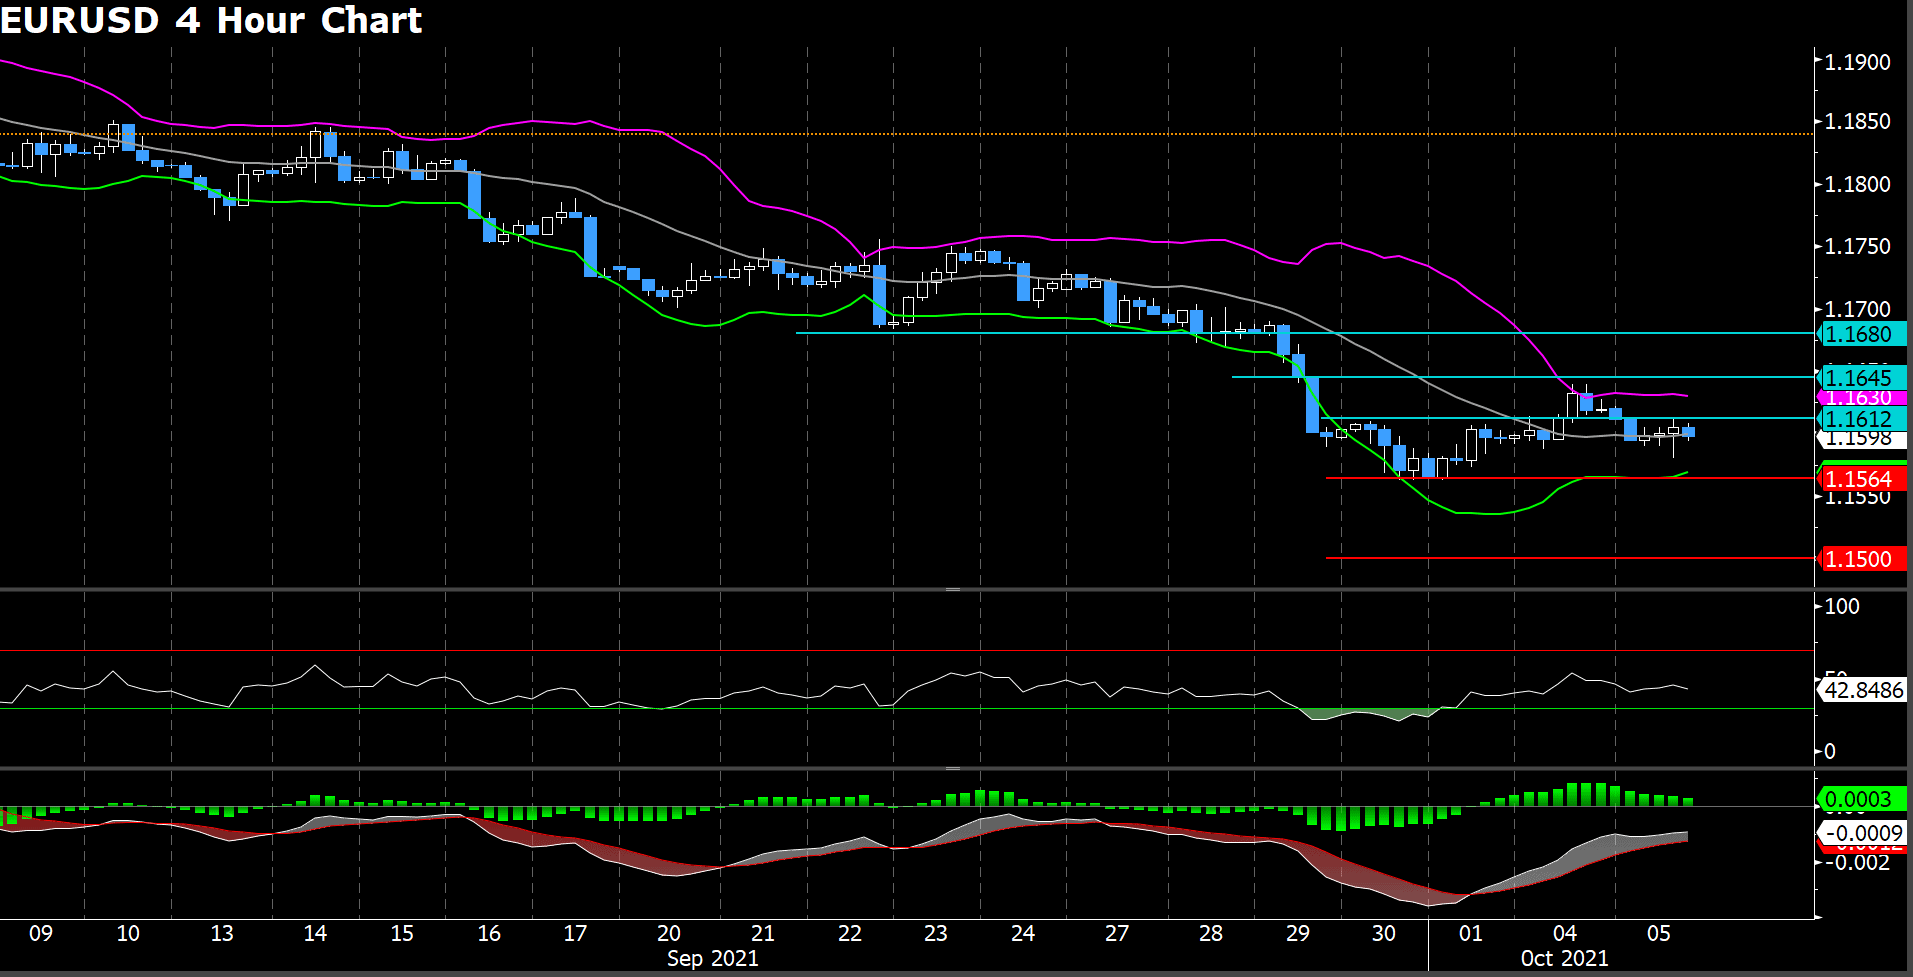
The euro dollar pair is trading below 1.16, yet get off the lows as U.S. share indices advance and closed bond markets provide some calm, Concerns about enetgy costs, disappointing U.S. jobs figures and uncertainty about fiscal policy weighed on sentiment earlier. The ECB’s member, Lane seems reluctant to act to battle inflation.
On the technical, RSI continuing to trim the weakness to higher stage and close around 39, suggesting a bearish movement ahead. On average side, 15-long indicator has flatering a movement while 60-long remaing decending movement.
On slip side, we expect the last time low, 1.153 level, will give pair a short-term support guidance. If break down the threshold, we foresee the downside support will eye on psychological level at 1.15
Resistance: 1.161, 1.1675
Support: 1.153, 1.15
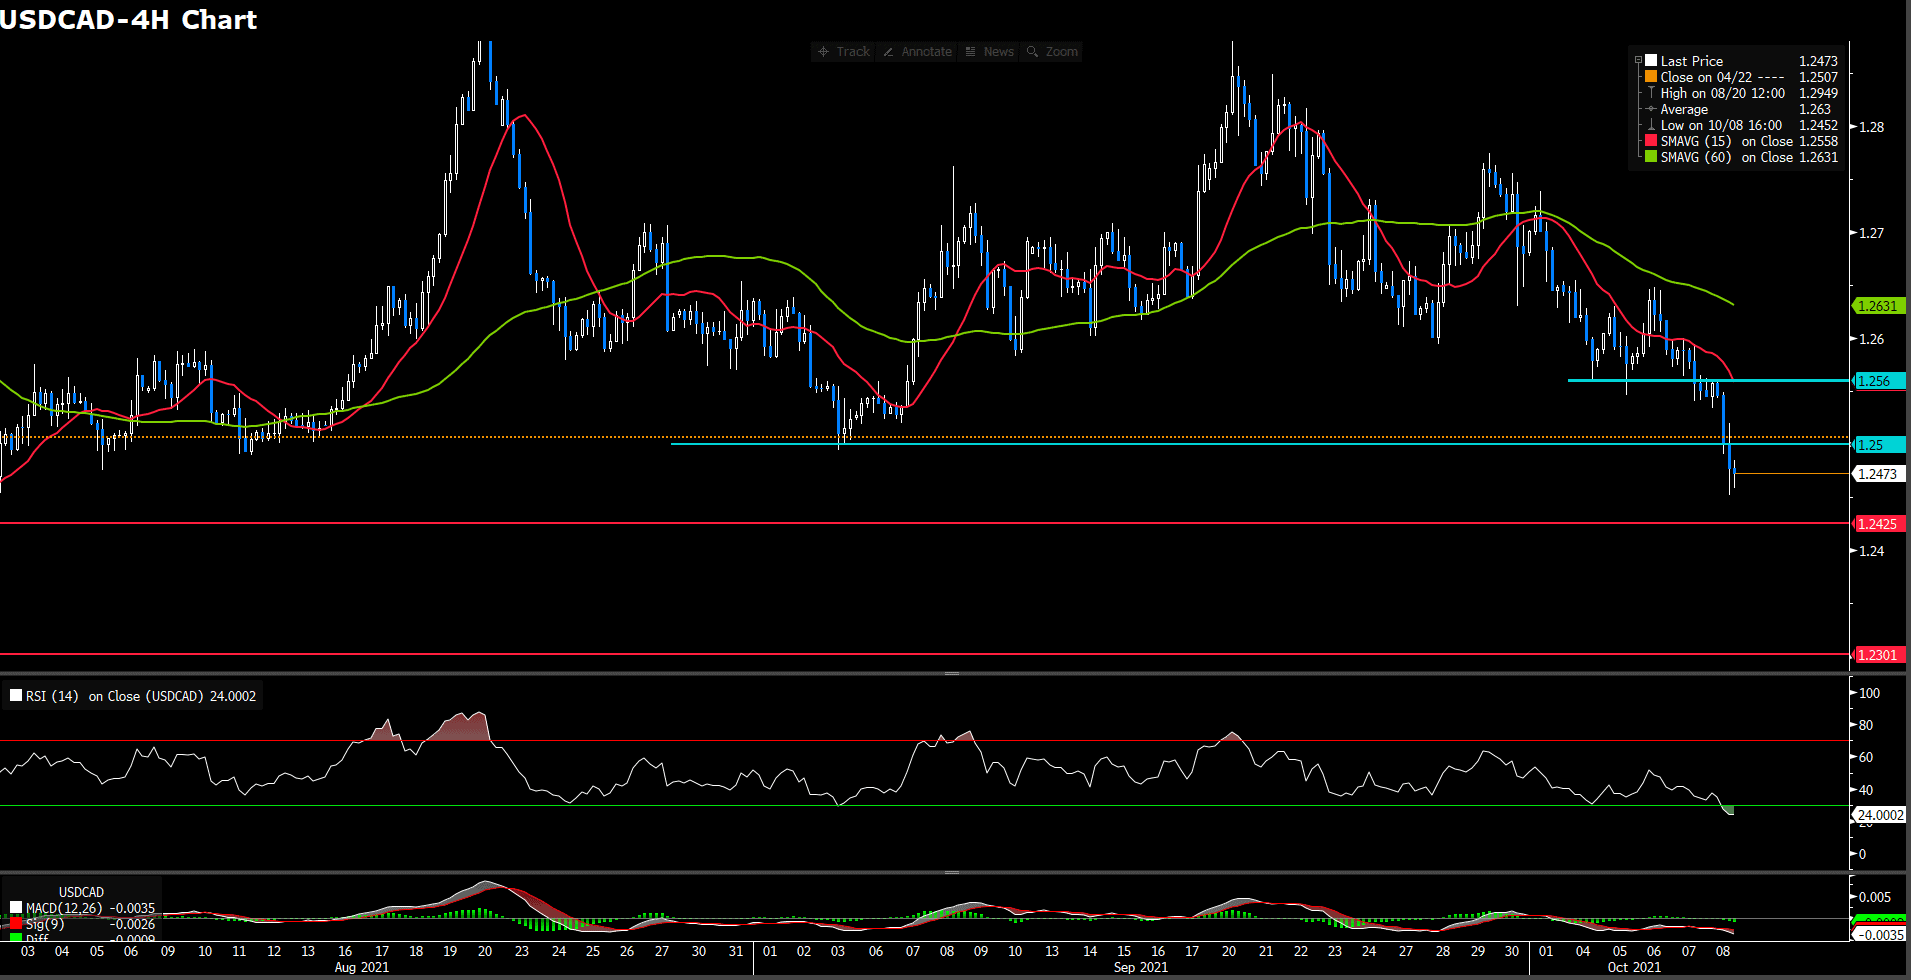
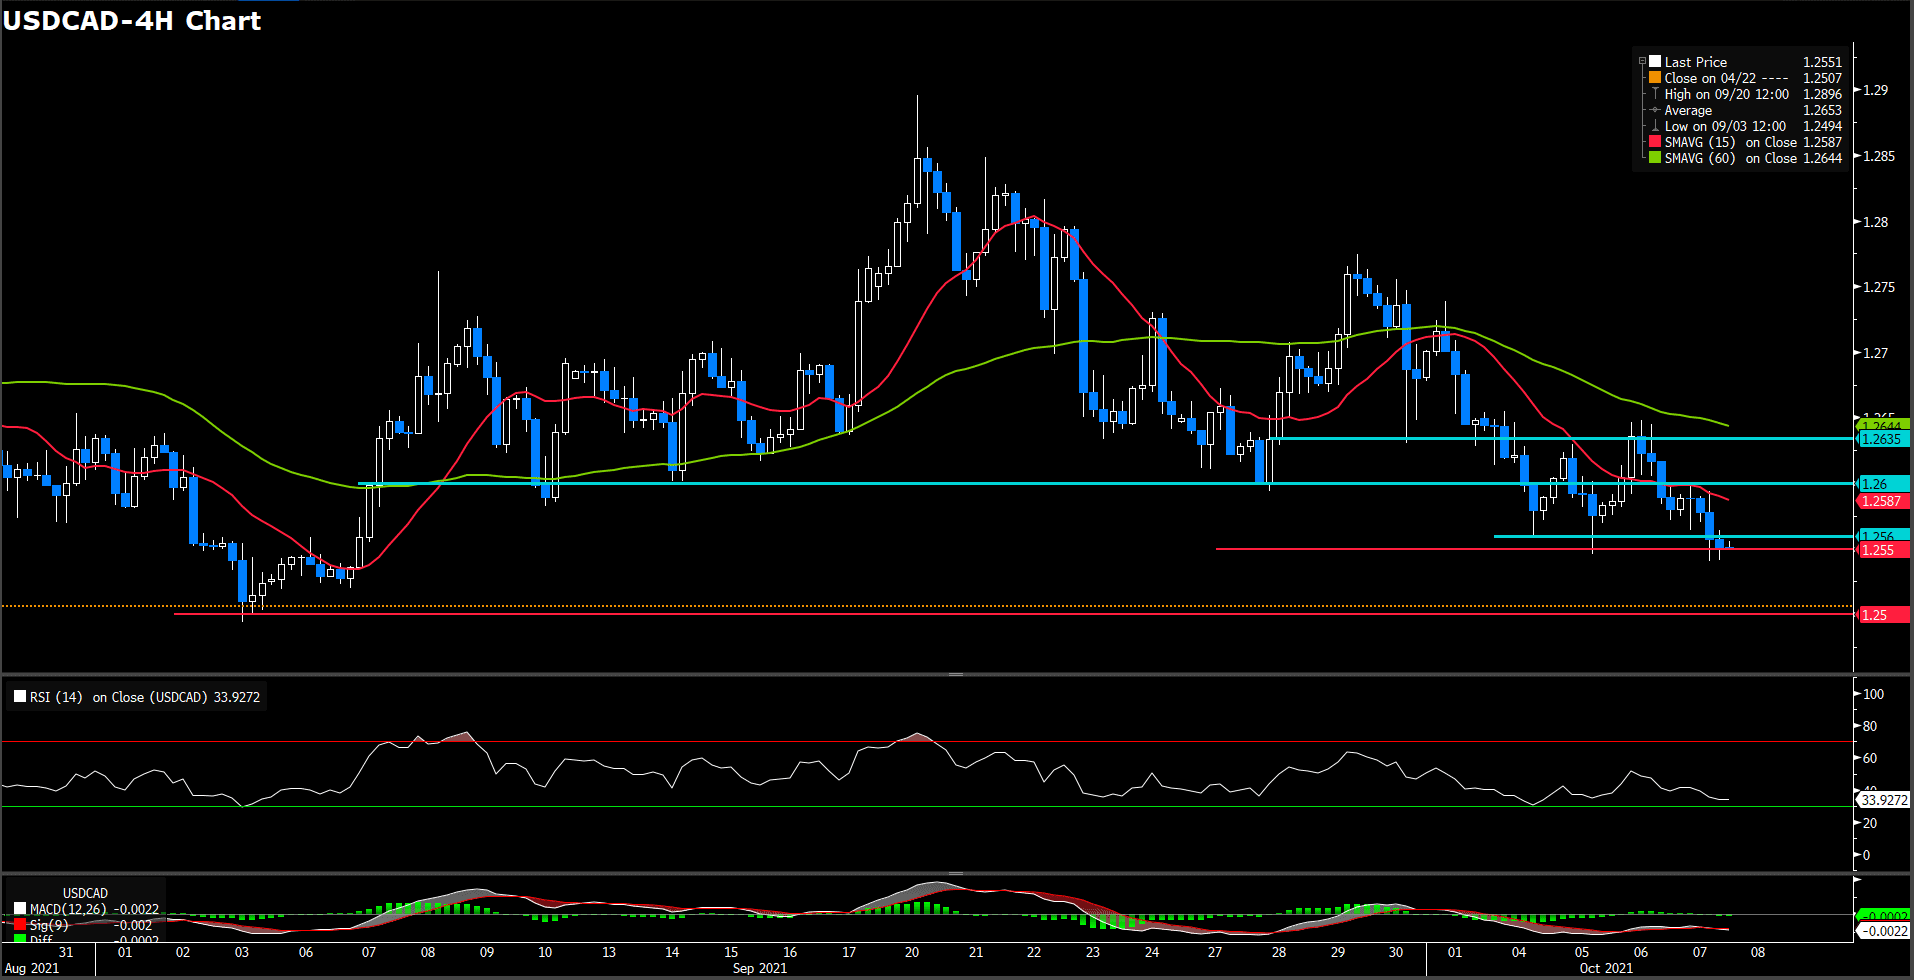
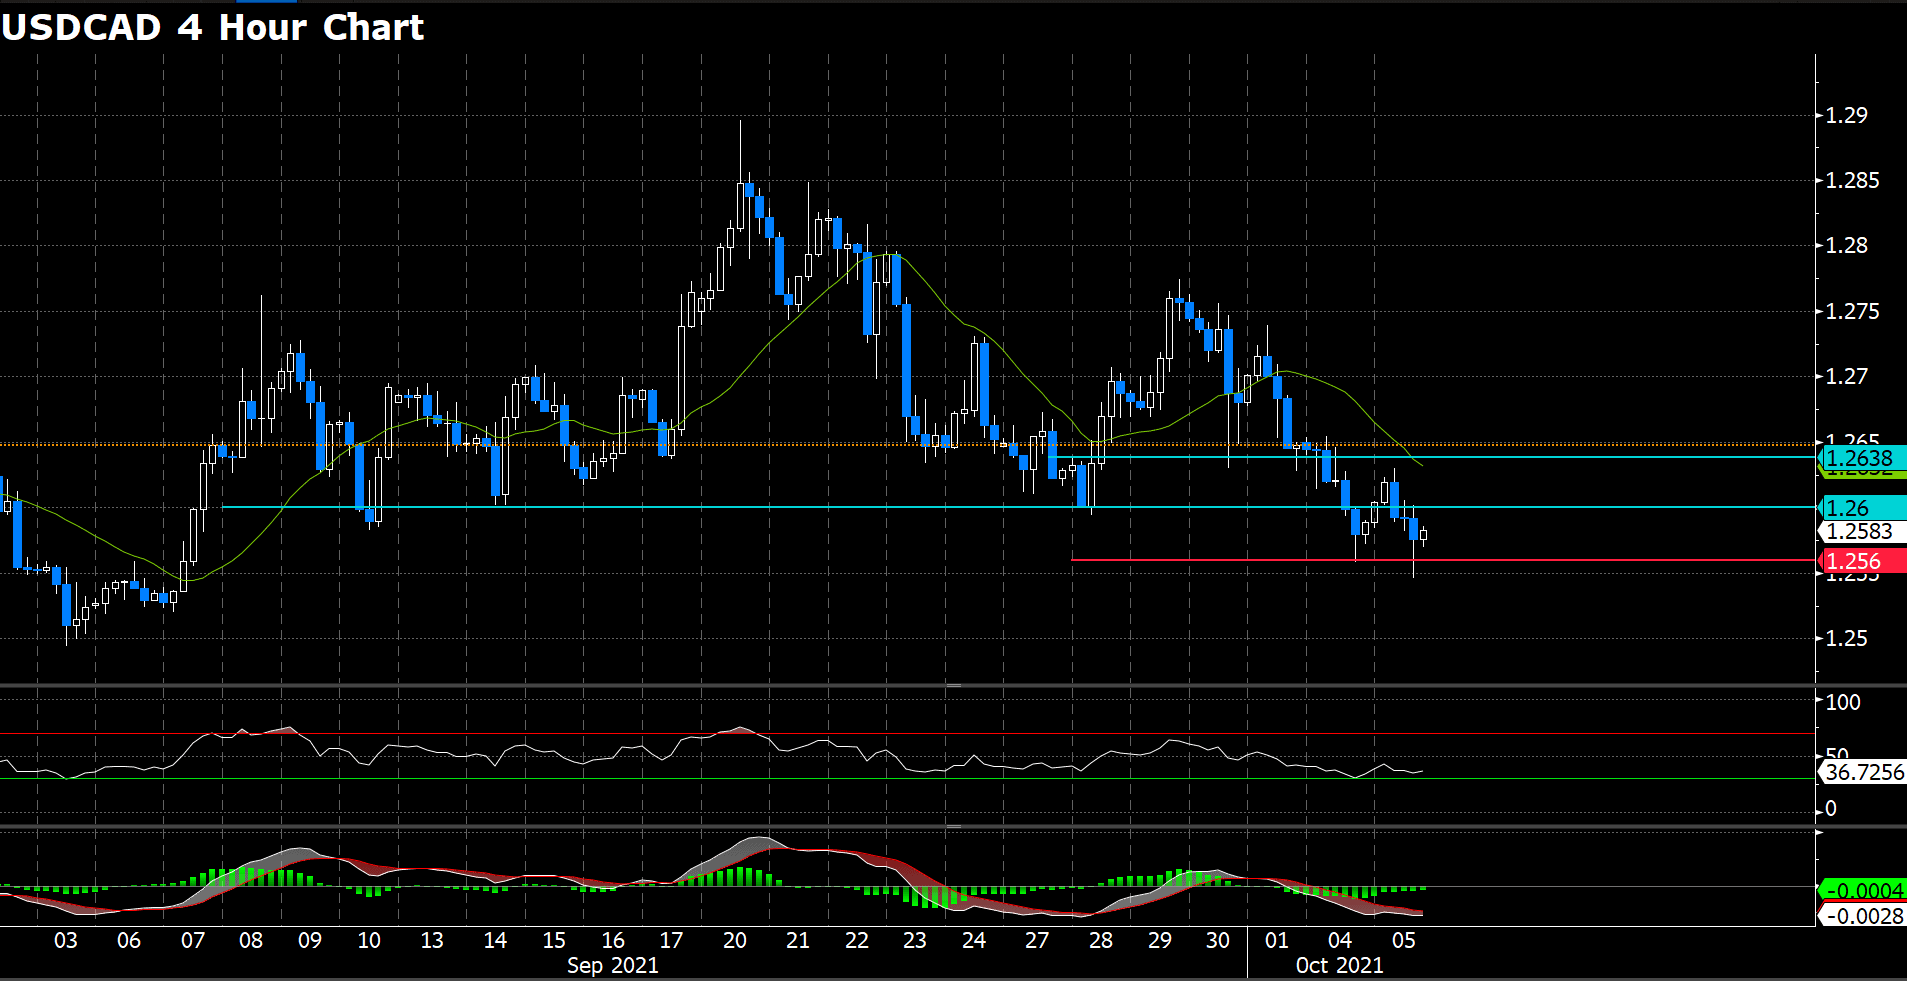
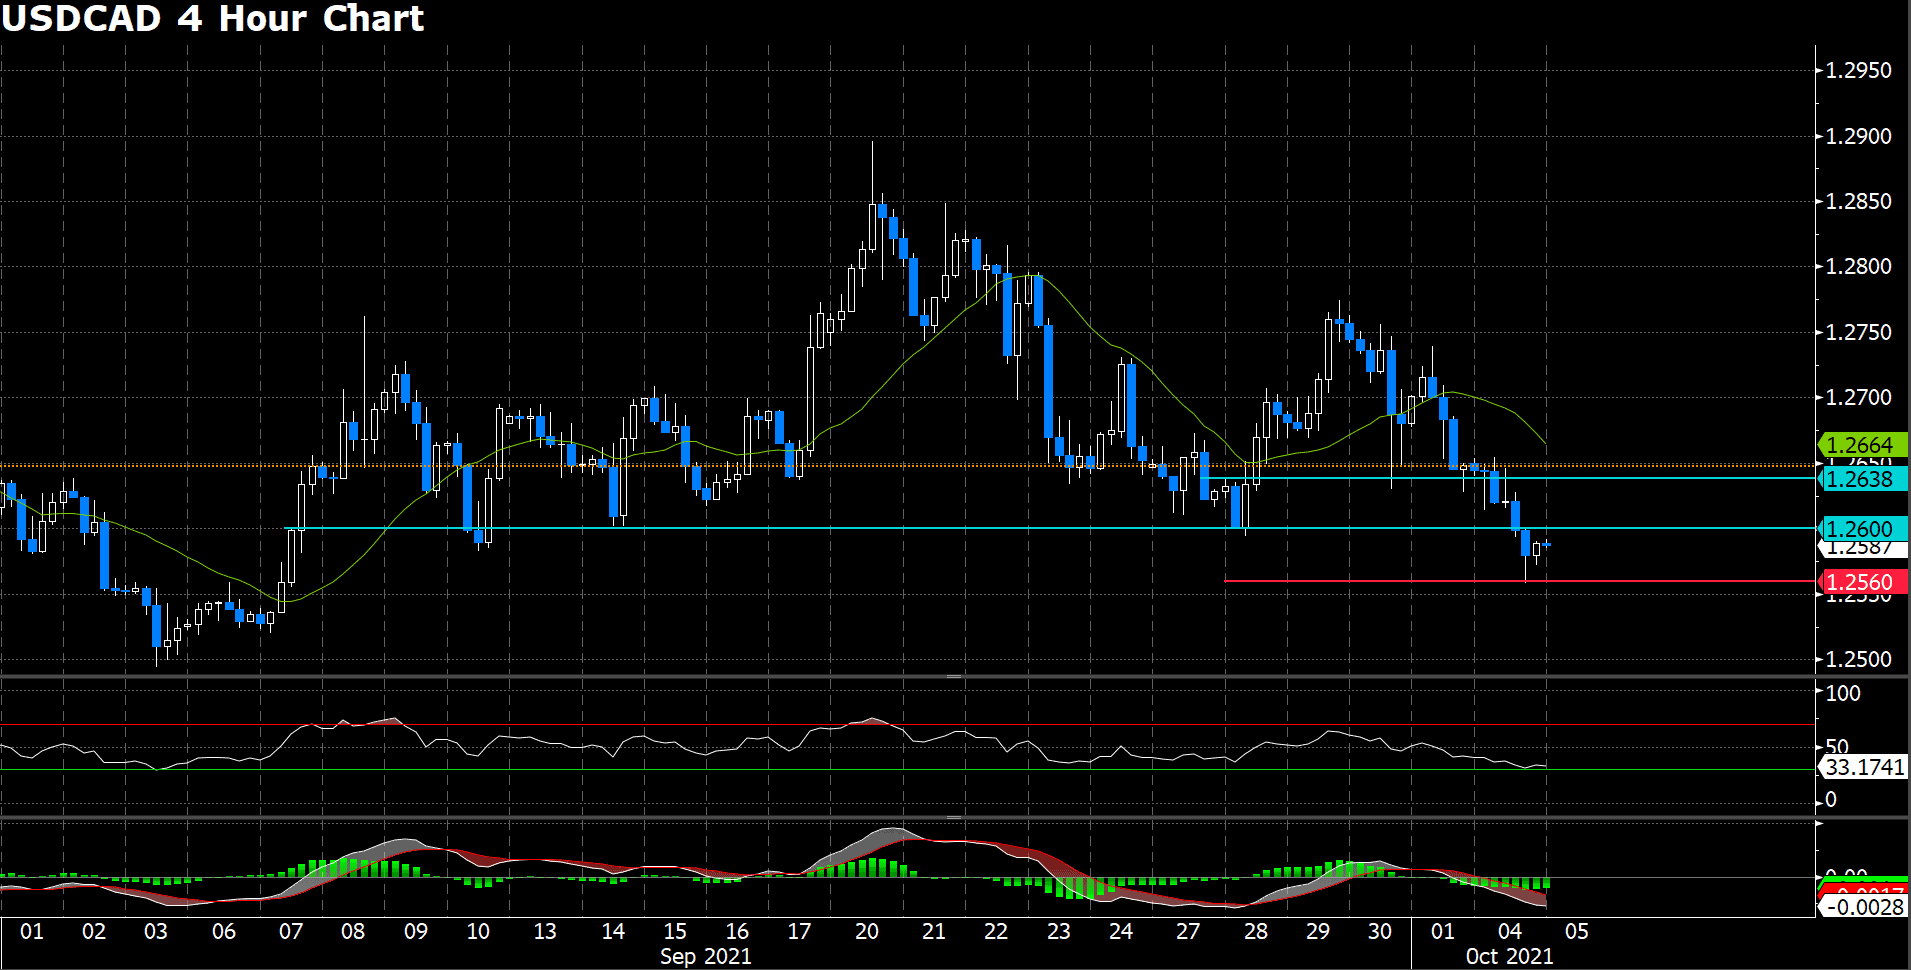
USDCAD (4 Hour Chart)
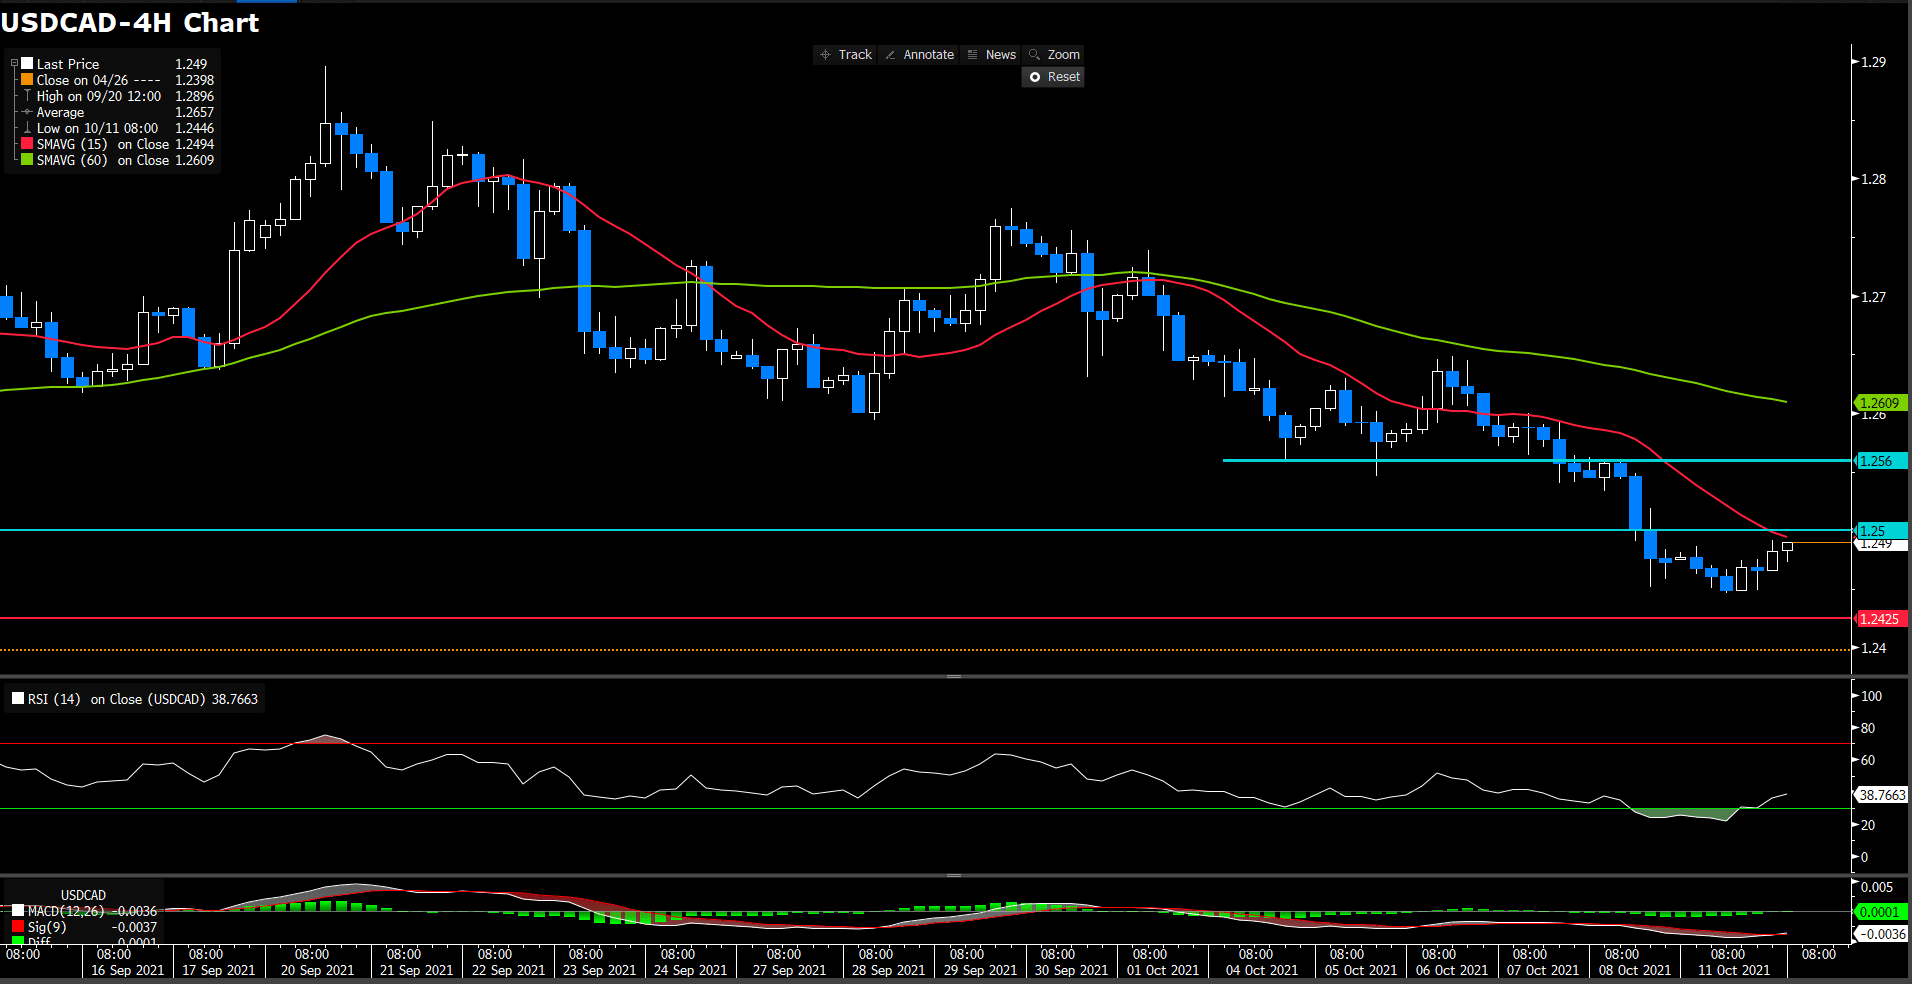
The U.S. dollar is attempting to pick up on Monday after a sharp decline observed in the previous three days. The pair has pull back from two months lows at 1.2445 although, so far, it has remained unable to poise a relevant recovery with the supported by higher oil price. Meantime, U.S. WTI has appreciated for the eight consecutive day, hitting 7 years highs.
From a technical perspective, RSI indicator rebound from over sought territory at 38 as writing, still suggesting bearish momentum in short term. On moving average indicator, 15- and 60-long indicator still retaining downside movement.
Since loonie rapidly break through a critical support at 1.25, we expect next downward support will be last July low at 1.2425. On up side, psychological level at 1.25 will turn into a pivotal resistance for short-term, 1.256 behind.
Resistance: 1.25, 1.256
Support: 1.2425, 1.23
Economic Data
|
Currency |
Data |
Time (GMT + 8) |
Forecast |
||||
|
GBP |
Average Earning Index + Bonus (Aug) |
14:00 |
7% |
||||
|
GBP |
Claimant Count Change (Sep) |
14:00 |
N/A- |
||||
|
EUR |
German Zew Economic Sentiment (Oct) |
17:00 |
24 |
||||
|
USD |
JOLTs Job Openings (Aug) |
22:00 |
10.925 M |
||||