Market Focus

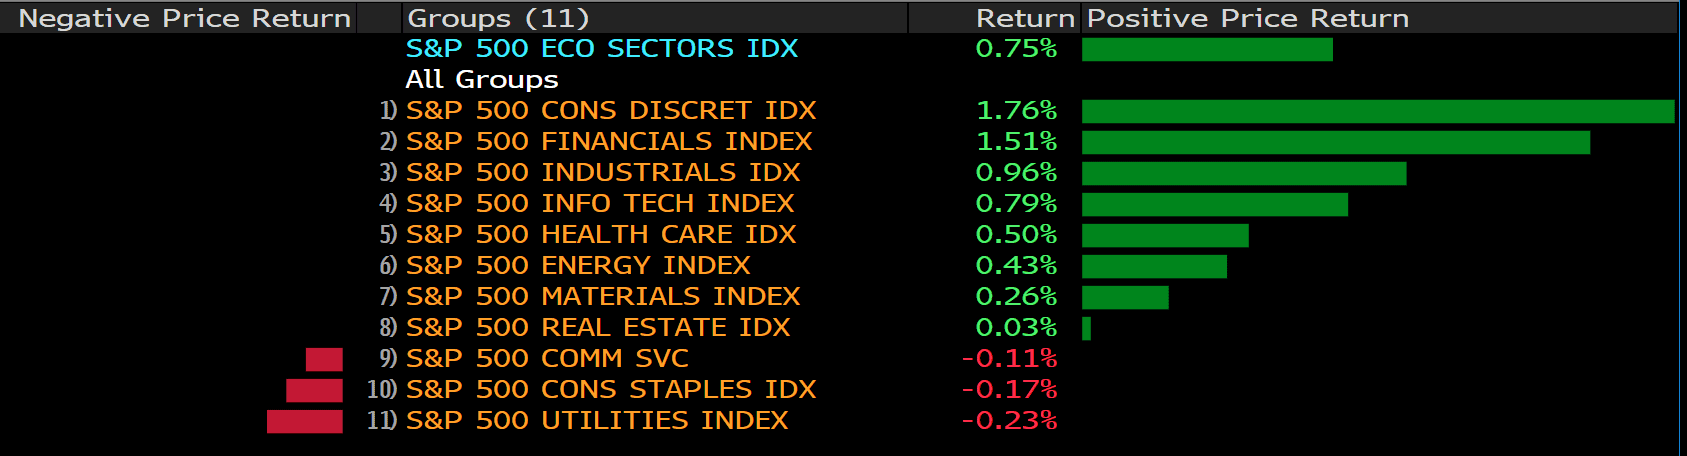
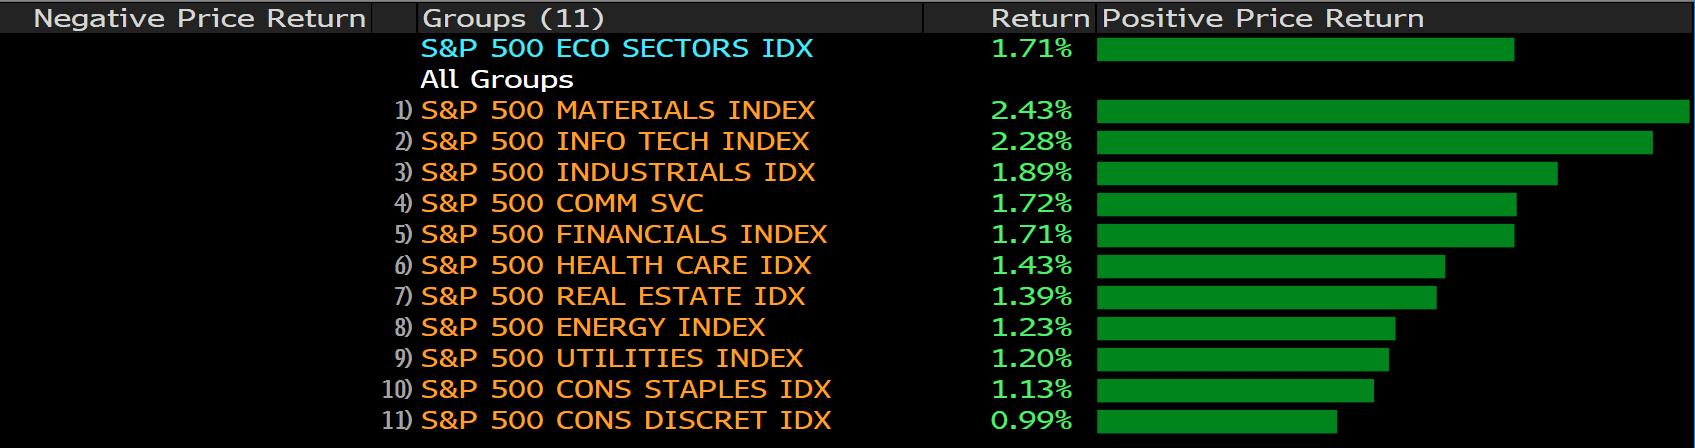
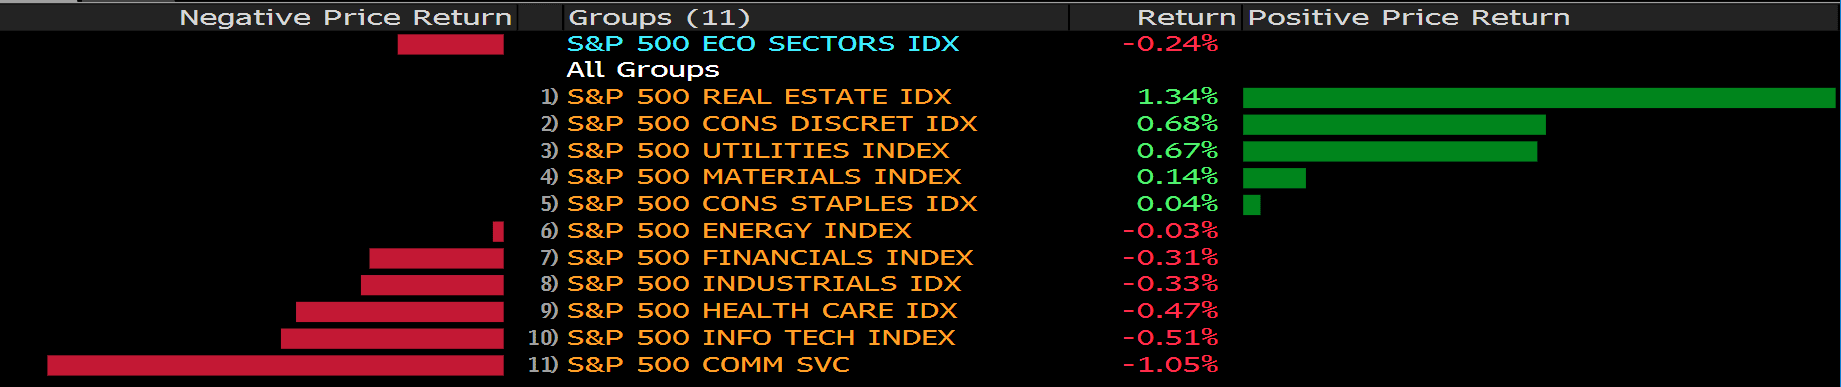
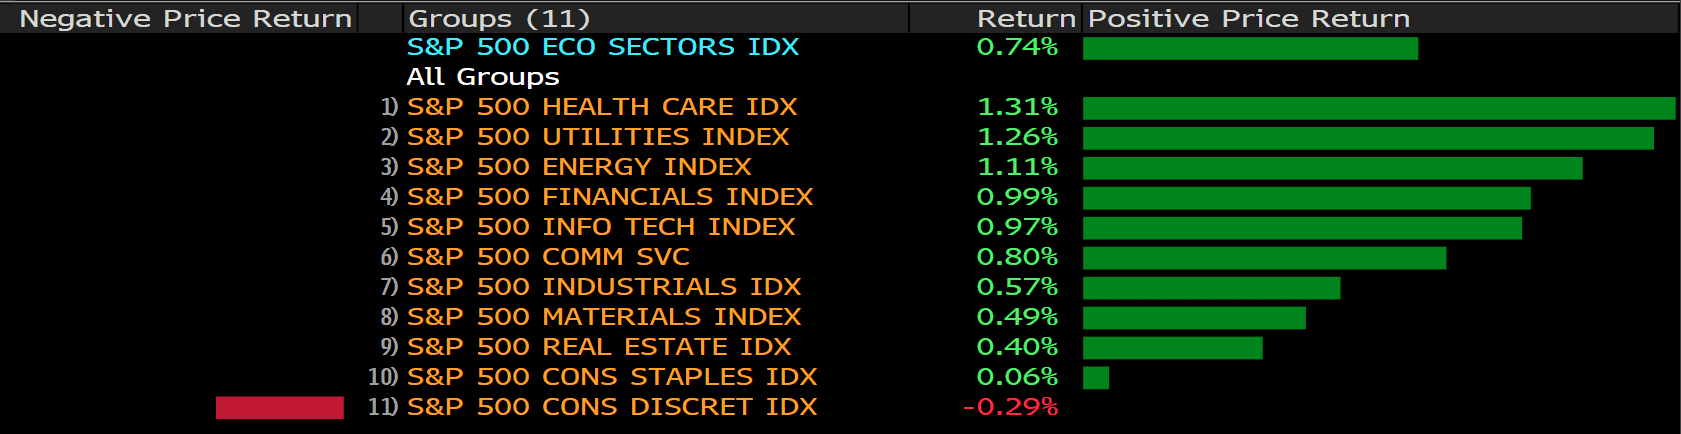
US markets headed to north on Tuesday as major companies continued to report their strong Q3 earnings, easing concerns of persistent pandemic cases and inflations. The Dow Jones Industrial Averages climbed 0.6%; the S&P 500 rose 0.7% whilist the Nasdaq Composite advanced 0.7%. Notably, the S&P 500 is back in the rally mode, sitting less than 1% from its all- time highs, mainly driven by the impact of supply- chain snarls and higher commodity prices.

一張含有 文字 的圖片

自動產生的描述

The world’s largest cryptocurrency, Bitcoin rose back toward record, above $64,000, as first related US ETF debuted on Tuesday. It is the first Bitcoin ETF to trade in the US on a regulated exchange, which comes after many years of the cryptocurrency industry hoping to get one that provides traders to have a safe access to Bitcoin exposure.

The International Monetary Fund has downgraded its 2021 economic outlook for Asia. The outlook is down 1.1%, 6.5% vs. 7.6%, after the highly infectious pandemic cases continues to hurt some regions in Asia. “The global COVID-19 pandemic is still ravaging the region,” said in the report from CNBC.


Main Pairs Movement:

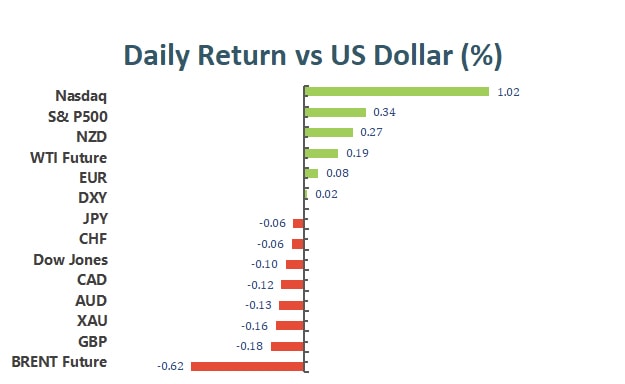
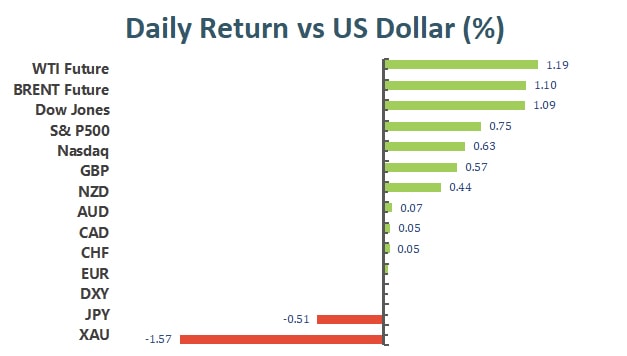
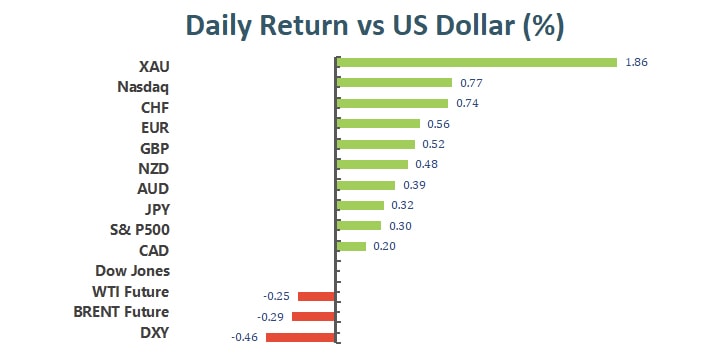
The greenback closed in the red against most of its major rivals on Tuesday, albeit a modest rebound after the Wall Street opening. Macro calendar is boring during the day, making traders to depend on the sentiment for direction. The dollar index dropped nearly 0.23% amid the broader risk-on market mood.

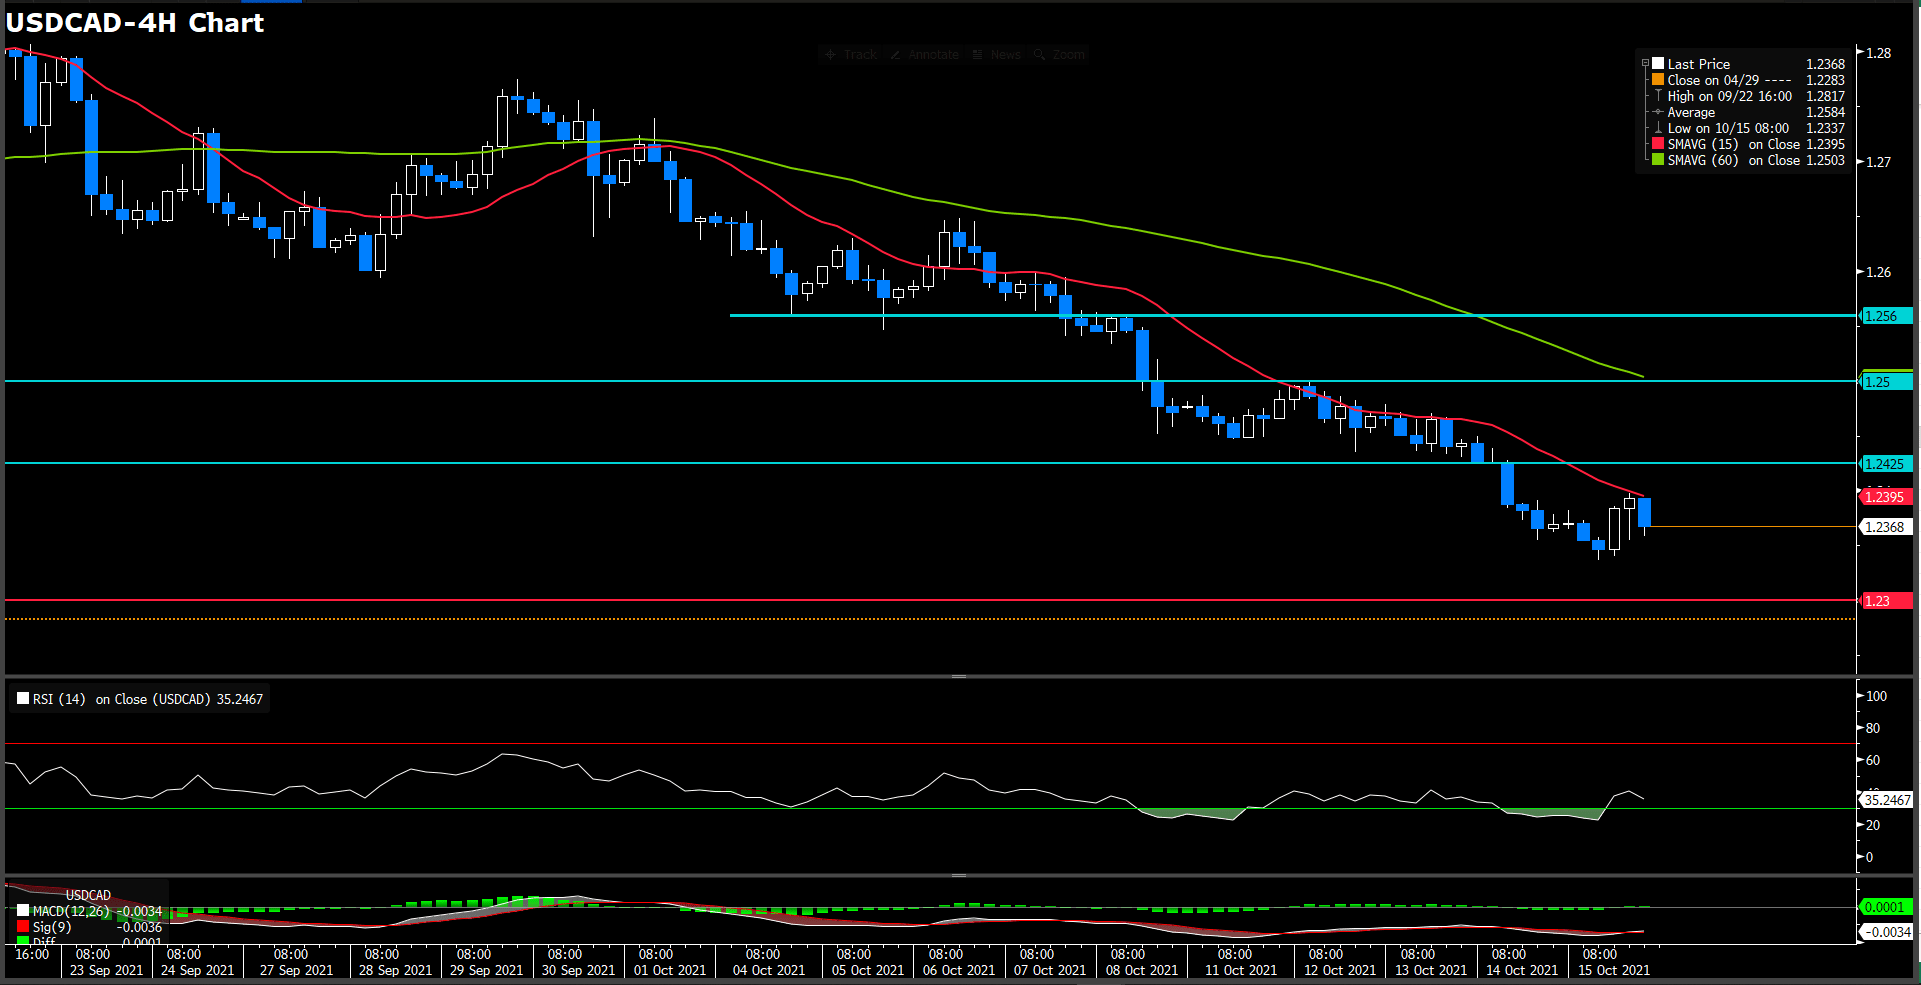
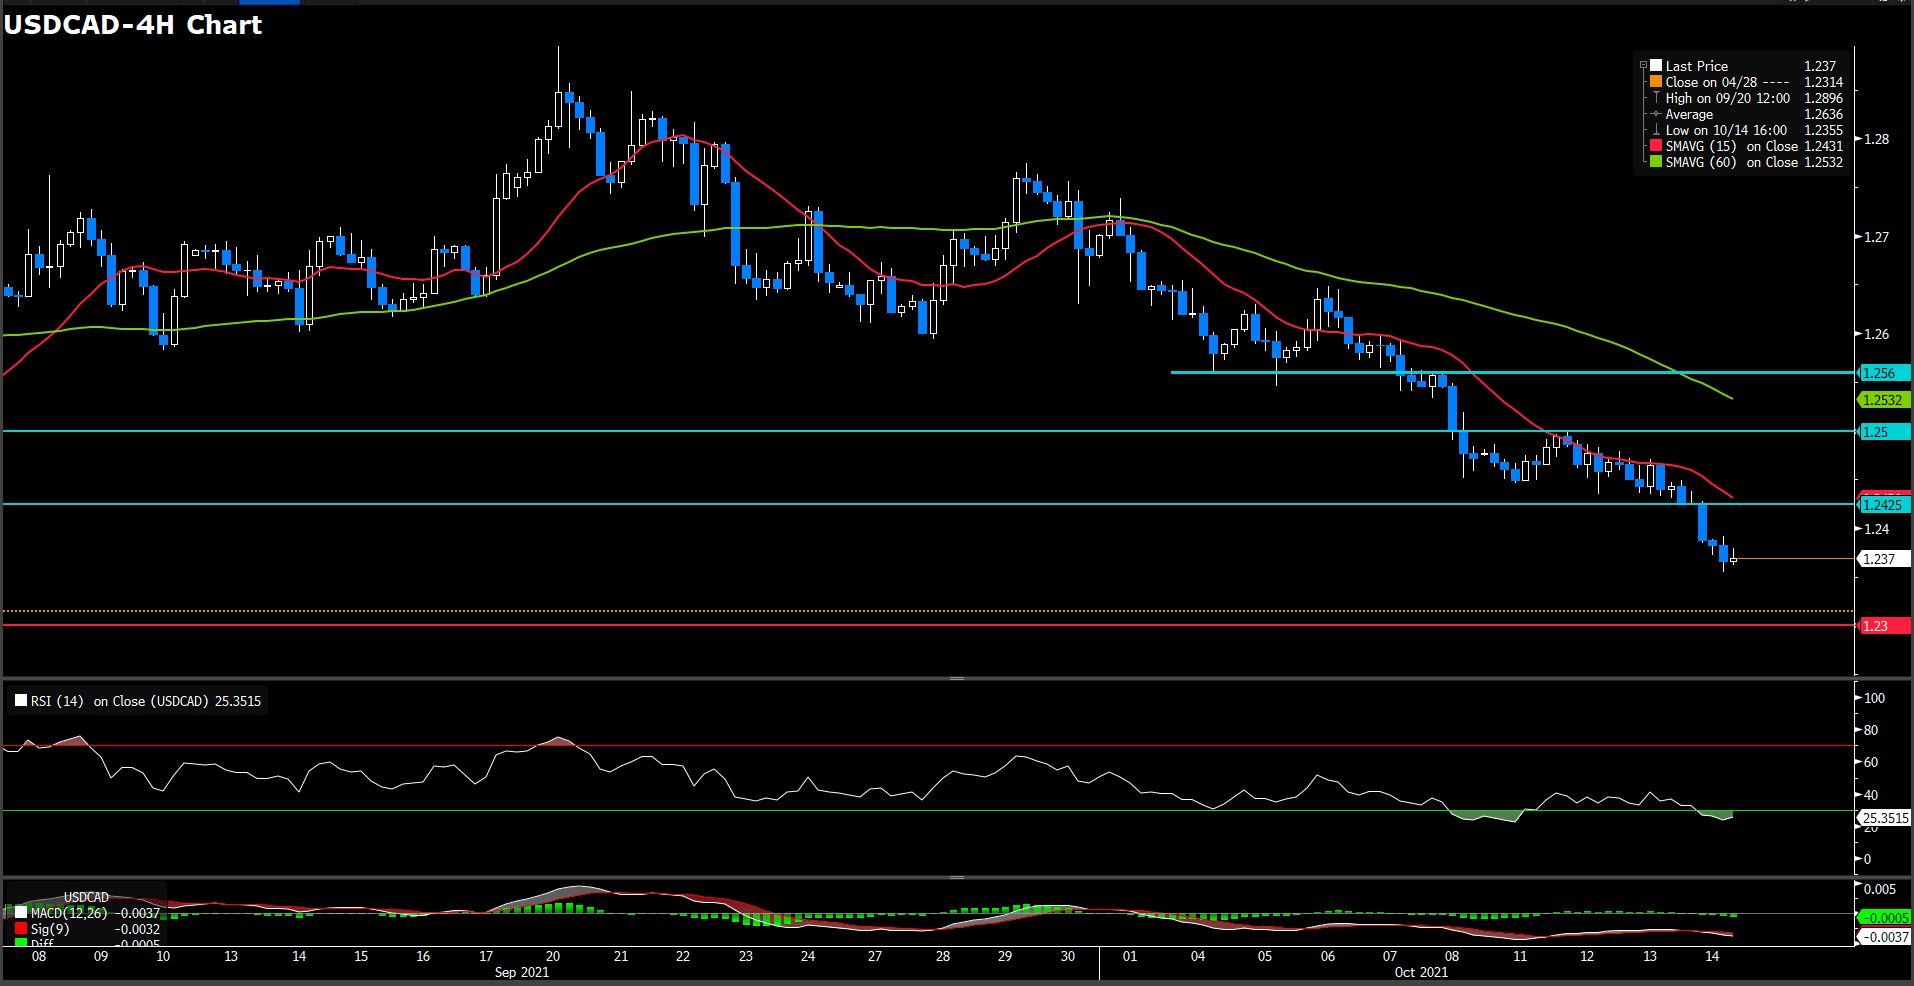
The EUR/USD pair trades around 1.1640, while GBP/USD hovers around the 1.3800 level. The antipodean pairs are the best performers, with AUD/USD surged 80 pips to 0.7475, and NZD/USD soared over 1% to 0.7170. USD/CAD settles around 1.2360, and USD/JPY was last seen at 114.300.

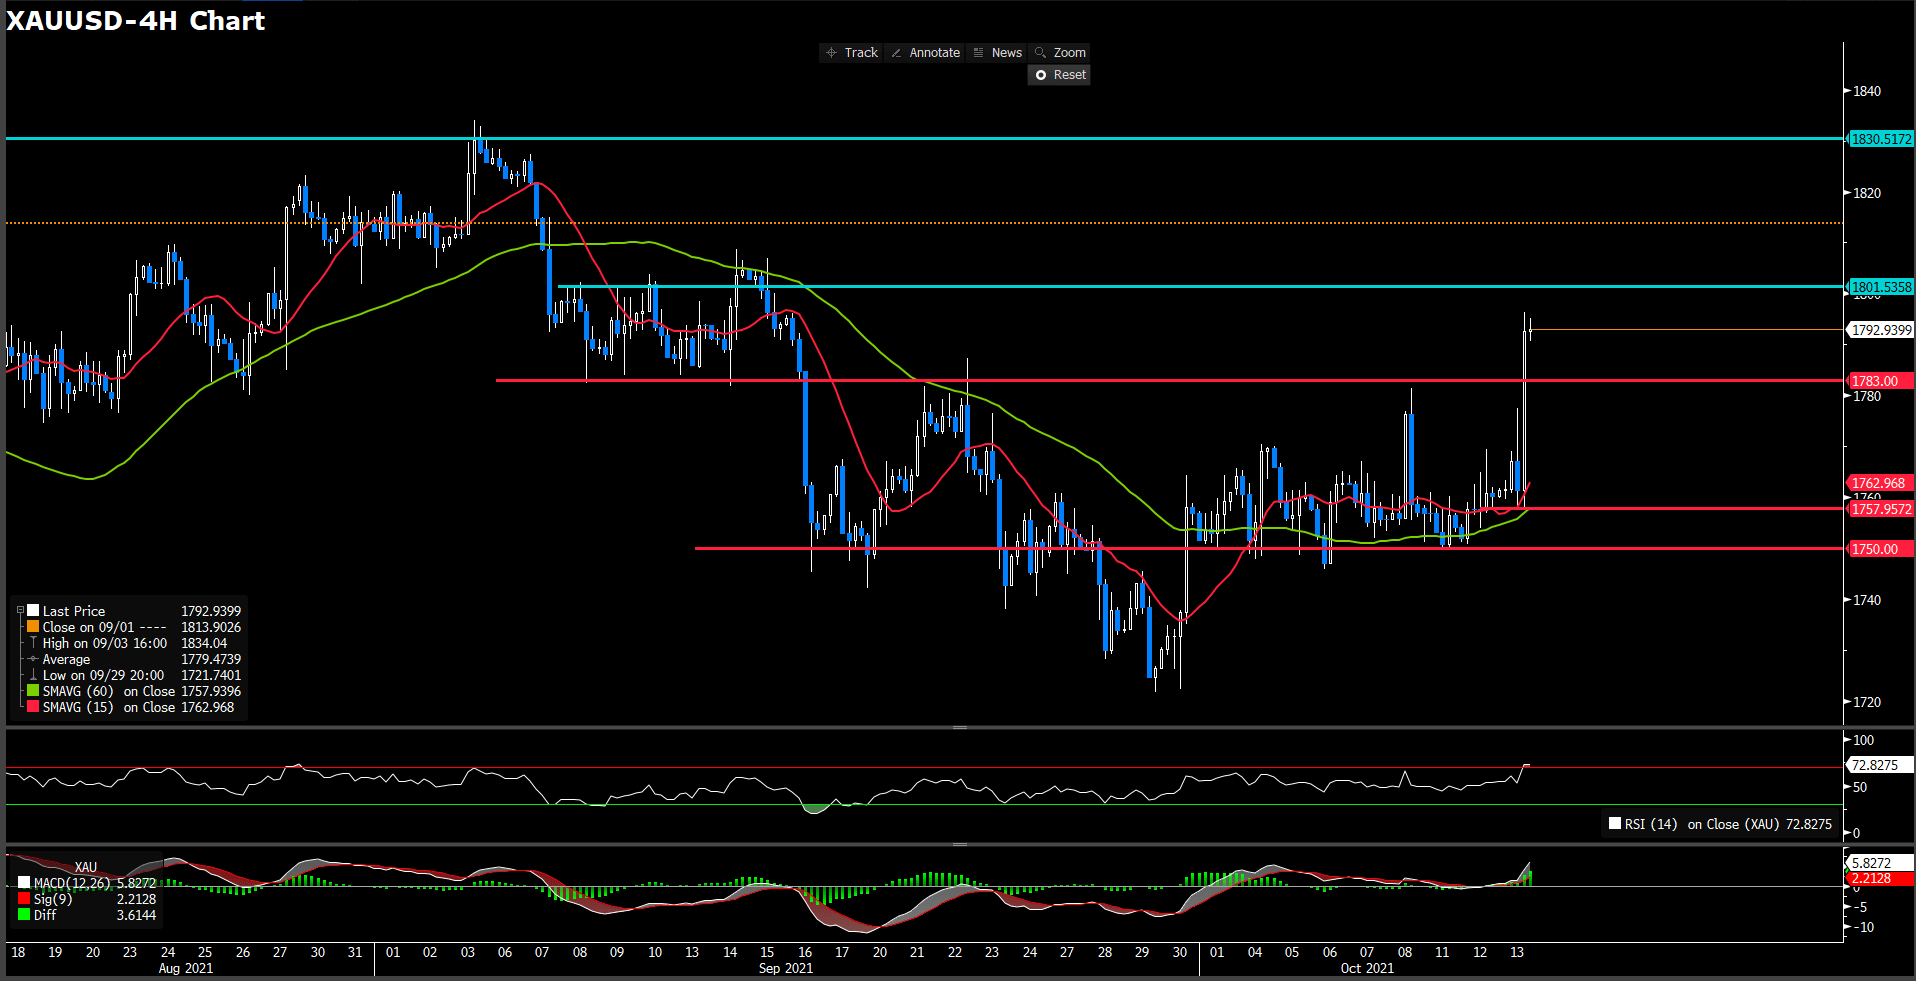
Gold climbed to $1,785 a troy ounce at the European session, but soon fell back after the New York trading hours, ending the day with modest gains at around $1,770.00. Crude oil failed to hit the fresh highs and fell back to the familiar levels. WTI settled at $82.80 a barrel, and Brent at $84.90.

Spotlights are now on the UK inflation data, as the Bank of England has hinted at a possible rate hike as the first move in the case inflation keeps rising above the desired levels.


Technical Analysis:

EURAUD (4-Hour Chart)

The EUR/AUD cross is plummeting during the New York session, losing over 0.6%, and trading at 1.5550 as of writing. Though the Reserve Bank of Australia (RBA) unveiled their unwillingness to raise rates in the near term, investors seemed to have increased the odds of a 2022 interest rate hike, as the Bank of England and other developed economies see their central banks switching towards a normal monetary policy.

Looking forward, the approach of the French Presidential election next year and the tensions regarding the rule of law between the EU and Poland and Hungary may weigh on the EUR, and the AUD may keep benefitting from the rises of the commodities, both of which could extend the pair further south.

On the technical front, the 4-hour RSI is one step ahead of the oversold territory, and the price actions have already breached the bottom of the Bollinger band, suggesting a short-term correction may come before further decline.

Resistance: 1.5616, 1.5719

Support: 1.542, 1.525


EURUSD (4-hour Chart)

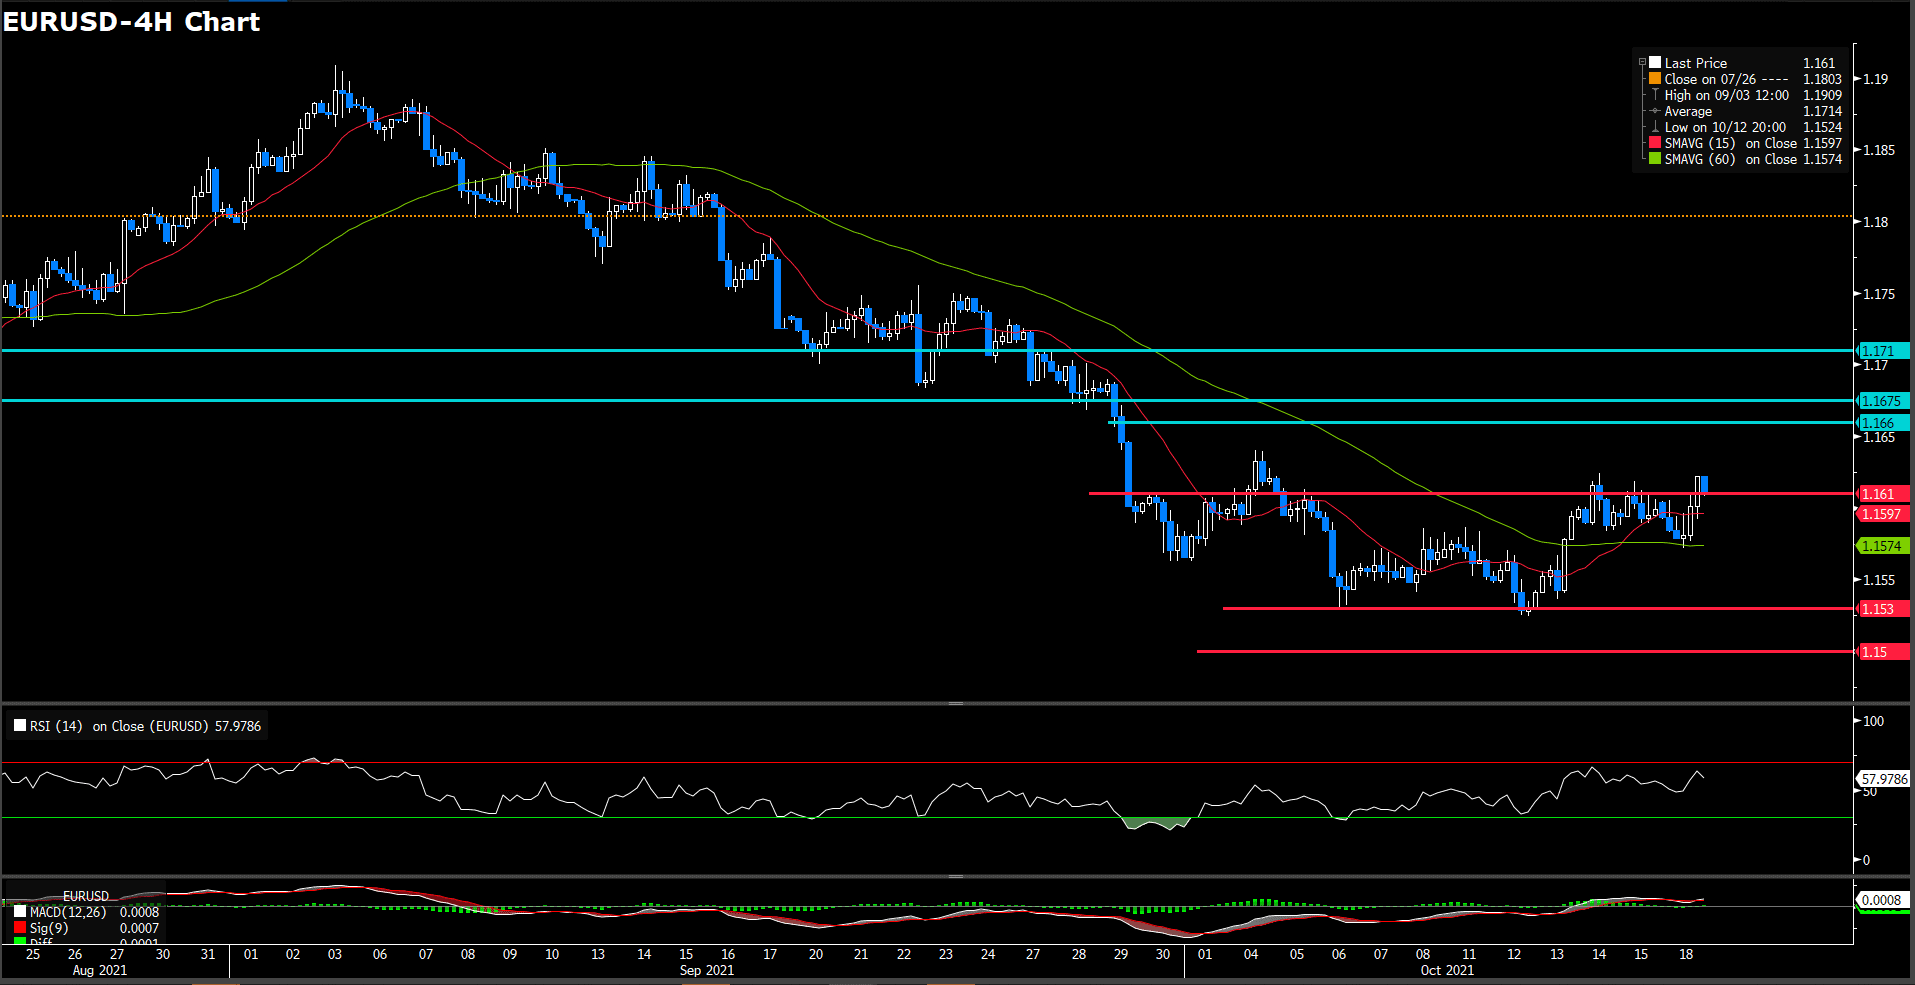
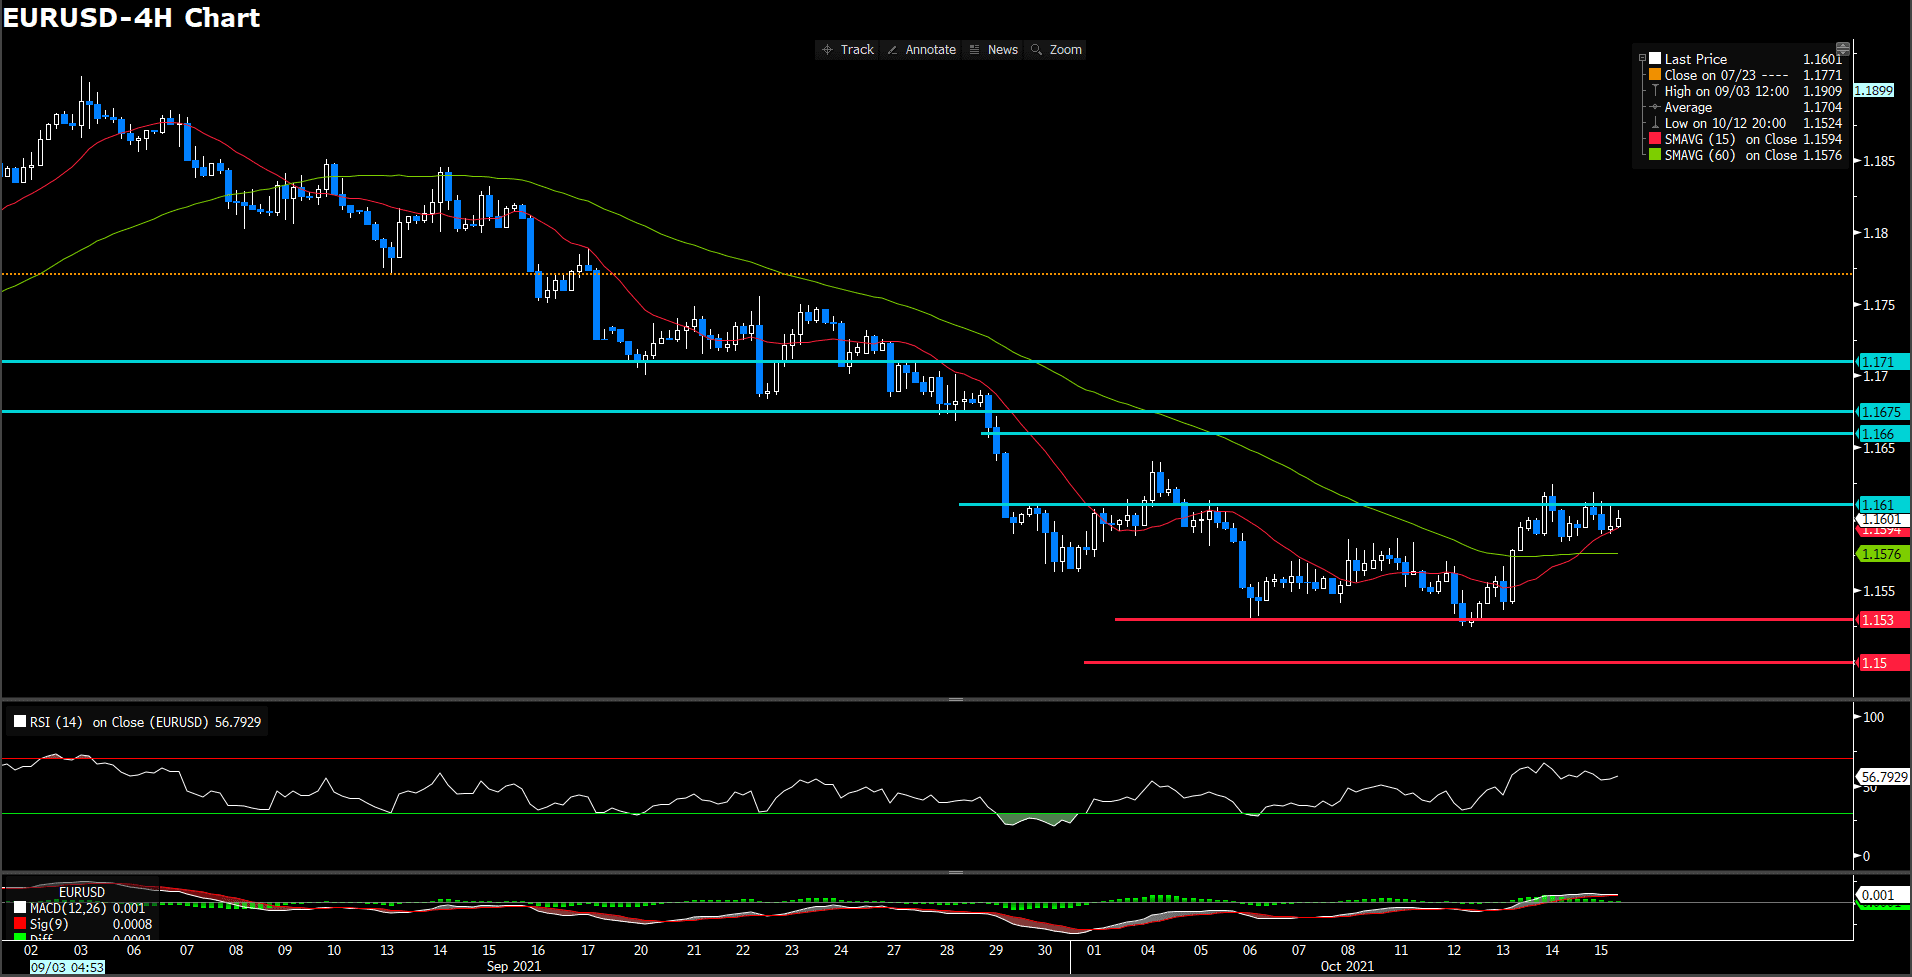
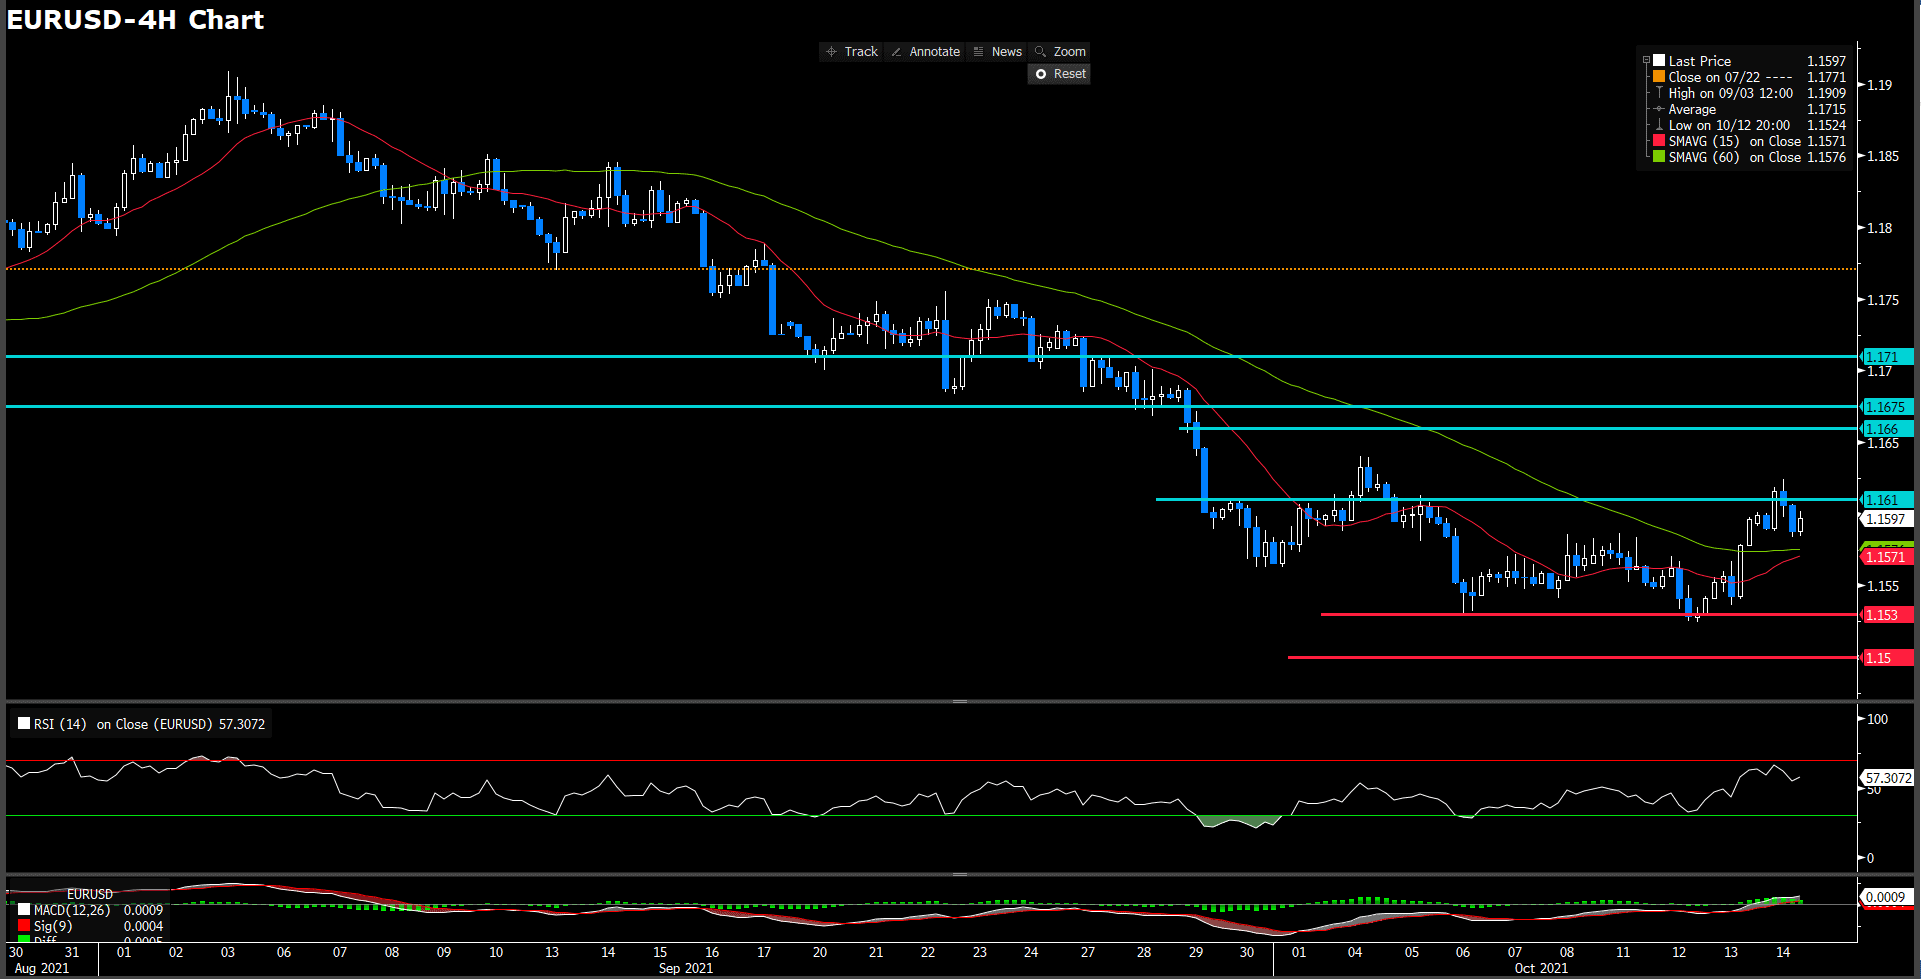
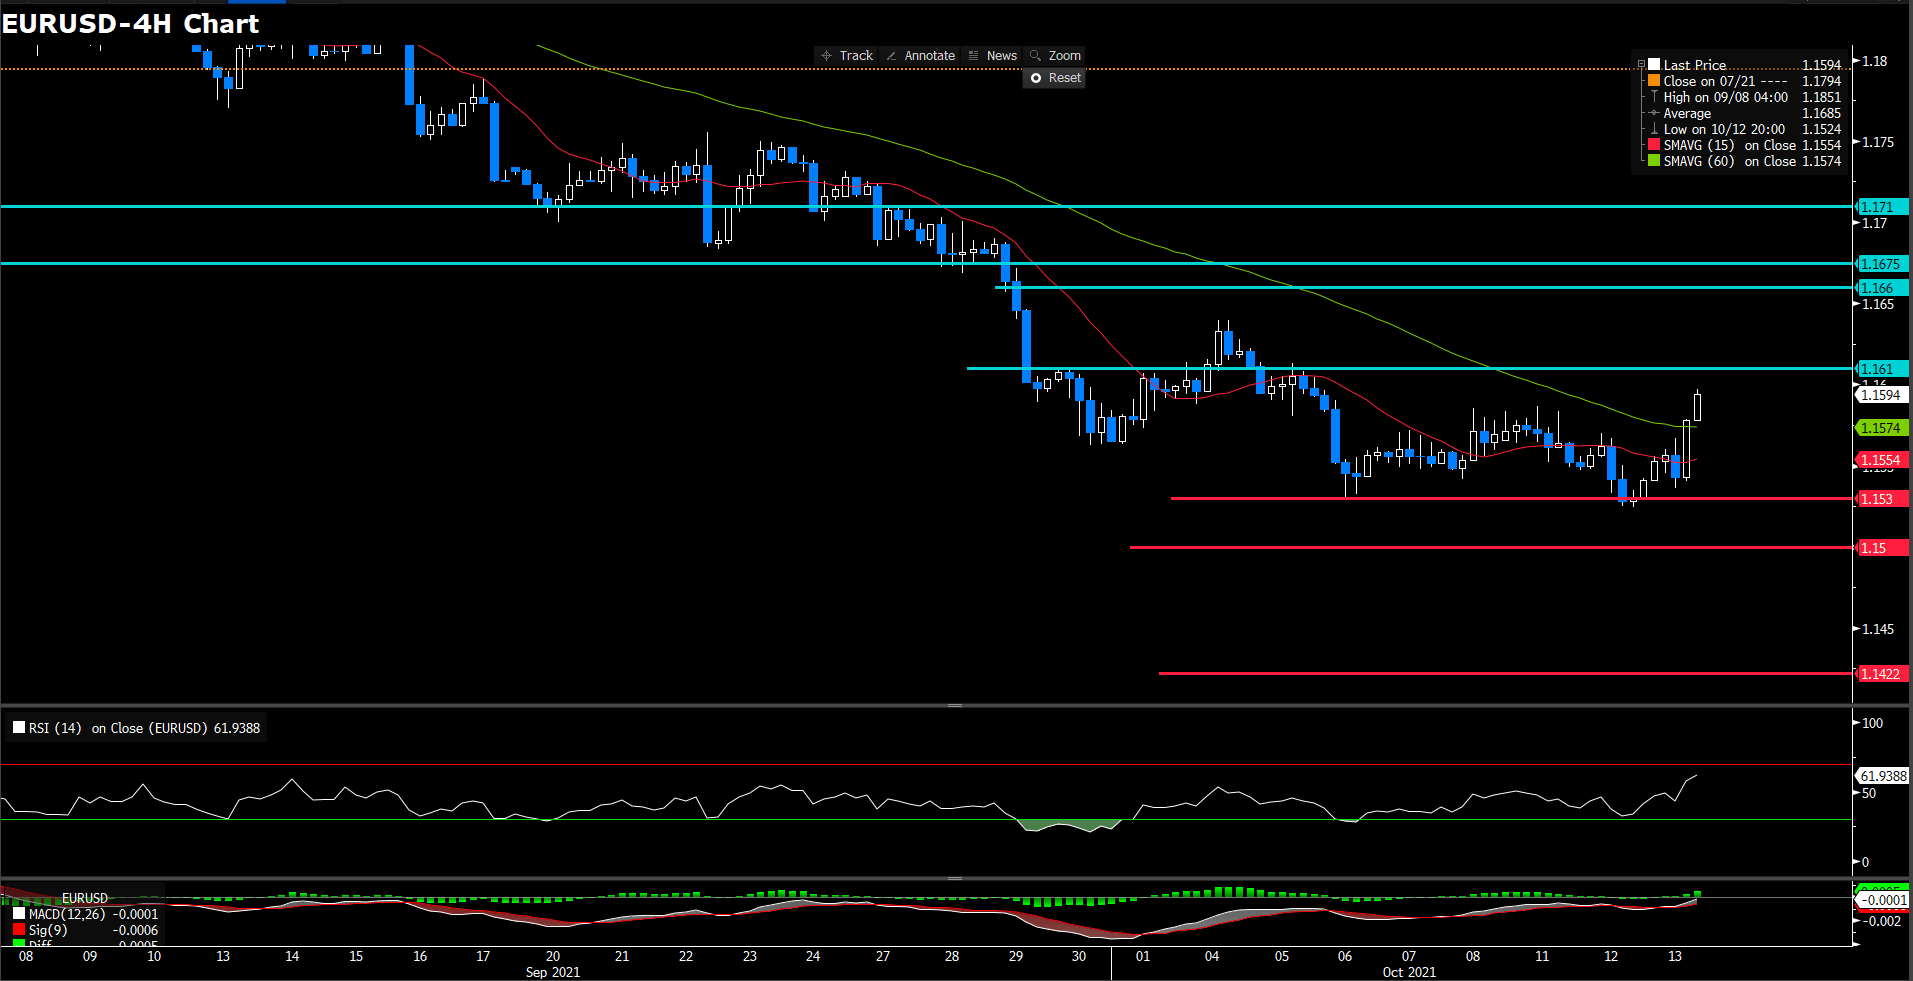
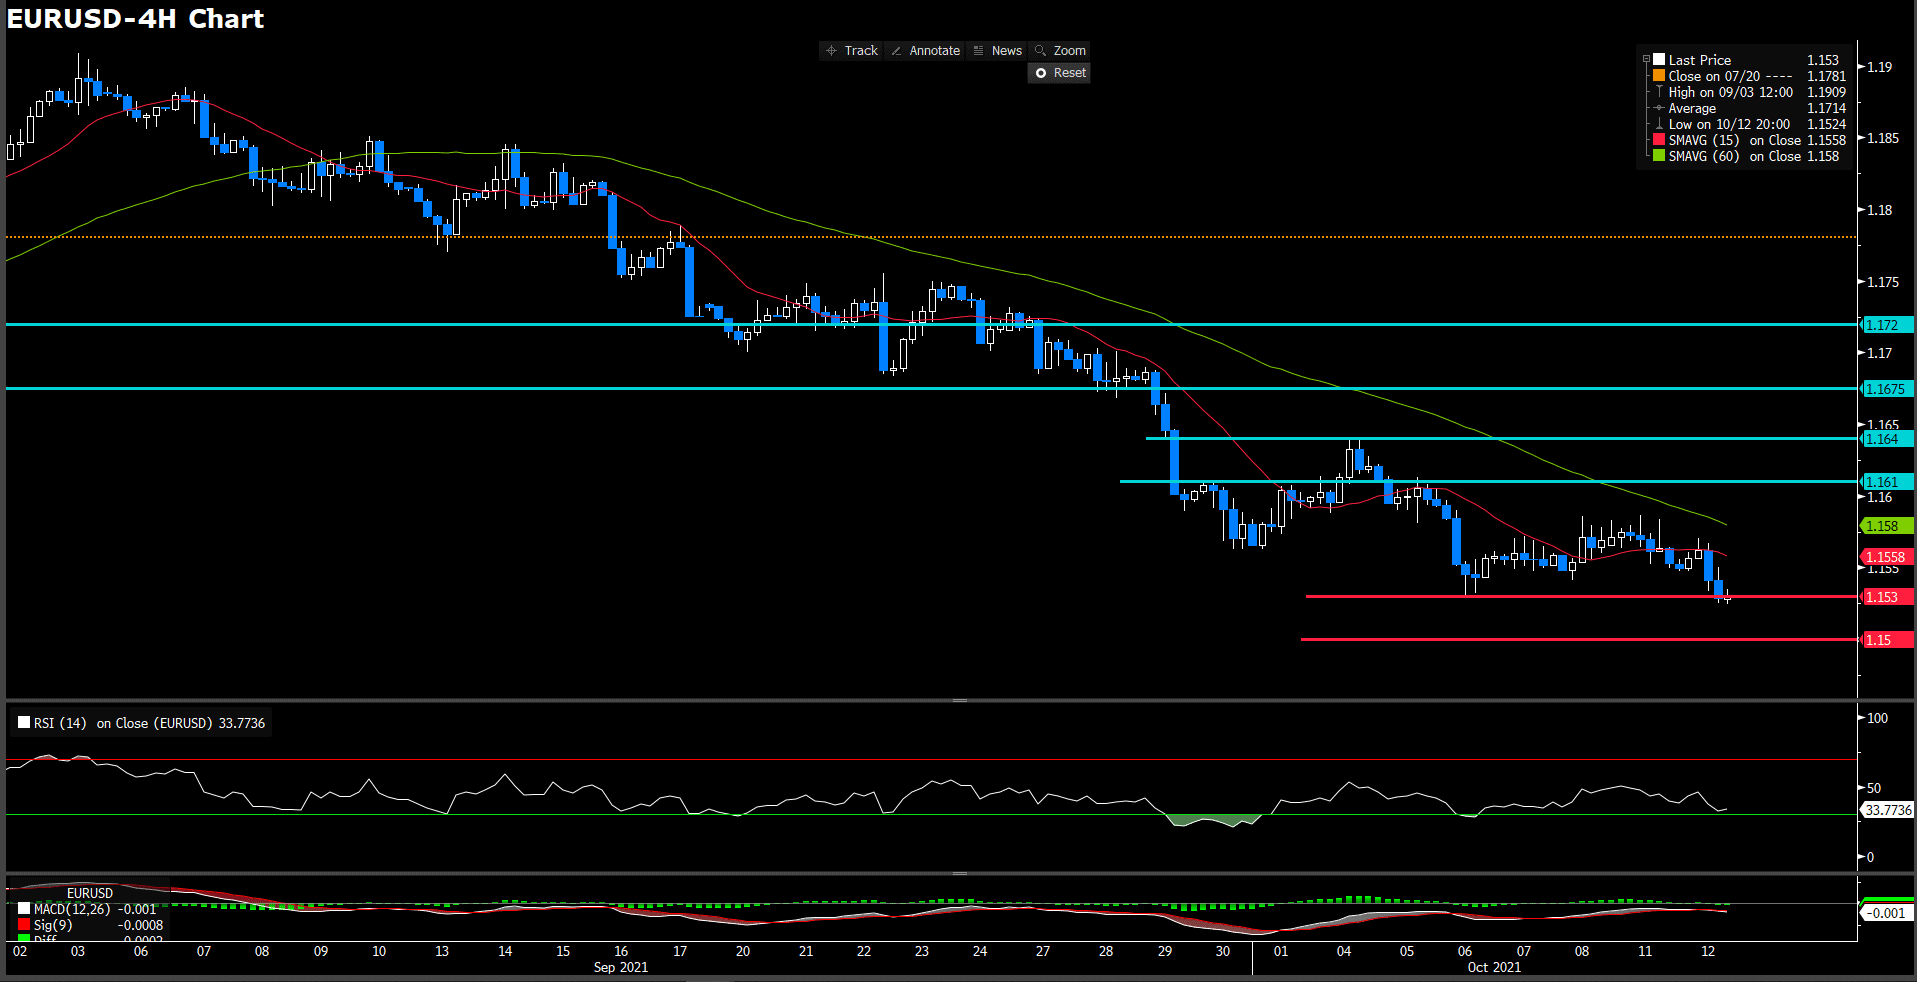
The euro has extended it recovery on Tuesday, fueled by a positive market mood, to reach the upper range of 1.1600 for the first time since late September. The pair has pulled back afterwards, to consolidated well above 1.16, putting some distance from the 15-month low hit last week, at 1.152 area. Meanwhile, euro gains capped by dovish ECB’s Lane. On the macroeconomic front, U.S. building activity has shown a contraction in Sept, demonstrating that shortages in raw materials and labour are starting to squeeze the construction market that may have negative impact on third quarter’s economic growth.

On technical side, the RSI solely moved whereabout 58.7 figures, a slightly changed compare yesterday, suggesting a slightly bullish movement in short term. On moving average aspect, 15- long indicator has expedited it up side traction and 60-long indicator is turning it head to slightly upward momentum.

In lights of current price has penetrated 1.161 level which we expected as a critical resistance for up traction before, it seems could continue the bullish movement if it could hold above the threshold. On up side, we expect the immediately resistance will be psychological level at 1.165 and 1.1675 following

Resistance: 1.165, 1.1675, 1.171

Support: 1.153, 1.15, 1.161


USDJPY (4 Hour Chart)

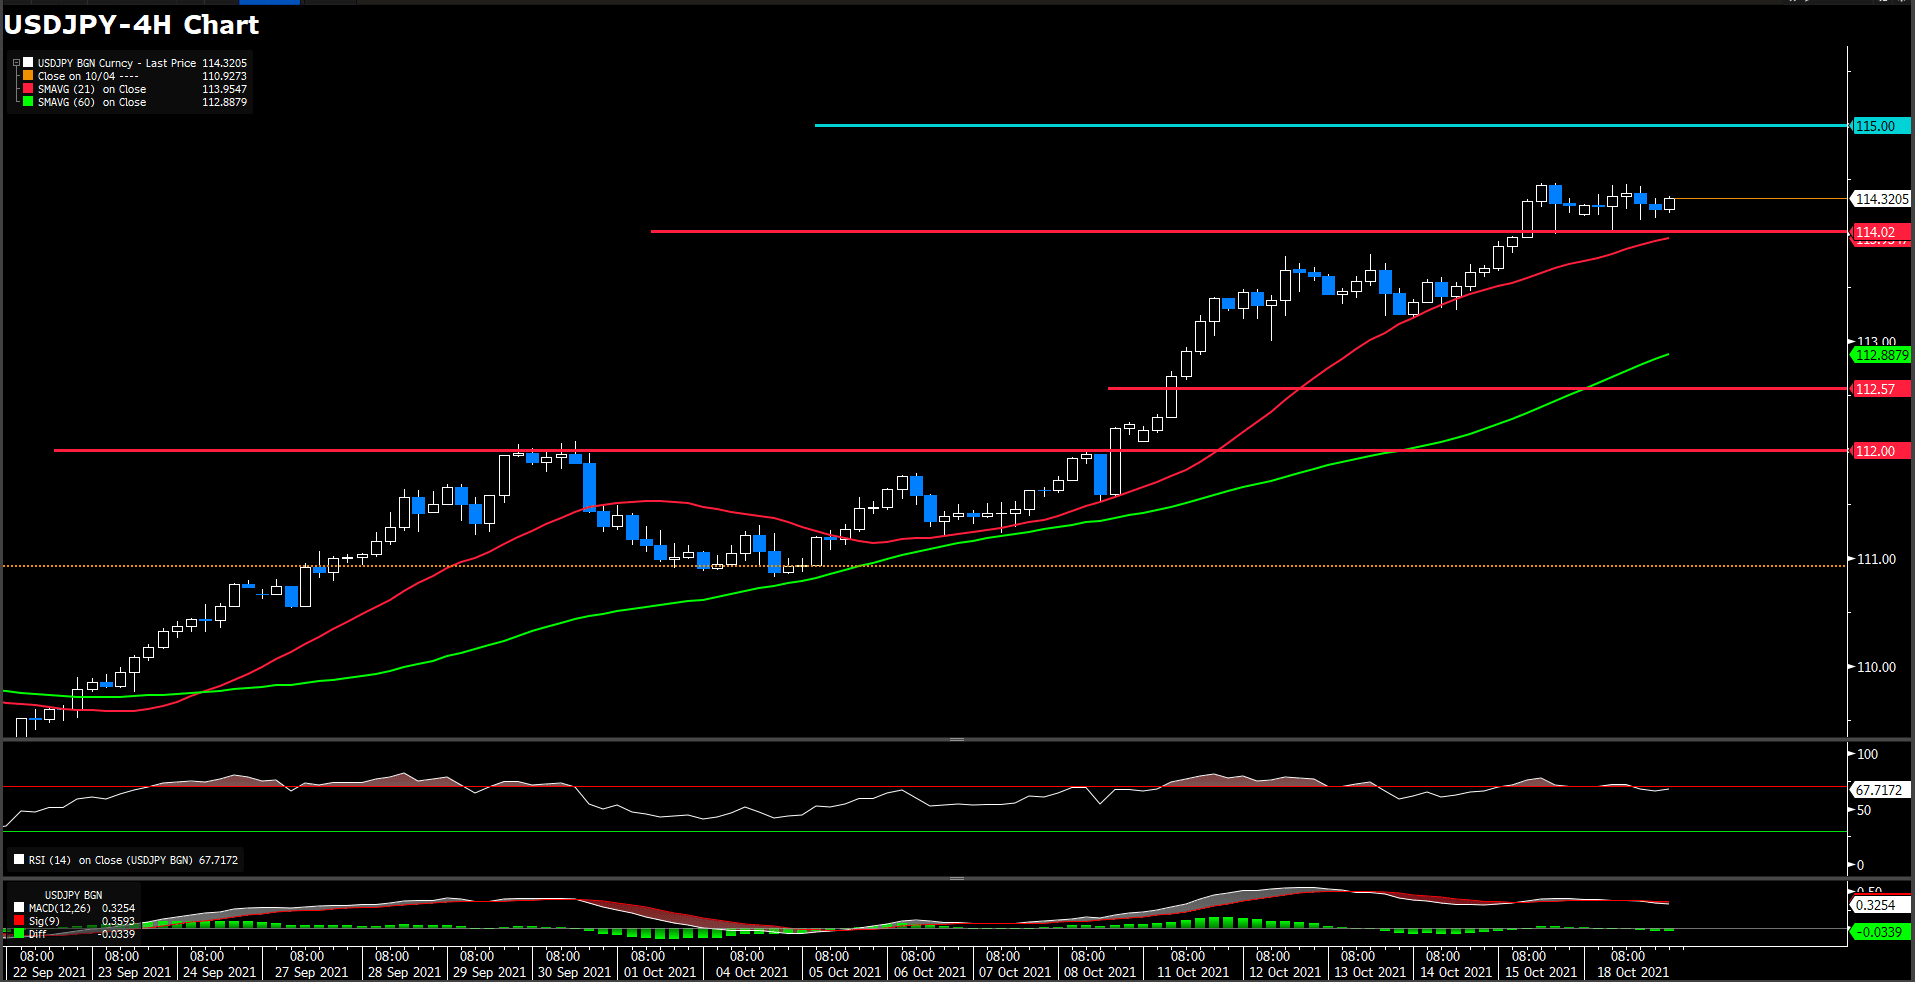
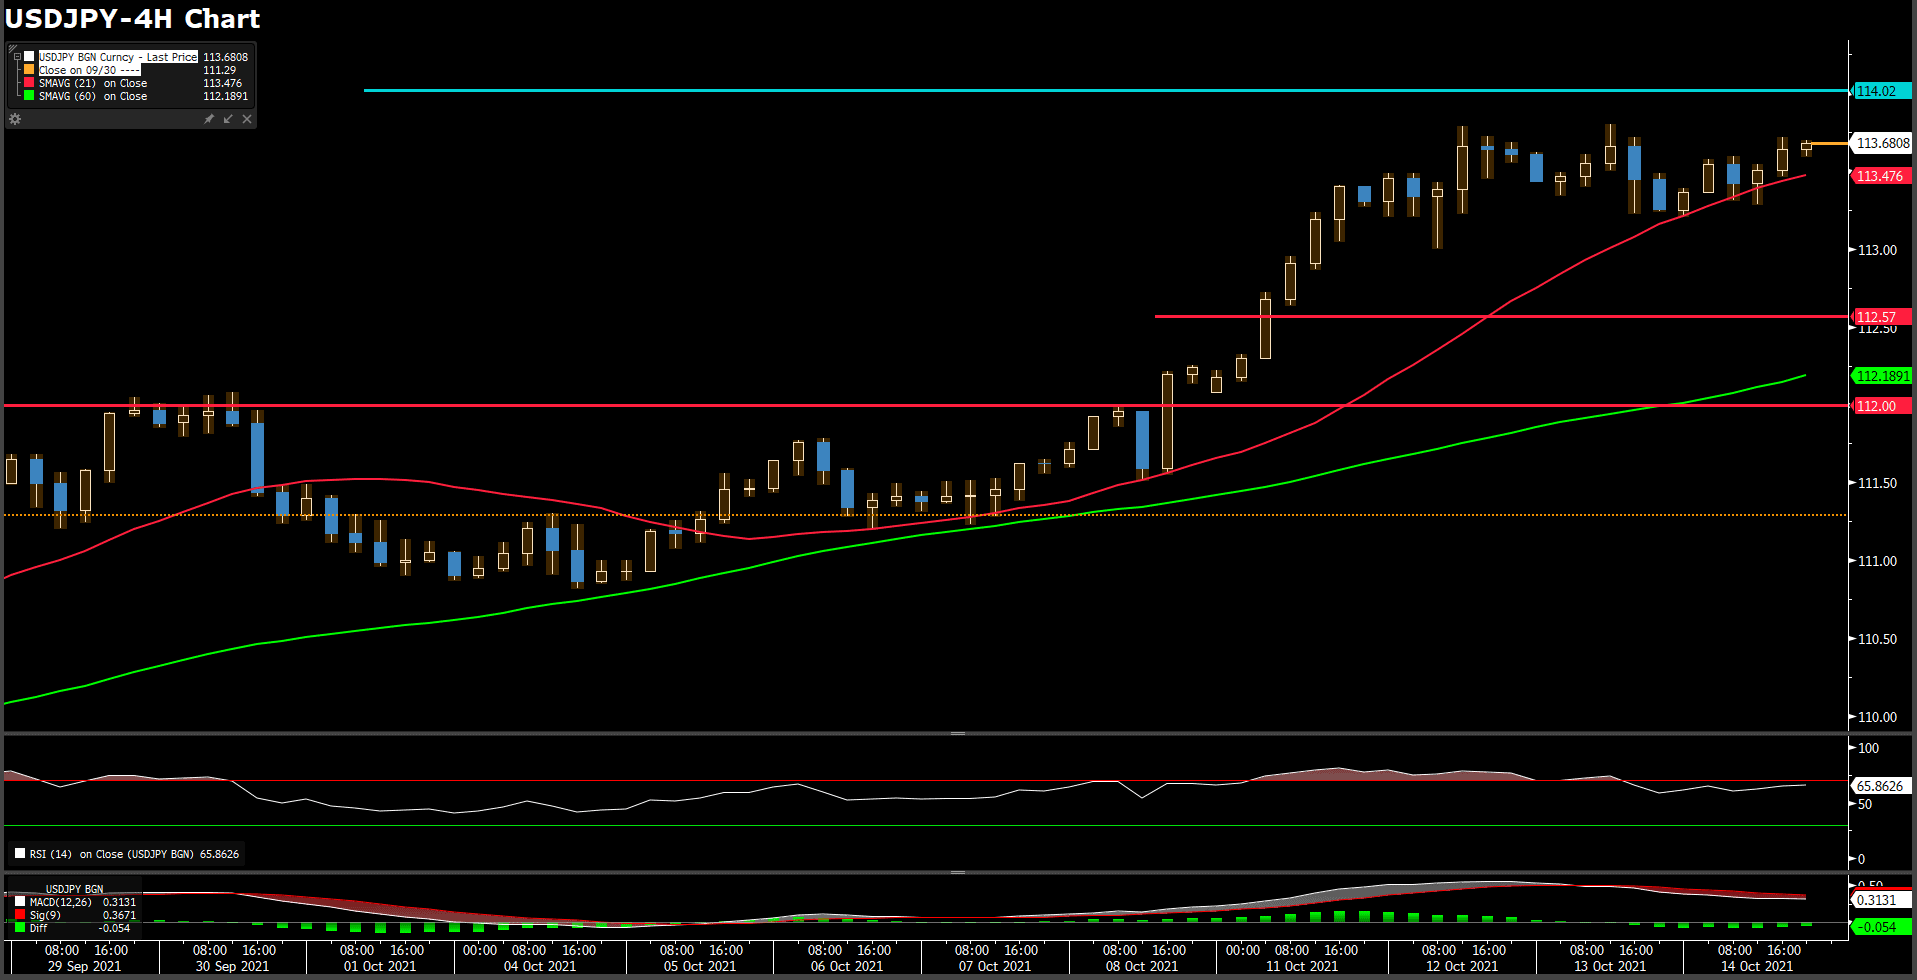
The Japan yen retreated from the three-year high at 114.45 hit on Monday, to session lows at 113.85 before bouncing up and returning to the 114.3 area. The yen’s rebound, however, has been short-lived. The yen particularly sensitive to monetary policy differentials, remains heavy while the market positions for an imminent announcement that the Fed starts to taper its massive stimulus programs. These expectations have been widening the treasury yield gap between the U.S. and Japan whose central bank maintains the 10-year note near zero through a yield control curve which is crushing investor’s appeal for the yen.

From a technical perspective, RSI indicator rebound reversed from over bought sentiment at 62.8, suggesting bullsish momentum in short term. On moving average indicator, 15- and 60-long indicator still retaining upside traction.

Since yen stand above 114 level solidly for days, it seems lost driving momentum or further trigger foundamental news currently. Therefore, 114 level still a important support level for buy side investor.

Resistance: 115

Support: 114.02, 112.57, 112


Economic Data

Currency

Data

Time (GMT + 8)

Forecast

CNY

PBoC Loan Prime Rate

09:30

GBP

CPI (YoY)(Sep)

14:00

EUR

CPI (YoY)(Sep)

17:00

3.4%

CAD

Core CPI (MoM)(Sep)

20:30

OIL

Crude Oil Inventories

22:30

1.857 M

VT Markets Modification of Margin Request on Oil contracts

Dear Clients,

After VT Markets’s sustained attention, we find that the International financial market is generally recovering. What’s more, the demands for Oil contracts are increasing as well.

To provide our clients with the most competitive trading environment, VT Markets is glad to announce that the margin request for the following products, including USOUSD, UKOUSD, and CL-OIL, will be reduced at 00:00 on Oct 25th, 2021 (GMT+3).

After the modification, the margin request for trading the Oil contracts will be reduced to two-thirds of its current amount. The leverage of Oil contracts will also be raised and fixed at 333:1 instead of floating between 50:1 and 250:1.

For instance, if the original margin request for keeping one lot Oil contract is 330 USD, the needed margin request for this position will be reduced to 250 USD after the modification, and so on. The table below is for reference.

Notes: The figures above are only for reference. The actual execution data should be subject to the numbers on MT4/MT5.

Friendly reminders:
1. All contract specifications of Oil stay the same except the margin percentage being changed from 200% to 0.3%.
2. The margin level will correspondingly increase while the margin request of Oil positions is modified as two-thirds of its original amount.

There will be more available funds in trading accounts after this modification.
Please assure that there are sufficient funds in trading accounts for holding positions.

If you’d like more information, please don’t hesitate to contact [email protected].

Market Focus

US stocks were mixed amid inflation concerns on Monday; investors bet on a continuation of strong earning reports from major companies while concerned the prospect of a tightening monetary policy to restrain inflation. The Dow Jones Industrial Average declined 0.1% while the S&P 500 climbed 0.3%; at the same time, the Nasdaq rose 0.8% at the end of day.

一張含有 文字 的圖片

自動產生的描述

The collapsing spread between 5- year and 30-year yields is raising the concern of a potential slowdown in economic growth. The shrank might be due to the consideration of the US Federal Reserve may lift the rates sooner than the expectation. Moreover, according to Bloomberg, the US inflation expectations are continuously rising to their peaks in nearly years.

Bitcoin held steadily above $60,000 as the first Bitcoin future ETF is going to launch this Tuesday, which is essentially a milestone for the cryptocurrency industry.


Main Pairs Movement:

The greenback shed some ground on Monday, although it ended the day mixed across the FX board and within familiar levels. A light macroeconomic calendar keeps investors depending on the sentiment for direction, the latter following US government bond yields. Speaking of which, the yield on the 10-year US Treasury note peaked at 1.627% but finished the day at around 1.58%.

The dollar edged lower against most of its major rivals. The EUR/USD pair trades around 1.1610, while GBP/USD stands at 1.3730. The AUD/USD pair and USD/JPY finished the day unchanged while USD/CAD ticked lower, despite weakening crude oil prices.

Gold ended the day with modest losses at around $1,764.60 a troy ounce. rude oil prices hit fresh multi-year highs before retreating. WTI settled at $81.50 a barrel.

Attention shifts now to the UK inflation data, as the Bank of England has hinted at a possible rate hike as the first move in the case inflation keeps rising above the desired levels.


Technical Analysis:

USDCAD (4-Hour Chart)

The USD/CAD pair continued consolidating through the first half of the European session and once stepped on the 1.2400 level, but soon fell over 30 pips after the American opening. Loonie’s weakness results from the higher inflationary pressures and the looming tapering of major central banks. The pair was last seen at 1.2375.

However, falling crude oil prices, along with the robust US bond yields, may weign on the appreciating CAD . WTI has been losing over 0.5%, currently trading at $81.90; the benchmark 10-year U.S. Treasury yield still lingers above 1.55, proving demands for the greenback.

On the technical front, loonie has already been lost track of its 4-month-old uptrend at the start of October and fallen below all of its key moving averages. The downward traction is now attacking the robust 38.2% Fibonacci support. If breached, then there will be no practical support ahead of the 23.6% Fibonacci. On the flip side, to resume its previous uptrend, the pair should revisit the key 200-DMA, which should first regain the 50% and 61.8% Fibonacci.

Resistance: 1.2425, 1.25, 1.256

Support: 1.23


EURUSD (4-hour Chart)

The euro advances during the New York session, up 0.07%, trading at 1.161 at the time of writing. During the session, market sentiment conditions improved despite a weaker than expected third-quarter GDP print out of China, rising inflationary pressures, and central bank tightening monetary conditions expectations. On last Saturday, October 16 ECB’s President Lagarde said that the ECB is paying very close attention to wafe negotiations and other effects that could permanently drive prices higher, she added that inflation is largely transitory.

On technical side, the RSI solely moved whereabout 57.97 figures, a slightly changed compare yesterday, suggesting a slightly bullish movement in short term. On moving average aspect, 15- and 60-long indicator are both moving flatly while they have been golden cross in earlier days.

In lights of current price has penetrated 1.161 level which we expected as a critical resistance for up traction before, it seems could continue the bullish movement if it could hold above the threshold. On up side, we expect the immediately resistance will be psychological level at 1.165 and 1.1675 following

Resistance: 1.165, 1.1675, 1.171

Support: 1.153, 1.15, 1.161


USDJPY (4 Hour Chart)

The Japan yen barely moved advances during the U.S. session, up some 0.02%, trading at 114.22 at the time of writing. Despite slower than expected economic growth in China, expectations of higher inflation and market mood is in risk-on mode. The U.S. 10-year Treasury yield is flat at press time, clings to 1.581%, whereas the U.S dollar index, which tracks the greenback’s performance against a basket of rivals, slides 0.02%, sitting at 93.943. Meanwhile, the yen is close to four-year lows versus the greenback, as higher U.S. T-bond yields which have been rising lately, have a strong positive correlation with the pair.

From a technical perspective, RSI indicator rebound reversed from over bought sentiment at 67.7, suggesting bullish momentum in short term. On moving average indicator, 15- and 60-long indicator still retaining upside traction.

Since yen stand above 114 level solidly for days, it seems lost driving momentum or further trigger foundamental news currently. Therefore, 114 level still a important support level for buy side investor.

Resistance: 115

Support: 114.02, 112.57, 112


Economic Data

Currency

Data

Time (GMT + 8)

Forecast

AUD

RBA Meeting Minutes

09:30

GBP

BoE Gov Bailey Speaks

20:05

USD

Building Permits (MoM)(Sep)

20:30

1.680 M

Market Focus

The broad U.S. equity market enjoyed another positive day on Friday to close out the week with positive gains. Strong 3rd quarter earnings and healthy consumer spending propelled stocks higher on Friday. The S&P 500 gained 0.7% to close at 4471.37, the Dow advanced 1.1% to 35294.76, and the Nasdaq gained 0.5% to close at 14897.34.

The financial sector reported healthy earnings for the third quarter. Goldman Sachs Group reported earnings of $5.38 billion for the third quarter, a 60% year over year gain; meanwhile, Morgan Stanley reported a 36%, year over year, earnings gain.

一張含有 文字 的圖片

自動產生的描述

Retail sales for September increased 0.7%, beating estimates. Rising retail sales figures could ease some investors’ concerns over a slowing economy and inflation.

The U.S. 10 year treasury yield rose again on Friday, and the benchmark is currently sitting at 1.574%. Oil prices leaped further on Friday as demand for oil picks up as global governments begin to ease pandemic era travel restrictions. The U.S. will lift COVID-19 travel restrivtions for fully vaccinated foreigners effective Novemeber 8th. The Brent Crude future gained 1% to settle at $84.86 a barrel, and the WTI future gained 1.2% to settle at $82.28 a barrel.


Main Pairs Movement:

The impact of the surging US Treasury yields on the greenback was offset by the broader risk-on market sentiments, left the dollar index trading sideways on Friday. With the benchmark 10-year US Treasury bond yield holding above critical 1.5% handle, the dollar stays resilient in the early European session on Friday, but at the second half of the day, though the upbeat September Retail Sales report boosted the dollar a bit, the following Michigan Consumer Sentiment Index data.was underperformed and dragged the dollar index down the 94.00 threshold.

The EUR/USD pair is treading water on both sides of the 1.1600 level, unable to take advantage of a weaker US dollar. The sterling is the best performer among its main peers. Cable has rallied on Friday to break above 1.3750, reaching 1.3775 for the first time since mid-September. On the flip side, JPY is the worst. The USD/JPY pair surged over 0.5% during the day, now trading at 114.30. Commodity-linked currencies hovers around the familiar levels. Loonie settles at 1.2380 at the moment, and Aussie was last seen at 0.7418.

Gold lost most of its Thursday’s gains and retreated to $1767.61 a troy ounce. Crude oil prices extend further north to fresh highs. WTI trades at $82.10 as of writing, and Brent once breached $85.00 price level during the early European session, now settles around $84.70.


Technical Analysis:

GBPJPY (4-Hour Chart)

The GBP/JPY cross continued scaling higher through the first half of the European session and once surged to the highest level since June 2016. Bulls are now looking to build on the momentum further beyond the 157.00 round-figure mark.

The momentum took along some short-term trading stops placed near the previous yearly tops, around the 156.00 mark. This seemed to have prompted aggressive short-covering and further contributed to the strong bid surrounding the GBP/JPY cross. With the latest leg up, the cross has now rallied nearly 800 pips from monthly swing lows, around the 149.20 area.

Meanwhile, technical indicators on short-term charts are already flashing overbought conditions and warrant some caution for bullish traders. Hence, it will now be interesting to see if the GBP/JPY cross continues with its positive move or bulls opt to take some profits off the table heading into the weekend.

Resistance: 160.00, 163.90(July 2016 top)

Support: 156.08, 153.50, 149.22


EURUSD (4-hour Chart)

The euro keeps treading water on both sides of the 1.16 level, unable to take advantage of a weaker U.S. dollar. The common currency bounced up from year-to-date lows at 1.152 earlier this week but is missing follow through to post a significant recovery and remains hesitating between 1.158 and 1.162 for the second day in a row. The U.S. Treasury yields rally, another source of strength for the U.S. dollar, has lost steam this week.

On technical side, the RSI index floating a flat movement in day market and sitting at 57 figures, suggesting a slightly bullish movement in short term. On moving average aspect, 15-long indicator has turned it slope to positive way and 60-long became a flat movement after day market, moreover, two moving average indicator has golden cross in the day market.

In lights of two critical technical indicator are giving the euro fiber a positive signal. One thing left, the most important obstacle for the upside traction is 1.16 threshold. If it could penetrate 1.16 soild, then expect will heading to higher stage.

Resistance: 1.161, 1.166, 1.1675, 1.171

Support: 1.153, 1.15


USDCAD (4 Hour Chart)

Loonie is advancing during the New York session, up 0.19%, trading at 1.2393 at the time of writing. An upbeat market sentiment sorrounds the market portrayed by U.S. equity indexes rising between 0.17% and 0.92%. WTI, the U.S. benchmark for crude oil, which significantly influences the Canadian dollar, is rising 0.61%, trades at $81.42, failing to lift the CAD. On Friday, the BOC Governor Tim Macklem warned that the faster pace of price increases may persist longer than expect and may slow the pace of Canada’s economic recovery, as global supply-chain issues weigh on the domestic economy.

From a technical perspective, RSI indicator rebound from over sought territory to 35 figures, still suggesting bearish momentum in short term. On moving average indicator, 15- and 60-long indicator still retaining downside movement.

Since loonie break through a critical support at 1.24 around, we expect next pivotal support level will be 1.23. On up side, psychological level at 1.25 still a pivotal resistance for short-term, 1.256 following.

Resistance: 1.2425, 1.25, 1.256

Support: 1.23


Economic Data

Currency

Data

Time (GMT + 8)

Forecast

NZD

CPI (QoQ)(Q3)

05:45

1.4%

NZD

CPI (YoY)(Q3)

05:45

4.1%

CNY

GDP (YoY)(Q3)

10:00

5.2%

CNY

Industrial Production (YoY)(Sep)

10:00

4.5%

USD

Industrial Production (MoM)(Sep)

21:15

0.2%

VT Markets Notification of Server Upgrade

Dear Client,

As part of our commitment to providing the best reliability and service to our client, we are planning an upgrade in our server on October 16th 2021.

As a result, we will be conduct maintenance according to the schedule below.
Start date and time: 2021-10-16 16:00 GMT+3(Server time)
End date and time: 2021-10-16 19:00 GMT+3(Server time)

Kindly be reminded that the following things might be affected during this maintenance period:

1. The login of the client portal

2. The login of the trading account

3. The quotations of crypto products will be paused. Clients might not be able to open new positions or close the held positions.

After the upgrade, clients can login to trading account using the server which is shown in the account activation mail.

No action is required by our client. Your services will come back online at the end of the maintenance.

Thank you for your patience and understanding with regard to this important initiative.

If you’d like more information, please don’t hesitate to contact [email protected].

Market Focus

The U.S. equity market enjoyed a broad based gain on Thursday’s trading. The S&P 500 gained 1.7% to close at 4438.26, the DJIA gained 1.6% to close at 34912.56, and the Nasdaq gained 1.7% to close at 14823.43. Stocks were boosted by healthy corporate earnings and better than anticipated economic data. Goldman Sachs, BB&T, and PNC Financial services Group will release their earnings on the 15th. Morgan Stanley topped expectations for Q3 and beat earnings estimates; furthermore, Morgan Stanley reported a 25% jump in net income year over year, despite a slowdown in fixed income trading revenue.

The U.S 10-year treasury yield continued to decline and the benchmark is currently sitting at 1.519, down 1.94% from the previous trading day.

一張含有 文字 的圖片

自動產生的描述

The U.S. initial jobless claims data for the week ended October 9th dropped to a fresh pandemic low of 293,000, the lowerst in 19 months. Importantly, labor demand seems to be on the rise as more people are coming off state unemployment rolls.

The Brent Crude spiked above $80 dollars a barrel and is currently settling at $84.31 per barrel; meanwhile, the WTI has also broken the $80 barrier to settle at $81.67 per barrel.


Main Pairs Movement:

As Treasury yields held at the lower end of the weekly range, the dollar remained weak. The yield on the 10-year US Treasury note bottomed at 1.507%, ending the day nearby. The greenback managed to post a modest intraday advance against the JPY but lost to most of its major rivals.

Upbeat US data provided additional support to the market’s mood. The September Producer Price Index was up 0.5% MoM and 8.6% YoY, higher than the August readings though below the market’s expectations, while Initial Jobless Claims for the week ended October 8 printed at 293k, much better than the 319k expected.

EUR/USD lost the 1.1600 threshold, ending the day a few pips below the level. GBP/USD settled at 1.3670, while commodity-linked currencies were the best performers. AUD/USD regained the 0.7400 mark, while USD/CAD fell to 1.2355, a fresh low since the early July.

Crude oil prices were up. The International Energy Agency said that record-breaking natural gas prices would boost demand for oil, and top oil producer Saudi Arabia dismissed calls for additional OPEC+ supply. WTI settled at $81.40 a barrel, while Brent traded over $84.00. Gold flirted with $1,800 per ounce, and hovering below that level at the moment.


Technical Analysis:

USDJPY (Daily Chart)

US dollar’s bullish attempt seen on the early US trading session has chanllenged resistance again at the 113.70 area, and the pair retreated to the mid-range of 113.00. The USD remains strong against a weaker yen, trading right below three-year highs at 113.80 following a 4% rally over the last four weeks.

The Japanese yen is trading lower against its main peers with a positive market sentiment hurting safe-havens in favor of riskier assets. The world’s major stock indexes are posting significant gains on Thursday, as concerns about surging inflation and supply chain bottlenecks have taken a backseat.

In a bigger picture, the pair remains steady near recent highs, and a further rally is anticipated, even though overbought shorter-term conditions could lead to a couple of days of consolidation first. The next resistance is at 114.02, and the USD strength is deemed intact as long as it does not drop below 112.00

Resistance: 114.02, 114.55

Support: 112.57, 112.00, 109.15


EURUSD (4-hour Chart)

The euro fiber retreat from daily high and lost the 1.16 threshold, ending the day a few pips below the level where trading at 1.1588 with 0.04% down as of writing. Earlier in the Asian session, the currency rose to a fresh weekly high at 1.1624. Upbeat U.S. data provided additional support to the market’s mood. The Sept Producer Price Index was up 0.5% MoM and 8.6% YoY, higher than the Aug readings although below the market’s expectations, while Initial Jobless Claims for the week ended Oct 8 printed at 293K much better than earlier expected.

On technical side, the RSI index has reversed from daily high at thereabout over bought threshold, suggesting a slightly bullish movement in short term. On moving average aspect, 15-long indicator has turned it slope to positive way and 60-long became a flat movement after day market.

All of all, both critical indicator are suggesting euro could heading to upward momentum, of course base on indicator. Moreover, if 15-and 60-long MA indicator could gold cross in further that would provide a profound guidance. However, we foresee 1.16 thereabout is a main resistance as neckline of W pattern. If euro fiber could penetrate immediately resistance solid, then expect it could heading to higher stage.

Resistance: 1.161, 1.166, 1.1675, 1.171

Support: 1.153, 1.15


USDCAD (4 Hour Chart)

Loonie is trading at 1.237 and down over 0.57% after falling from a highs of 1.2445 to a low of 1.2354 on Thursday so far. Loonie has strengthened to its highest level in more than three months against its U.S. conterpart, as the energy crisis underpins the nation’s biggest exporting industry. Oil price were followed up the upward traction, the International Energy Agency said that record natural gas prices would boost demand for oil and top oil producer Saudi Arabia dismissed calls for additional OPEC+ supply. The nearly WTI contract sitting at $ 81.43 per barrel as of writing. Gold flirted with $1800 at ending the day just below the level.

From a technical perspective, RSI indicator fell into over sough territory and sitting 25, still suggesting bearish momentum in short term. On moving average indicator, 15- and 60-long indicator still retaining downside movement.

Since loonie break through a critical support at 1.24 around, we expect next pivotal support level will be 1.23. On up side, psychological level at 1.25 still a pivotal resistance for short-term, 1.256 following.

Resistance: 1.2425, 1.25, 1.256

Support: 1.23


Economic Data

Currency

Data

Time (GMT + 8)

Forecast

AUD

Employment Change (Sep)

08:30

-137.5 K

USD

Initial Jobless Claims

20:30

319 K

USD

PPI (MoM)(Sep)

20:30

0.6%

Oil

Crude Oil Inventories

23:00

0.702 M

Daily Market Analysis

Market Focus

US markets traded higher following the release of consumer prices index. Consumer prices increased slightly more than expected in September. The rises of food and energy prices offset the declines of used vehicles prices, according to the Labor Department.

一張含有 文字 的圖片

自動產生的描述

US social security cost- of- living adjustment will be adjusted 5.9% higher in 2022, according to Social Security Administration announced. Notably, the adjustment will be the biggest boost in about 40 years. Comparing to 2021, the Social Security cost- of- living was only 1.3%.

After the release of CPI, the US Federal Reserve officials broadly agreed on the plan, tapering process by mid- November. The tapering process could see a monthly reduction of $10 billion in Treasury and $5 billion in mortage- backed securities.


Main Pairs Movement:

The precious metal, gold rose to the highest in almost a month as the US Treasury yields and the US dollar declined after the release of CPI, slightly higher than the expectation. Gold price traded at $1,793, up nearly 2% on Wednesday. The upsurge of gold price could be potentially seen as the initial reaction to the inflation.

GBPUSD traded further north, trading 0.52% higher. Lower US Treasury yields undermined the demand for the greenback; however, the upside momentum of the British pound was still limited as the Brexit led- woes, weaker GDP, and worker shortage continued to be issues.

EURUSD traded similarly to GBPUSD amid the concern of US inflation and lower US Treasury yields. In the end of the day, the currency pair closed at 1.15907, 0.53% higher.


Technical Analysis:

EURUSD (4-hour Chart)

The EUR/USD pair trades at the intraday high 1.1596 as of writing. However, the current recovery could well be seen as corrective, as the pair remains below a firmly bearish 20 DMA. The MACD histogram remains flat within the negative territory, while the RSI indicator has bounced from oversold readings, yet holding below 50.

As expected, the Fed reaffirmed their previous statements in the latest FOMC Minutes: to start tapering in either Novenber or December, and to end it in mid-2022. The dull announcement did little to the market.

As to the resistence and support levels, our opinion remains unchanged. The first support appears at the 1.15 psychological level, then 1.14225, the 2020 May’s top; the resistence levels are at 1.161, 1.166 and 1.171, where the historical tops and bottoms lies. The 20 DMA is also a strong resisitence to the pair, as a breach of it marks a flip of the market sentiments.

Resistance: 1.1610, 1.1660, 1.1675,1.1710

Support: 1.153, 1.15, 1.14225


XAUUSD (4-hour Chart)

The price of gold on Wednesday has rallied as key data today, U.S. inflation data showed prices rose solidly in Sep, stoking expectations the Federal Reserve will announce a tapering of stimulus next month, with the potential for rate hikes by mid-2022. The Consumer Price index rose 0.4% last month, versus a 0.3% rise expected by economists. At the time of writing, gold is trading at 1791.99. The price has travelled from a low of 1757 to a high of 1796 where tests the 200-day EMA.

On the technical front, the 4-hour RSI index has breached the over bought territory at 72.83 figures, suggesting a overly bullish sentiment at short term. On moving average side, 15- and 60-long indicator are both heading to upside traction.

As gold penetrate 1780 psychological resistance level in New York Session, we expect market has found an accommodative bullish territory ahead while Fed boosting the tapering expectation, price action told as well. On upside, we foresee 1800 will give upside traction a barricade, far way 1830 follow.

Resistance: 1800, 1830

Support: 1783, 1758, 1750

VT Markets The Adjustment Of Weekly Dividend Notification

Dear Client,

Warmly reminds you that the component stocks in the stock index spot generate dividends. When dividends are distributed, VT Markets will make dividends and deductions for the clients who hold the trading products after the close of the day before the ex-dividend date.

Indices dividends will not be paid/charged as an inclusion along with the swap component. It will be executed separately through a balance statement directly to your trading account, the comment for which will be in the following format “Div & Product Name & Net Volume ” .

Please note the specific adjustments as follows:

Note: The above data is for reference only, the actual execution data may be changed, please refer to the MT4 software for details.

If you’d like more information, please don’t hesitate to contact [email protected].

Daily Market Analysis

Market Focus

All major U.S. stock indices closed lower for the second straight day. The Dow lost 0.34% to close at 34378.34, the S&P lost 0.24% to close at 4350.65, and the Nasdaq lost 0.14% to close at 14465.93. Poor performance in the communications sector dragged most indices lower, while strong gains in the real estate and consumer discretionary industry helped limit losses. Macroeconomic factors including soaring commodity prices and strong global energy demand put further weight on the threat of inflation.

Oil prices remained at historical heights. The WTI gained 12 cents to settle at $80.64 per barrel, while the Brent Crude lost 23 cents to settle at $83.42 per barrel. Worldwide shortage of natural gas has helped buoy oil prices. On the other hand, the 10-year treasury yield stayed above 1.5%, but the yield experienced its largest one day drop to settle at 1.579%.

一張含有 文字 的圖片

自動產生的描述

This week also signals the beginning of the third quarter earnings season. JPMorgan Chase and Blackrock will be announcing their earnings on the 13th. Speculators are eyeing the performance of the industrial and the materials industry as global demand ticked up and these firms retain better pricing power in the face of rising costs.


Main Pairs Movement:

Another day without high-impact US data leads the risk perception became the primary driver of market movement. With major US indices consolidating in the familiar levels, the US Dollar Index continued its upweard traction and rose 0.15% on Tuesday.

Robust USD strength in the second day of the week forced most of its rival pairs to close in the negative territory. The EUR/USD pair remains within a touching distance of the 15-month low setting at 1.1529 while consolidating its losses. GBP/USD settles around the same old range at 1.3600. USD/JPY advanced to its highest level since late-2018 and seems to have gone into a consolidation phase around 113.50. Commodity-linked currencies posted mild gains against greenback. USD/CAD dropped nearly 0.1%, and AUD/USD climbed about 0.15%.

After surging more than 10% in the previous week, the benchmark 10-year US Treasury bond yield dropped significant 3.6% intraday, fueling gold’s rally. The yellow metal trades at $1760 per ounce at the moment, 0.36% higher than yesterday; Crude oil prices remains unchanged, with WTI’s at $80.50, and Brent at $83.30.

Bitcoin plummeted over 4% after renewing multi-month highs on Monday, now trading at $55,250. Ethereum trades near $3,500 on Tuesday and seems lack of momentum to keep its uptrend, as the overall risk-off mood makes the crypto currencies unattractive.


Technical Analysis:

USD/JPY (4-hour Chart)

The USD/JPY pair refreshed daily lows during the early European session, managed to defend the 113.00 mark, and quickly rebounded thereafter. The pair was last seen hovering around the 113.50-80 region, fresh highs since December 2018.

On the technical front, both the 4-hour MACD histogram and RSI indicator suggest that the USD/JPY pair is strongly bullish, even RSI breaches to the overbought territory, implying the pair might experience a correction in the short term. In our opinion, we think the pair may encounter its first resistance at the upper bound of the Bollinger Band, consolidate awhile, then keep on its uptrend. If not, then the first support for the pair lies on the 4-hour 20 SMA, then 112.00. A breakthrough of the last support 109.15 could open the Pandora’s Box of a downward trajectory.

Resistance: 114.02, 114.55

Support: 112.57, 112.00, 109.15


EURUSD (4-hour Chart)

The EUR/USD pair lingers in the narrow price interval for yet another session on Tuesday. The pair dove to the 2021 low below 1.1530 remains well on the table amid the ongoing bearish trend, at least in the short term. A further retreat from this spot should trigger a relatively quick test of the 1.1500 psychological support, where the March 2020 high sits, and a breakthrough of that will lead the pair to the last barricade ahead of a massive downfall, the June 2020 high at 1.1422.

On the technical front, the 4-hour MACD histogram has just formed a death cross, and the RSI indicator is at 35, strongly bearish but above the oversold territory, suggesting the downward traction should proceed. Moreover, the pair is now deeply below the key 200-DMA line, where the pair should cross to prove a meaningful rebound.

Resistance: 1.161, 1.164, 1.1675, 1.172

Support: 1.153, 1.150, 1.1422


USDCAD (4 Hour Chart)

The USD/CAD pair slides during the New York session is trading at 1.4635, down 0.17% around at nearly market close. The market sentiment is downbeat, portrayed by U.S. stock indices posting losses between 0.25% and 0.34%. Reasons like the energy crunch in Europe and Asia. On oil side, rising oil prices are boosting the loonie, WTI crude oil is barely unchanged at $79.9, outside of $80 per barrel threshold for the first time in two days.

From a technical perspective, RSI indicator still clinging at over sough territory at 38 in nearly two day as market faltering, remain suggesting bearish momentum in short term. On moving average indicator, 15- and 60-long indicator still retaining downside movement.

Since loonie rapidly break through a critical support at 1.25, we expect next downward support will be last July low at 1.2425. On up side, psychological level at 1.25 will turn into a pivotal resistance for short-term, 1.256 behind.

Resistance: 1.25, 1.256

Support: 1.2425, 1.23


Economic Data

Currency

Data

Time (GMT + 8)

Forecast

GBP

GDP (YoY, MoM)

14:00

GBP

Manufacturing Production (MoM)(Aug)

14:00

0.1%

GBP

Monthly GDP 3M/3M Change

14:00

USD

Core CPI (MoM)(Sep)

20:30

0.2%

USD

FOMC Meeting Minutes

02:00 (10/14)

VT Markets Notification of USDTRY SWAP setting modification

Dear Client,

To reflect the market volatility more precisely, VT Markets will modify the setting of the 3-days Swap of USDTRY on Oct. 18th, 2021.

The date of USDTRY’s 3-days Swap will be changed from every Wednesday to every Thursday.

This modification will be applied to all VT Markets’ servers on MT4 and MT5.

The product specification is displayed as follows:

Notice: All the specifications above are only for reference. The exact executed data might be slight changed. Please be subject to the numbers on MT4/MT5.

If you’d like more information, please don’t hesitate to contact [email protected].

Back To Top
server

Hello there 👋

How can I help you?

Chat with our team instantly

Live Chat

Start a live conversation through...

  • Telegram
    hold On hold
  • Coming Soon...

Hello there 👋

How can I help you?

telegram

Scan the QR code with your smartphone to start a chat with us, or click here.

Don’t have the Telegram App or Desktop installed? Use Web Telegram instead.

QR code