Market Focus

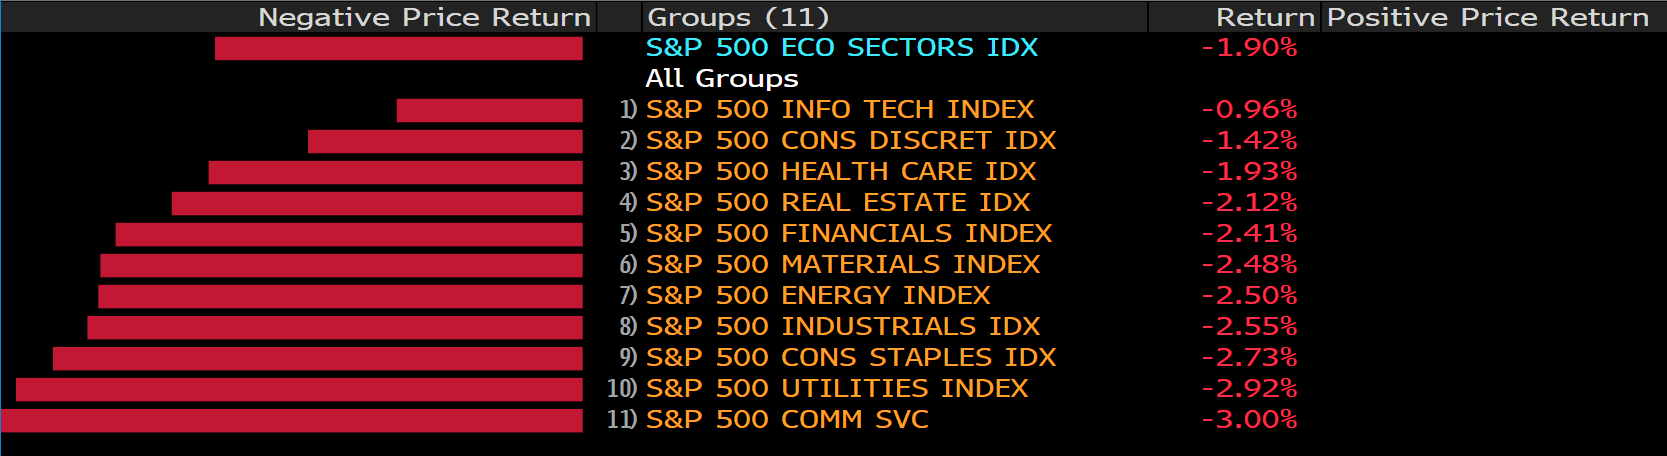
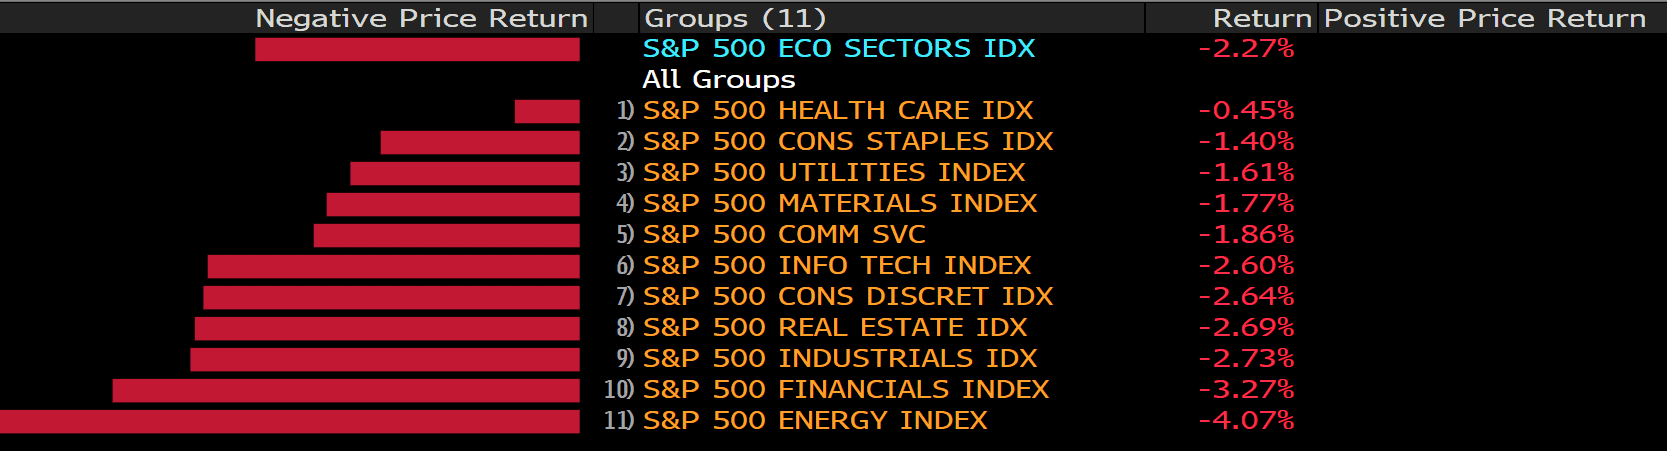
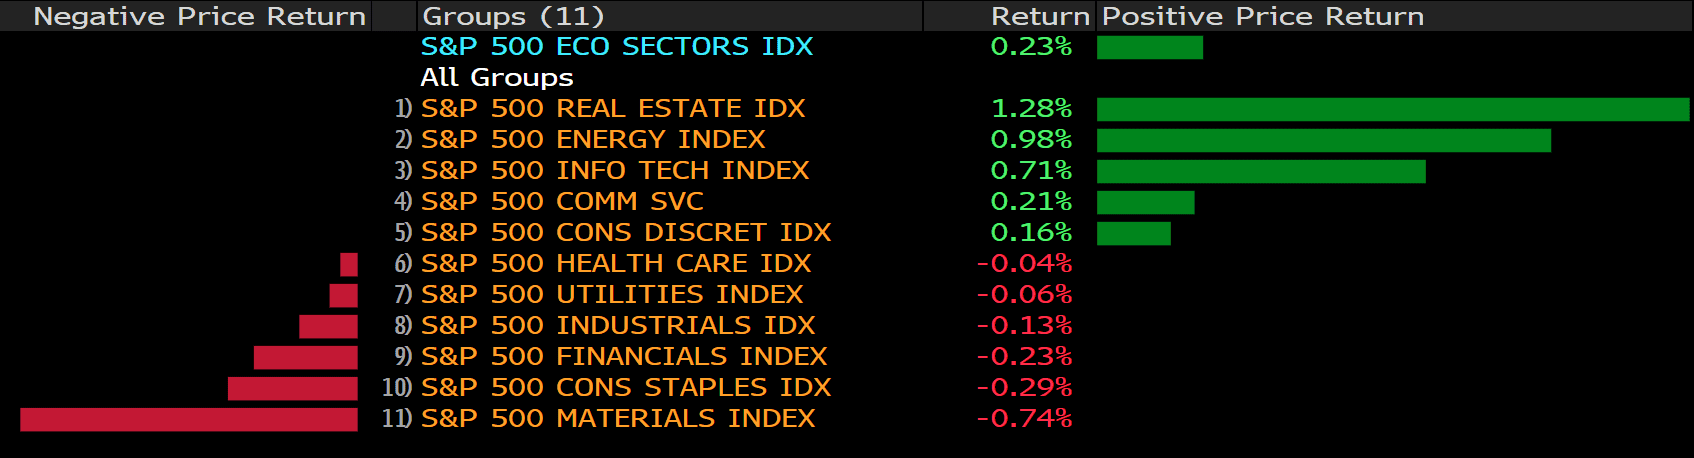
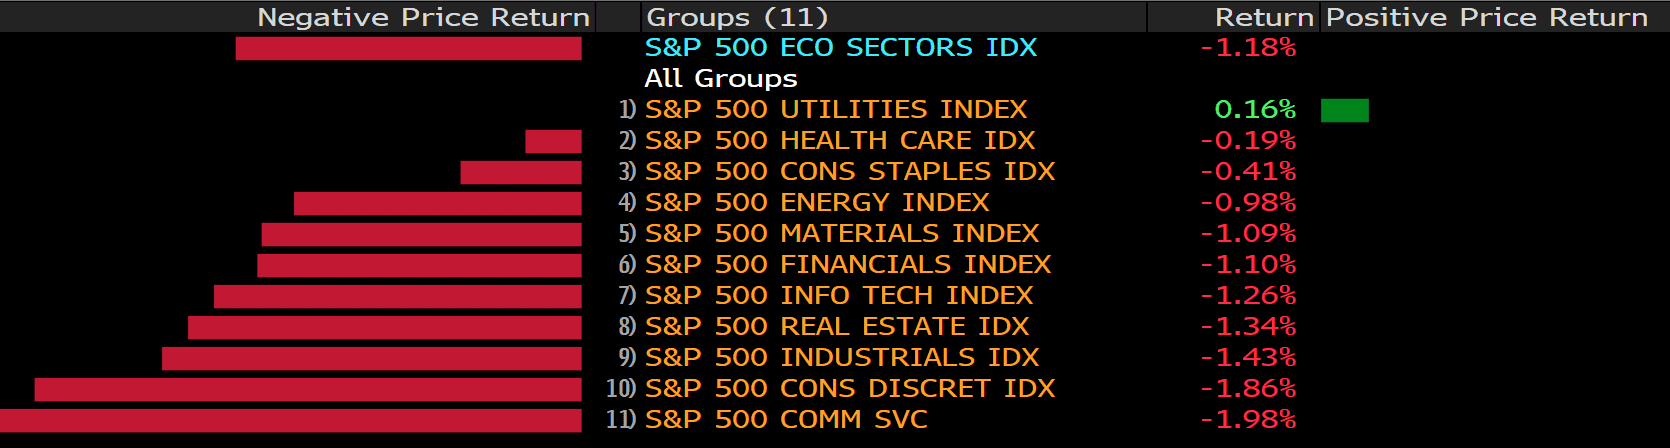
US equities underwent their worst back-to-back collapse since October 2020 as Fed Chair Jerome Powell reiterated his pivot to inflation vigilance and the omicron variant continued to spread, with the U.S. confirming its first case on Wednesday. In a very volatile session, the S&P 500 erased gains after climbing almost 2% in the first half of the Wall Street hours. Dow Jones slid 1.34% to 34022.07, and Nasdaq Composite plummeted 1.83% to 15,254.05. Airlines, cruise operators and hotels also slumped. Investors flocked to the relative safety of Treasuries, with the yield on the 10-year note down to 1.404%.

一張含有 文字 的圖片

自動產生的描述

On the market front, professional traders bailing from stocks as anxiety over the omicron variant and monetary policy roil markets. Hedge funds have gone risk-off in a major way just as the S&P 500 endured a massive two-day pullback. Net leverage, a measure of industry risk appetite that takes into account long versus short positions, fell to a one-year low this week, according to data compiled by Goldman Sachs’ prime brokerage.

The move is in contrast to retail traders, who renewed their manic dip buying after Tuesday’s rout, pushing stocks higher by almost 2% earlier in Wednesday’s session. Then Jerome Powell reinforced his message that the Federal Reserve would keep inflation in check and officials confirmed the first case of the omicron variant in the U.S. That sparked an afternoon selloff that left the S&P 500 with its biggest reversal since April 2020.

Few corners of the market were spared, as small caps gave up a 2.5% surge to end lower by more than 2%. Bitcoin dropped below $57,000, oil hit $65 a barrel and Treasuries rallied on demand for safety. The S&P 500 is now down 3.1% in two sessions and more than 4% from its last record on Nov. 18.


Main Pairs Movement:

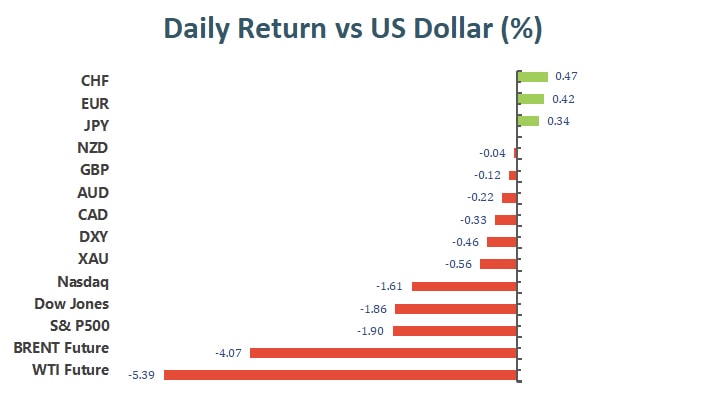
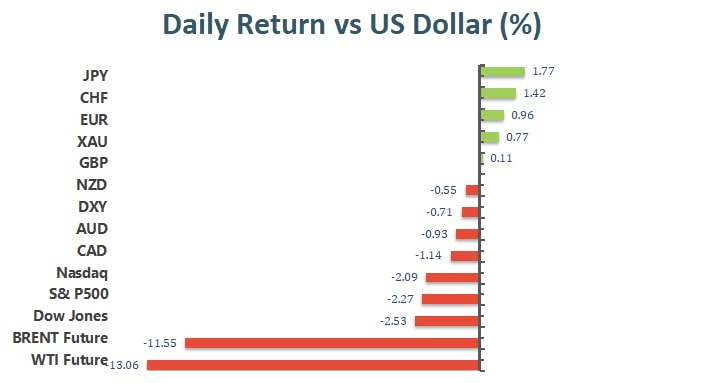
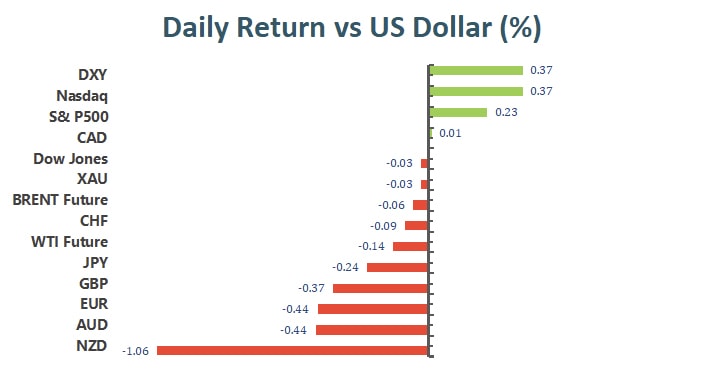
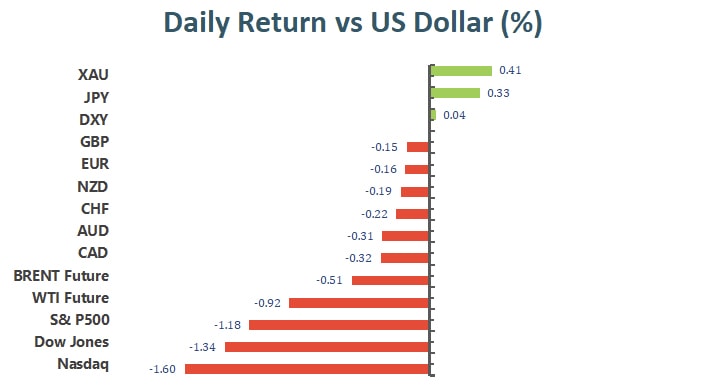
Unlike the dismal stock markets, fears seem to cool down a bit for forex on Wednesday, resulting in major pairs holding into familiar levels. The greenback ended the day mixed, firmer against commodity-linked peers but down against other safe-haven currencies.

The cautious optimism came from the World Health Organization, as it said that current vaccines could still offer protection against the new Omicron coronavirus variant, preventing severe illness. Also, the WHO reported that so far, the new strain seems to be causing milder symptoms and illness. However, risk of Fed’s earlier taper remains, as Chief Powell said they need to remove the word “transitory” while describing the U.S. inflation issue.

The EUR/USD pair trades around 1.1320, while GBP/USD stands at 1.3280, both at risk of falling further. The AUD/USD pair trades at around 0.7110, while USD/CAD is pressuring daily highs in the 1.2830 price zone. USD/JPY and USD/CHF posted mild gains, up 0.15% and 0.21% respectively.

Gold remains under pressure, currently trading at $1,780 a troy ounce. Crude oil prices edged lower, with WTI now at around $65.75 a barrel, and Brent at $68.50.


Technical Analysis:

EURUSD (4- Hour Chart)

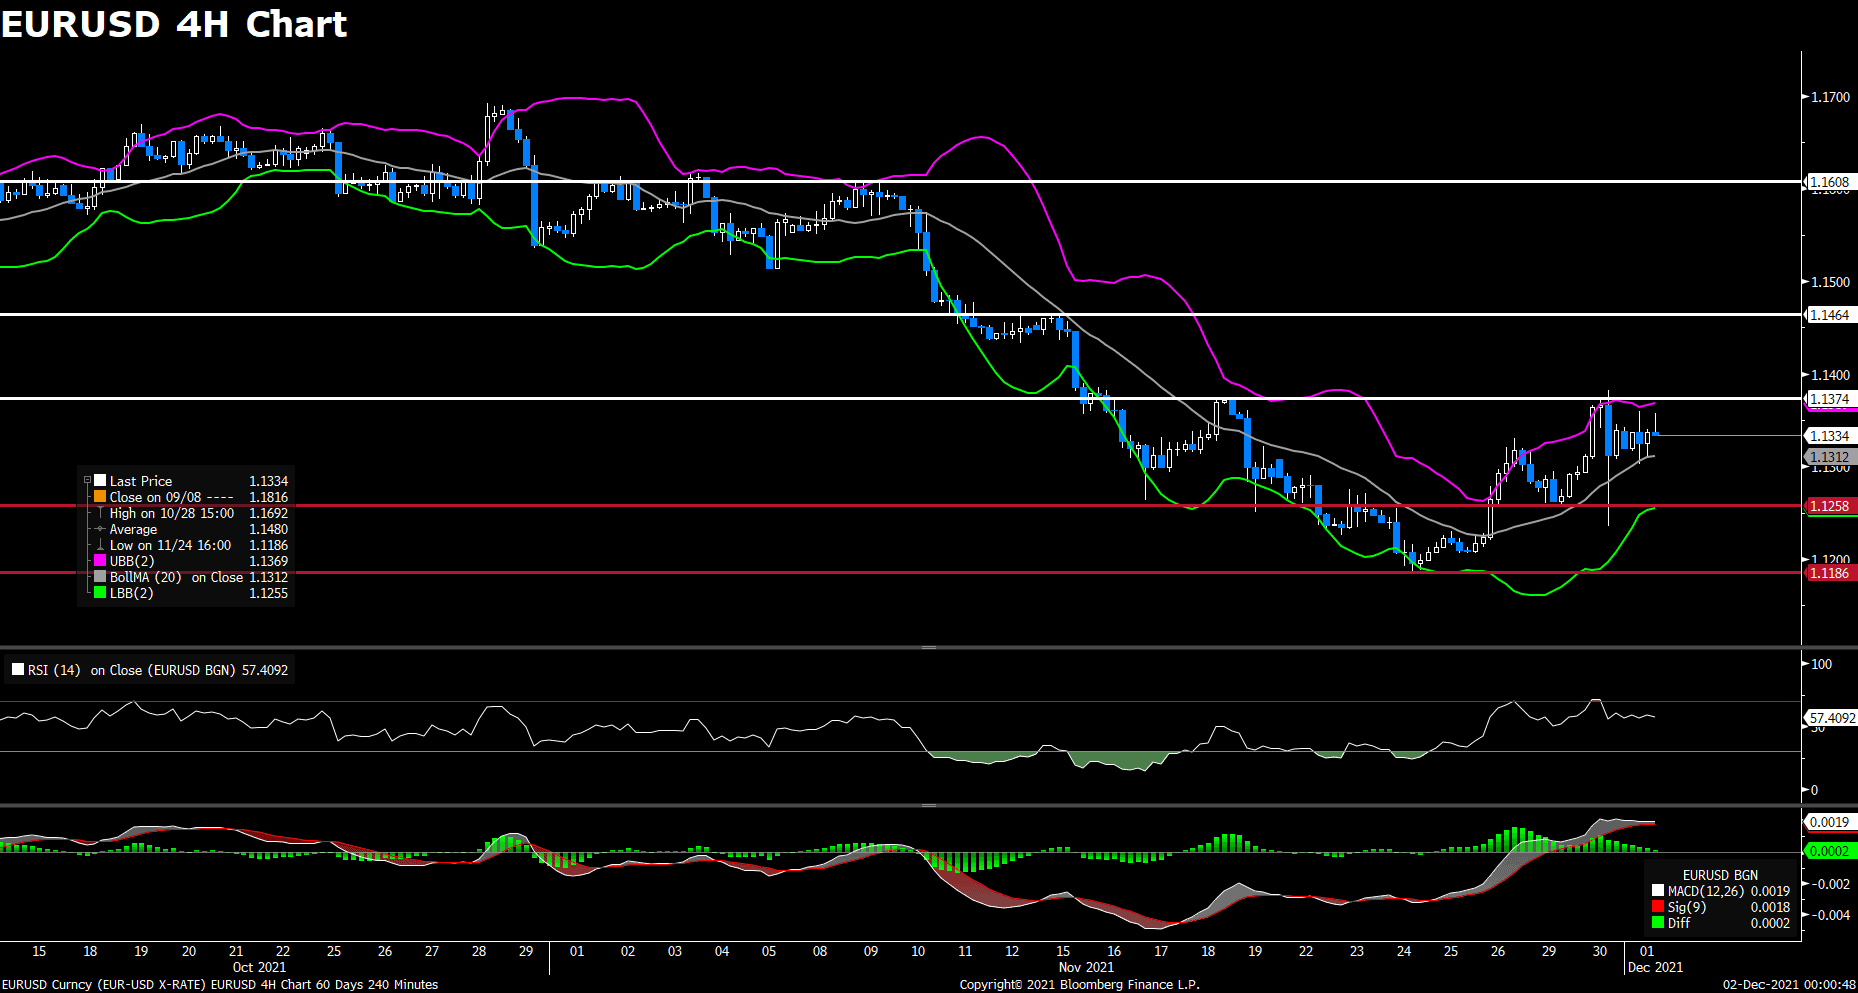
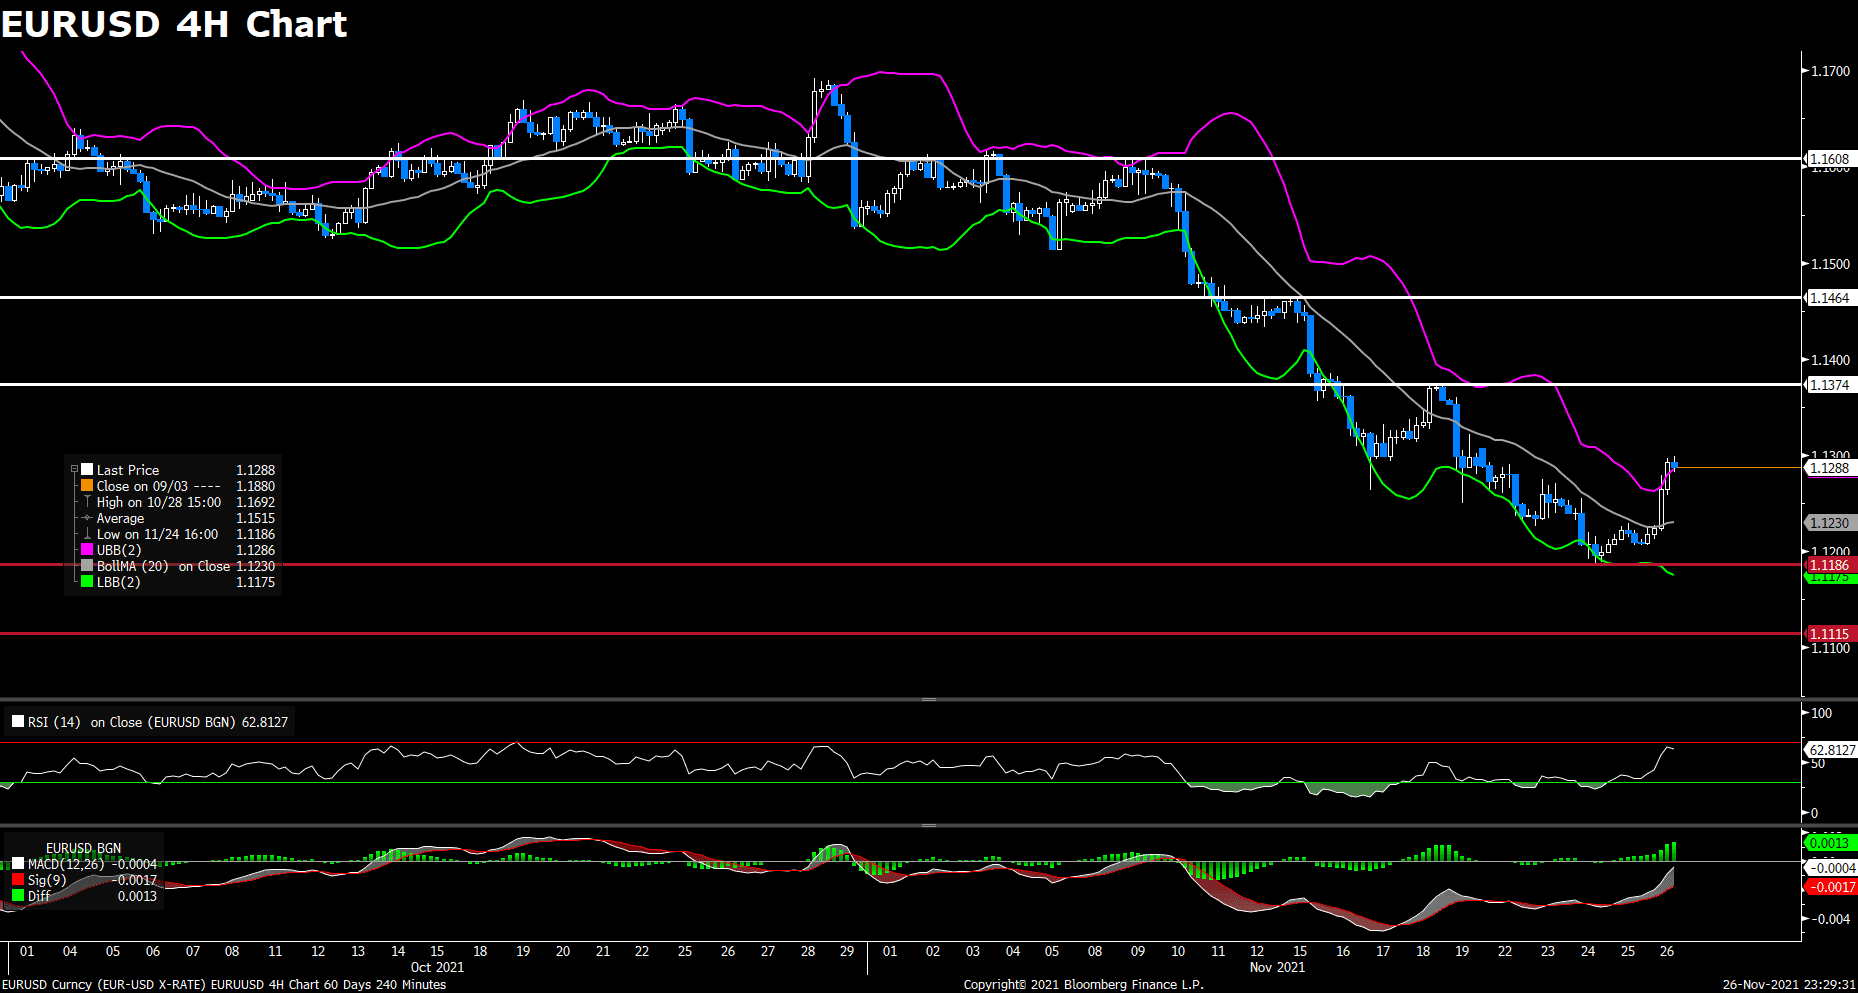
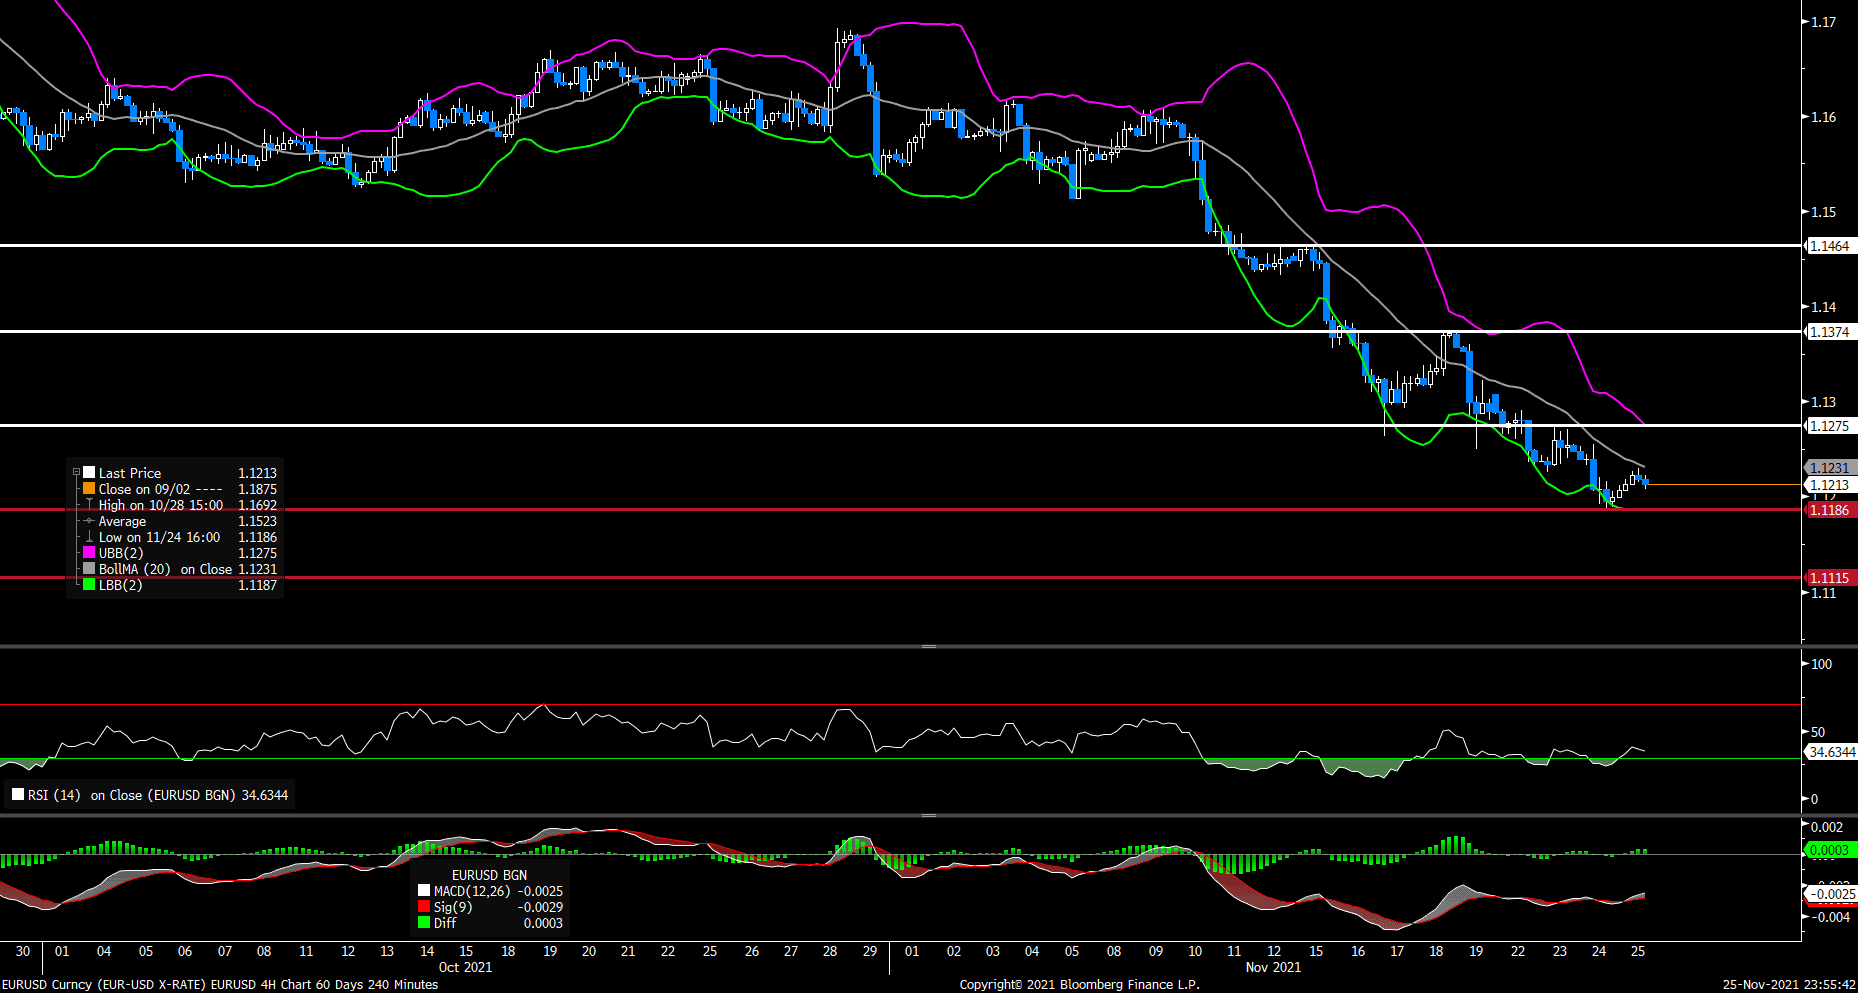
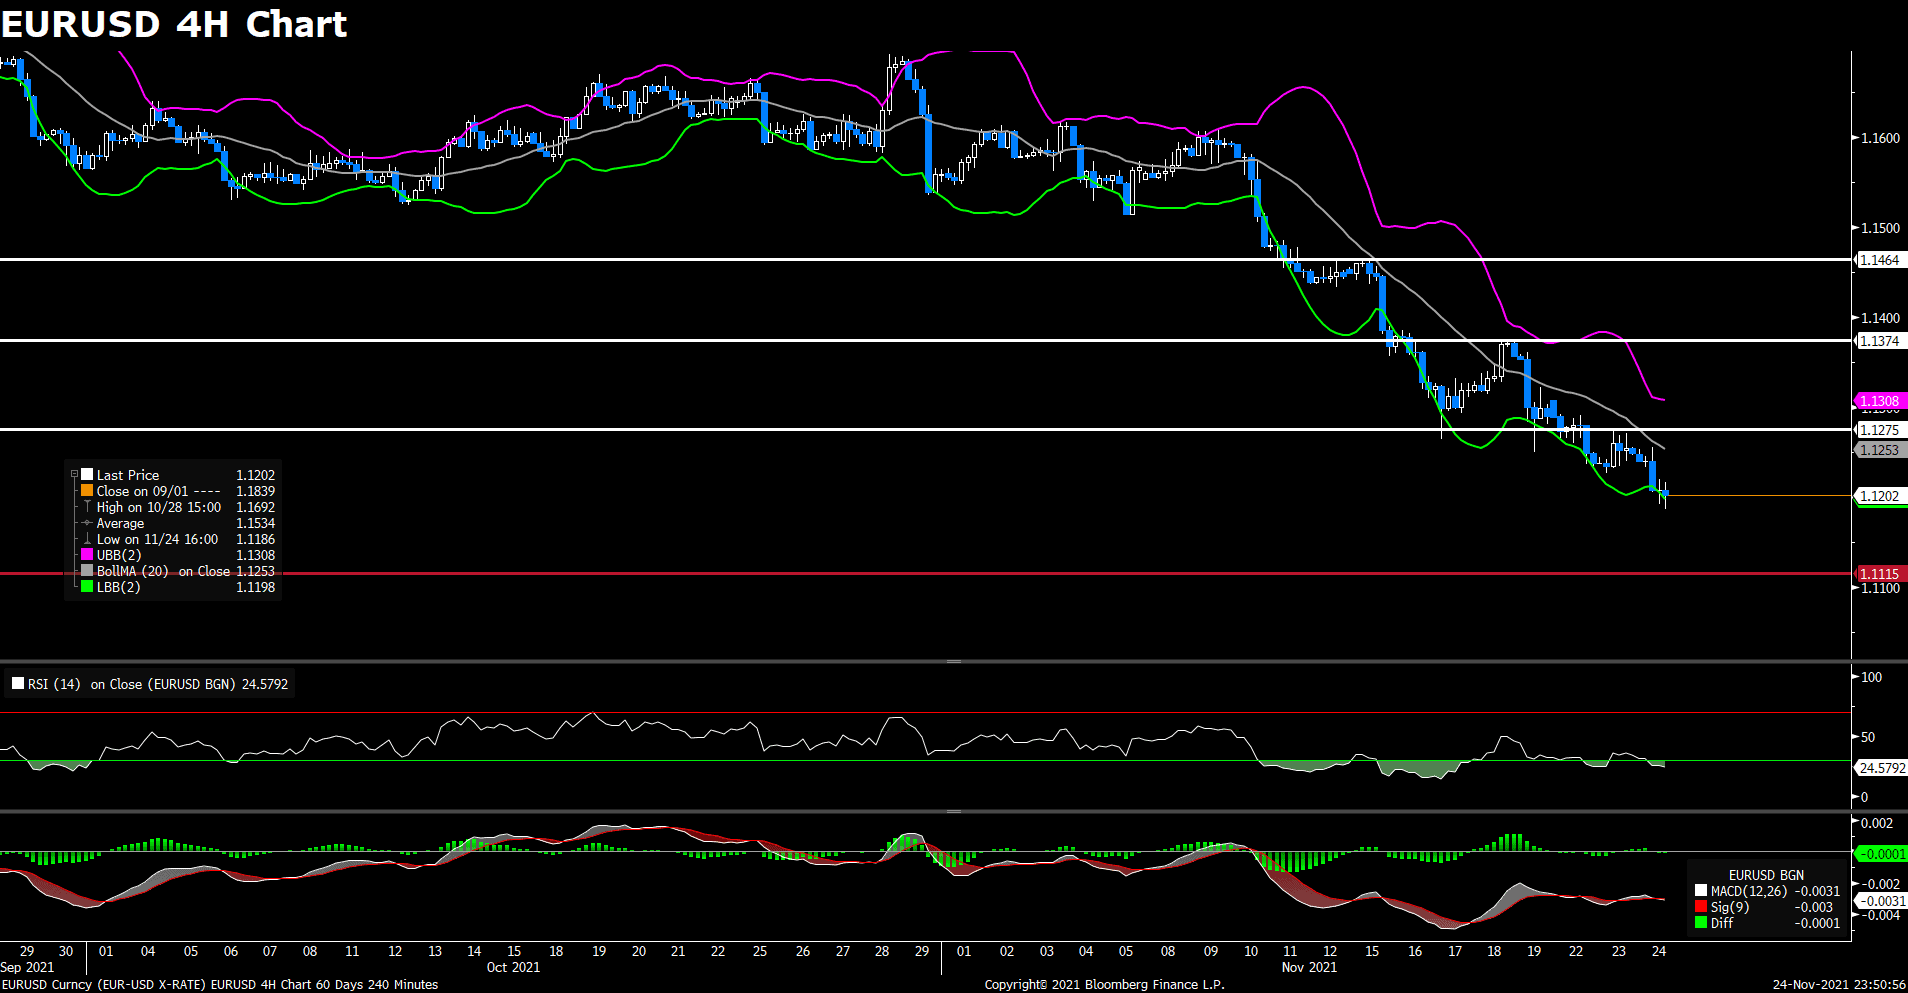
After dropping to a weekly low around 1.124 area, the pair EUR/USD saw some buying and rebounded slightly on Wednesday. The pair was flirting with 1.133 area most of the day, now sitting in negative territory and holding above 1.132 level. The renewed strength witnessed in the greenback weighed on EUR/USD, which currently losing 0.06% on a daily basis. Stronger US dollar across the board today dragged the pair lower, as the DXY index rose 0.02% amid upbeat market sentiment. The US ADP Employment Change for November showed that private payrolls rose by 534K, which is more than market’s expectations. In Europe, concerns about the new omicron variant and the likeliness of lockdown in many countries may dampen the near-term outlook for the European currency and cap the upside for the EUR/USD pair.

For technical aspect, RSI indicator 59 figures as of writing, suggesting that the upside appears more favored as the RSI still above the midline. As for the Bollinger Bands, the price is consolidating between the moving average and upper band, therefore the bullish traction could persist for a while. In conclusion, we think market will be slightly bullish as the pair is heading to re-test the 1.1374 resistance. A break above that level would target 1.1464.

Resistance: 1.1374, 1.1464, 1.1608

Support: 1.1258, 1.1186


GBPUSD (4- Hour Chart)

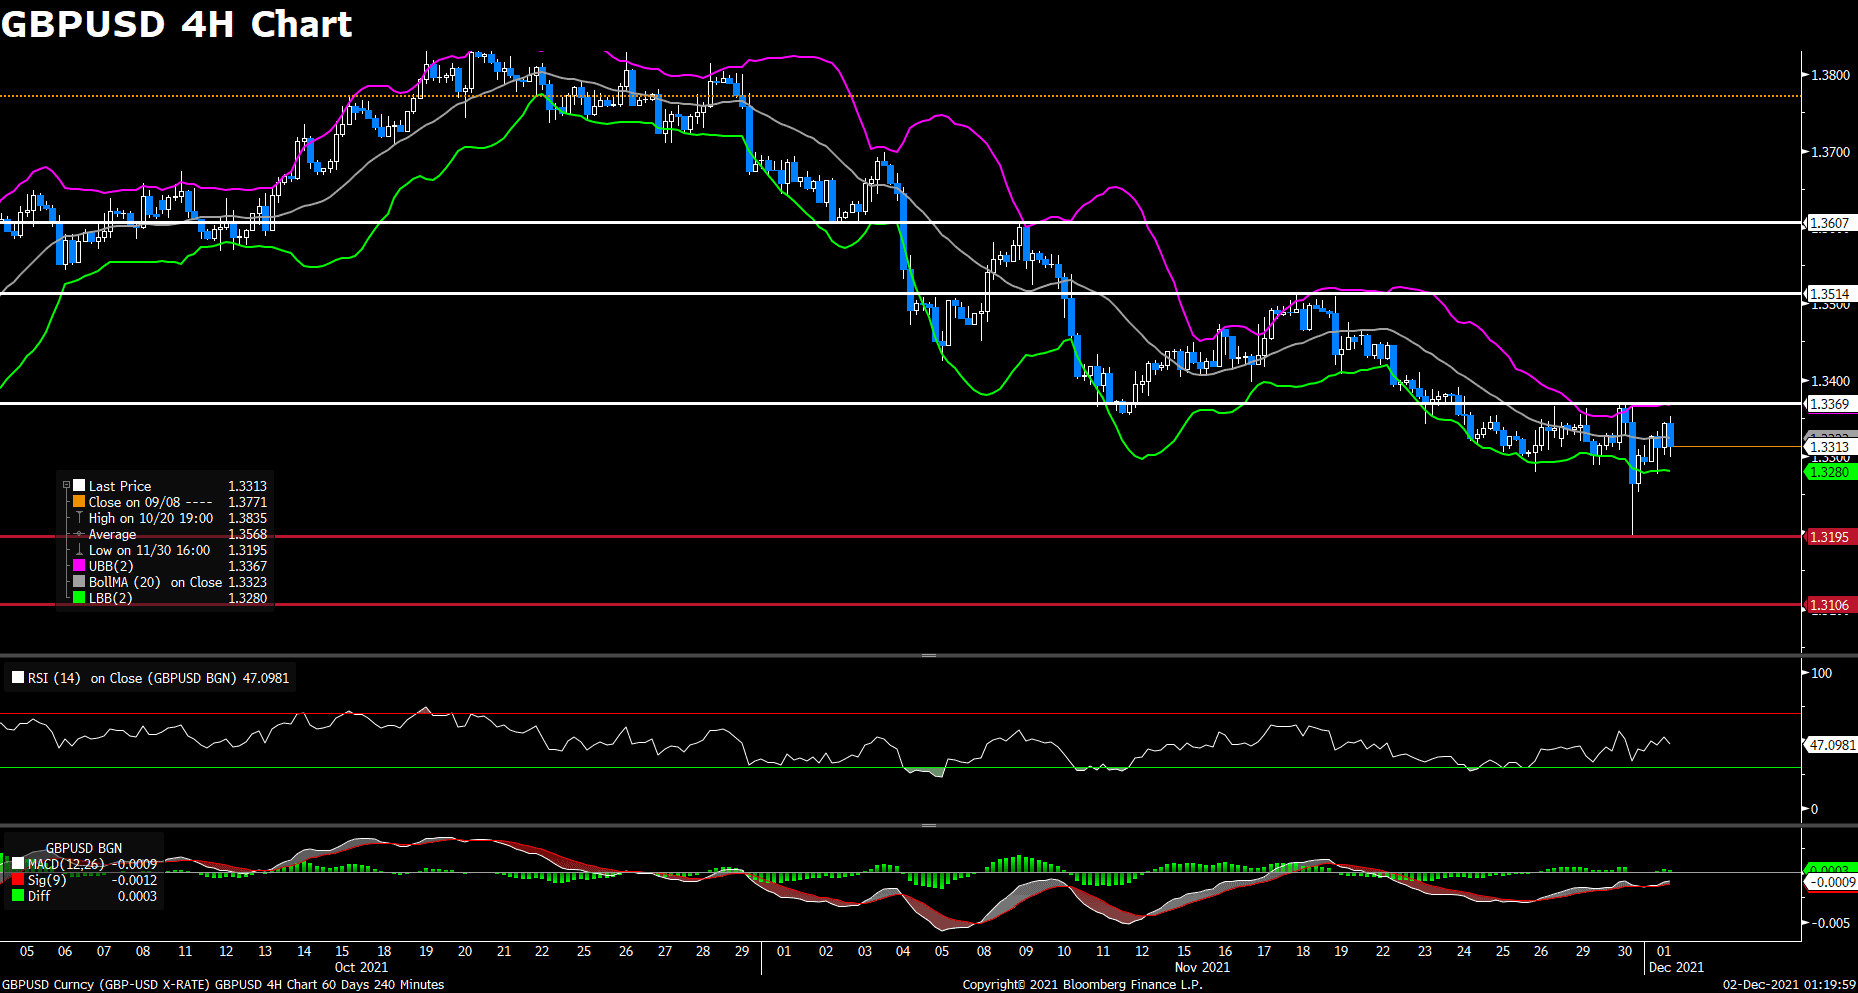
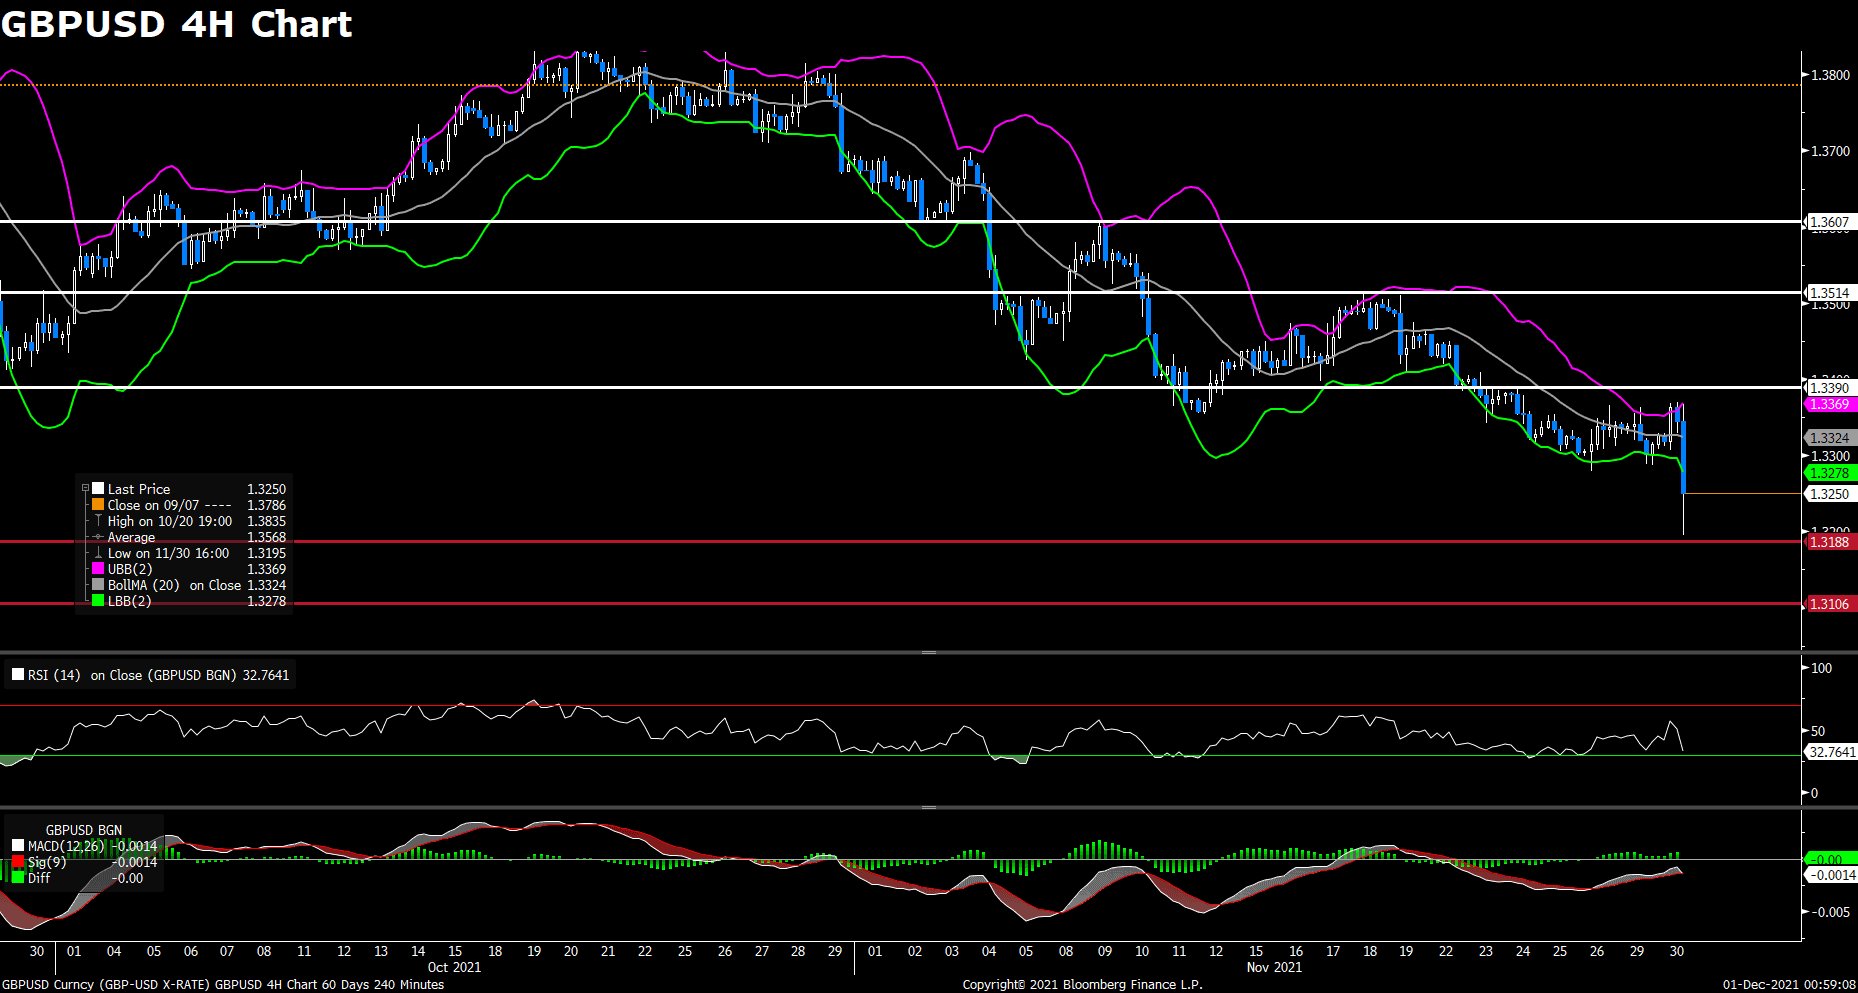
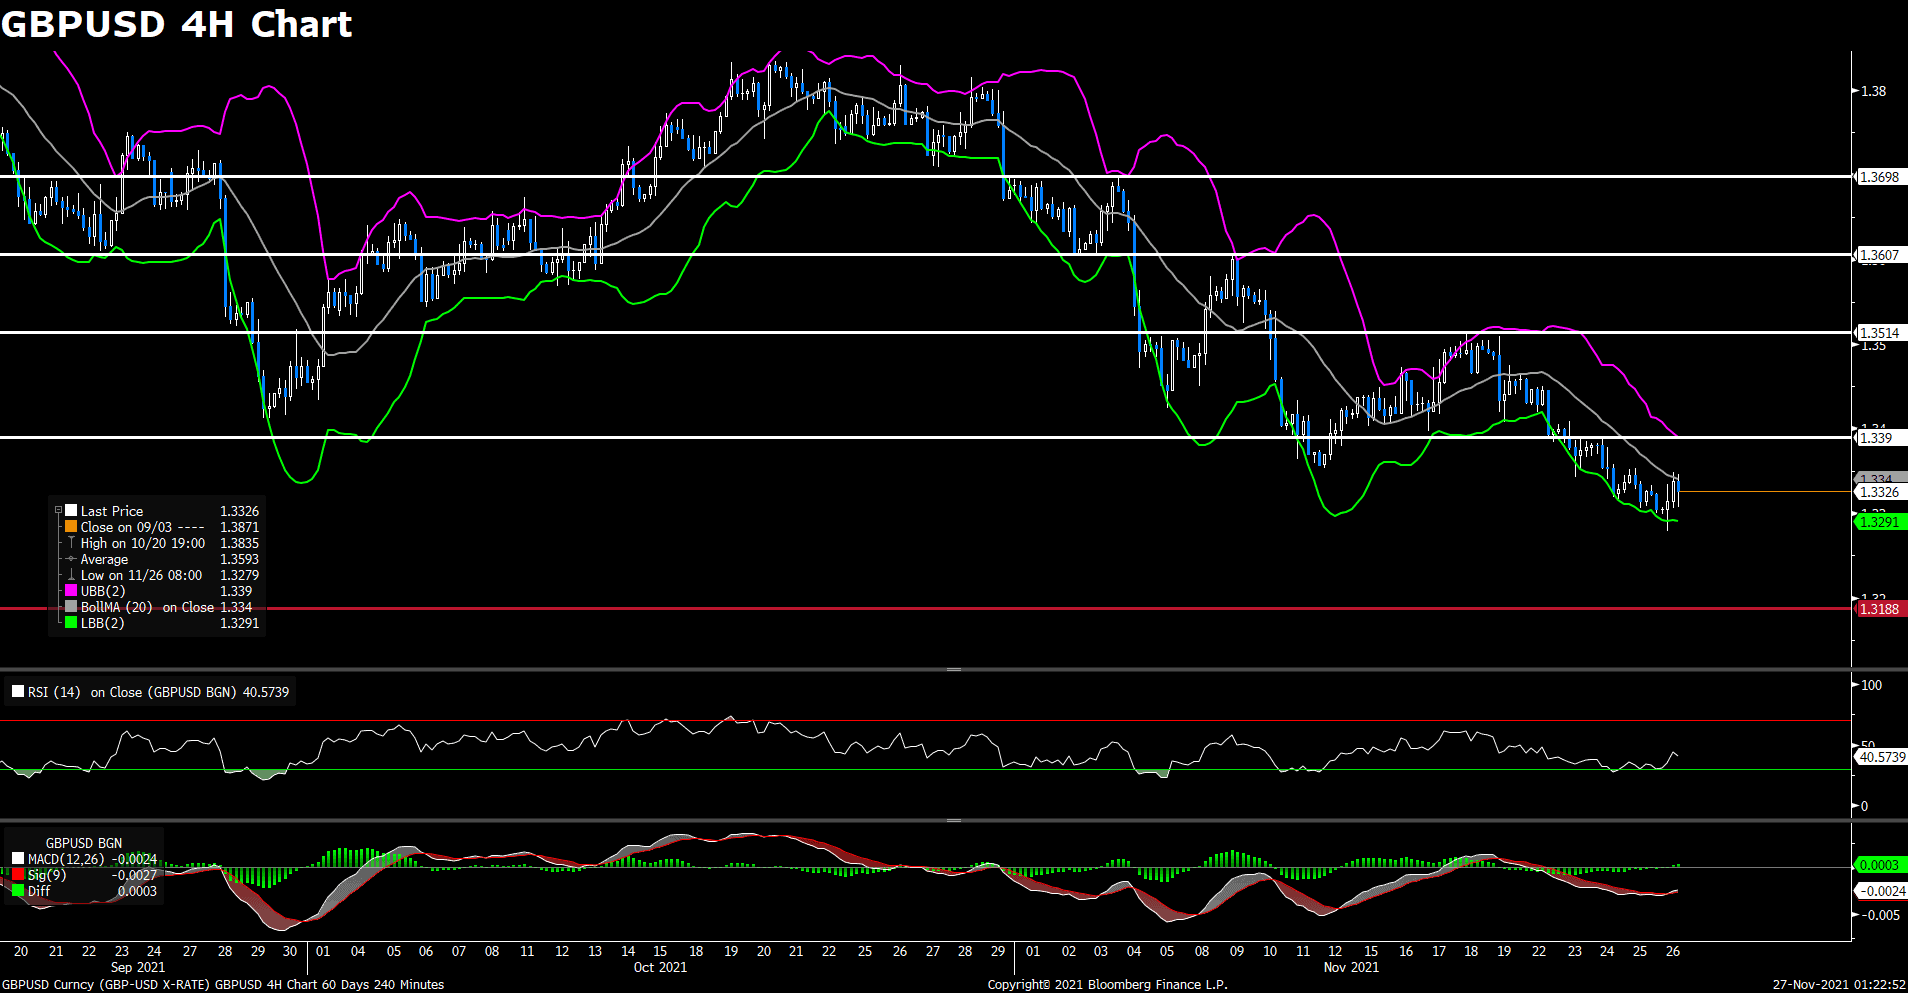
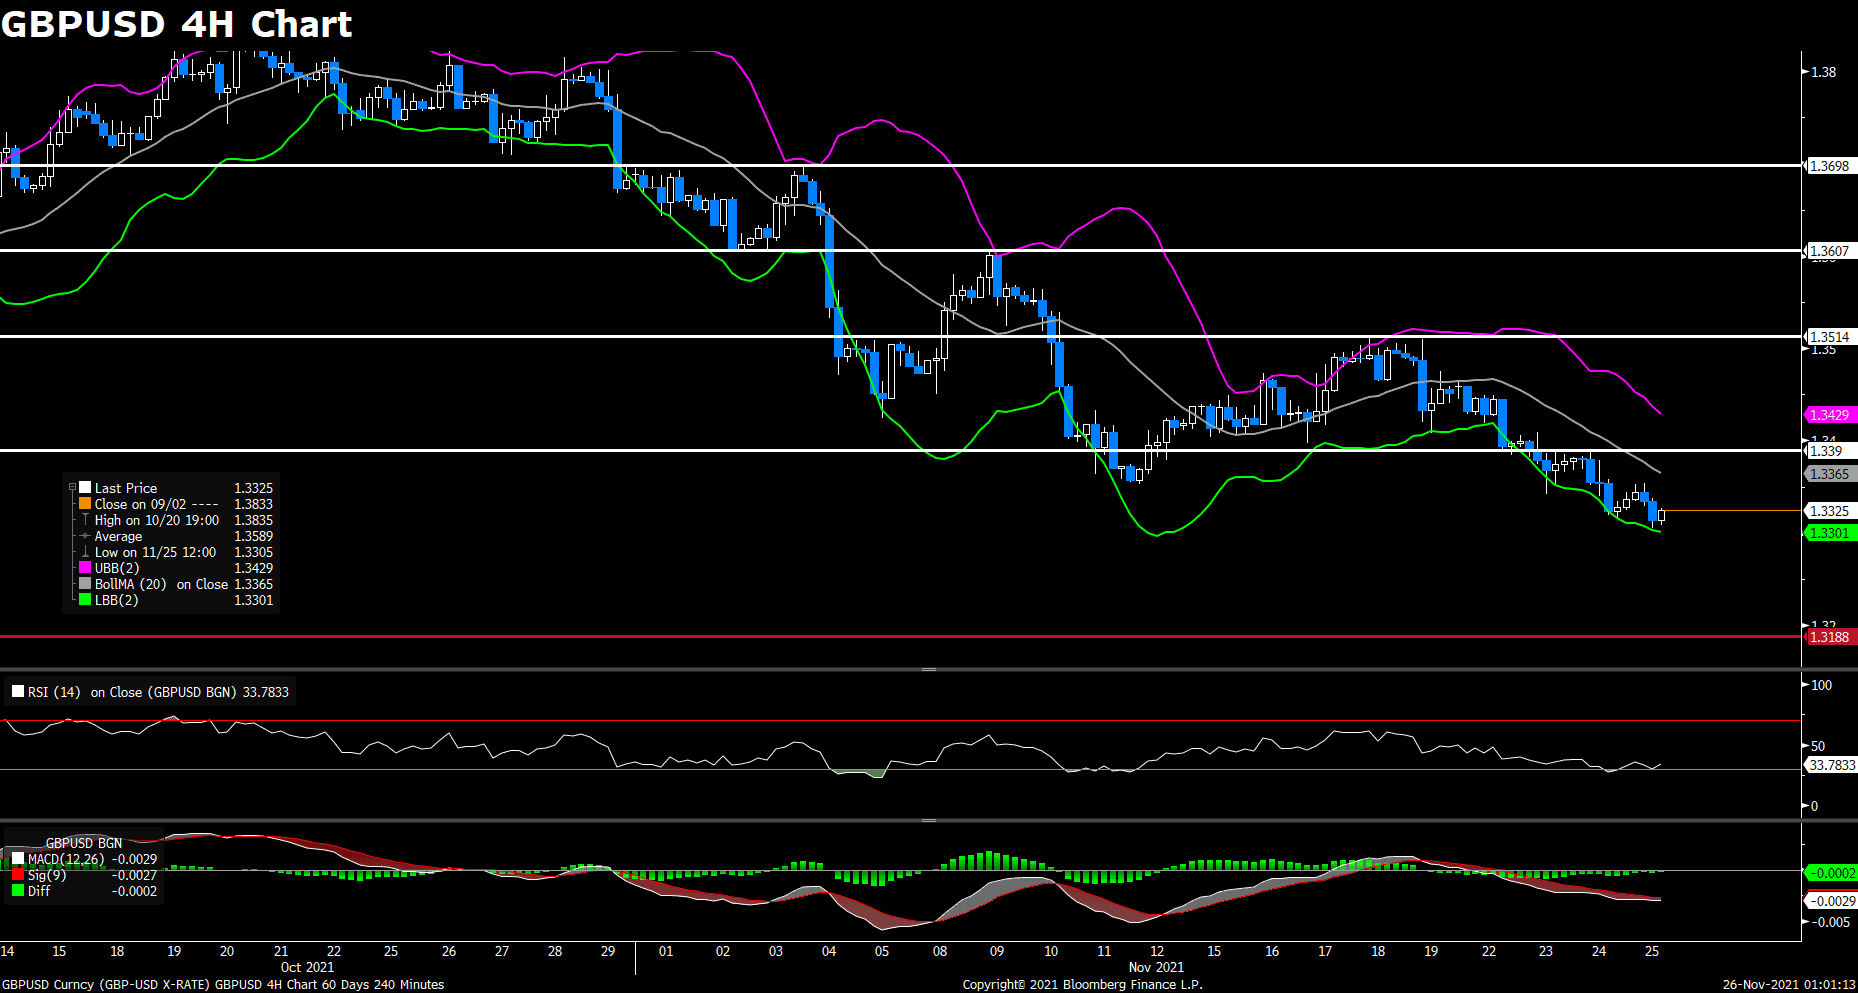
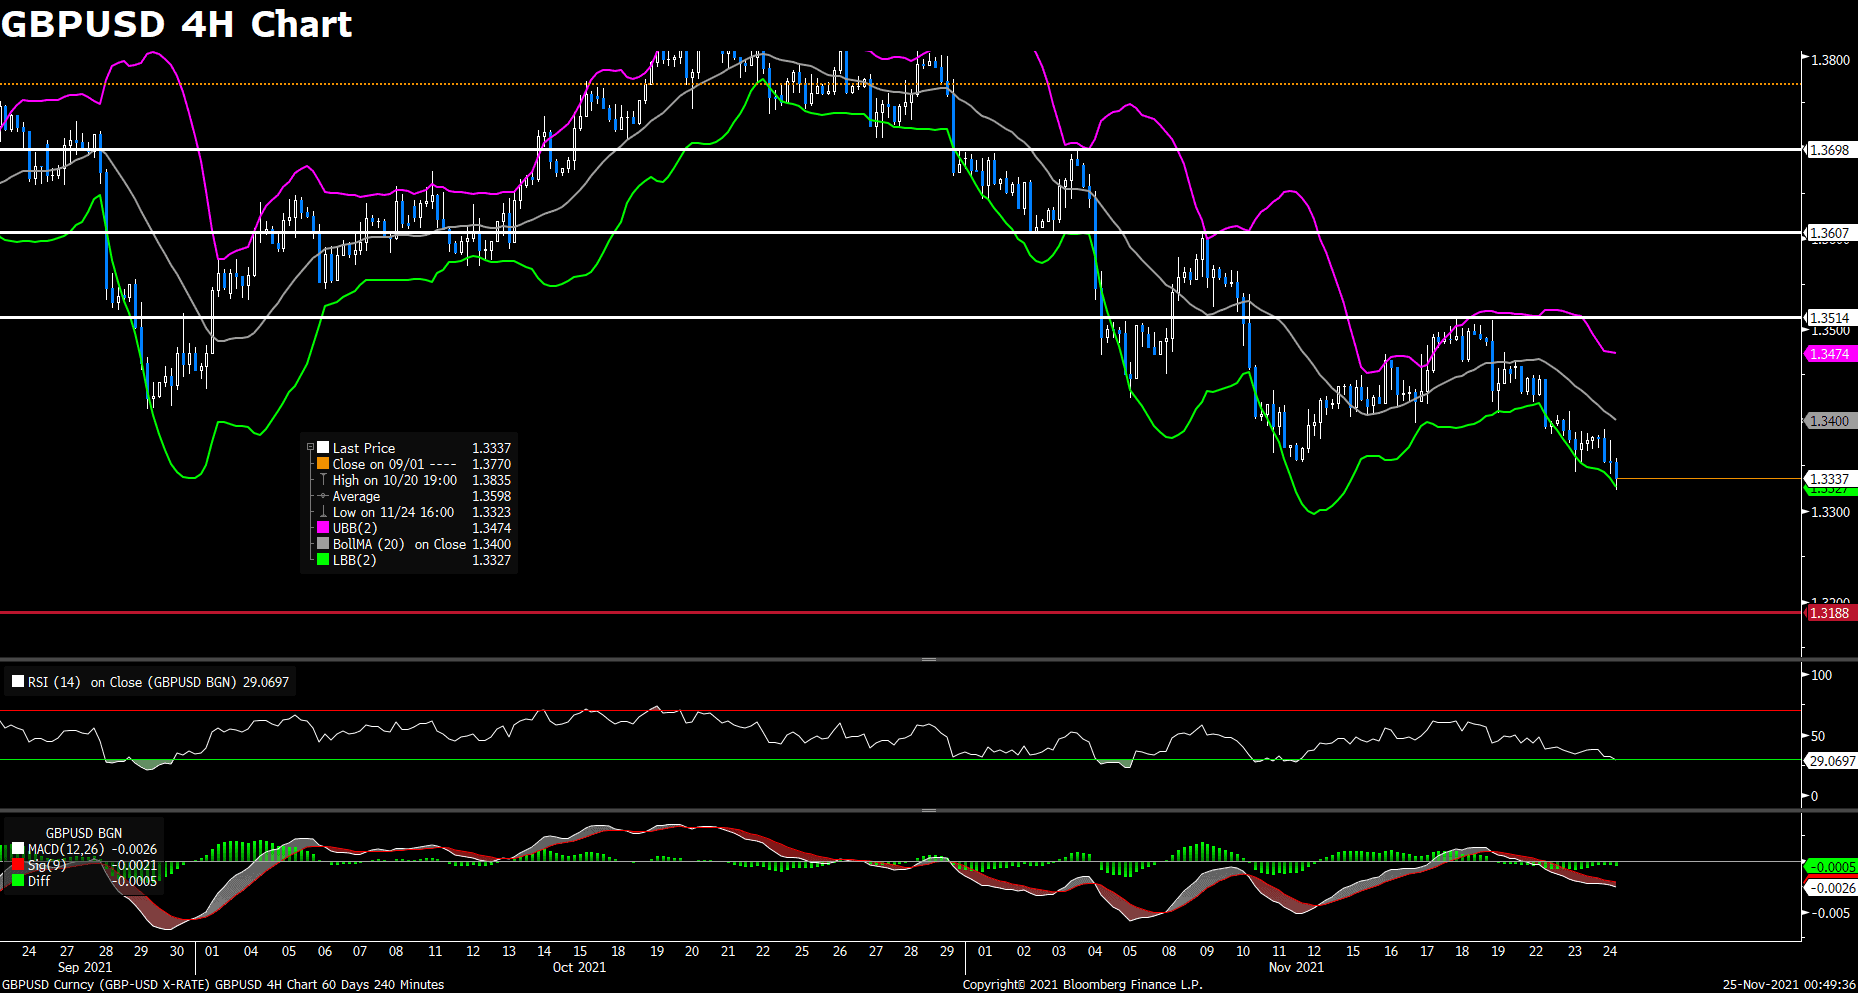
The pair GBP/USD edged higher on Wednesday, ending its previous slide to the lowest level since December 2020. The pair stayed steady to the north of the 1.330 level for most of the day and touched a daily top in American session. At the time of writing, the cable stays in positive territory with a 0.08% gain for the day. The recovery in sentiment for global equity and commodity markets acted as a tailwind for the British pound, which is one of the risk-sensitive currencies. On the economic data side, the UK Manufacturing PMI came at 58.1 for November, which is slightly lower than estimates but did little impact to the cable. Meanwhile during the testimony earlier in the session, Fed Chair Jerome Powell also reiterates that it is appropriate to consider a faster QE taper before the House Financial Services Committee.

For technical aspect, RSI indicator 46 figures as of writing, suggesting that sellers remain in control of the pair’s action in the near term. As for the Bollinger Bands, the price is sitting between the moving average and lower band, therefore the downside momentum should be stronger. In conclusion, we think market will be bearish as long as the 1.3369 resistance line holds. The hawkish tone from Powell could limit any further gains for the cable.

Resistance: 1.3369, 1.3514, 1.3607

Support: 1.3195, 1.3106


USDCAD (4- Hour Chart)

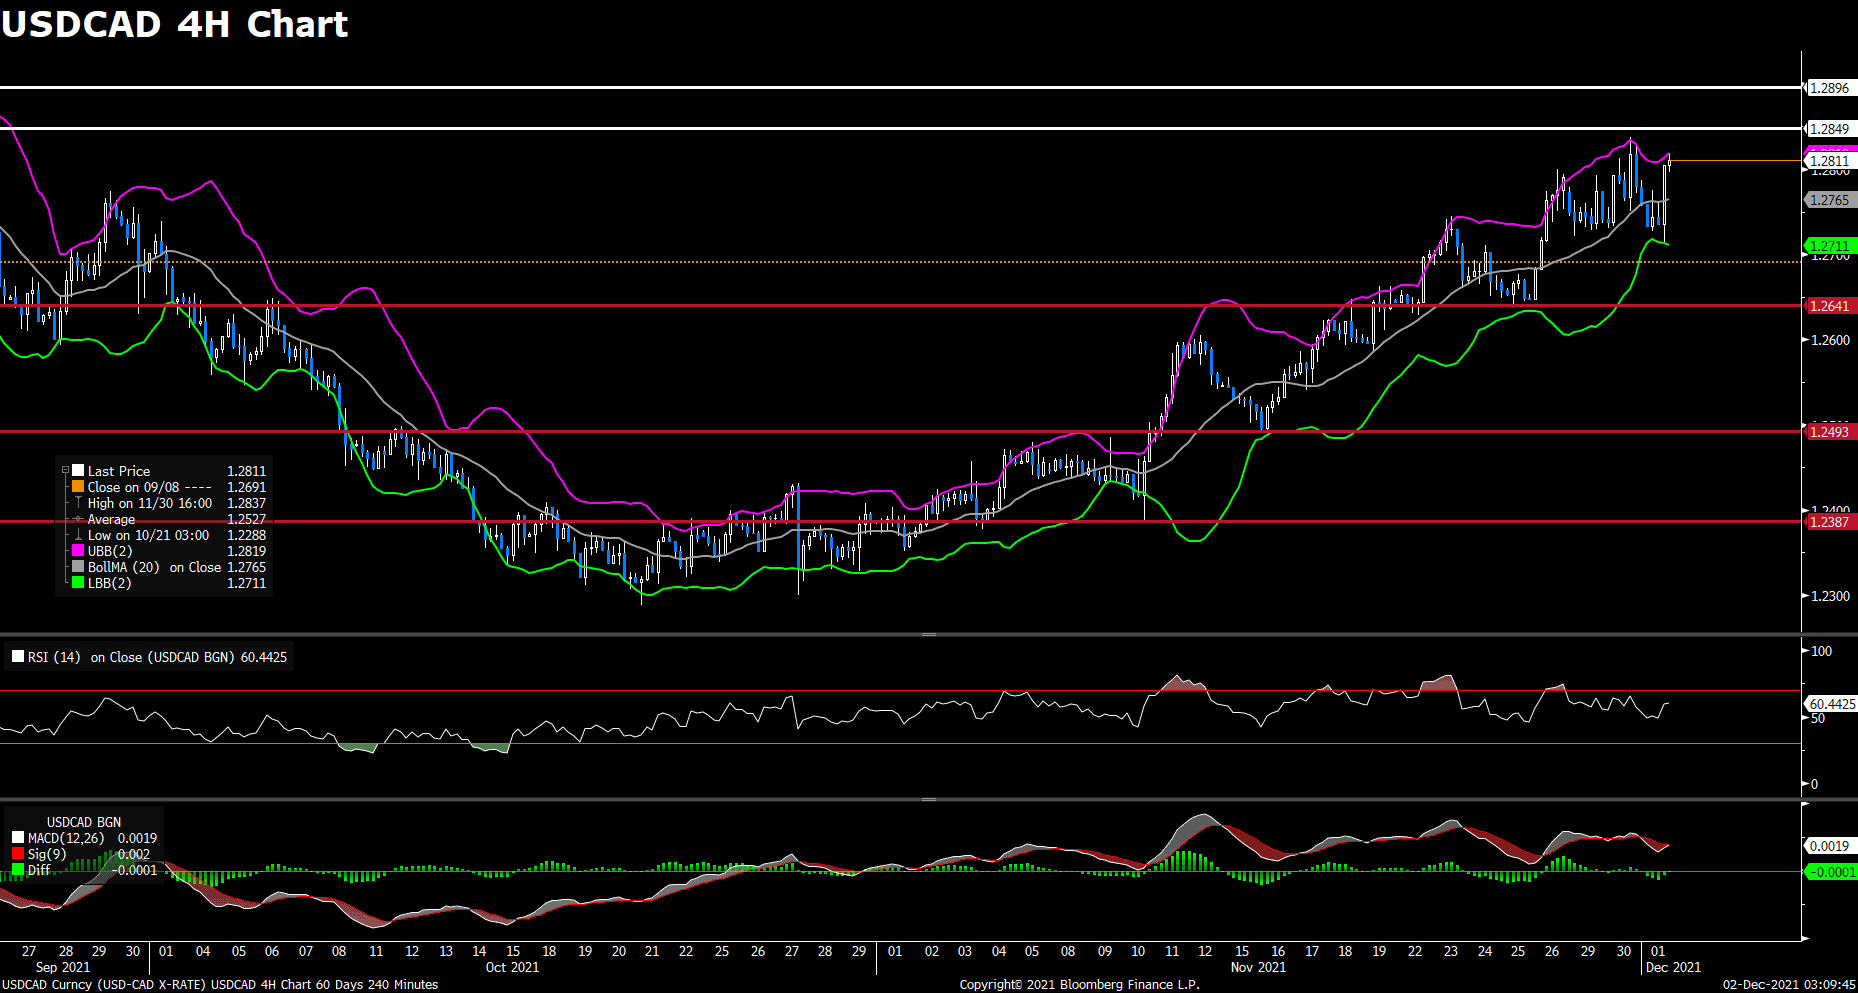
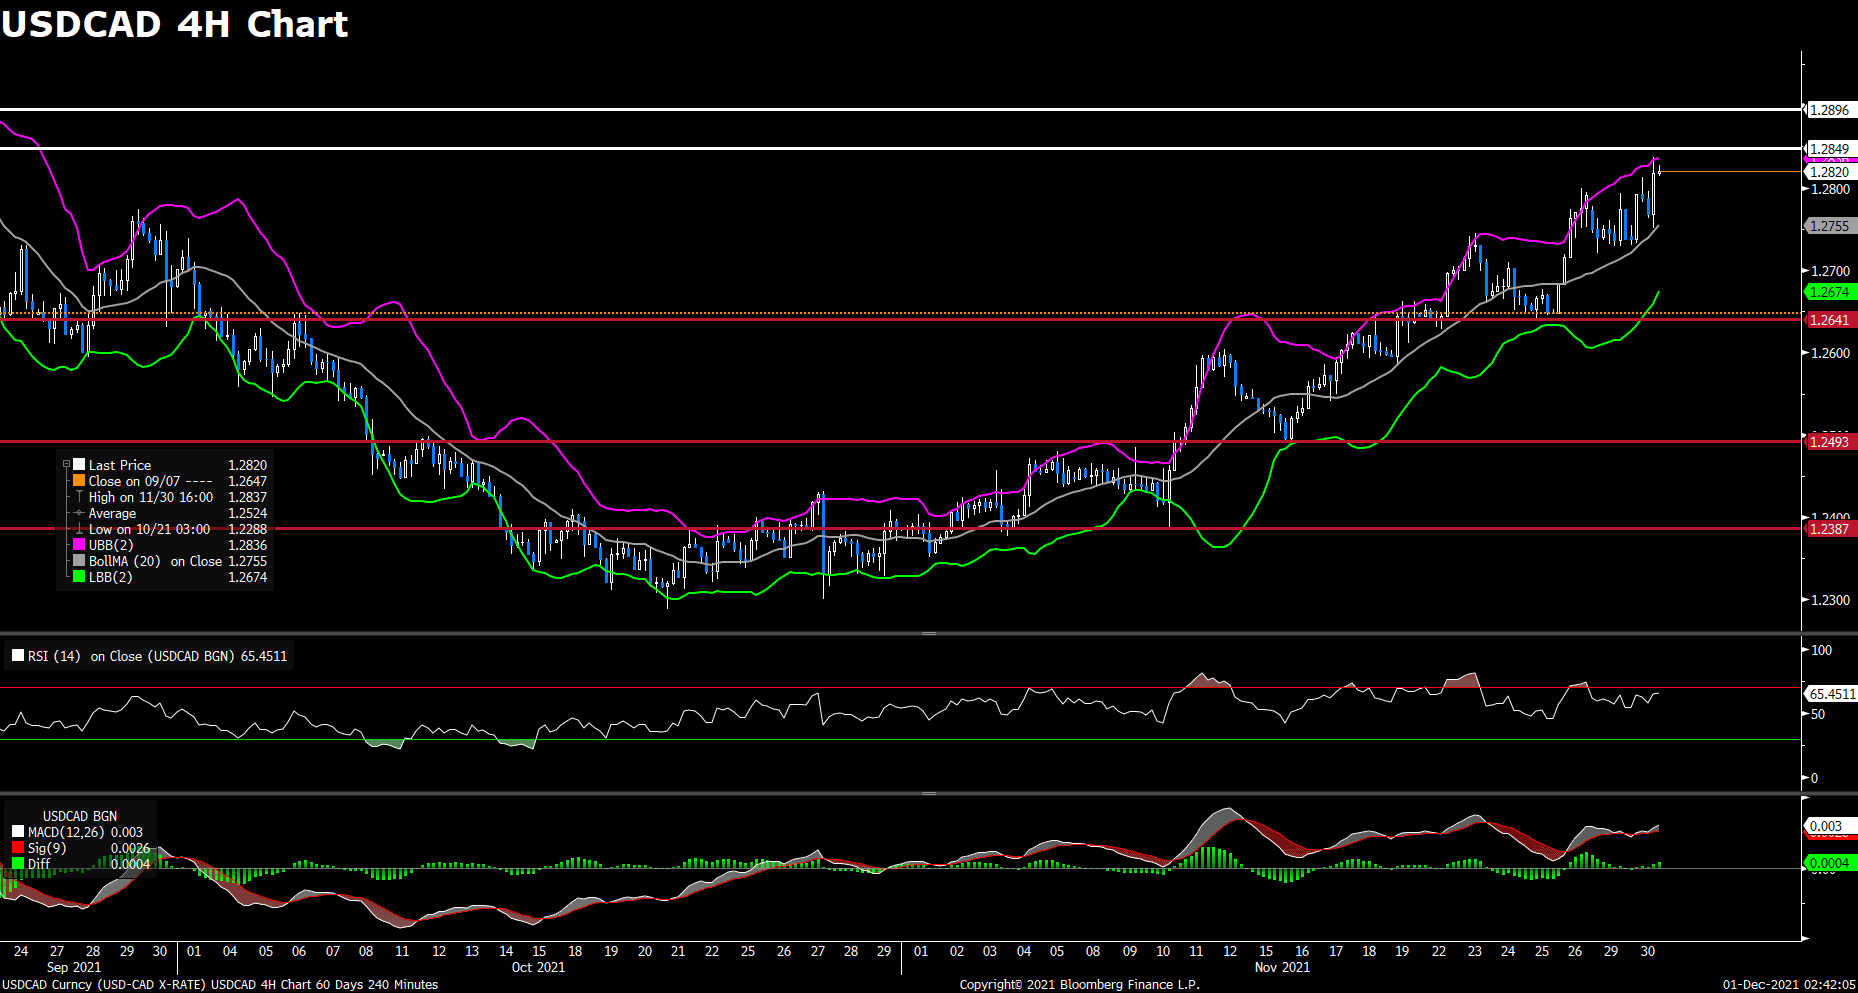
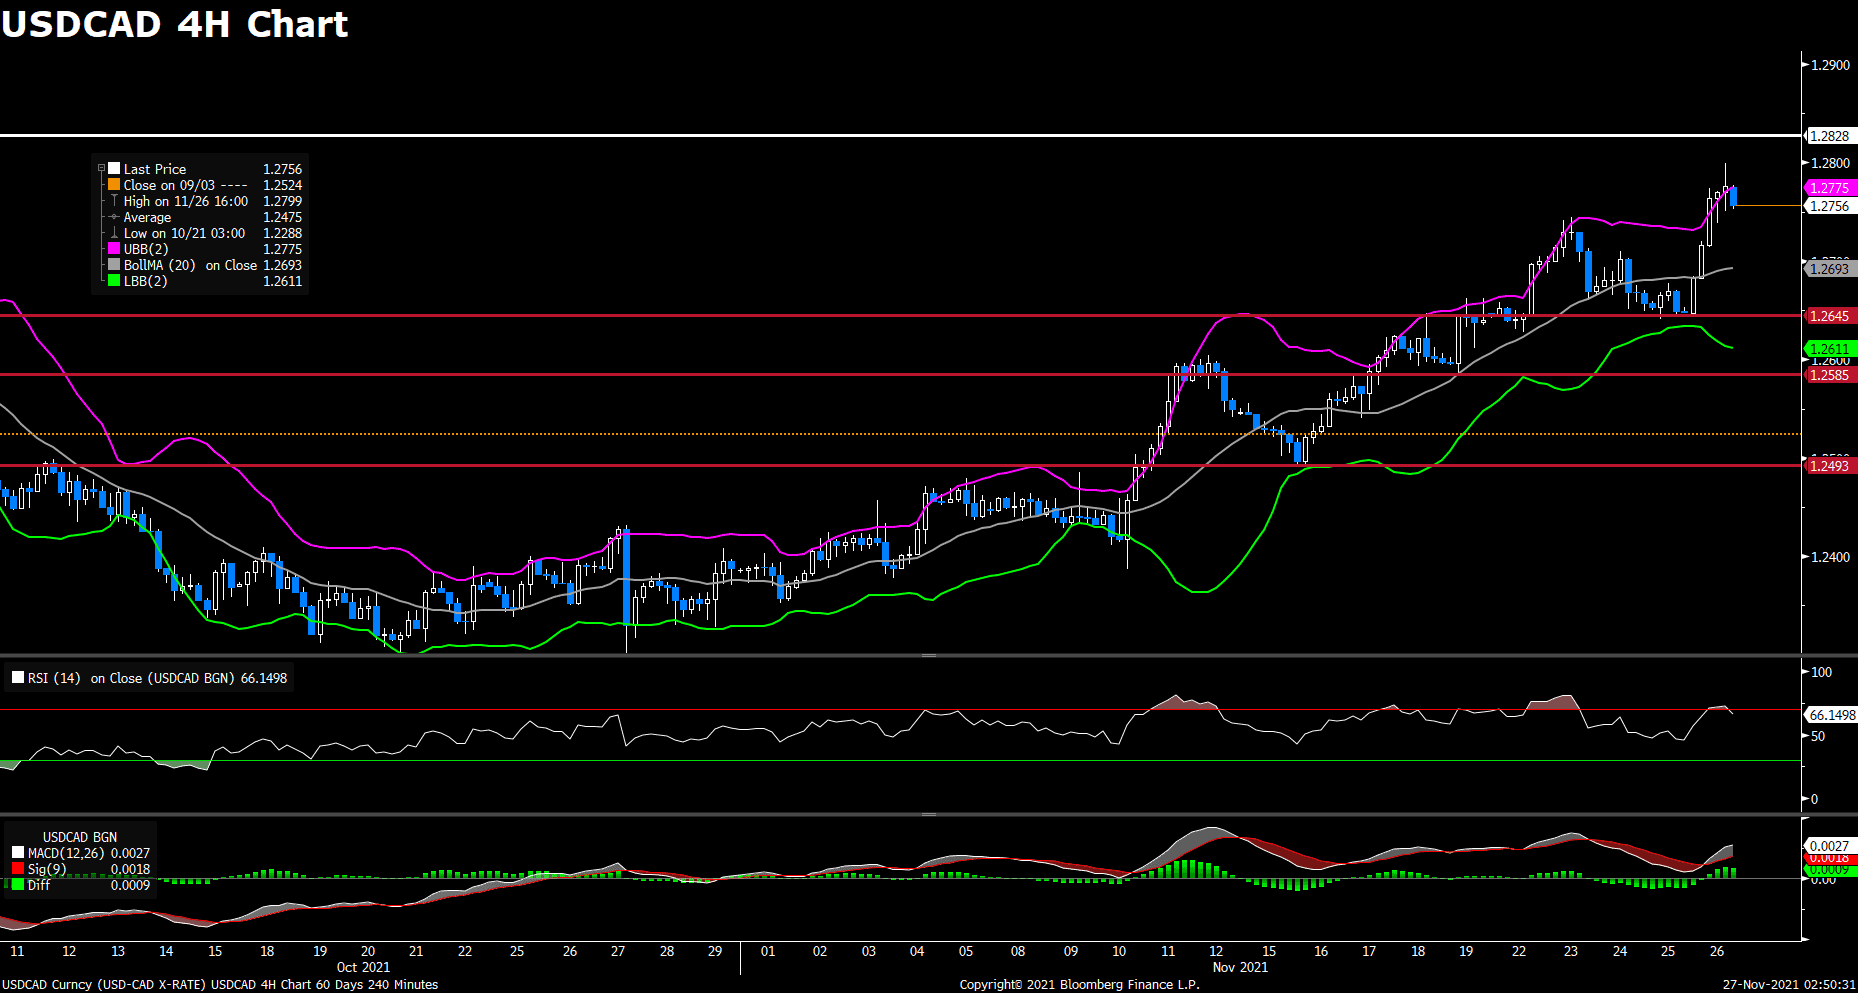
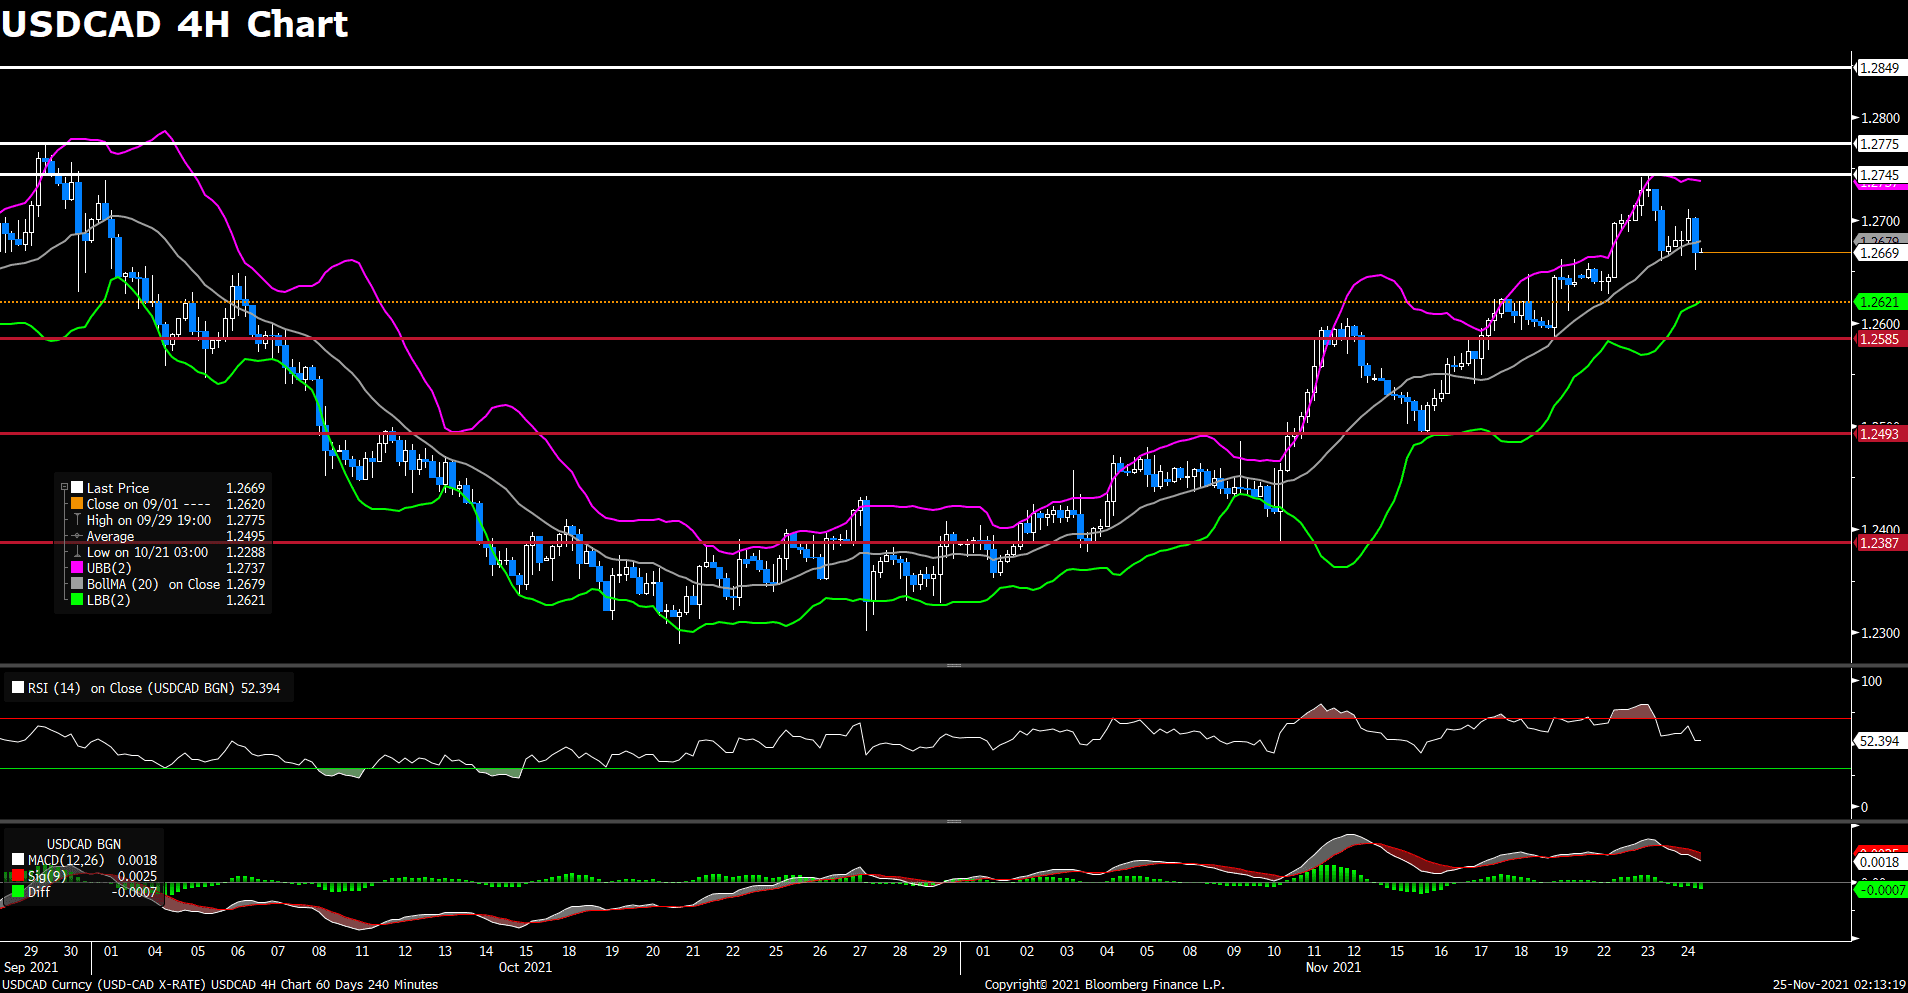
After previous day’s rally to a two-month high near 1.284 level, the pair USD/CAD preserved its upside traction and edged higher on Wednesday. The pair was surrounded by bearish momentum during Asian session, but then rebounded back above 1.278 area amid renewed US dollar strength. USD/CAD now continues to climb higher, currently rising 0.26% on a daily basis. Rising expectations for a Fed rate hike continue to lend support to the greenback and USD/CAD, as Powell said that Fed will have a discussion about accelerating taper by a few months at their next meeting. On top of that, the pullback in crude oil prices from earlier session peaks weighed on the commodity-linked loonie and pushed USD/CAD higher, as WTI oil dropping 1.43% for the day.

For technical aspect, RSI indicator 60 figures as of writing, suggesting that the upside appears more favored as the RSI still above the midline. Looking at the MACD indicator, a golden cross is forming on the histogram, which indicated upward trend for the pair. As for the Bollinger Bands, the price is from the moving average to upper band, therefore the upside traction could persist. In conclusion, we think market will be bullish as the pair is eyeing a test of the 1.2849 resistance.

Resistance: 1.2849, 1.2896

Support: 1.2641, 1.2493, 1.2387


Economic Data

Currency

Data

Time (GMT + 8)

Forecast

AUD

Retail Sales (MoM)

08:30

4.9%

USD

Initial Jobless Claims

21:30

240K

Market Focus

Stocks dropped on Tuesday as volatility resumed after a brief rebound earlier this week, with investors contemplating the impacts of a new coronavirus variant and new comments from Fed Chair Jerome Powell. Both the S&P 500 and Nasdaq declined, and the Dow Jones plummeted about 650 points, or 1.9%, intraday on Tuesday. Shares of airlines, cruise lines and lodging companies considered to be some of the most exposed to virus-related disruptions each sank in early trading to reverse Monday’s gains.

一張含有 文字 的圖片

自動產生的描述

Powell’s appetite for a faster tapering of Federal Reserve stimulus is casting him in role financial markets haven’t seen since 2018 hawk.

Stocks slid, short-term interest rates rose and VIX surged Tuesday after the central bank chairman warned that elevated inflation could justify ending asset purchases sooner than planned. Buffeted also by anxiety around the coronavirus, the S&P500 just endured its worst stretch of turbulence in more than a year.

For investors, an urgent question becomes whether Tuesday’s congressional testimony was a watershed moment for the monetary policies that have helped the S&P 500 effectively to double since Christmas 2018. That’s when Powell’s last big pivot occurred — the dismantling of interest-rate hikes that made the fourth quarter of that year one of the worst for equities ever.

“Not only is he speaking in a more hawkish tone, but he’s dropping major policy implications almost without regard to how the markets may take them,” said Max Gokhman, chief investment officer at AlphaTrAI. “All of the predictability he’s previously tried to cultivate in terms of taper and liftoff scheduling is in question.”


Main Pairs Movement:

The greenback initially dropped in the European trading hours, but soon rebounded during the US session to reach weekly highs against most of its major peers. The U-turn of the dollar derived from the two main concerns yesterday – the newest COVID variant and the Fed Chair Powell’s testimony.

The euro pair is of the best performers against the greenback, now trading at around 1.1340. Cable, however, plummeted to a fresh 2021 low of 1.3194. Safe havens posted gains on Tuesday, with USD/JPY dropped 0.33% and closed the day at 113.15, and USD/CHF plunged near 0.5% to a fresh 2-week low of 0.9158. Commodity-linked currencies are the worst. Aussie is last seen at 0.7123, down 0.11% comparing to its open price, and Loonie trades at 1.2780, even once jumped to 1.2837 intraday.

Gold plummeted after briefly advancing beyond 1,800, now trading at $1,775 a troy ounce. Crude oil prices also fell, with WTI at $66.70 a barrel, and Brent at $70.10.


Technical Analysis:

EURUSD (4- Hour Chart)

After retreating from a weekly high to under 1.128 level, the pair EUR/USD gained heavy upside traction and rebounded sharply on Tuesday. The pair continued to be surrounded by bullish momentum most of the day, touching the highest level since November 16. However, the rebound witnessed in US dollar weighed on the EUR/USD, which currently losing 0.08% on a daily basis. The concerns about new Omicron variant and rising uncertainty on the potential impact on the global economy drag the US bond yields lower, therefore keeping the greenback under pressure. In Europe, the Eurozone Consumer Price Index jumps by 4.9% in November, which is higher than market expectations. But the dovish ECB and rising Covid-19 cases might cap the upside for the pair.

For technical aspect, RSI indicator 49 figures as of writing, suggesting that the downside appears more favored as the RSI is dropping below the midline. Looking at the MACD indicator, a diminishing positive histogram also indicates that the pair may experience some downward trend. But for the Bollinger Bands, the price is falling from upper band, therefore a downward trend could be expected for the pair. In conclusion, we think market will be slightly bearish as the pair failed to break the long as the 1.1374 resistance, and a break below 1.1186 could open the road for additional losses.

Resistance: 1.1374, 1.1464, 1.1608

Support: 1.1263, 1.1186


GBPUSD (4- Hour Chart)

The pair GBP/USD declined on Monday, surrendering most of its intraday gains amid resurging US dollar. The pair was trading higher and touched a daily top near 1.337 in mid European session, but started to see heavy selling after Fed Chair Jerome Powell’s speech. At the time of writing, the cable stays in negative territory with a 0.52% loss for the day. During the speech, Powell said that it would be appropriate to consider wrapping up the bank’s QE taper a few months sooner. The Fed would also discuss speeding the QE taper at the 15 December FOMC meeting. This has lifted the greenback up sharply and put heavy pressure on the cable. Meanwhile, worries about the spread of the new coronavirus variant and the UK-EU impasse over the Northern Ireland Protocol might keep weighing on the cable.

For technical aspect, RSI indicator 32 figures as of writing, suggesting that the bearish momentum should persist for a while before there’s a trend reversal. Looking at the MACD indicator, a death cross is forming on the histogram, which also points that the pair may experience some downward trend. As for the Bollinger Bands, the price dropped out of the lower band, therefore a strong trend continuation could be expected. In conclusion, we think market will be bearish as the pair is eyeing a test of the 1.3188 support, a break below that level suggests more losses ahead for the cable.

Resistance: 1.3390, 1.3514, 1.3607

Support: 1.3188, 1.3106


USDCAD (4- Hour Chart)

The pair USD/CAD advanced to 1.283 area amid falling oil prices on Tuesday, regaining upside traction and stay in positive territory. The pair climbed to a two-month top near 1.281 level, but then pulled back moderately during European session. USD/CAD now rallies above 1.2800 on Powell’s hawkish remarks, currently rising 0.55% on a daily basis. Increasing risks of higher inflation and expectations for a faster bond taper act as a tailwind for the US dollar and push USD/CAD higher. On top of that, WTI oil drops below $66 amid deterioration in market sentiment, as Moderna’s CEO said that he believes the vaccine effectiveness would probably be less effective against the new variant. As for now, the dampened outlook for jet fuel demand will keep putting pressure on the commodity-linked loonie.

For technical aspect, RSI indicator 65 figures as of writing, suggesting that the bullish momentum should persist for a while before there’s a trend reversal. As for the Bollinger Bands, the price is from the moving average to upper band, therefore the upside traction could persist. In conclusion, we think market will be bullish as the pair is heading to test the 1.2849 resistance.

Resistance: 1.2775, 1.2849

Support: 1.2641, 1.2493, 1.2387


Economic Data


Currency

Data

Time (GMT + 8)

Forecast

AUD

GDP (QoQ) (Q3)

08:30

-2.7%

CNY

Caixin Manufacturing PMI (Nov)

09:45

50.5

EUR

German Manufacturing PMI (Nov)

16:55

57.6

GBP

Manufacturing PMI (Nov)

17:30

58.2

USD

ADP Nonfarm Employment Change (Nov)

21:15

525k

GBP

BoE Gov Bailey Speaks

22:00


USD

Fed Chair Powell Testifies

23:00


USD

ISM Manufacturing PMI (Nov)

23:00

61.0


USD

Crude Oil Inventories

23:30

-1.237M


Won Tien Ching joins VT Markets as regional business development director

30 November 2021, Sydney, Australia – VT Markets are delighted to welcome Won Tien Ching to the company as Regional Business Development Director.

VT Markets, one of the leading multi-asset trading platforms, announced the appointment of Won Tien Ching, former Chief Marketing Officer of Singapore at HGNH International Asset Management (HGNH AM) as the company’s Regional Business Development Director today.

Won has over 12 years of experience in the international financial services industry and in his newly appointed role, will support VT Markets achieve their marketing and business goals on a global level. The multi-asset trading services provider is planning to utilize the extensive experience of Mr. Won to progress the company’s expansion in different regions.

In his latest role at HGNH International Asset Management, Won led the company’s Sales and Marketing team for the execution of expansion in the region. In his new position at VT Markets, Won will focus on introducing high-profile partnerships and business development to cover the whole client lifecycle.

Won comments:

“I am delighted to join VT Markets at this juncture where there is an adventure awaiting and bigger targets to achieve with the team. VT Markets has shown its impressive capability to grow in the past few years and now we are targeting new markets and higher-value customers and partners. I would also like to inculcate a workplace culture that provides considerable latitude in exploring creative ways of achieving goals and embracing constant changes, whilst being disciplined enough to adhere to guidelines and targets set by the company. With this approach, I believe VT Markets will continue to grow and expand into new territories; building on their excellent brand credibility and top-notch services.”

VT Markets are excited to welcome Mr. Won to the team.

About VT Markets

VT Markets, based in Sydney, Australia, is a subsidiary of VT Markets LLC (VIG) and leverages more than 10 years of experience and expertise in global financial markets to offer easy and transparent market access and help our clients pursue their financial goals. Founded in 2016, VT markets has applied for advanced technical support in the retail FX market to provide clients with superior trading experience.

For inquiries, please contact [email protected] or visit www.vtmarkets.com

Market Focus

Global equities plummeted on Friday, with a new COVID variant discovered in South Africa rising concerns that new lockdown policies could be imposed and hindered the recovery of the economy once it gets widely spread. In Asia, Japan’s Nikkei 225 dropped 2.53%, and Hong Kong’s HSI slumped 2.67%; in the US, Dow Jones slid 2.52% to 34900.79, and the Nasdaq Composite declined 2.23% to 15491.66.

一張含有 文字 的圖片

自動產生的描述

The World Health Organization is urging caution after two South African health experts, including the doctor who first sounded the alarm about the omicron variant, indicated that symptoms linked to the coronavirus strain have been mild so far.

“Understanding the level of severity of the omicron variant will take days to several weeks,” WHO said in a statement Sunday, adding that “there is currently no information to suggest that symptoms associated with omicron are different from those from other variants.”

The latest variant wreaked havoc in global markets on Friday, and early signs in Asia suggest an uneasy start to the new week as traders digest omicron’s initial impact and spread. Equity futures for Japan, South Korea and Australia pointed lower, while currencies were generally steady. The South African Rand strengthened.

The U.K. government will convene an urgent meeting of Group of Seven health ministers on Monday to discuss the latest developments, according to the country’s Department of Health. In the U.S., President Joe Biden will give an update also on Monday, the White House said.


Main Pairs Movement:

After a warm and cozy Thanksgiving holiday, the global forex market got smashed as the unexpected fresh panic toward the new founded COVID variant frustrated sentiments. Commodities plunged harshly amid the American trading hours, especially the crude oil down more than 10%, and the dollar index dropped 0.74% due to concerns that Fed may propone rate hike schedule to July from June 2022.

Benefitting from the weakness of the greenback, most major currencies posted gains against their American peer. Cable ended its weeklong decline and gained mildly 0.14% to 1.3337, and the euro pair even surged around 100 pips to regain 1.1300. Safe-haven currencies are the best performers during the Friday’s chaos, with USD/CHF plummeted 1.21% and USD/JPY dived 1.82% which once breached the key level 113.00. On the flip side, commodity-linked currencies got left behind as the crash of the oil price. AUD/USD went down 1.04%, while USD/CAD surged 1.11%.

Gold price got a roller-coaster ride on Friday, as the price first stretched to the north on the Europe session, and then rolled down accordingly after the US dollar’s fall amid the dismal Wall Street opening. Oil price got wrecked the most, as both WTI and Brent nosedived more than 10%, back to the price levels two months ago. WTI closed the day at $68.16, and Brent at $72.86.


Technical Analysis:

EURUSD (4- Hour Chart)

The pair EUR/USD advanced and gathers upside traction on Friday, continuing its previous rebound from 2021 lows under 1.119 level. The pair started to see heavy buying in early European session and touched a fresh weekly high near 1.130 area at the time of writing. EUR/USD was supported by US dollar weakness, currently rising 0.87% on a daily basis. The falling US dollar is mainly due to the resurgence of coronavirus concerns, as a new variant appeared in Southern Africa. Investors now worry that if new Covid-19 variant does spread globally and damages the global economic recovery, this will leaves the greenback more vulnerable to a dovish Fed policy expectations. But gains for the EUR/USD pair seems to be limited, as the dovish ECB and rising Covid-19 cases both act as a headwind.

For technical aspect, RSI indicator 62 figures as of writing, suggesting that the bullish momentum should persist for a while before there’s a trend reversal. The MACD is also sitting way above the signal line, which means a strong upward trend for the pair. Looking at the Bollinger Bands, the price rose out of the upper band, therefore a trend continuation could be expected. In conclusion, we think market will be bullish as the pair is eyeing a test of the 1.1374 resistance.

Resistance: 1.1374, 1.1464, 1.1608

Support: 1.1186, 1.1115


GBPUSD (4- Hour Chart)

After dropping to a yearly low near 1.328 area, the pair GBP/USD rebounded slightly back on Friday. The pair was trading lower and struggled in negative territory during Asian session, but then surrounded by bullish momentum after European session started. At the time of writing, the cable reverses its intraday loss with a 0.02% gain for the day. The GBP/USD gained some bullish traction today amid weaker US dollar across the board, as the benchmark 10-year US Treasury bond yield is falling nearly 7% and weighing heavily on the greenback. Meanwhile in UK, after new Covid-19 variant appeared in Southern Africa, the British Health Secretary Sajid Javid announced on Friday that flights from six African countries will be banned from now on.

For technical aspect, RSI indicator 39 figures as of writing, suggesting that the downside appears more favored as the RSI still holding below the midline. As for the Bollinger Bands, the price is falling after touching the moving average, therefore the downward trend should remain. In conclusion, we think market will be bearish given that its technical correction today could be temporary, since the fundamental outlook doesn’t yet point to a steady recovery.

Resistance: 1.3390, 1.3514, 1.3607, 1.3698

Support: 1.3188


USDCAD (4- Hour Chart)

Following its previous three-day slide, the pair USD/CAD rebounded sharply to 1.278 area on Friday amid falling oil prices. The pair continued to climb higher most of the day and touched the highest level since September 22. USD/CAD had pulled back since then and surrendered some of its intraday gains, currently rising 0.86% on a daily basis. Despite the greenback tumbled 0.75% today, USD/CAD still rallied amid risk-off market mood. The new South African Covid-19 variant, which have more mutations and evade vaccines, are pushing countries across the world to start implementing travel restrictions. Therefore the concerns about fuel demand sent the oil prices below $70, meanwhile underpinned the USD/CAD pair.

For technical aspect, RSI indicator 66 figures as of writing, suggesting the bullish momentum should persist for a while before there’s a trend reversal. Looking at the MACD indicator, the MACD is now sitting above the signal line, which means a upward trend for the pair. As for the Bollinger Bands, the price moved out of upper band and dropped immediately back inside the band, therefore the suggested strength is negated. In conclusion, we think market will be bearish as long as the 1.2828 resistance line holds. The pair is likely to experience technical correction after accelerating the upward move.

Resistance: 1.2828

Support: 1.2645, 1.2585, 1.2493


Economic Data

Currency

Data

Time (GMT + 8)

Forecast

USD

Fed Chair Powell Testifies

23:00

USD

Pending Home Sales (MoM) (Oct)

23:00

1.0%

Is VT Markets a Trusted Forex Broker in Hong Kong?

The forex market is regarded as the largest financial market globally, handling trillions of dollars in trades daily. In Hong Kong, investors actively seek the best brokers to trade forex, precious metals, indices, share CFDs, and trending assets like digital currencies. With thousands of brokers available, determining whether a broker is legitimate (and not a scam) can be a daunting task. For Hong Kong investors, especially those trading online, it is crucial to thoroughly research a broker before committing funds and starting to trade.


The first and most important question you should ask is, “Is this broker regulated?” In Hong Kong’s trading landscape, regulation is a key safeguard against scams. Scam brokers don’t answer to any governing authority, which means if they cheat you—whether by causing intentional slippage, blocking withdrawals, or other unfair practices—you’re left with little recourse. At best, you might leave a negative review online to warn others. But that doesn’t help recover your funds. An easy way to check if a broker is legitimate is to scroll to the footer of their website, where regulatory information is usually listed. Always double-check this to stay safe!


A regulated broker always includes proper risk disclaimers and regulatory information at the bottom of all their website pages. VT Markets is a fully regulated broker, which has been in the financial service industry for over a decade. VT Markets have entities that are regulated under the Australian Securities and Investments Commission (ASIC), and the Financial Sector Conduct Authority (FSCA).


After confirming the broker is regulated, the next thing you should do is to determine whether the regulatory body is trustworthy. Regulators such as International Financial Services Commission (IFSC), Securities Commission of The Bahamas (SCB) and Seychelles International Business Authority (SIBA) are certainly not as trustworthy as Australian Securities and Investments Commission (ASIC), Cyprus Securities & Exchange Commission (CySEC) and Financial Conduct Authority (FCA). Some regulatory body such as St. Vincent & the Grenadines does not monitor or regulate forex companies, thus a lot of scam brokers has St. Vincent & the Grenadine listed as their regulatory body, which means their investors are not protected at all. Here is a list of the regulatory bodies that are mostly recognized by investors:


  • Financial Conduct Authority (FCA) – United Kingdom
  • Cyprus Securities & Exchange Commission (CySEC)– Cyprus
  • Australian Securities & Investment Commission (ASIC) – Australia
  • Monetary Authority of Singapore (MAS) – Singapore
  • Financial Services Agency (FSA) – Japan
  • Cayman Islands Monetary Authority (CIMA) – Cayman Islands


FAQ: How to Verify a Forex Broker’s Legitimacy in Hong Kong

Why is broker regulation important for Hong Kong traders?

Regulation ensures that brokers operate transparently and comply with strict financial standards. It provides traders with protection against fraud and unfair practices.

How can I check if a broker is regulated?

Visit the broker’s website and check the footer for regulatory information. Cross-check the details with the official website of the regulatory authority to confirm authenticity.

What are the top regulatory bodies globally recognized by traders?

Reputable regulators include the Australian Securities & Investment Commission (ASIC), Financial Conduct Authority (FCA), Cyprus Securities and Exchange Commission (CySEC), and Monetary Authority of Singapore (MAS).

Is trading with an unregulated broker always risky?

Yes, unregulated brokers are not held accountable by financial authorities, meaning they can engage in fraudulent activities without repercussions. Always trade with regulated brokers.

What should I do if I suspect a broker is a scam?

Avoid depositing funds and report the broker to the relevant financial authority. Additionally, share reviews online to warn other traders.

Are all offshore regulatory bodies unreliable?

Not necessarily, but many offshore regulators have lax enforcement. Stick to brokers regulated by well-known authorities like ASIC, FCA, or MAS for better protection.

What makes VT Markets a secure choice for Hong Kong traders?

VT Markets is regulated by ASIC and CIMA, providing a safe and transparent trading environment. Their platforms are designed to protect clients’ funds and ensure fair trading practices.

Can awards or sponsorships prove a broker’s legitimacy?

While awards and sponsorships enhance credibility, they cannot replace proper regulation. Always prioritize a broker’s regulatory status over accolades.

How can Hong Kong traders avoid forex scams?

Research brokers thoroughly, check their regulation status, and start with a small deposit. Additionally, avoid brokers that offer unrealistic profit guarantees.

Is VT Markets suitable for beginners?

Yes, VT Markets provides a transparent, regulated environment with user-friendly platforms, educational resources, and demo accounts for new traders.


VT Markets is regulated by ASIC and CIMA – two of the commonly recognized regulatory bodies. Our clients are well-protected.


In conclusion, always verify a broker’s regulatory status before transferring any funds. Regulation is the key factor that ensures the safety of your investments. While other details like awards, company history, or corporate sponsorships might enhance a broker’s reputation, they do not confirm its legitimacy without proper regulatory oversight. Prioritizing regulation is essential to protecting your capital when trading in Hong Kong.

Market Focus

Eurozone’s October inflation rate hit a 13-year high of 4.1%, well above the European Central Bank’s 2% target, prompting some investors to bet that the European Central Bank will raise interest rates next year. But the Council of the European Central Bank believed that many of the factors driving inflation higher this year may subside next year, albeit at a slower pace than recently predicted.

Although the possibility of raising interest rates at the earliest next year is small, investors can still look forward to the European Central Bank’s December meeting. Most people expect that the central bank will decide on the 1.85-ton bond purchase plan launched last year in response to the epidemic and stop new purchases in March 2022.

As a compromise between the doves and the hawks, the European Central Bank continues to expect to supplement the monthly pace of the asset purchase plan of 20 billion euros with a fixed-scale envelope of approximately 200 billion euros. In addition, the European Central Bank also proposed a new bond purchase plan that can cope with market fluctuations.


Main Pairs Movement:

As the US market was closed for the Thanksgiving holiday, the market is quiet on Thursday. The market will shorten working hours on Friday, and trading is expected to continue to be quiet.

GBP/USD fell to a new low of 1.33053 in 2021 and closed at 1.33181. Affected by concerns about Brexit, the price trend has hardly changed and maintained a downward trend.

USD/JPY basically remained above the 115.3 area. With the Thanksgiving holiday, the momentum of the dollar has eased, and the yen has also respite. At the time of writing, the currency has fallen below the 115 level and hovered at 114.9.

After touching the 1.1190 area for two consecutive days, the EUR/USD surged to 1.1229 today and closed above 1.1200. It seems that it has finally gained some support and successfully rebounded.

The gold market is also very calm, with precious metals stable at around $1,790 per troy ounce. Crude oil prices fell slightly, but WTI crude oil prices remained above $78.00 per barrel.


Technical Analysis:

EURUSD (4- Hour Chart)

After previous day’s slide to a 2021 low under 1.119 level, the pair EUR/USD regained bullish momentum and rebounded back on Thursday. The pair was trading higher at the start of the day and touched a fresh daily high near 1.123 area, but now has pulled back slightly at the time of writing. EUR/USD was supported by US dollar weakness, currently rising 0.14% on a daily basis at the time of writing. In the US, markets are likely to be flat due to Thanksgiving holiday, and the greenback dropped to 96.74 area after reaching yearly tops. In Europe, ECB Publishes Account of Monetary Policy Meeting released today highlighted that net purchases under the PEPP could be expected to come to an end by March 2022, which did not contain any surprises.

For technical aspect, RSI indicator 33 figures as of writing, suggesting that the bearish momentum should persist for a while before there’s a trend reversal. Looking at the Bollinger Bands, the price is falling from the moving average, which means that the downward trend is likely to persist. In conclusion, we think market will be bearish as the pair is heading to re-test the 1.1186 support, a beark below that level would target 1.1115 support that touched in June 2020.

Resistance: 1.1275, 1.1374, 1.1464

Support: 1.1186, 1.1115


GBPUSD (4- Hour Chart)

The pair GBP/USD updated its yearly low on Thursday, following previous slide to 1.331 area for the fifth day. The pair climbed higher during Asian session and touched a daily high, but then failed to preserve its bullish momentum. At the time of writing, the cable stays in negative territory with a 0.04% loss for the day. The GBP/USD pair remained under pressure despite US dollar weakness, but the greenback’s corrective pullback should be alleviated amid growing market expectation of a more aggressive policy from the Fed due to rising inflationary pressures. Meanwhile, the worsen situation over the post-Brexit fishing rights between France and UK keep acting as a headwind for the cable.

For technical aspect, RSI indicator 33 figures as of writing, suggesting that the downside appears more favored as the RSI still holding below the midline. Looking at the MACD indicator, the MACD is now sitting below the signal line, which means a downward trend for the pair. As for the Bollinger Bands, the price still staying between the lower band and moving average, therefore the downward trend should remain. In conclusion, we think market will be bearish as a drop to the 1.32 area appears likely.

Resistance: 1.3390, 1.3514, 1.3607, 1.3698

Support: 1.3188


USDCAD (4- Hour Chart)

The pair USD/CAD declined on Thursday, continuing its slide from a monthly high near 1.275 area that touched earlier this week. During early European session, the pair started to see fresh buying and reached daily top above 1.267 level. USD/CAD had pulled back since then and surrendered its intraday gains, currently posting a 0.14% loss on a daily basis. Weaker US dollar across the board today dragged the pair lower, though market conditions are currently very thin amid the Thanksgiving holiday. On top of that, the recovery in oil prices acted as a tailwind for the commodity-linked loonie.

For technical aspect, RSI indicator 46 figures as of writing, suggesting tepid bear movement ahead. Looking at the MACD indicator, the MACD is now sitting below the signal line, which means a downward trend for the pair. As for the Bollinger Bands, the price dropped off the upper band and then crosses below the moving average, the lower band then becomes the loss target. In conclusion, we think market will be bearish as the pair is eyeing a test of the 1.2585 support.

Resistance: 1.2475, 1.2849

Support: 1.2585, 1.2493, 1.2387


Economic Data

Currency

Data

Time (GMT + 8)

Forecast

AUD

Retail Sales (MoM) (Oct)

08:30

2.5%

EUR

ECB President Lagarde Speaks

16:00

VT Markets Notification of Server Upgrade

Dear Client,

As part of our commitment to providing the best reliability and service to our client, we are planning an upgrade in our MT4/MT5 server on this weekend.

As a result, we will keep the maintenance according to the following schedule and will reopen for trading at 00:00 (GMT+2, system time) on Monday, November 29, 2021.

Kindly be reminded that the following things might be affected during this maintenance period:

1. The login and operation of the client portal

2. The login of the trading account

3. Demo accounts will be temporarily unavailable for opening/logging/trading.

4. The quotations on MT4 / MT5 server will be paused. Clients might not be able to open new positions or close the held positions.

5. There might be a gap between the original price and the price after maintenance. Pending orders, Stop Loss, and Take Profit settings within the gap will be filled at the market price after maintenance ends.

After the upgrade, clients can login to trading account using the server which is shown in the account activation mail.

No action is required by our client. Your service will be back online after the maintenance is completed.

Thank you for your patience and understanding with regard to this important initiative.

If you’d like more information, please don’t hesitate to contact [email protected].

VT Markets The Adjustment Of Weekly Dividend Notification

Dear Client,

Warmly reminds you that the component stocks in the stock index spot generate dividends. When dividends are distributed, VT Markets will make dividends and deductions for the clients who hold the trading products after the close of the day before the ex-dividend date.

Indices dividends will not be paid/charged as an inclusion along with the swap component. It will be executed separately through a balance statement directly to your trading account, the comment for which will be in the following format “Div & Product Name & Net Volume ” .

Please note the specific adjustments as follows:

Note: The above data is for reference only, the actual execution data may be changed, please refer to the MT4/MT5 software for details.

If you’d like more information, please don’t hesitate to contact [email protected].

Market Focus

The US indices edged higher on Wednesday, and technology stocks rebounded due to the slowdown in the rise in bond yields. The recent increase in yields is due to the decision of President Joe Biden, who re-nominated Jerome Powell as chairman of the Federal Reserve on Monday. After the 10-year US Treasury bond yield closed at 1.55% on last Friday, it traded above 1.68% this week. However, the ratio fell to about 1.64% on Wednesday.

At the end of the market, the S&P 500 Index rose 0.23% to close at 4,701.46, the Nasdaq Composite Index rose 0.44% to 15,845.23, and the Dow Jones Industrial Average fell only 9.42 points to close at 35,804.38. The Nasdaq Composite Index, which is dominated by technology stocks, outperformed the broader market, mainly due to the 1.1% increase in the stock price of Facebook’s parent company Meta, the increase in Apple’s stock price by 0.33% and the TSLA increase by 0.63%.

一張含有 文字 的圖片

自動產生的描述

There are slightly more falling stocks in the S&P 500 index than rising stocks. The gains in technology, real estate and energy stocks outpaced declines in banks, materials companies and other parts of the market. Currently, there are several company will released latest quarterly report. Computer manufacturer HP rose 10.10% after announcing solid financial results, Autodesk shares fell 15.5% after the design software company warned investors that its pace of recovery is being affected by supply chain issues and inflationary pressures. As crude oil prices remained relatively stable and natural gas prices rose, energy stocks rose. Devon Energy rose 3.8%.


Main Pairs Movement:

After a series of U.S. data suggest that inflationary pressures remain high and the Fed is about to take action to deal with its impact on the economy, demand for the U.S. dollar continues.

According to the CPI report, U.S. inflation surged to its highest level in 30 years in October. In addition, at the FOMC meeting held yesterday, the statement showed that if inflation continues to heat up, they will be prepared to adjust the pace of production cuts and raise the target range of the federal funds rate in advance. However, since the announcement was not unexpected, the market response was very limited.

Affected by local data and the European Central Bank’s inaction, the EUR/USD fell below the pivot support level of 1.1200 and failed to hold. In addition to market sentiment, another factor affecting the euro is the re-spread of the coronavirus in Europe.

GBP/USD is facing bearish pressure again and is currently in the 1.33362 area. The USD/JPY reached a new high of 115.51 in 2021 and remained stable near the close. AUD/USD is currently trading below 0.7200, and USD/CAD is trading near 1.2670.


Technical Analysis:

EURUSD (4- Hour Chart)

After previous day’s slightly rebound from a sixteen-month lows, the pair EUR/USD was surrounded by heavy selling pressure again on Wednesday. The pair was flirting with 1.124 area to start the day and touched a daily top in early European session, but then dropped to under 1.120 level amid US dollar strength. EUR/USD now remained under pressure, currently losing 0.41% on a daily basis at the time of writing. The US Weekly Initial Jobless Claims released today decline to 199K, which is better than the market expectation of 260k. The upbeat data supported the greenback and push the DXY index higher above 96.8. In Europe, the Germany IFO Business Climate easing to 96.5 in November, therefore the dismal report weighed on the EUR/USD pair.

For technical aspect, RSI indicator 23 figures as of writing, suggesting that the pair is in oversold zone, a trend reversal could be expected. As for the MACD indicator, a death cross just formed on the histogram, which means a short-term downward trend for the pair. Looking at the Bollinger Bands, the price is moving alongside the lower band, therefore the downward trend is likely to persist. In conclusion, we think market will be bearish as the pair already broke below the previous 1.1226 support, now eyeing a test of the 1.1115 support that touched in June 2020.

Resistance: 1.1275, 1.1374, 1.1464

Support: 1.1115


GBPUSD (4- Hour Chart)

The pair GBP/USD declined on Wednesday, continuing to maintain its bearish tone for the fourth day. The pair started to see fresh selling in early European session, now trading at the lowest level since December 2020 and posting a 0.31% loss for the day. The stronger US dollar across the board keep acting as a headwind for the cable, as the upbeat US economic data and hawkish Fed expectations both lend support to the greenback. Meanwhile, the deadlock over the post-Brexit arrangement in Northern Ireland and fishing rights still weighed on the GBP/USD pair, but France will continue discussions with the UK over post-Brexit fishing access before any retaliatory measures taken.

For technical aspect, RSI indicator 29 figures as of writing, suggesting that the pair is in oversold zone, a trend reversal could be expected. Looking at the MACD indicator, the MACD is now sitting below the signal line, which means a downward trend for the pair. As for the Bollinger Bands, the price just touched the lower band, the bearish tone will be intensified if the price move out of the band. In conclusion, we think market will be bearish as the recent downward momentum might still be far from being over, and the next 1.3188 support awaits.

Resistance: 1.3514, 1.3607, 1.3698

Support: 1.3188


USDCAD (4- Hour Chart)

After falling from a monthly high near 1.275 area yesterday, the pair USD/CAD edged higher on Wednesday amid renewed US dollar strength. During American session, the pair pulled back from a daily top touched earlier in the day and surrendered its modest intraday gains. USD/CAD was last seen trading at 1.2672, currently posting a 0.01% gain on a daily basis. The risk-off market sentiment and better-than-expected US job data both spurred demand for the greenback, which is sitting at the highest level since July 2020. On top of that, falling oil prices put pressure on the commodity-linked loonie and pushed the USD/CAD pair higher.

For technical aspect, RSI indicator 53 figures as of writing, suggesting tepid bull movement ahead. But looking at the MACD indicator, the MACD is now sitting below the signal line, which means a downward trend for the pair. As for the Bollinger Bands, the price dropped off the upper band and then crosses below the moving average, the lower band then becomes the loss target. In conclusion, we think market will be bearish as the pair is eyeing a test of the 1.2585 support.

Resistance: 1.2475, 1.2775, 1.2849

Support: 1.2585, 1.2493, 1.2387


Economic Data

Currency

Data

Time (GMT + 8)

Forecast

EUR

German GDP (QoQ) (Q3)

15:00

1.8%

EUR

ECB Publishes Account of Monetary Policy Meeting

20:30

EUR

ECB President Lagarde Speaks

21:30

VT Markets Modification of Facebook Symbol name

Dear Client,

Please kindly note that the Shares CFDs Facebook Inc. (FB) has changed its corporate name to Meta Inc. (MVRS) as part of a major rebrand, effective from November 29th, 2021 on our platform.

Please contact [email protected] if you would like more information regarding to this.

Back To Top
server

Hello there 👋

How can I help you?

Chat with our team instantly

Live Chat

Start a live conversation through...

  • Telegram
    hold On hold
  • Coming Soon...

Hello there 👋

How can I help you?

telegram

Scan the QR code with your smartphone to start a chat with us, or click here.

Don’t have the Telegram App or Desktop installed? Use Web Telegram instead.

QR code