Market Focus

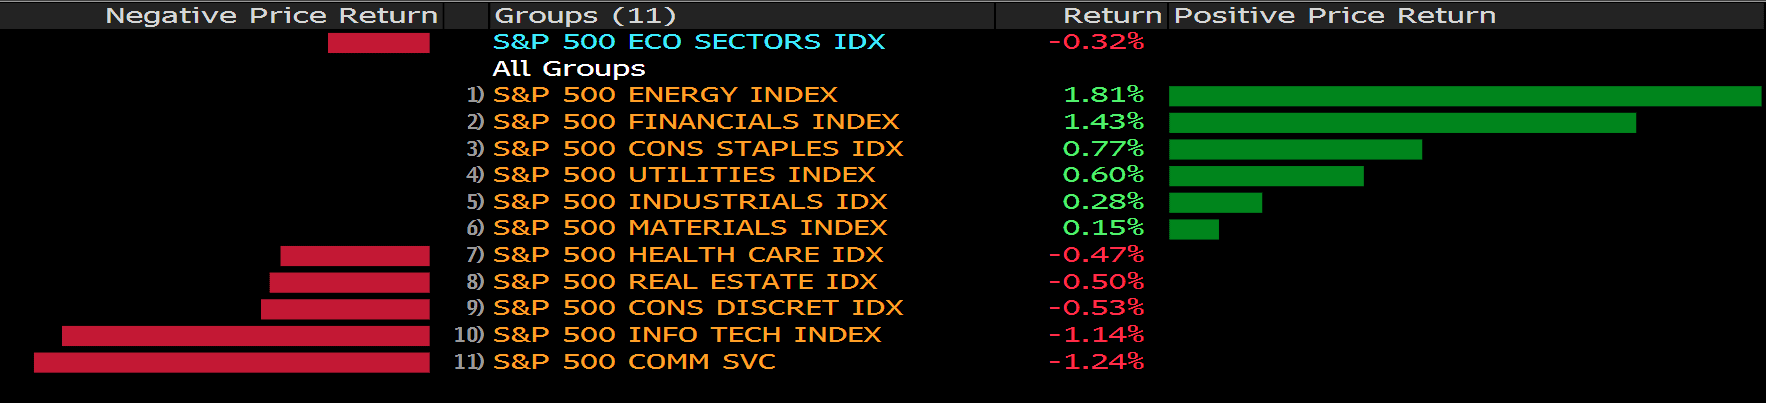
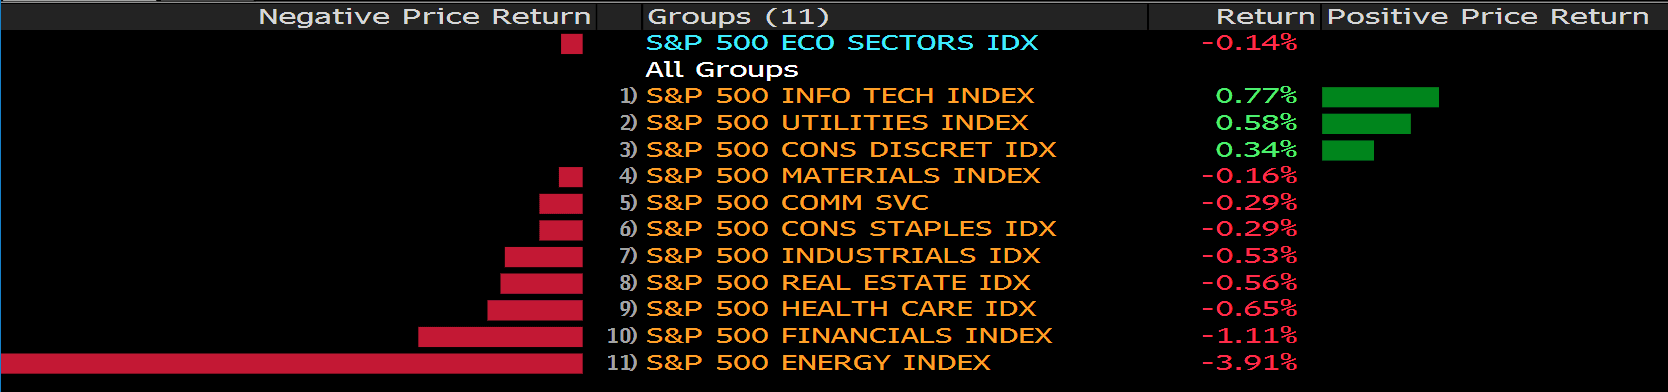
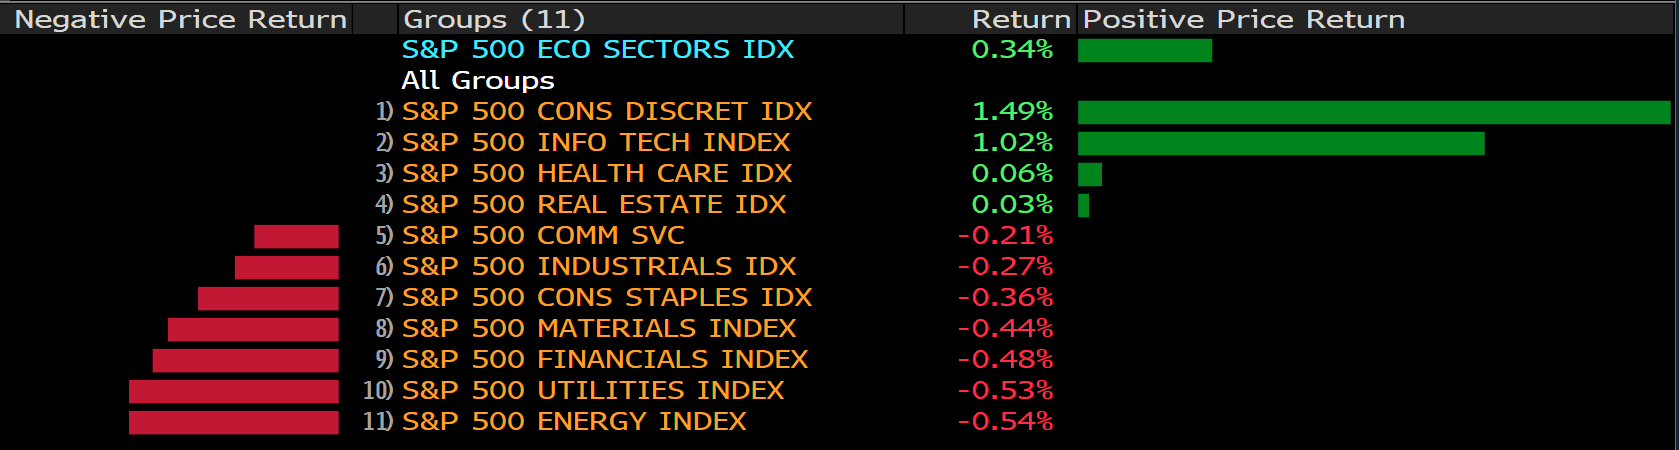
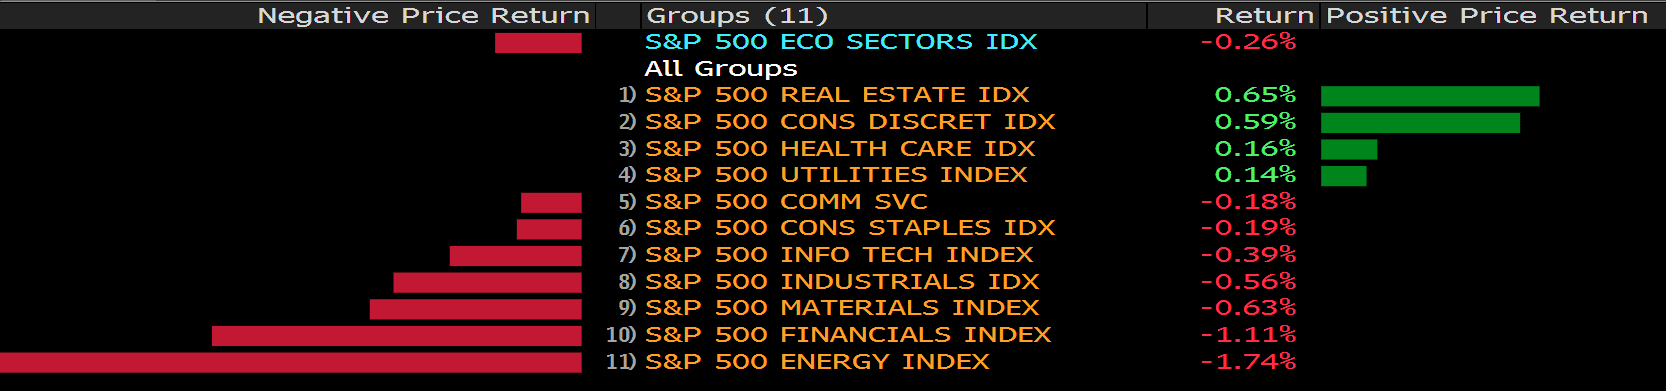
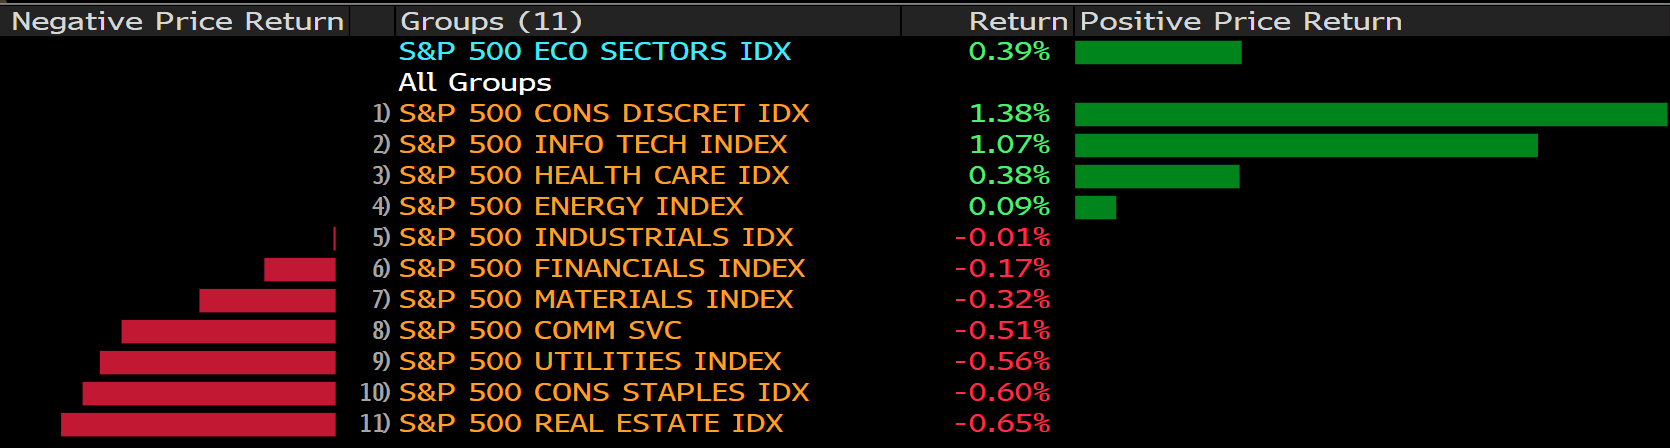
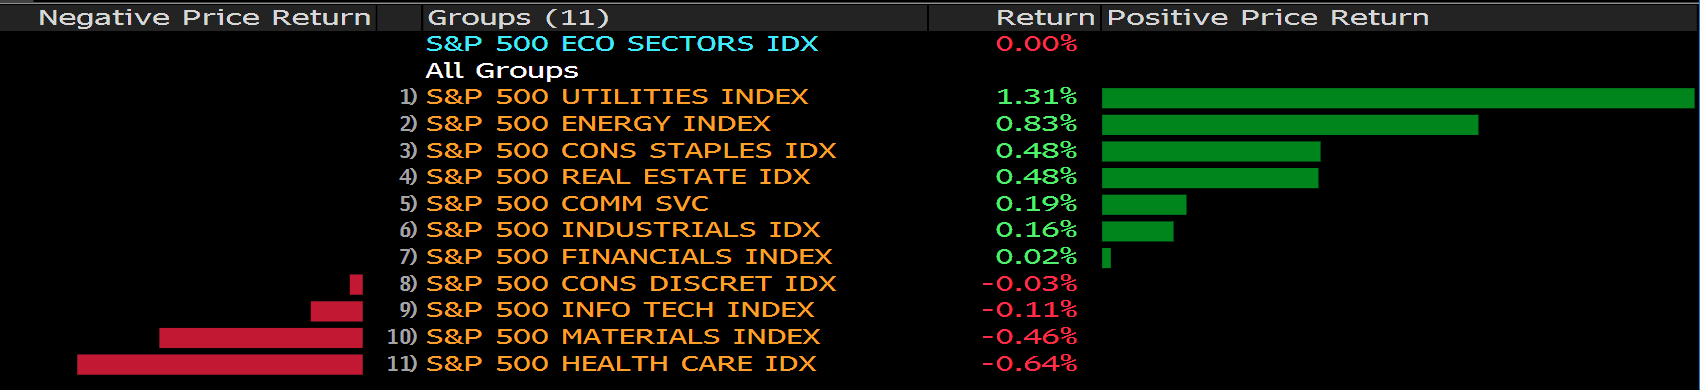
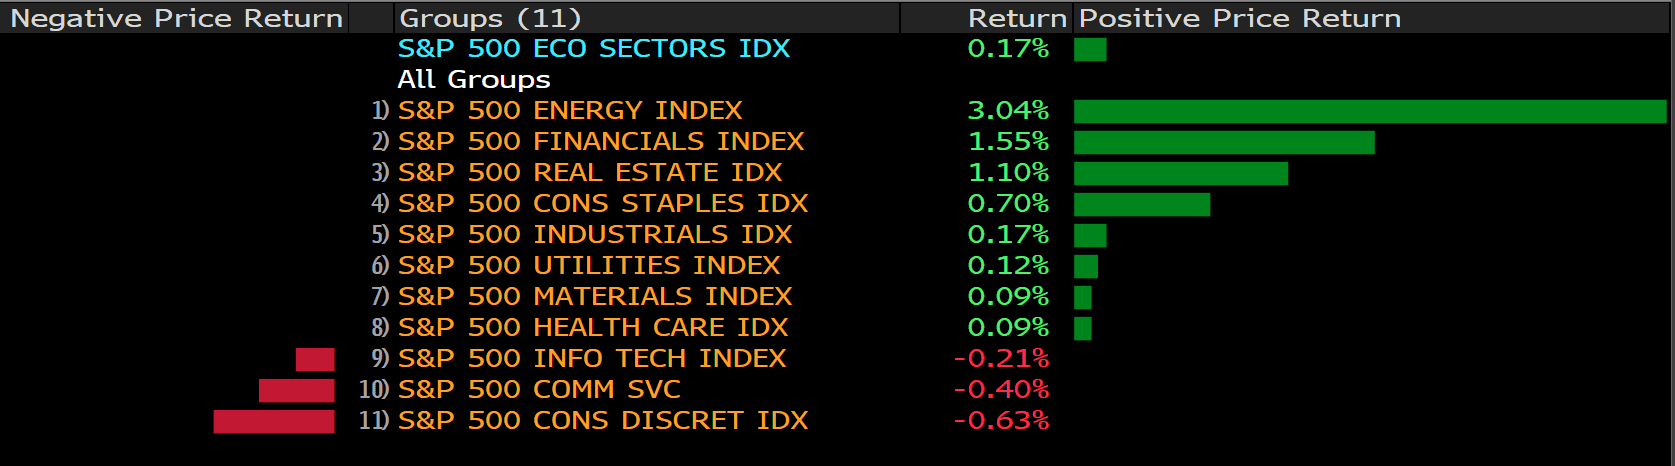
U.S. shares rose on the back of gains in cyclicals, while the technology sector extended losses as rising Treasury yields damped the outlook for growth stocks. The S&P 500 ended the day higher, after swinging between gains and losses in the last hour of trading. The tech-heavy Nasdaq 100 slid, building on Monday’s last-hour selloff. Chinese video meeting corporation Zoom tumbled on signs of slowing growth.

一張含有 文字 的圖片

自動產生的描述

After months of speculation and weeks of apparent hesitation, President Joe Biden has decided to stick with Jerome Powell for the position of the Fed’s chair. He does this despite clear indications that this will anger the left in his party. Some liberals in the closely-divided Senate have already promised to oppose Powell, who was first selected by Donald Trump, when his nomination comes to a vote in the chamber. However, Biden has opted for stability in the Federal Reserve at a time when rising interest rates and continued Covid-related challenges put the US economy in a precarious position.

The president may consider Powell the safe choice, with some Republicans already offering their support. But if Senate Democrats fracture over the nomination, it may make it more difficult for them to stick together to pass Biden’s Build Back Better social spending legislation – a development could have grave political consequences for their party.

Traders pruned bets for a dovish-for-longer Federal Reserve after Jerome Powell was selected for a second term. The chair himself sought to strike a balance in his policy approach, saying the central bank would use tools at its disposal to support the economy as well as to prevent inflation from becoming entrenched.


Main Pairs Movement:

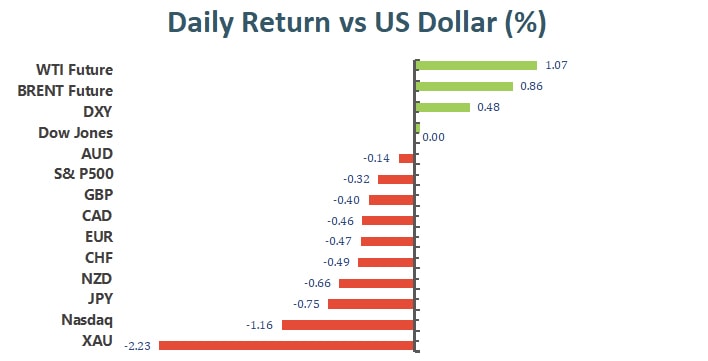
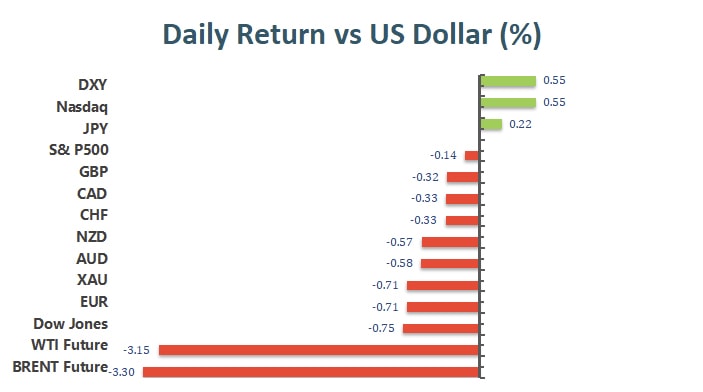
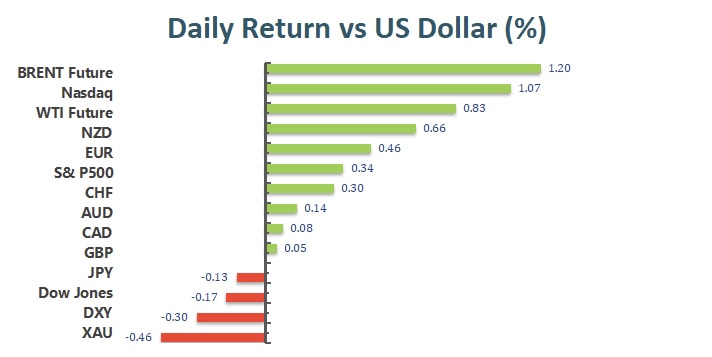
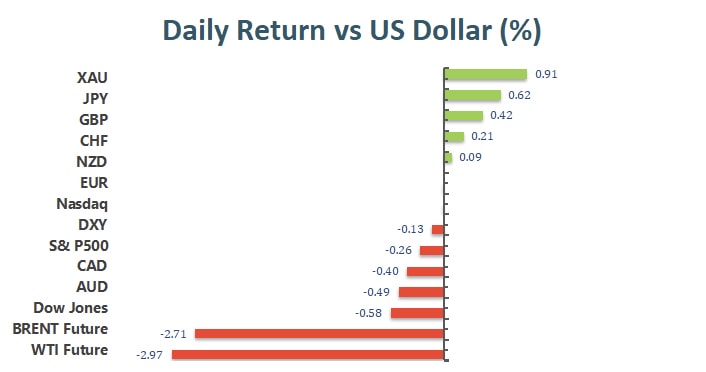
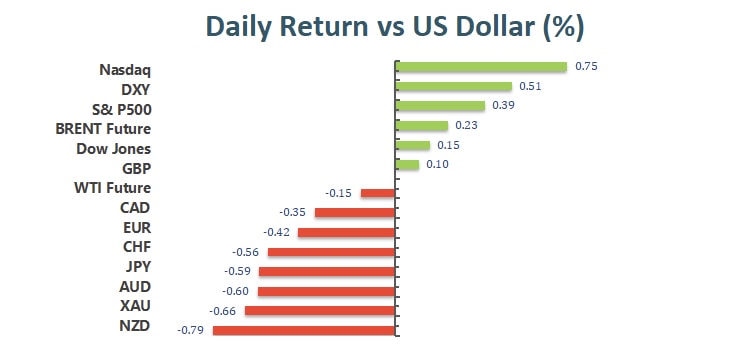
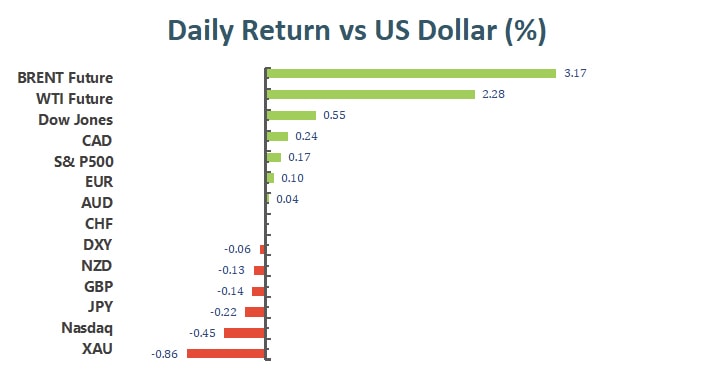
The greenback extended its previous gains, with the dollar index reaching fresh 2021 highs around 96.55. The dismal mood of the equity markets and the higher government bond yields fueled demand for the safe-haven dollar.

EUR/USD bottomed for the day at 1.1226, while GBP/USD fell to 1.3342 amid worrying labor shortage and inflation issues. Bank of England head Andrew Bailey said that the bank may not return to offering a hard form of guidance, according to Reuters. It is not off the table that we give no guidance at all on rates, with decisions to be made meeting by meeting, the governor added, before stating that the UK labour market is very tight.

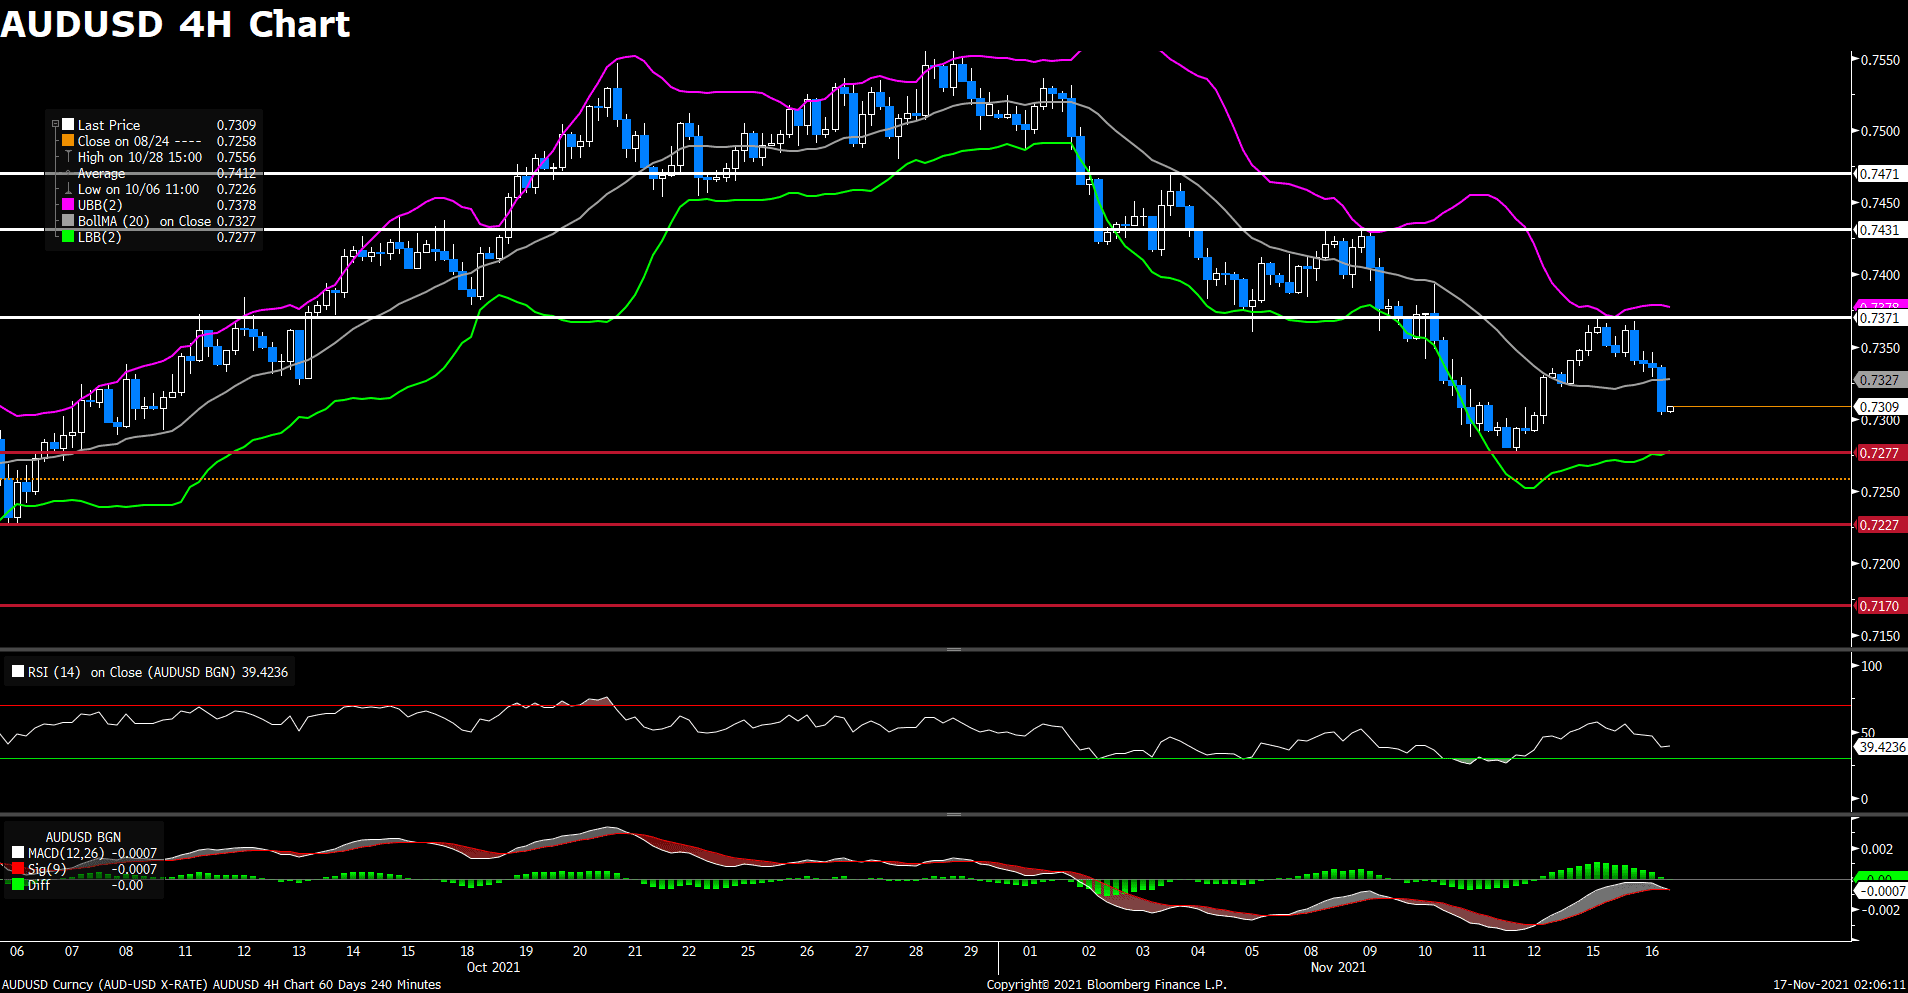
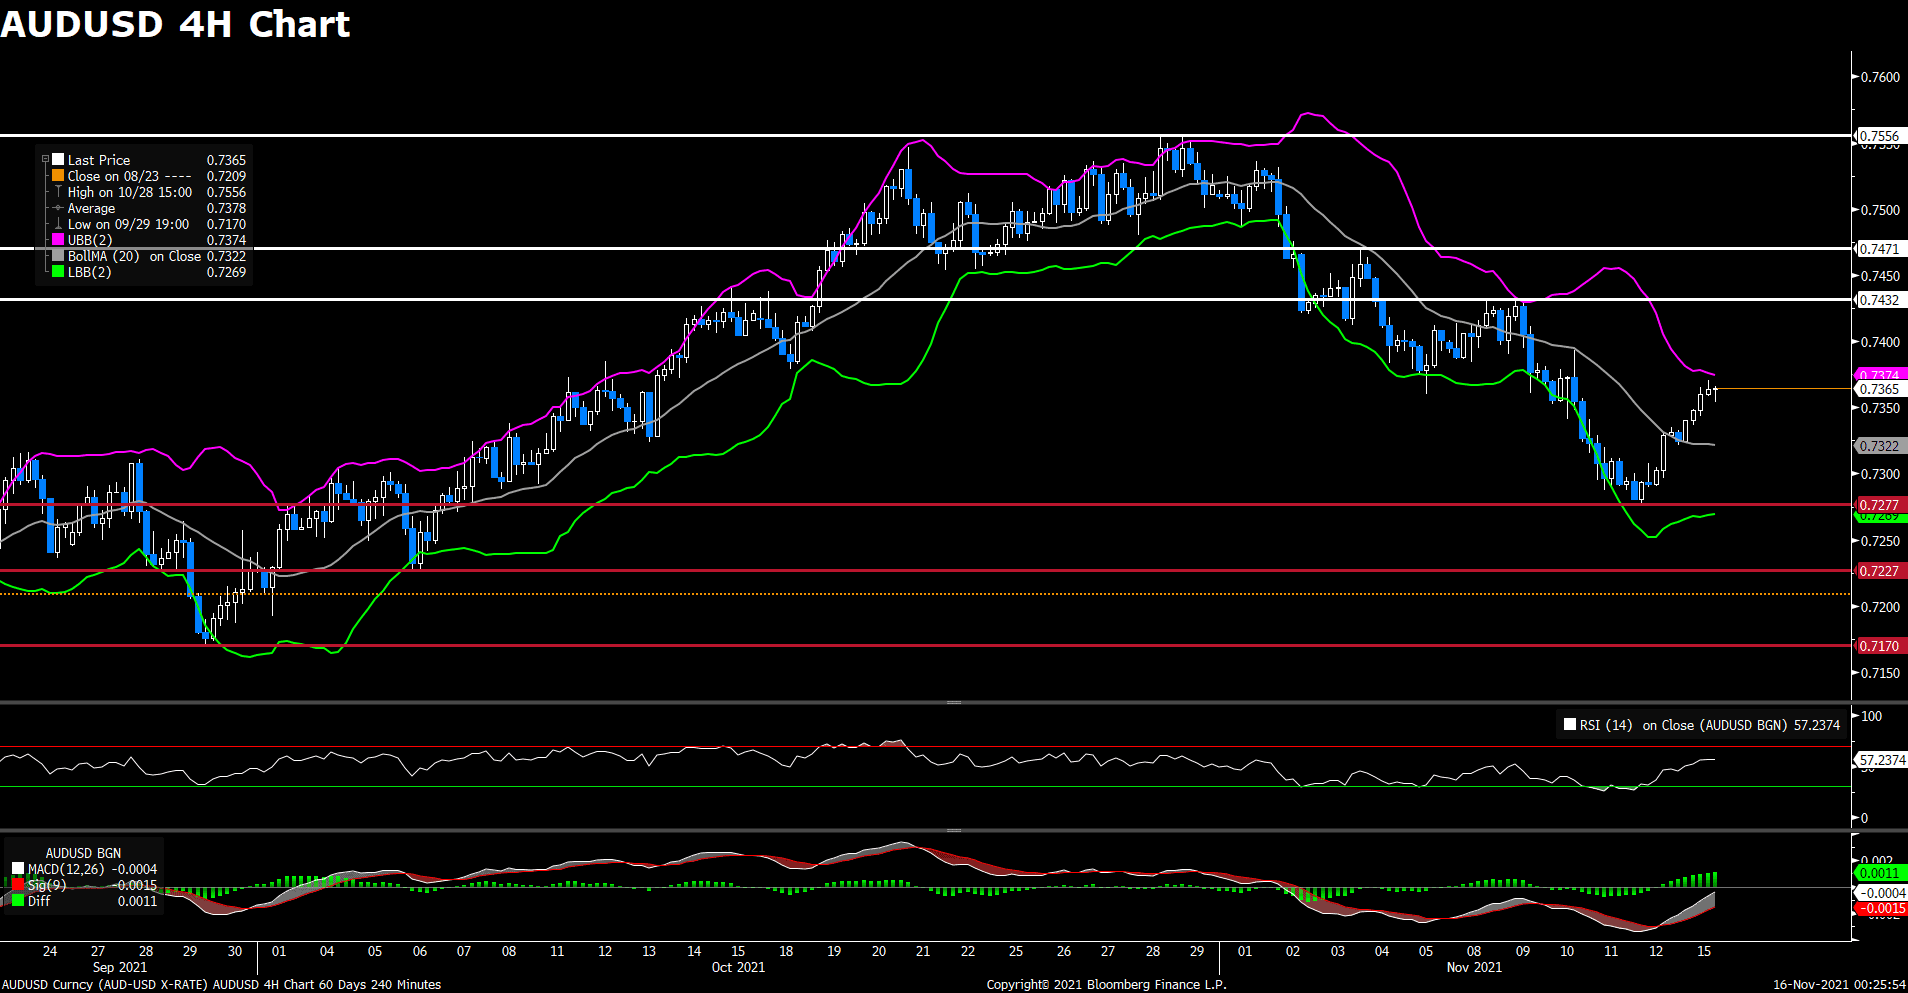
Commodity-linked currencies performed pretty well on Tuesday with the help of the commodity prices’ rebound. AUD/USD successfully defended its rates against the soaring US dollar, while USD/CAD dropped 0.25% amid a strong pullback of the oil prices.

Gold declined for a forth consecutive day, failing to find support at the key level $1800, and now trading at $1792 a troy ounce. The US 10-year benchmark yield soar to its monthly high at 1.685. Crude oil price surged significantly, with WTI up 2.65% to $78.50 a barrel, and Brent up 3.5% to $82.20.


Technical Analysis:

EURUSD (4- Hour Chart)

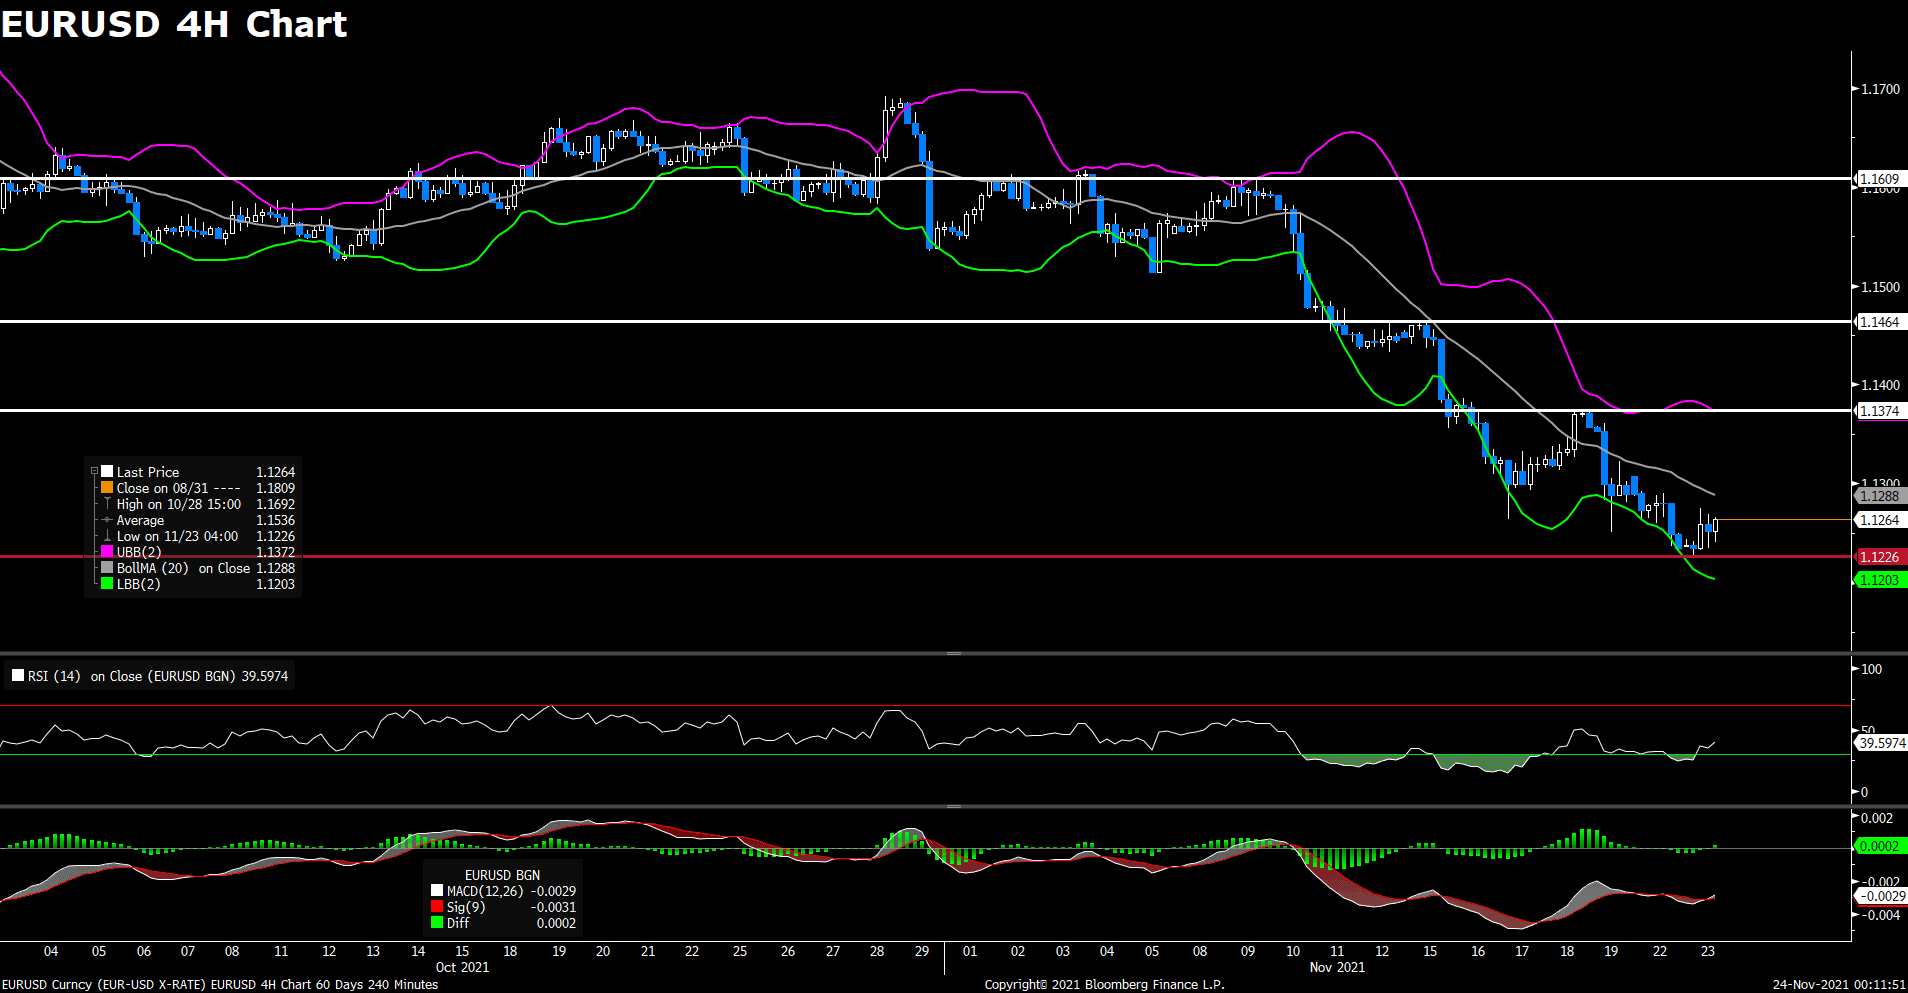
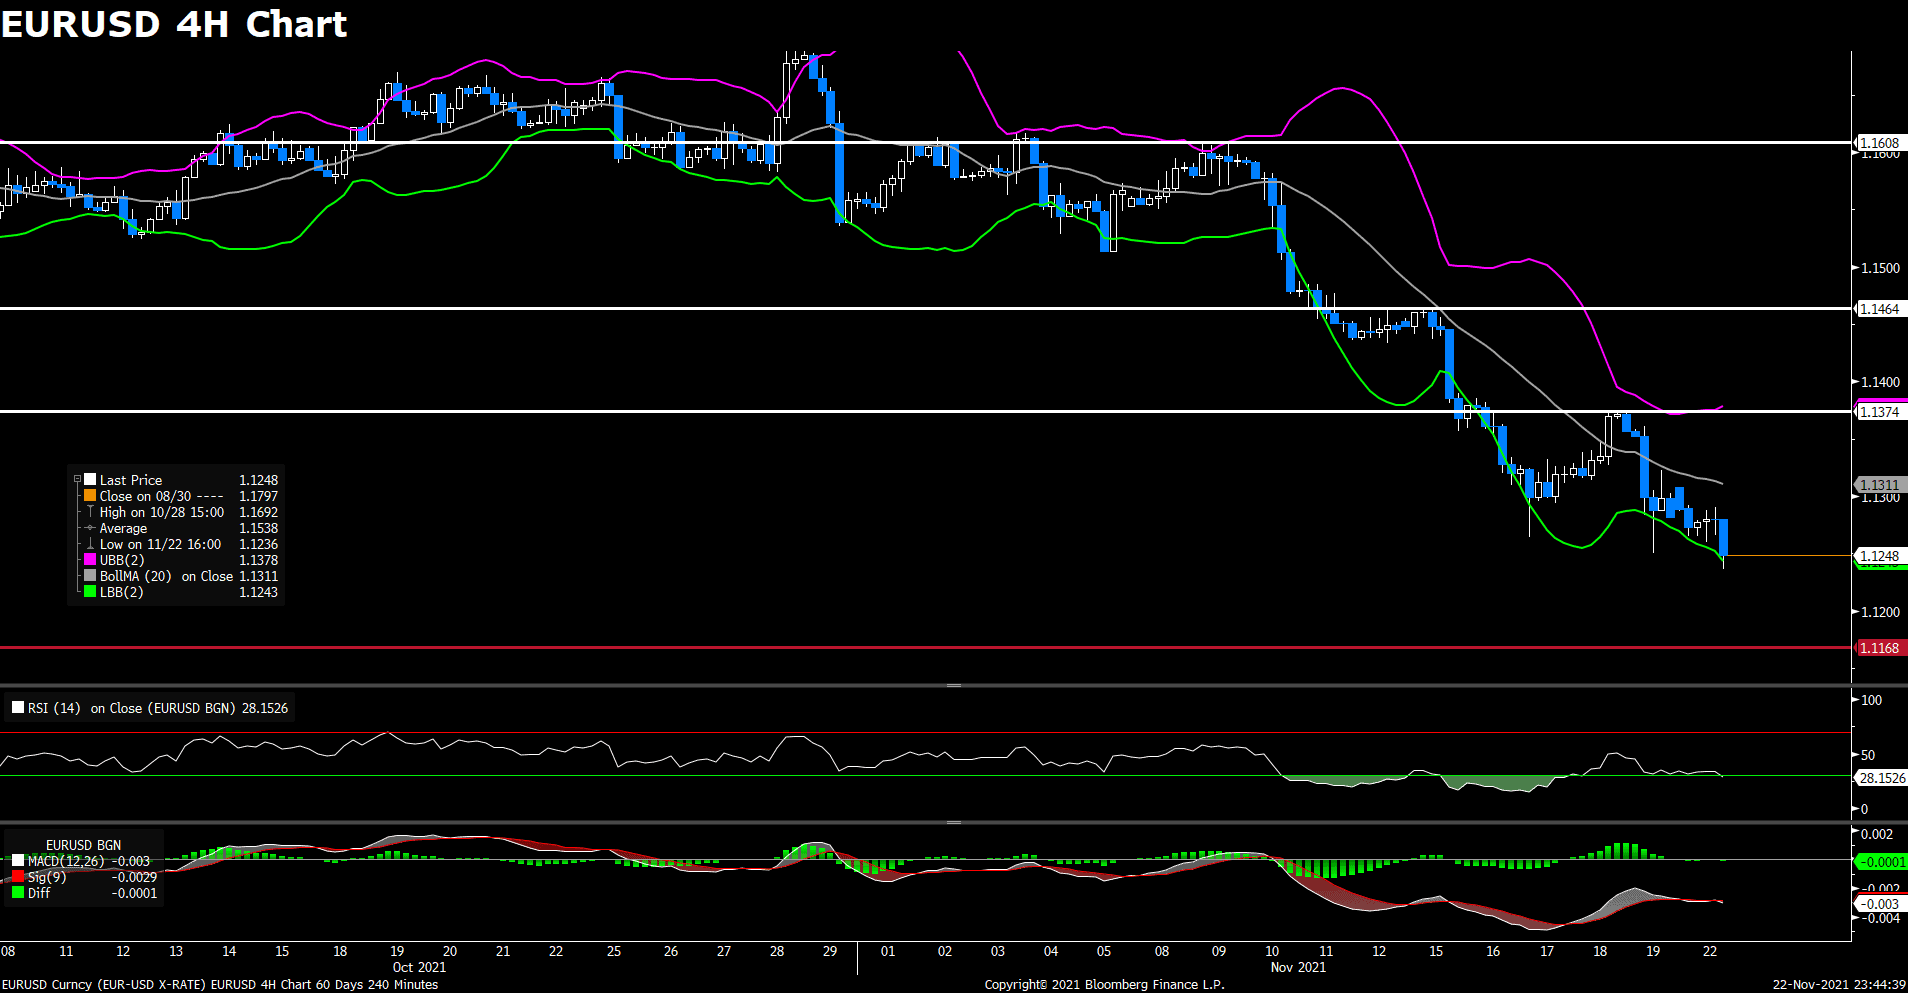
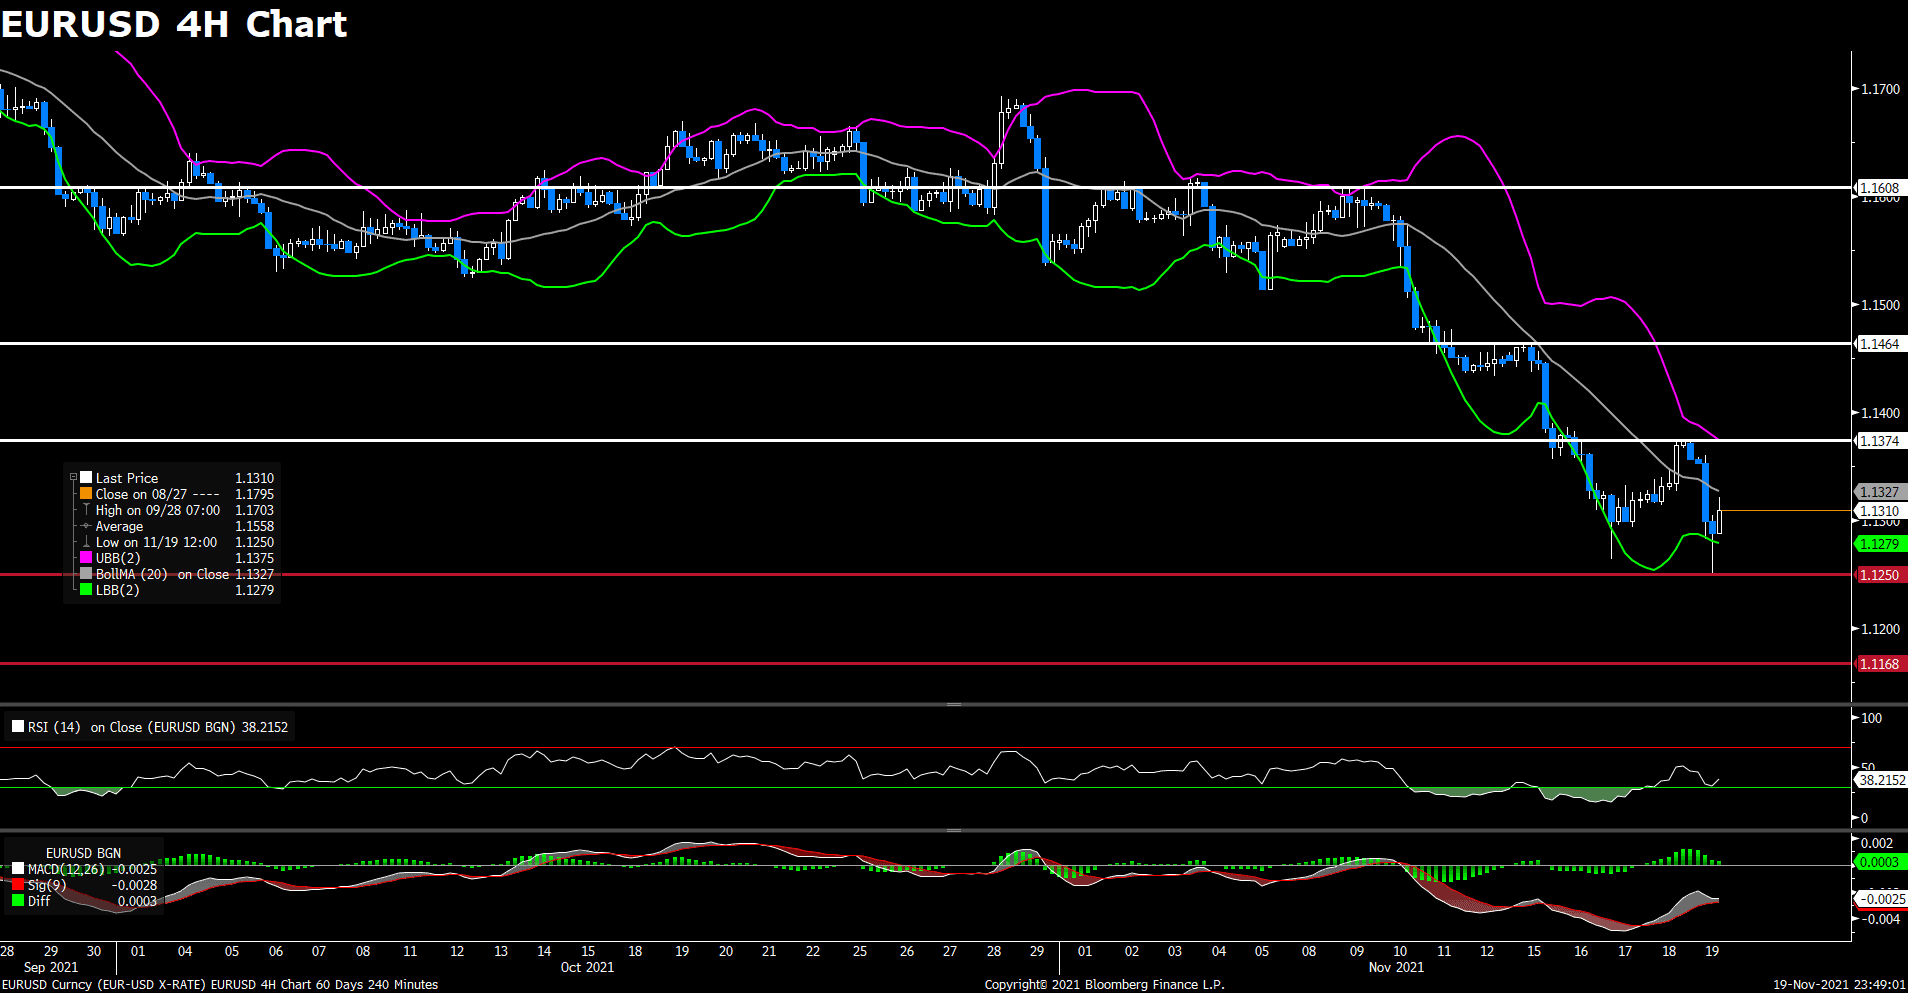
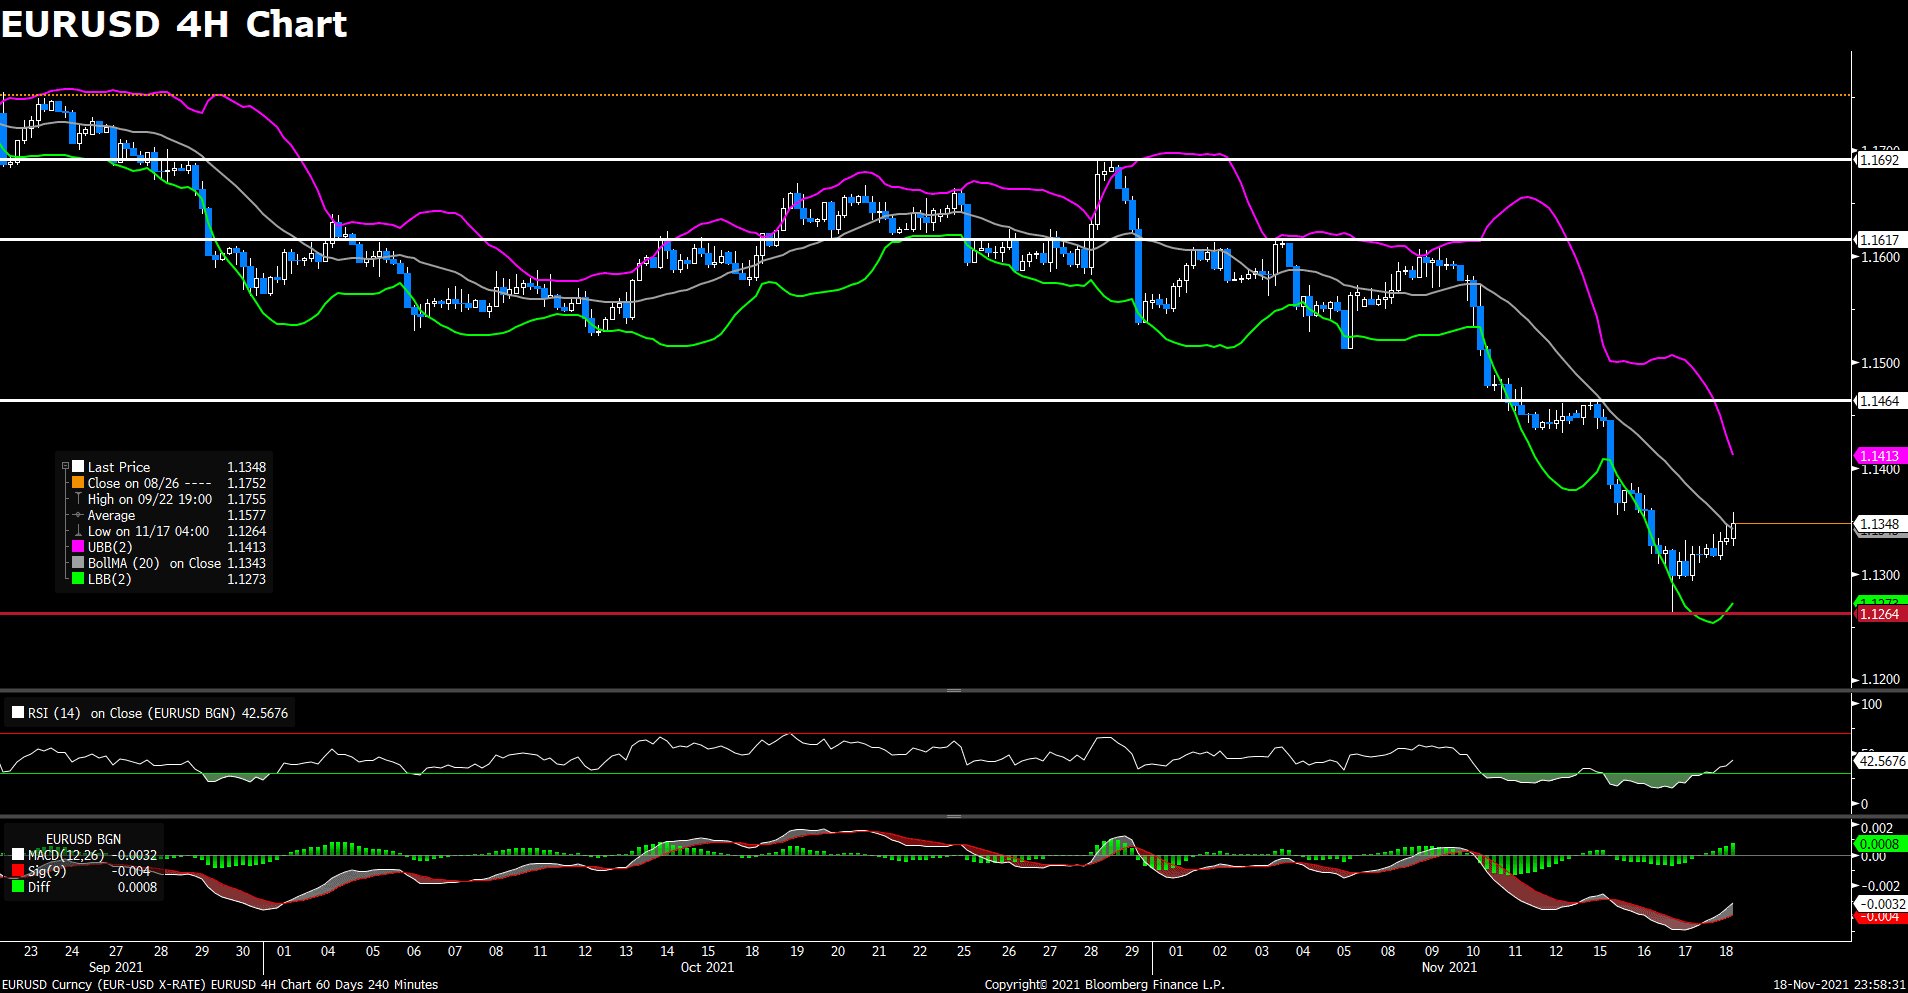
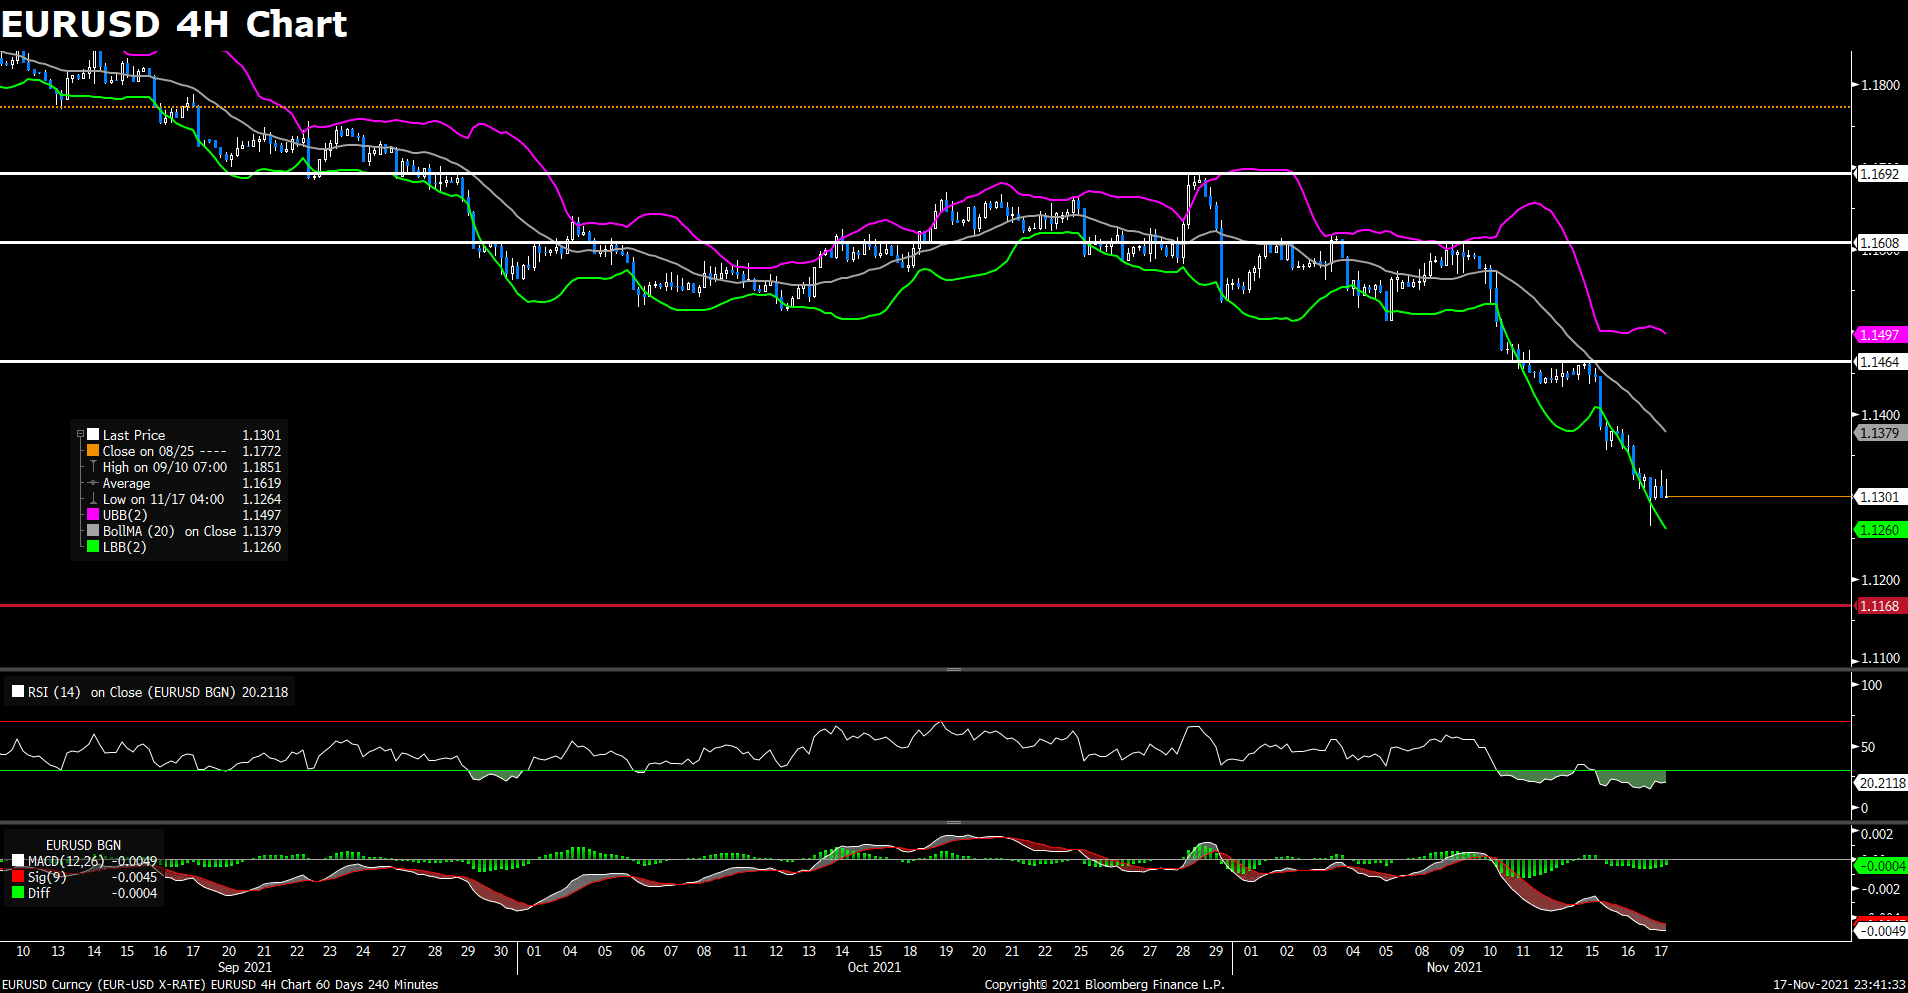
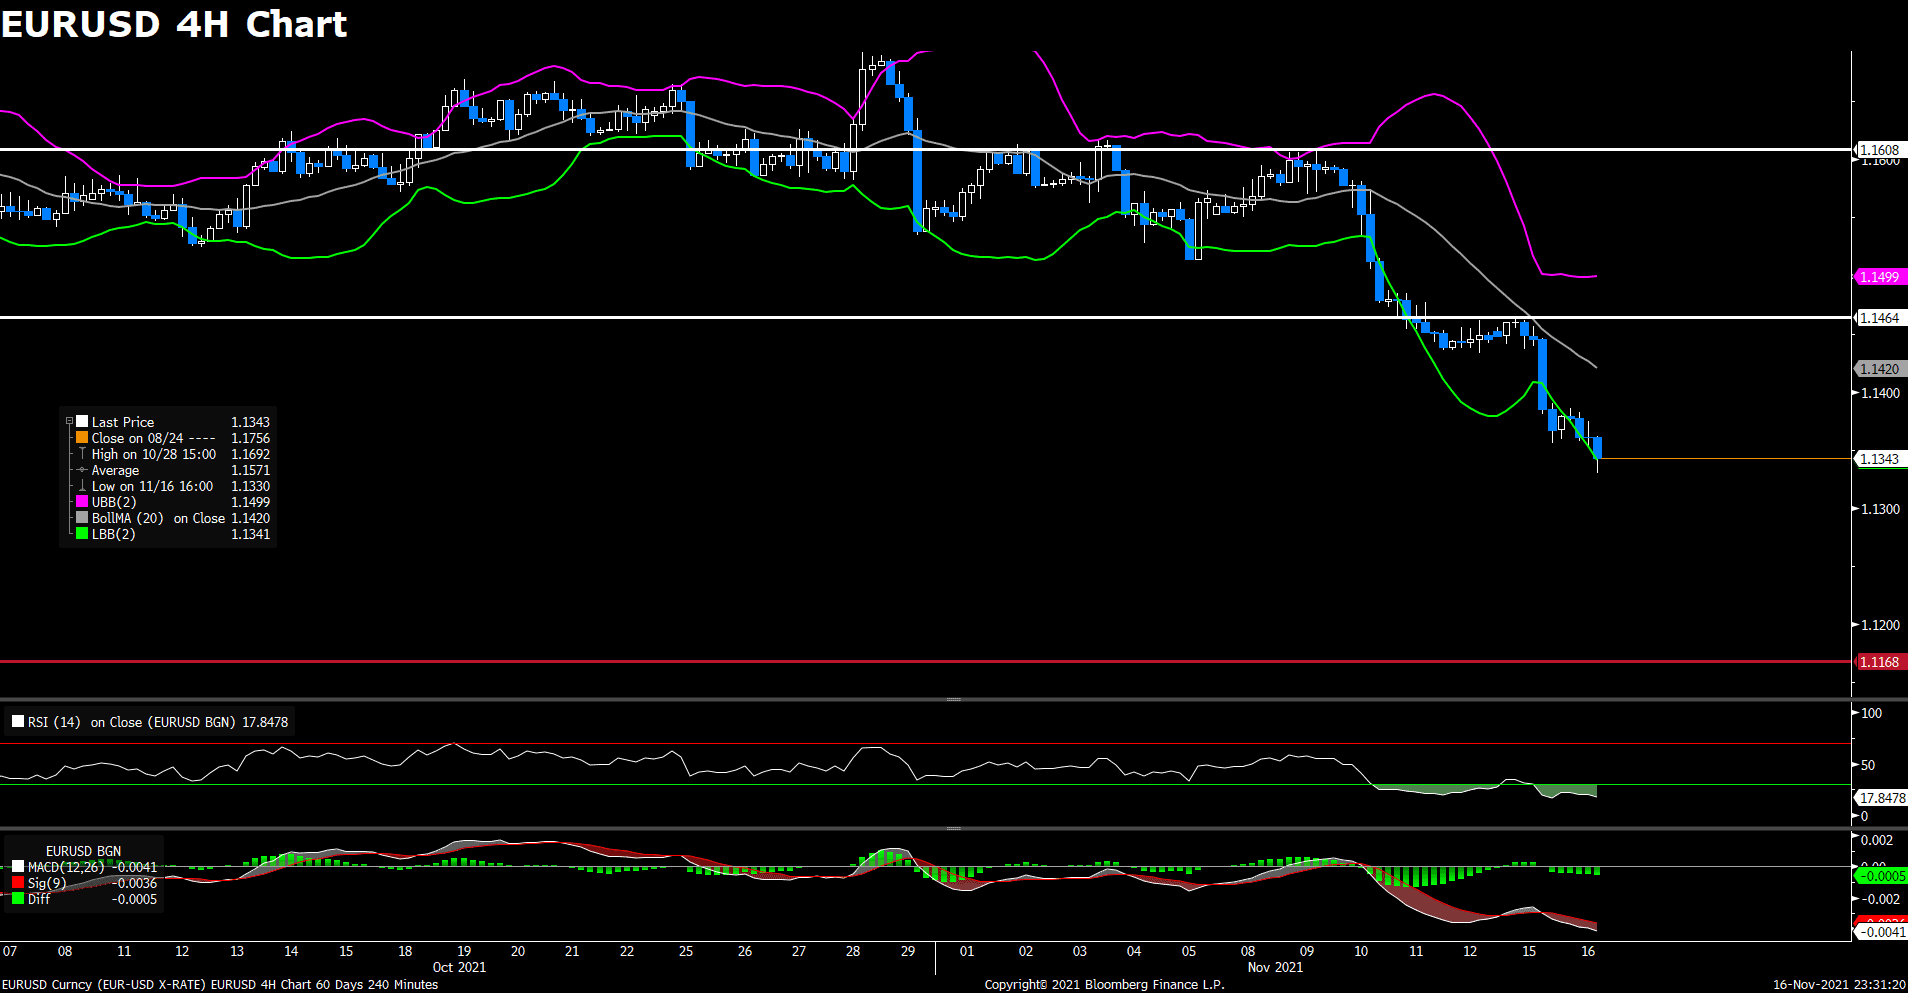
After previous day’s slide to a sixteen-month lows, the pair EUR/USD rebounded moderately and stays in positive territory on Tuesday. The pair climbed higher and touched a fresh daily high in early European session, but then pulled back towards 1.124 area. EUR/USD surrenders its modest intraday gains, currently rising 0.27% on a daily basis at the time of writing. In Europe, the flash German Manufacturing PMI released today came in at 57.6, which is better than market’s expectations. The upbeat data showed that the manufacturing sector activity in Eurozone’s economic continued to expand and therefore underpinned the EUR/USD pair. On top of that, concerns about rising Covid-19 cases and the re-imposition of lockdown measures keep acting as a headwind for the Euro.

For technical aspect, RSI indicator 38 figures as of writing, suggesting bear movement ahead. As for the MACD indicator, a golden cross just formed on the histogram, which means a short-term upward trend for the pair. Looking at the Bollinger Bands, the price rose from the lower band, therefore the upward trend is likely to persist. In conclusion, we think market will be bullish as the pair is eyeing a test of the 1.1374 resistance, but the prospects for an early policy tightening by the Fed might kept a lid on any meaningful recovery for the EUR/USD pair.

Resistance: 1.1374, 1.1464, 1.1609

Support: 1.1226, 1.1168

GBPUSD (4- Hour Chart)

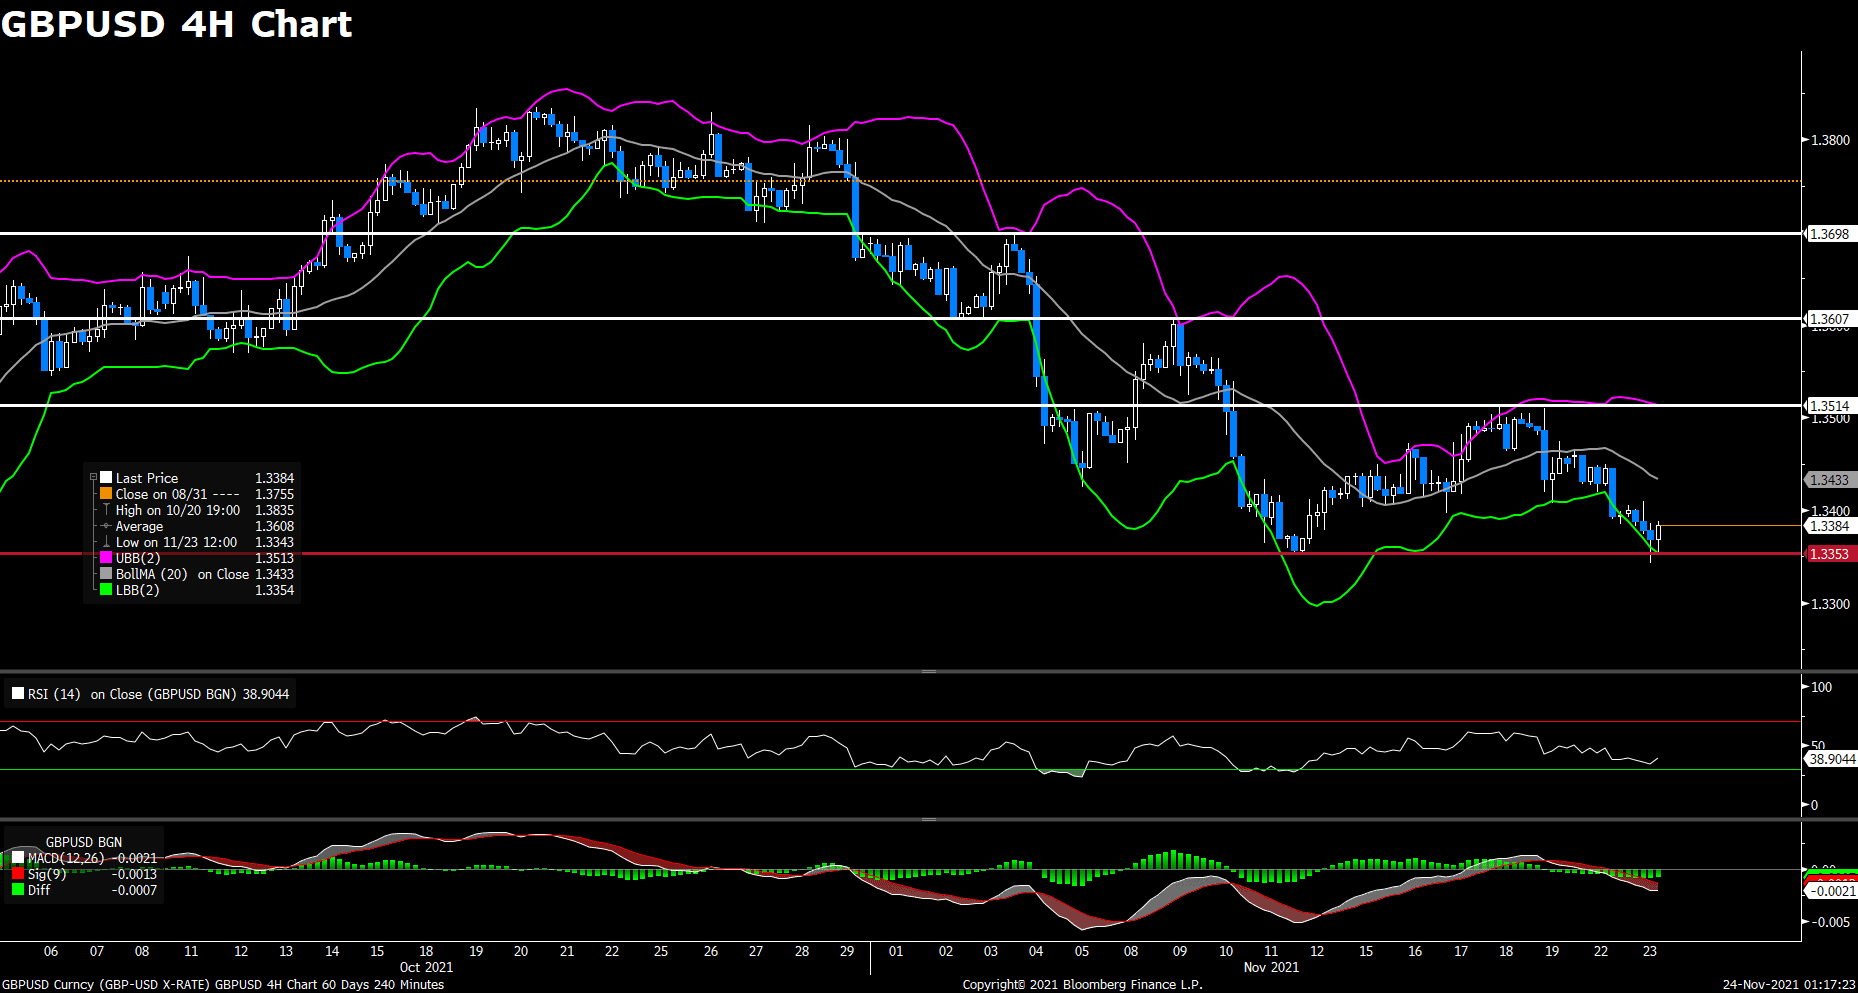
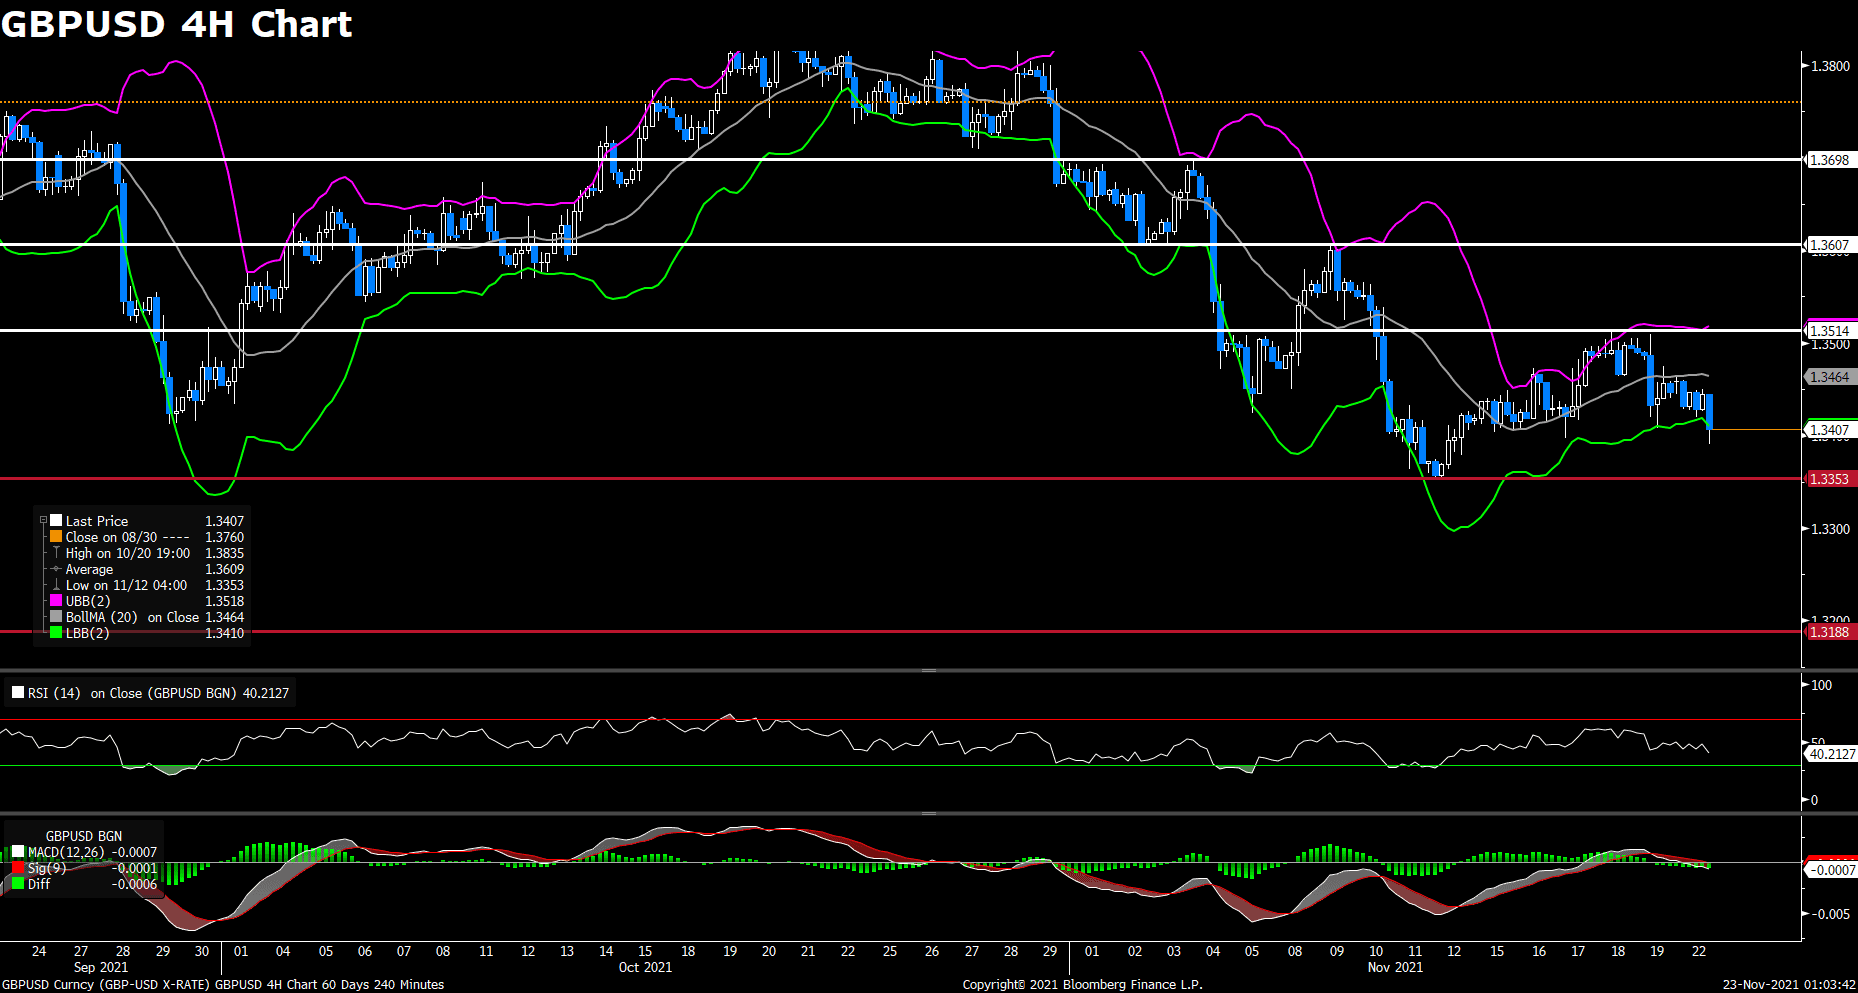
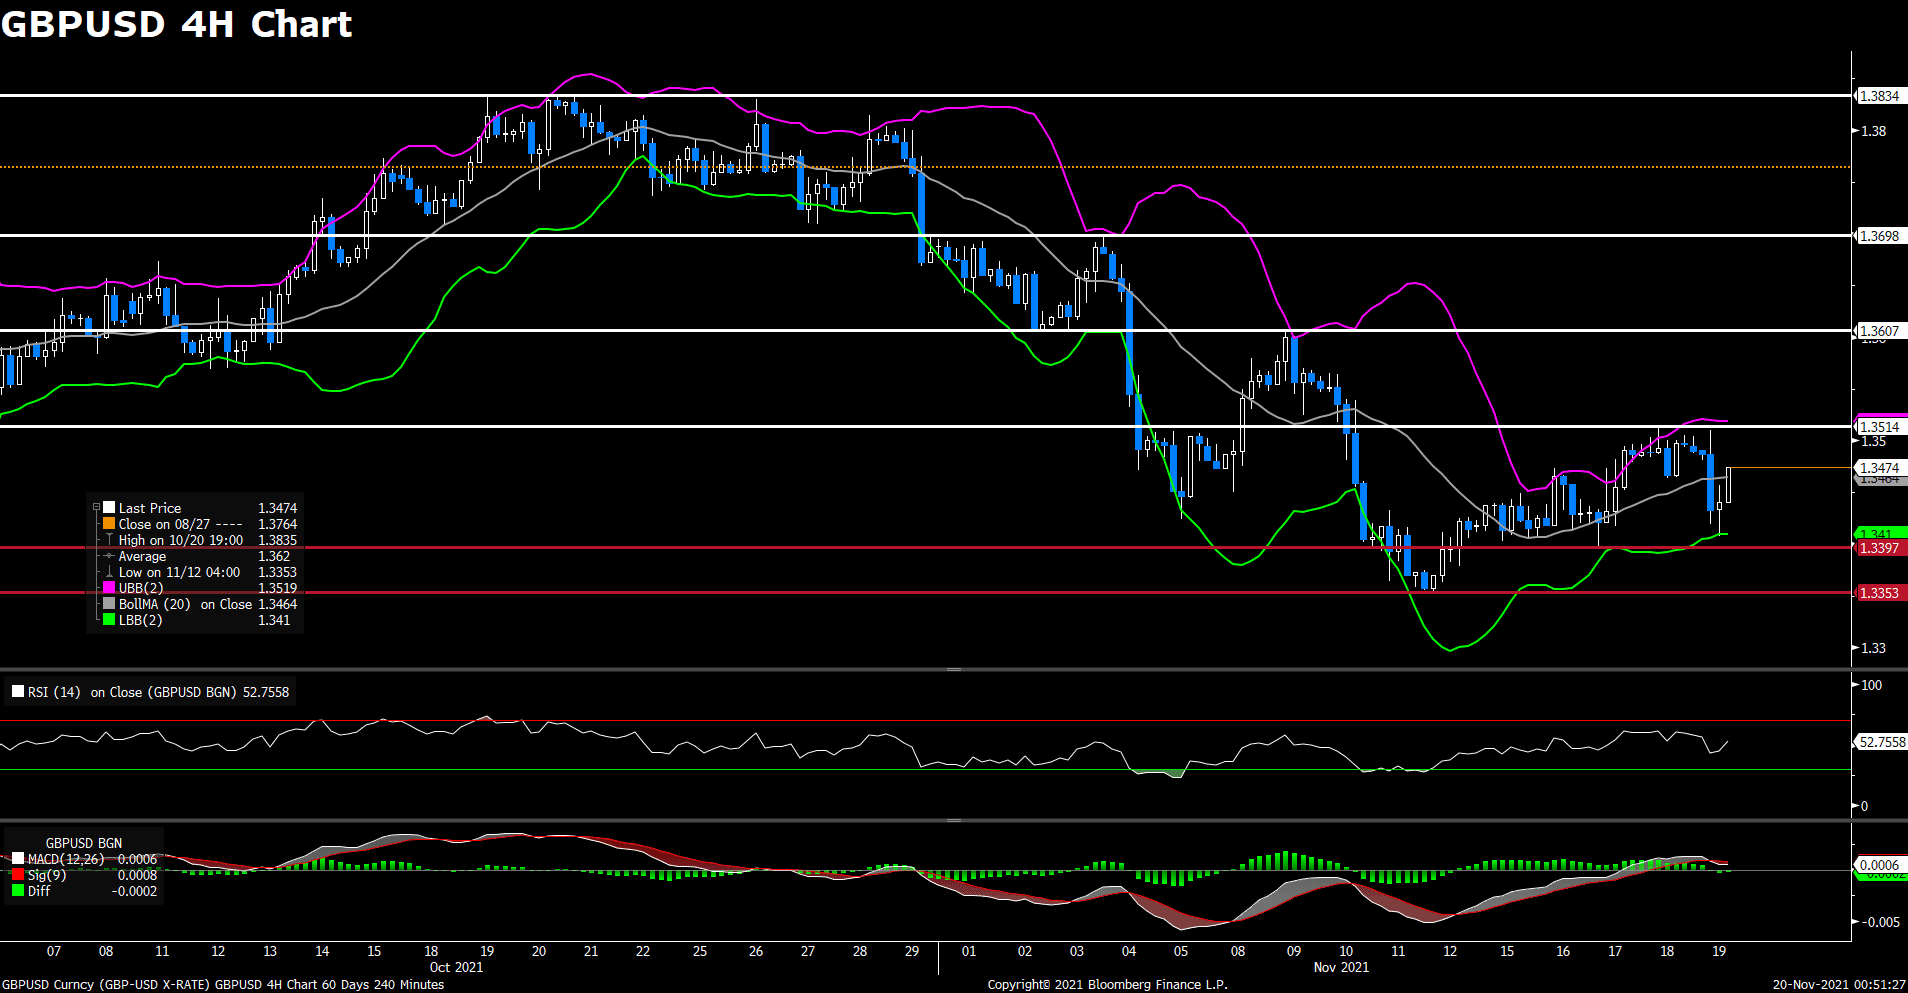
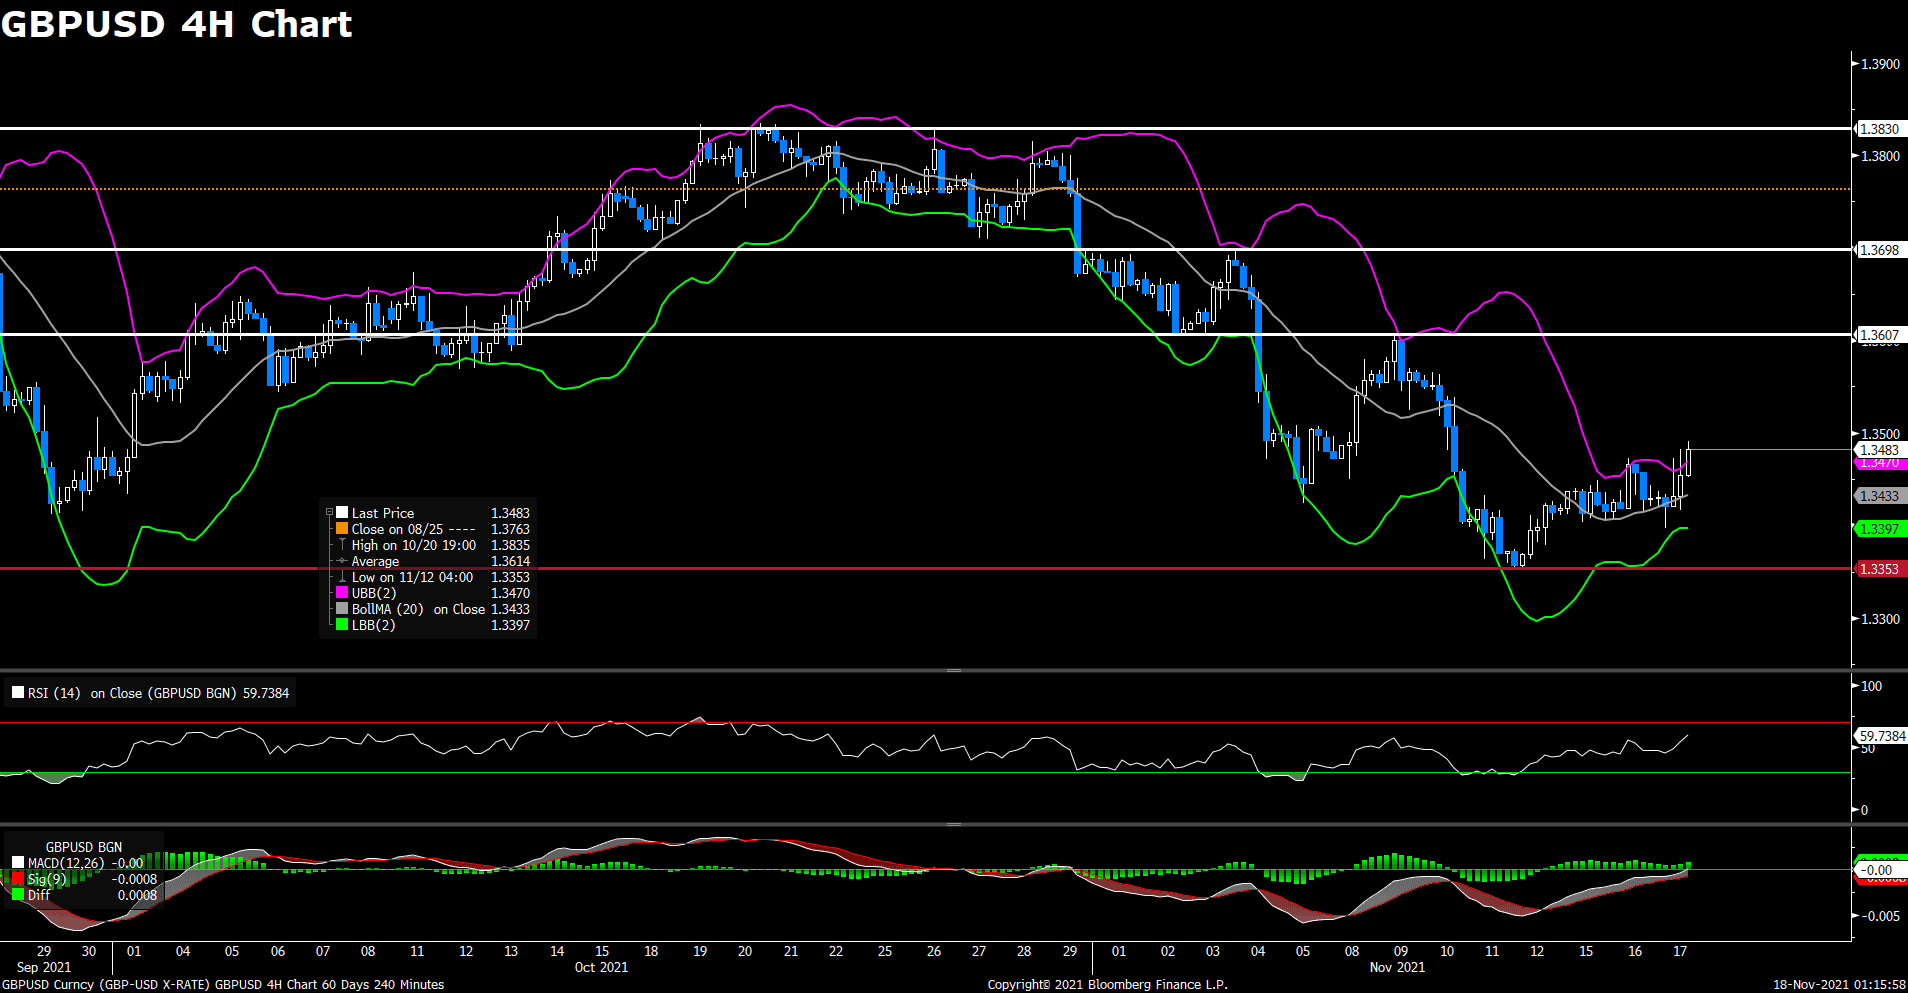
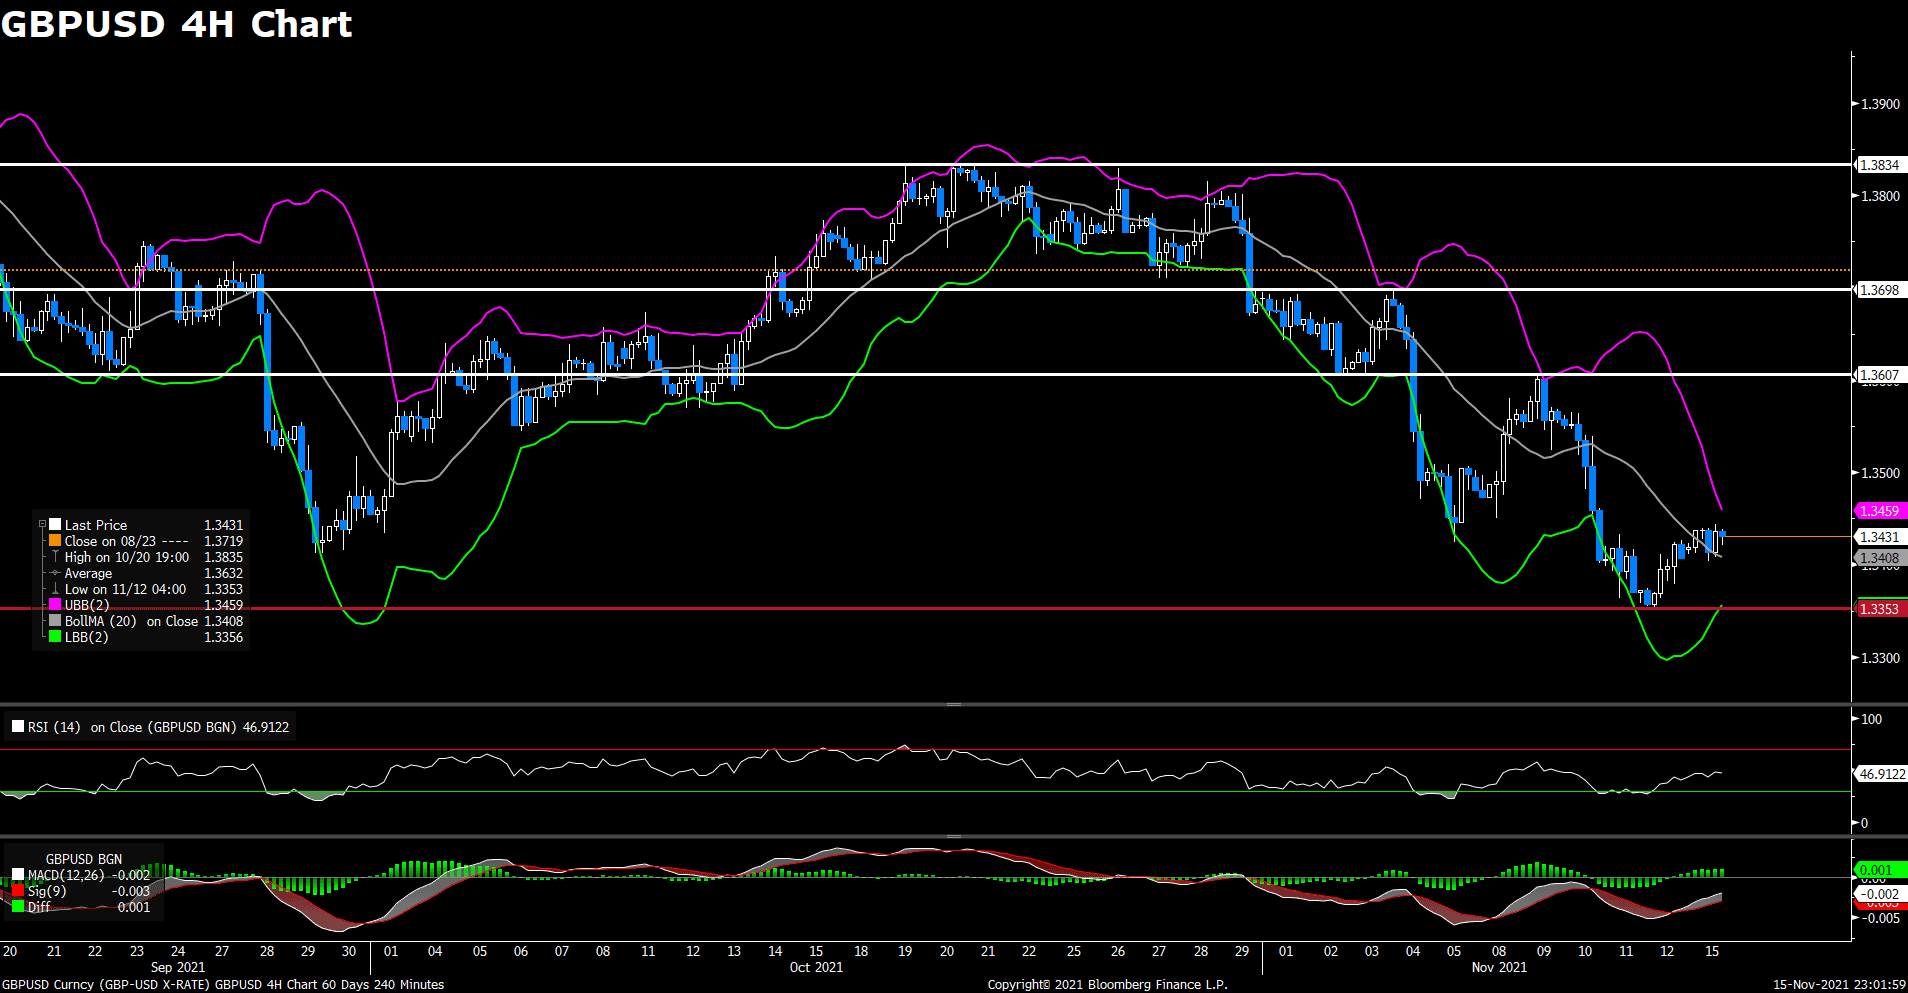
The pair GBP/USD declined on Tuesday, continuing to stay under pressure for the third day. The pair touched a daily top near 1.341 in early European session, but then failed to preserved its bullish traction and dropped below 1.335 level. At the time of writing, the cable has rebounded slightly amid weaker US dollar across the board, currently losing 0.09% on a daily basis. Despite an upside surprise from the UK flash Manufacturing PMI report, which rose to 58.2 in November, the cable still undermined by the deadlock over the post-Brexit arrangement in Northern Ireland and fishing rights. As UK threatened to trigger Article 16, which may worsen relations with the European Union and potentially leading to a trade war.

For technical aspect, RSI indicator 39 figures as of writing, suggesting bear movement ahead. Looking at the MACD indicator, the MACD is now sitting below the signal line, which means a downward trend for the pair. As for the Bollinger Bands, the price is moving alongside with the lower band, therefore the downward trend could persist. In conclusion, we think market will be bearish as the pair is now testing the 1.3353 support, a drop below that level could extend the recent downfall to under 1.3300 area.

Resistance: 1.3514, 1.3607, 1.3698

Support: 1.3353, 1.3188


USDCAD (4- Hour Chart)

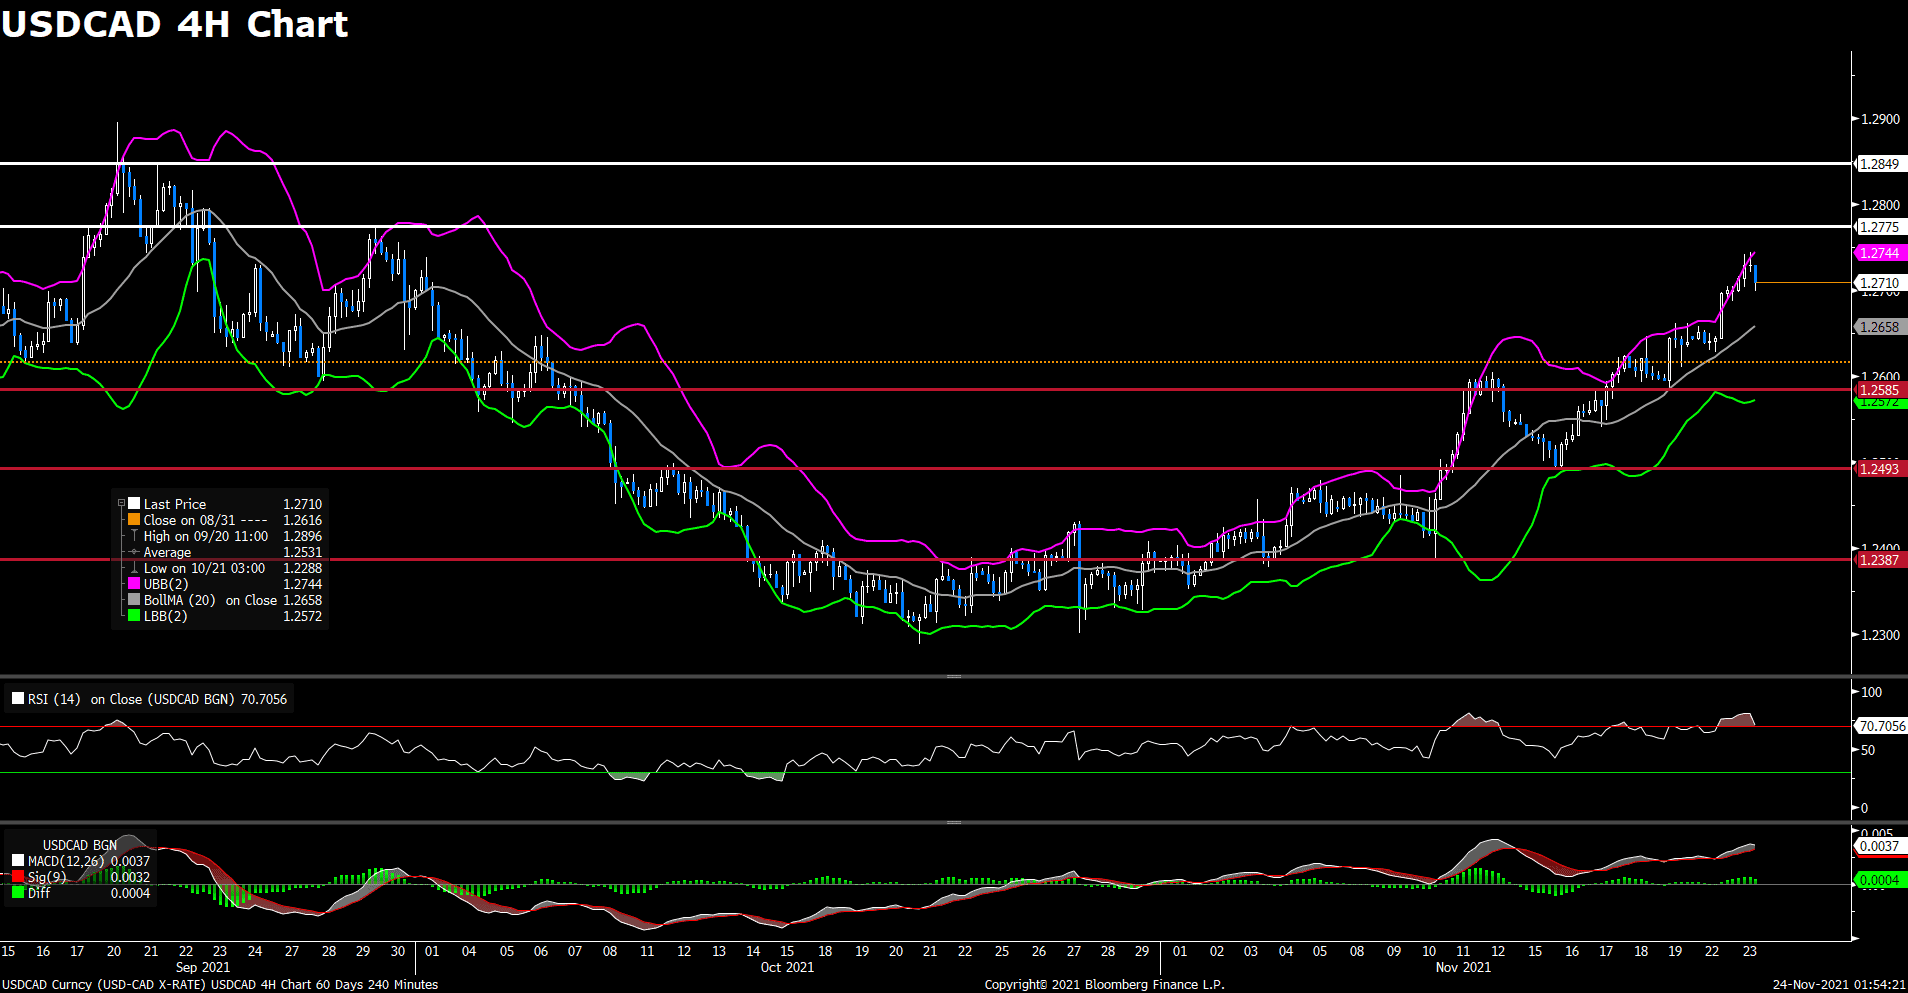
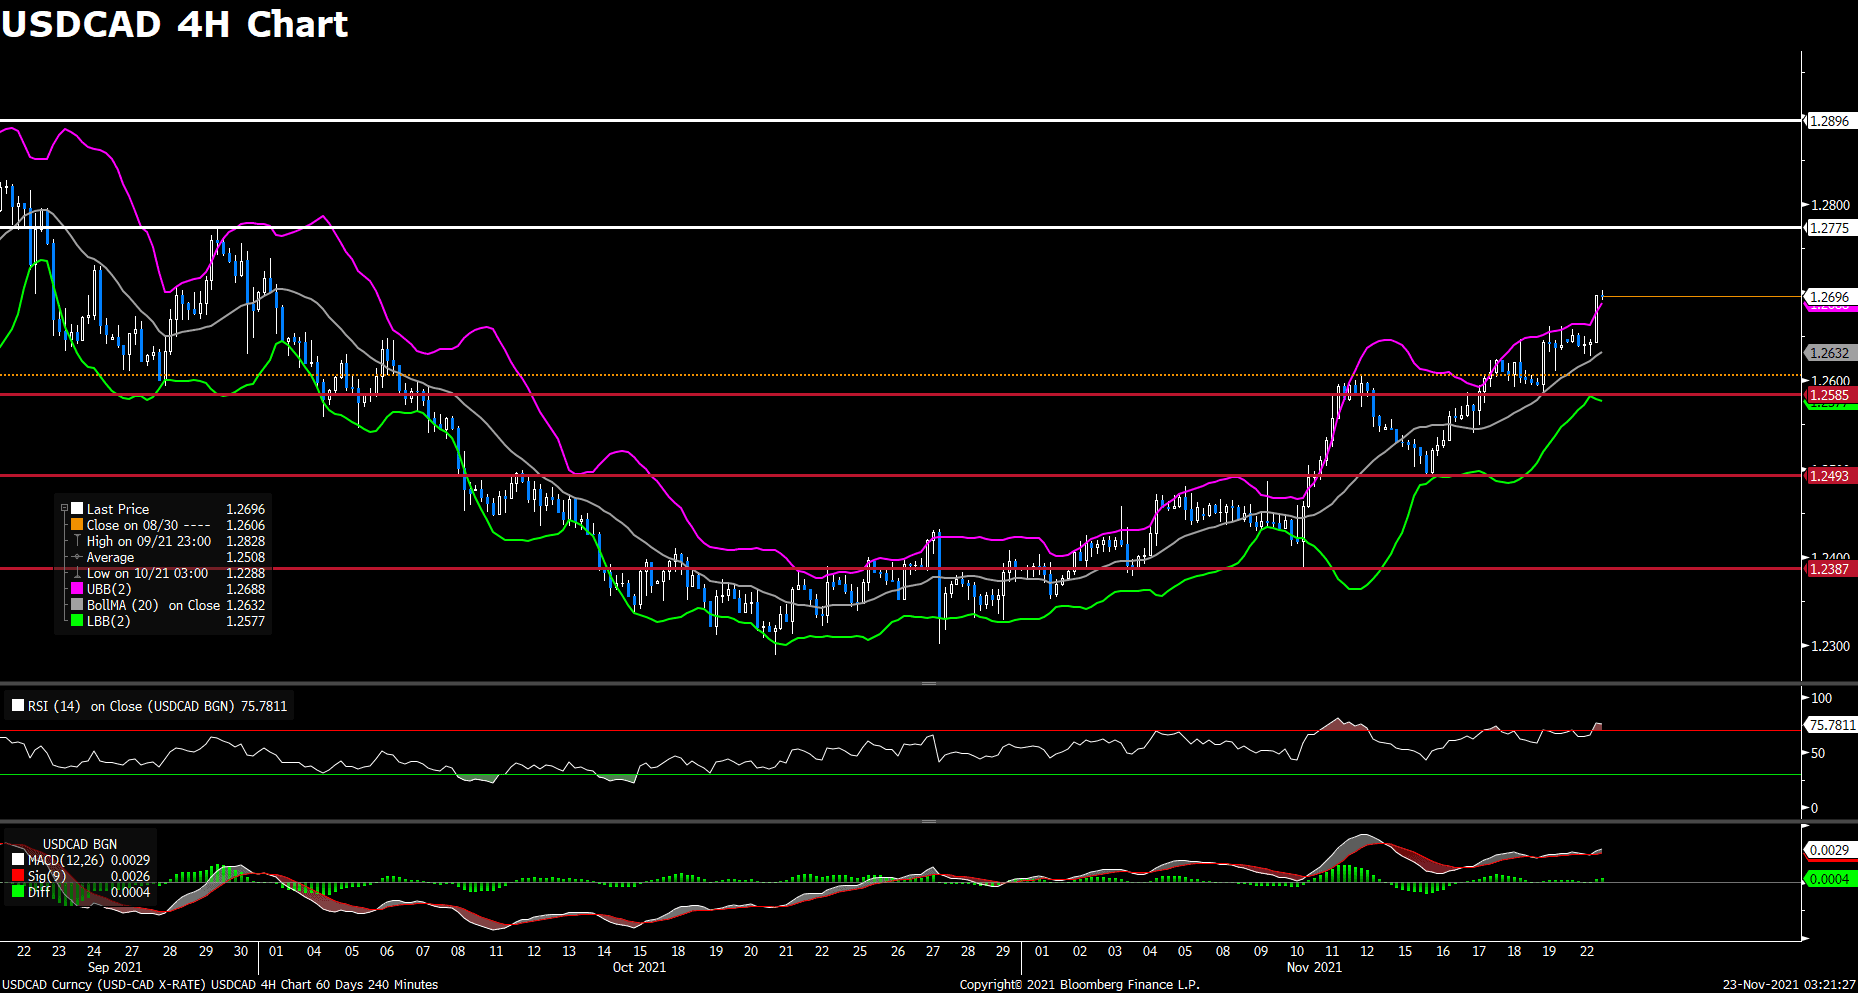
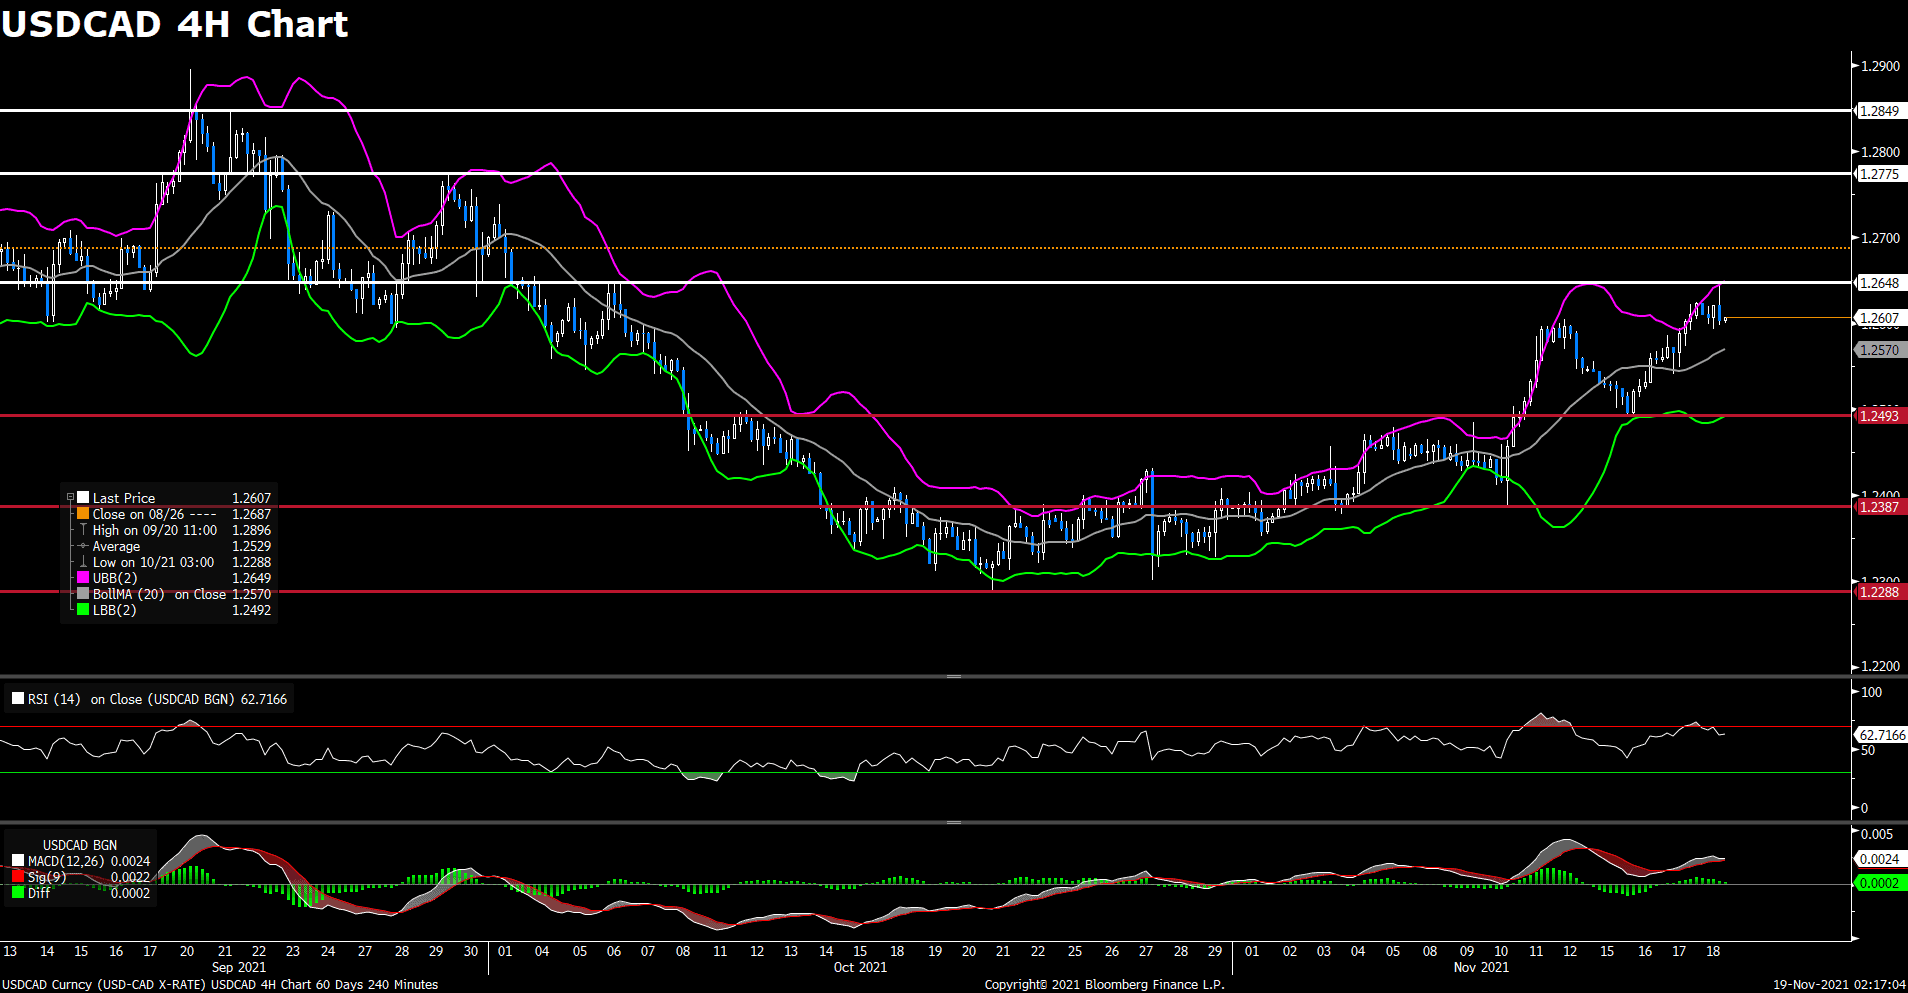
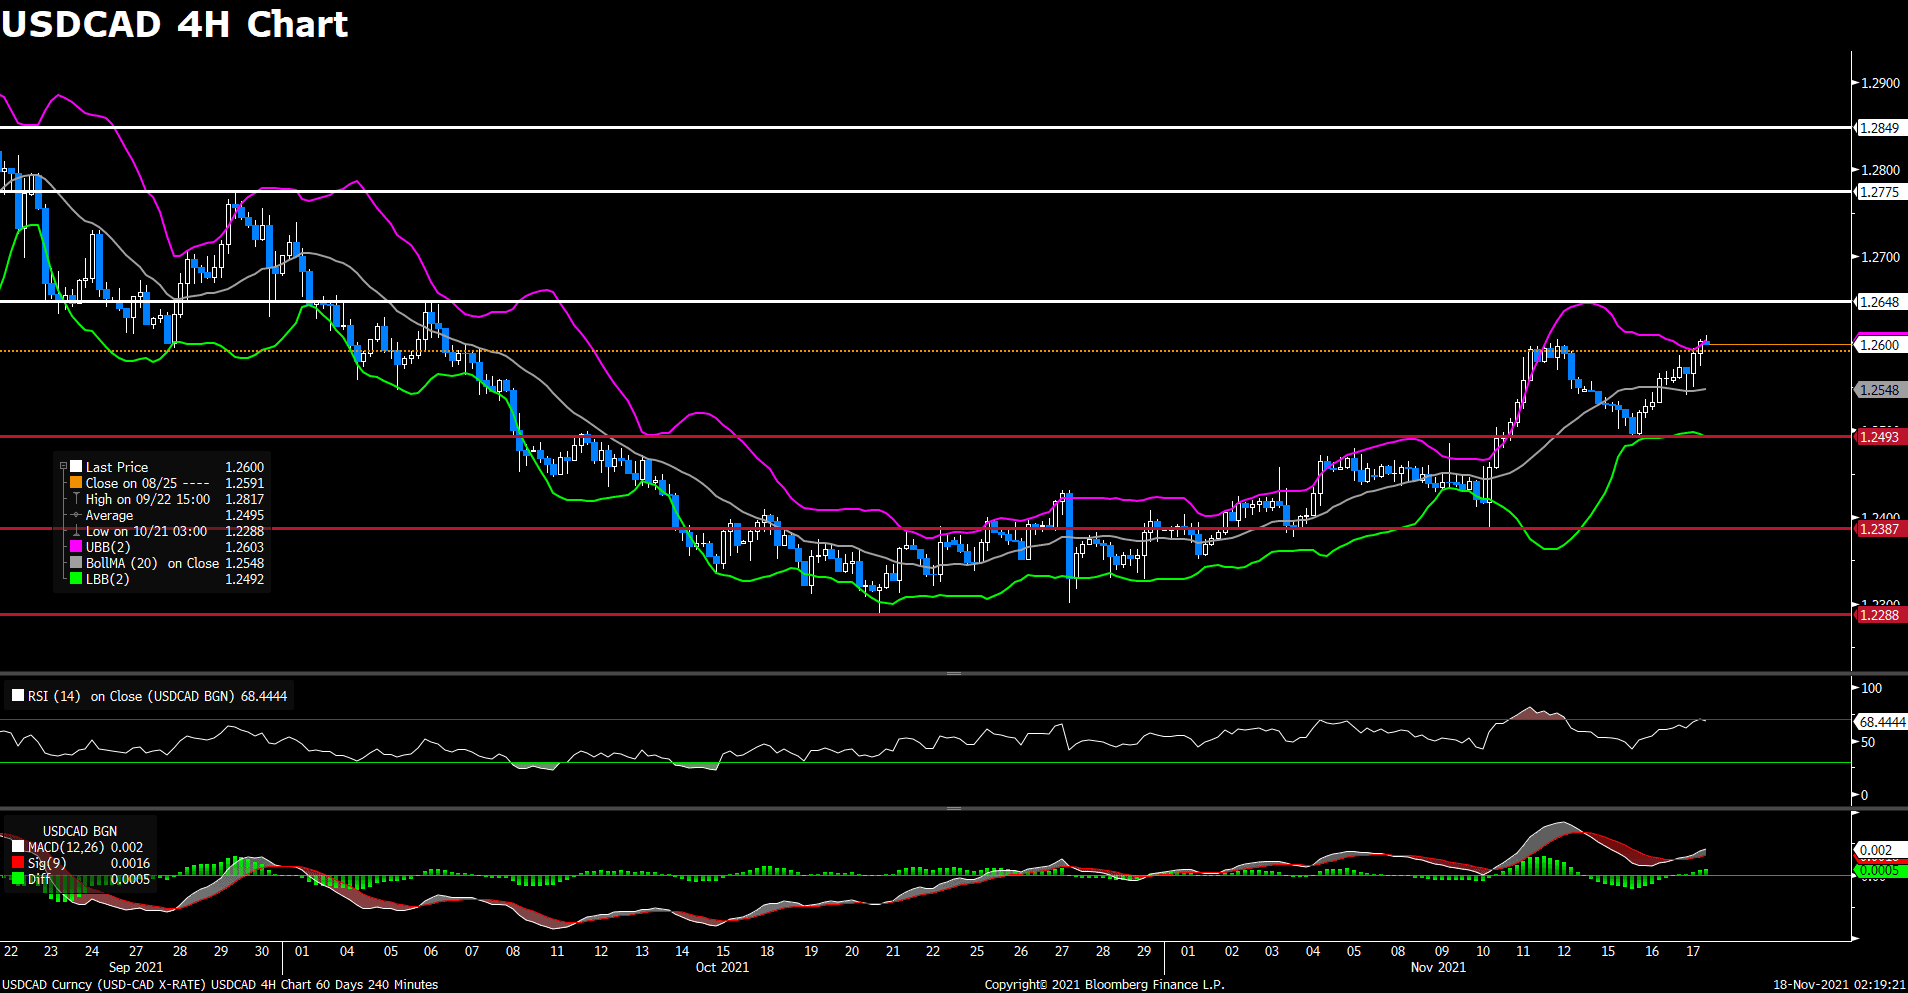
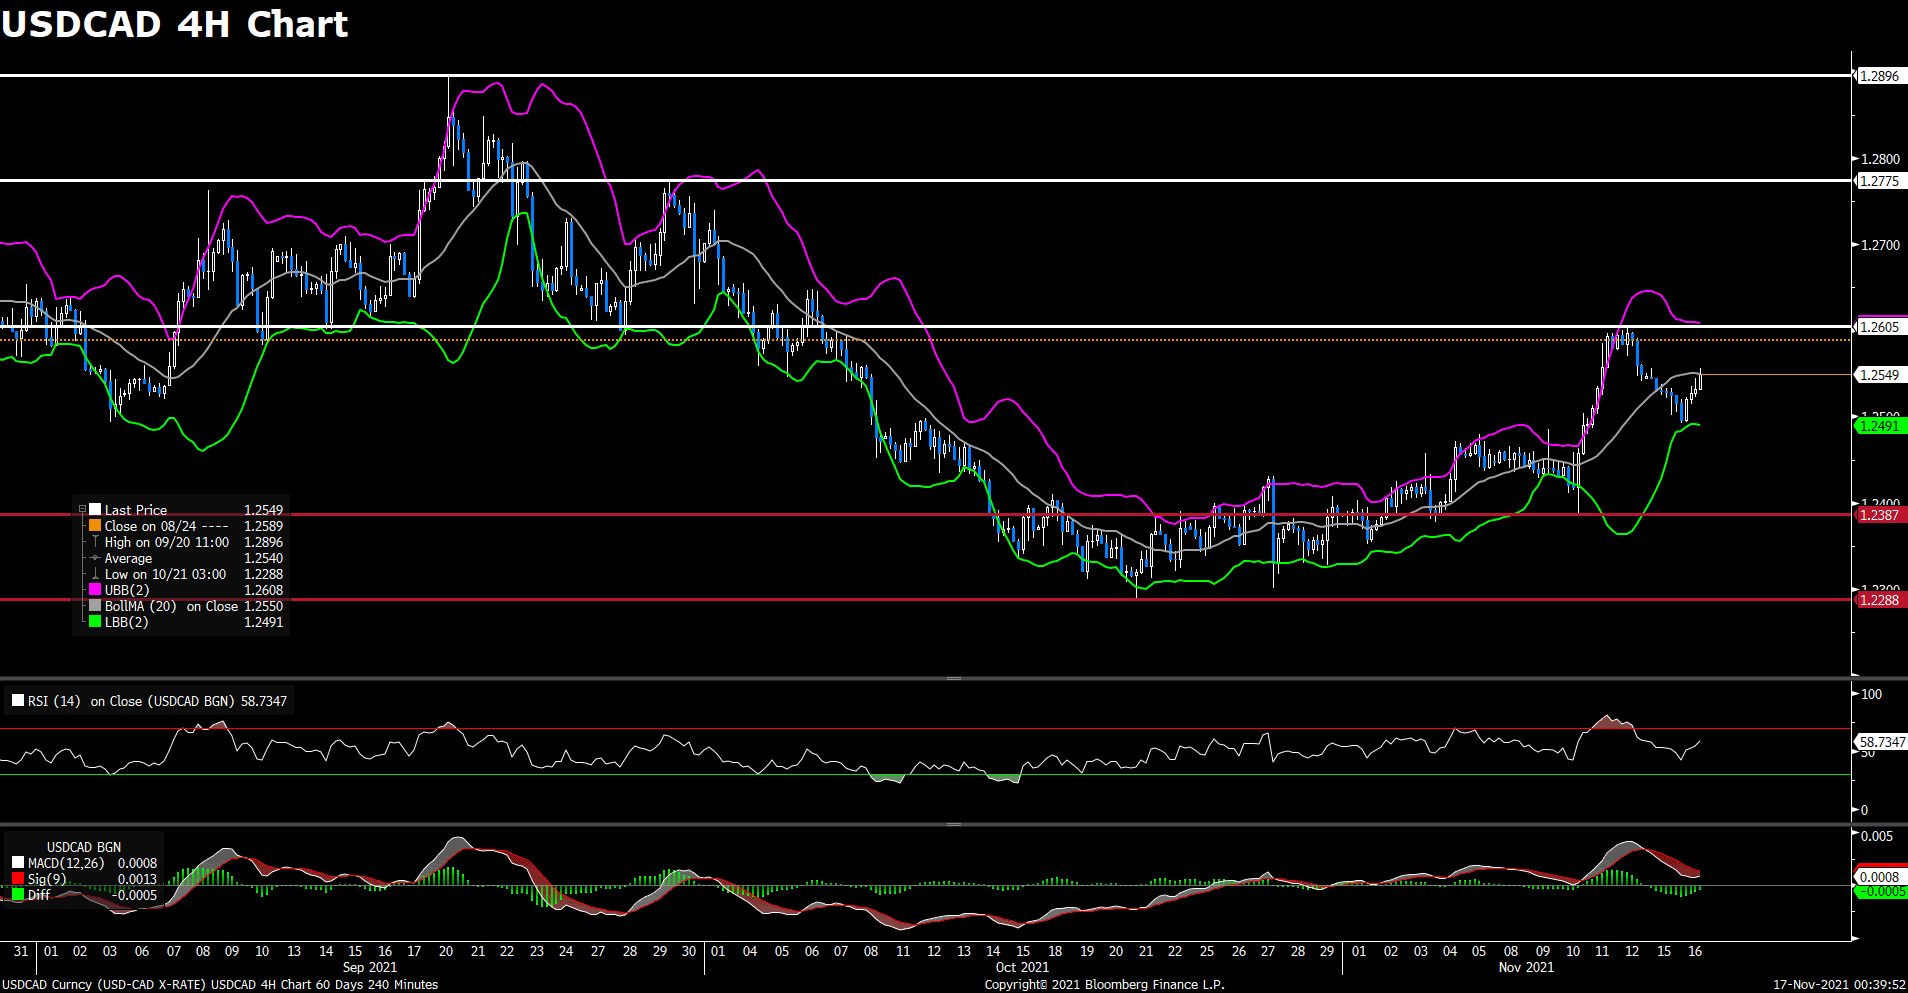
Following its previous rebound from two-week lows near 1.25 area, the pair USD/CAD preserved its bullish momentum and advanced on Tuesday. The pair was trading higher to a daily top above 1.274 during European session, but now has pulled back amid renewed US dollar weakness. USD/CAD was last seen trading at 1.2708, currently posting a 0.05% gain on a daily basis. Oil prices climbed higher to the $78.00 level despite the official announcement by the White House that it will release crude oil reserves. The resurging oil prices lend support to the commodity-linked loonie and dragged the USD/CAD pair lower meanwhile offset most of its intraday gains.

For technical aspect, RSI indicator 69 figures as of writing, suggesting that the pair is in overbought zone, a trend reversal could be expected. Looking at the MACD indicator, the diminishing positive histogram indicates that the pair could experience bearish trend. As for the Bollinger Bands, the price moved out of the upper band first, and dropped right back inside the band, therefore the trend is negated. In conclusion, we think market will be bearish as long as the 1.2775 resistance line holds.

Resistance: 1.2775, 1.2849

Support: 1.2585, 1.2493, 1.2387


Economic Data

Currency

Data

Time (GMT + 8)

Forecast

NZD

RBNZ Interest Rate Decision

09:00

0.75%

NZD

RBNZ Rate Statement

09:00

NZD

RBNZ Press Conference

10:00

EUR

German Ifo Business Climate Index (Nov)

17:30

96.6

USD

Core Durable Goods Orders (MoM) (Oct)

21:30

0.5%

USD

GDP (QoQ) (Q3)

21:30

2.2%

USD

Initial Jobless Claims

21:30

260K

USD

New Home Sales (Oct)

23:00

800K

USD

Crude Oil Inventories

23:30

-0.481M

Market Focus

As investors cheered on the appointment of Federal Reserve Chairman Jerome Powell for the second term, U.S. stocks rose to a record high, and the S&P 500 index surged to a high of the day immediately after the opening of the U.S. market. However, the S&P 500 Index closed lower on Monday as Wall Street Bank expects to raise interest rates in 2022. In addition, rising U.S. Treasury yields put pressure on major growth stocks such as Amazon and Alphabet, which fell -2.83% and -1.92% respectively. Moreover, following the surge in US Treasury yields, the S&P 500 Bank Index rose, as investors investors priced in tighten policy in the first half of 2022. Wells Fargo Bank (WFC.N) is one of the strongest banks on Wall Street.

一張含有 文字 的圖片

自動產生的描述

At the close of the market, the S&P 500 Index fell 15.38 points or 0.32% to close at 4,682.88 points, the Nasdaq Composite Index fell 202.68 points or 1.26% to 15,854.76, and the Dow Jones Industrial Average rose 17.28 points, or 0.05%, to 35,617.83.

Tesla is also one of the biggest gainers, rising 1.74%. Earlier on Monday, Tesla CEO Elon Musk said on Twitter that Model S Plaid may arrive in China “around March.”


Main Pairs Movement:

The US dollar led the way and became the overall winner. In 2021, it set a new high against the euro and a multi-month high against other major competitors. Most of the strength of the dollar comes from US President Joe Biden, who nominated Jerome Powell for re-election as chairman of the Federal Reserve.

The US 10-year bond yield finally rose by nearly 9 basis points to 1.62% in intraday trading. The current yield has returned to its highest level since last Wednesday, and is currently only about 3 basis points lower than last week’s high of 1.65%. With the rise in yields, the US dollar index has also continued to roll to the year’s high of 96.502, and its upward trend seems to be endless.

The EUR/USD is currently hovering near 1.12400 and is in a sharp downward trend because it continues to suffer from the severe wave of Covid19, and the dovish state is also the main key to the weakness.

The price of gold plummeted due to the strengthening of the U.S. dollar, trading at $1,803.00 per ounce. Crude oil prices are rising, and WTI is currently hovering around US$76.70 per barrel.


Technical Analysis:

EURUSD (4- Hour Chart)

After touching the lowest level since July 2020 under 1.126 level, the pair EUR/USD continue its bearish traction on Monday amid US dollar strength. The pair flirted with 1.128 level most of the day, but then dropped towards 1.124 area, currently losing 0.14% on a daily basis at the time of writing. White House announced on Monday that Federal Reserve Chair Jerome Powell was nominated for a second four-year term by President Joe Biden. The news provided strong support to the US dollar and sent the DXY index above 96.4 level. In Europe, concerns about rising Covid-19 cases acted as a headwind for the Euro, as some countries in Europe may reimpose a full lockdown or bring back restrictions to tackle rising infections.

For technical aspect, RSI indicator 30 figures as of writing, suggesting that the pair is in oversold zone, a trend reversal could be expected. Looking at the Bollinger Bands, the price is moving alongside with the lower band, therefore the downward trend is likely to persist. In conclusion, we think market will be bearish as the greenback’s strength still remained by hawkish Fed expectations. A potential move lower towards 1.1200 seems possible as the pair has broken the previous support.

Resistance: 1.1374, 1.1464, 1.1608

Support: 1.1168


GBPUSD (4- Hour Chart)

Following last Friday’s slide, the pair GBP/USD declined for the second day on Monday. The pair was trading in a range near 1.344 area during Asian and early European session, but started to see heavy selling after the announcement of Powell’s renomination as Fed chair. The cable rebounded slightly after touching a two-week low, currently losing 0.28 on a daily basis. The latest dovish comment from BoE governor Andrew Bailey over the weekend put some downward pressure on the GBP/USD pair. Moreover, the deadlock over the post-Brexit arrangement in Northern Ireland and fishing rights continued acting as a headwind for the British pound.

For technical aspect, RSI indicator 41 figures as of writing, suggesting tepid bear movement ahead. Looking at the MACD indicator, the MACD is now sitting below the signal line, which means a downward trend for the pair. As for the Bollinger Bands, the price moved out of the lower band, therefore a strong trend continuation could be expected. In conclusion, we think market will be bearish as the pair is eyeing a test of the next support, which is at 1.3353. Given that there isn’t any major market-moving UK macro data today, investors await Tuesday’s UK PMI reports for trading impetus.

Resistance: 1.3514, 1.3607, 1.3698

Support: 1.3353, 1.3188


USDCAD (4- Hour Chart)

After a five-day rebound from 1.25 area, the pair USD/CAD climbed higher on Monday amid stronger US dollar across the board, now targeting at 1.27 level. The pair jumped to a monthly top after Powell’s renomination, paring its initial intraday losses. USD/CAD was last seen trading at 1.2695, currently posting a 0.45% gain on a daily basis. Even though WTI crude oil has risen 1.15% for the day, the resurging oil prices failed to underpinned the commodity-linked loonie. On top of that, expectations that the Fed will hike rates by the middle of 2022 also acted as a tailwind for the pair, as hawkish Fed speculations were reinforced by elevated US Treasury bond yields.

For technical aspect, RSI indicator 75 figures as of writing, suggesting that the pair is near overbought zone, a trend reversal could be expected. But looking at the MACD indicator, the MACD is now sitting above the signal line, which means that upward trend could persist. As for the Bollinger Bands, the price moved out of the upper band, therefore a strong trend continuation could be expected. In conclusion, we think market will be bullish as the pair already broke the previous 1.2648 support, a break above 1.2775 could intensify the bullish tone.

Resistance: 1.2775, 1.2896

Support: 1.2585, 1.2493, 1.2387


Economic Data

Currency

Data

Time (GMT + 8)

Forecast

EUR

German GDP (QoQ) (Q4)

15:00

2.2%

EUR

German Manufacturing PMI (Nov)

16:30

56.9

GBP

Composite PMI (Oct)

17:30

54.1

GBP

Manufacturing PMI (Oct)

17:30

56.3

GBP

Services PMI (Oct)

17:30

54.6

Market Focus

Stocks looked set to fall Monday weighed by growing concerns over nationwide COVID-19 lockdowns in Europe that raised fears about new restrictions beyond the continent, and the risk of a faster withdrawal of Federal Reserve stimulus. The Treasury yield curve was near the flattest since the pandemic’s onset. Stocks ended mixed on Friday, Dow Jones slid 200 points, or 0.6%, settling at its lowest levels in 3 weeks and down 1% on the week, while the S&P 500 notched a slim daily gain, 0.32% throughout the week. However, the Nasdaq Composite set a fresh record, bolstered by rallying technology shares.

一張含有 文字 的圖片

自動產生的描述

Former Credit Suisse Group AG bankers have told criminal investigators that the bank is still helping U.S. clients hide accounts from the Internal Revenue Service, even after the firm paid $2.6 billion in penalties in 2014 and promised to stop the practice.

The latest allegations of wrongdoing come during a tumultuous year for the Zurich-based bank, which lost $5.5 billion in the blowup of family office Archegos Capital Management and had to unwind client funds that were managed with collapsed lender Greensill Capital. It also is happening weeks after the U.S. Justice Department vowed to crack down on corporations that repeatedly violate the law.

The bankers who came forward said that Credit Suisse opened accounts for South American clients who held dual citizenship, but bank documents failed to indicate they were U.S. citizens, according to people familiar with the matter. Some of the accounts held tens of millions of dollars, the people said. U.S. taxpayers are supposed to pay taxes on income earned anywhere in the world, and disclose their offshore accounts to the Treasury Department, even if they have dual citizenship.

Over the summer, those bankers were interviewed by U.S. tax prosecutors, IRS criminal agents and U.S. Senate investigators, the people said. Credit Suisse still faces fallout from the 2014 guilty plea of its main banking unit, which admitted helping thousands of Americans evade taxes.


Main Pairs Movement:

The greenback may remain its robust northern momentum in the week ahead as markets turn to important macro risks from the U.S. Inflation has been a hot topic in the country, with headline price growth at its most aggressive since the early 1990s using YoY timeframes. Now, the Federal Reserve’s preferred gauge of inflation, core PCE, is in focus.

It is expected to breach the 4.1% YoY record in October, up from previous 3.6%. That would be the fastest pace since January 1991. Ongoing elevated price readings above the central bank’s target would likely continue to keep Fed policymakers on their toes. Still, the broader argument from the central bank remains that the recent bout of inflation is ‘transitory’.

EUR/USD closed on Friday with another dip to below the 1.1300 threshold, and GBP/USD also dropped hard to around 1.3440. Commodity-linked currencies slumped severely as well, with USD/CAD regained 1.2650, AUD/USD fell to the 0.7230 level, and erased its gains on Thursday, again fell underneath 0.7000. Japanese Yen is the top performer among the majors, outplaying the vigorous US dollar amid lower US yields and falling equity prices

Amid the strength of the US dollar, gold price slipped to $1845 a troy ounce, and crude oil prices savagely plummeted over 3%, with WTI plunged 4.07% to $75.30, and Brent dived 3.23% to $78.45.


Technical Analysis:

EURUSD (4- Hour Chart)

The pair EUR/USD declined on Friday amid US dollar strength, ending its previous rebound from 2021 lows near 1.126. The pair flirted with 1.136 level during Asian session, then started to see heavy selling in early European session. At the time of writing, EUR/USD has rebounded moderately and pared some of its losses, currently losing 0.50% on a daily basis. The stronger US dollar across the board is mainly due to risk-off market sentiment, as the DXY index touched a yearly high above 96.2. In Eurozone, German PPI report today showed that Producer Prices rose more than expected in October at a monthly 3.8%. But ECB’s Chairwoman Lagarde kept her dovish tone and said there is no rush to tighten the current monetary conditions, which put the EUR/USD pair under pressure.

For technical aspect, RSI indicator 38 figures as of writing, suggesting tepid bear movement ahead. For the MACD indicator, a diminishing positive histogram also indicates a downward trend for the pair. Looking at the Bollinger Bands, the price moved out of the lower band first and move immediately back inside the band, which means a bull movement. In conclusion, we think market will be bearish as the greenback’s appreciation should keep weighing on the pair. If price break below the 1.1250 support, the slide could extend further to 1.1168, which was touched in June 2020.

Resistance: 1.1374, 1.1464, 1.1608

Support: 1.1250, 1.1168


GBPUSD (4- Hour Chart)

In line with EUR/USD pair’s price movement today, the pair GBP/USD also declined on Friday and dropped to a fresh daily low under 1.341 in early European session. Despite trying to rebound back above 1.347 level, the pair still stays in negative territory now, currently losing 0.17% on a daily basis. The UK Retail Sales data released today showed that retail sales in October rose by 0.8% on a monthly basis, better than market’s expectation for an increase of 0.5%. But the upbeat data failed to support the cable, as the risk-off market mood underpinned the safe-haven US dollar and dragged the cable lower.

For technical aspect, RSI indicator 52 figures as of writing, suggesting tepid bull movement ahead. As for the Bollinger Bands, the price crossed above the moving average after rising from lower band is moving alongside the upper band, therefore a upward trend continuation could be expected. In conclusion, we think market will be bullish as the pair might attract some dip-buyers and re-test the 1.3514 resistance. A break above that level should clear the way towards the 1.3607 mark

Resistance: 1.3514, 1.3607, 1.3698, 1.3834

Support: 1.3397, 1.3353

Market Focus

Technology stocks drove the equity market to a record in a volatile session ahead of Friday’s options expiration. S&P 500 notched its 66th all-time high of 2021, with the benchmark gauge poised for the second-biggest number of annual records ever — only behind 1995. Tech-heavy Nasdaq 100 outperformed as giant chipmaker Nvidia Corp. boosted its outlook, while Apple Inc. jumped after Bloomberg News reported the company is pushing to accelerate the development of its electric car. Macy’s Inc. and Kohl’s Corp. paced gains in retailers after signaling consumer demand remains robust. Dow Jones dropped, down 0.17%.

一張含有 文字 的圖片

自動產生的描述

The nonpartisan Congressional Budget Office estimated that President Joe Biden’s signature economic package doesn’t contain enough tax increases to pay for itself — a determination that counters White House claims but may not be enough to sink the bill.

The CBO found that the draft legislation, on which the House plans to vote late Thursday, contains $1.636 trillion of spending, while raising $1.269 trillion in revenue over 10 years. That would add $367 billion to the U.S. budget deficits over the decade.

The score will, however, give ammunition to Republicans — who are already attacking the bill by arguing it will increase inflation, stifle job creation and foster dependency on the government, in addition to saying it will add to the national debt.

A key reason the CBO finds the bill does not pay for itself involves estimates of how much increased tax collection can result from expanding the IRS’s budget. While the White House has projected that increasing the number of enforcement agents at the Internal Revenue Service would yield $400 billion in higher revenue, the CBO does not agree.


Main Pairs Movement:

The US dollar continued to lose strength against most of its major rivals during Thursday’s trading hours. The dollar index dropped 0.3% to around 95.50, with EUR regained its lost lands amid the dollar weakness, and the Japanese Yen being the worst performer as the revived risk-on market mood weighed on the save haven.

The Euro pair rebounded from its yearly low, surged 60 pips during the day and trading at 1.1365 at the moment. Cable extended its previous gains, posting a modest 0.06% increase to around the 1.3500 key level. Loonie hovered around 1.2600 throughout the day, while high yielding pairs like Aussie and Kiwi climbed 0.14% and 0.65% respectively. USD/JPY advanced on Thursday after the yesterday’s plummet, closing the day at 114.25.

Gold consolidated around the $1850-70 price levels per troy ounce across the week, the upward momentum seems to come to a halt after last week’s skyrocketing. Crude oil prices posted mild gains, with WTI ending the day red at $78.85 a barrel, and Brent up to $81.05. US yields remained on the familiar levels, with 10-year benchmark unchanged at 1.590.


Technical Analysis:

EURUSD (4- Hour Chart)

Following previous day’s rebound from 2021 lows near 1.126, the pair EUR/USD continued to see some buying on Thursday amid US dollar weakness. Despite staying in negative territory in late Asian session, the pair regained bullish momentum and extended further after European session started, currently rising 0.32% on a daily basis. The risk-on market sentiment weighed on the safe-haven US dollar and lend some support to the EUR/USD pair. But the better-than-expected US job data limit further gains for the pair, as weekly initial jobless claims falling to a fresh post-pandemic low at 269K. In Eurozone, the rising cases in Covid-19 and yesterday’s dovish ECB comments might cap the upside for the pair.

For technical aspect, RSI indicator 45 figures as of writing, suggesting tepid bear movement ahead. But for the MACD indicator, the MACD is now sitting above the signal line, which indicates a possible upward trend for the pair. Looking at the Bollinger Bands, the price crossed above the moving average after touching the lower band, therefore the upper band becomes the profit target. In conclusion, we think market will be bullish as the pair is eyeing a test of 1.1464 resistance. If price break above that level, the rebound could extend further.

Resistance: 1.1464, 1.1617, 1.1692

Support: 1.1264, 1.1168


GBPUSD (4- Hour Chart)

The pair GBP/USD edged higher on Thursday, continuing its five-day recovery from a yearly low. The pair touched a daily high in early European session, but then failed to preserve its bullish momentum and dropped toward 1.347 area. The cable starts to see fresh buying at the time of writing, rising 0.05% on a daily basis. Weaker US dollar across the board pushed the cable higher, as sudden changes in the market mood dragged the US 10-year Treasury yield down to 1.582%. In the UK, concerns about the possibility that the UK government would trigger Article 16 of the Northern Ireland Protocol still remained. Meanwhile, the deadlock over the post-Brexit fishing rights also acted as a headwind for the British pound.

For technical aspect, RSI indicator 56 figures as of writing, suggesting bull movement ahead. But looking at the MACD indicator, the positive histogram also indicates a possible downward trend for the pair. As for the Bollinger Bands, the price is moving alongside the upper band, therefore a trend continuation could be expected. In conclusion, we think market will be bullish as the pair is heading to re-test the 1.3607 resistance. A sustained strength beyond the 1.3500 level could attract bulls to position further appreciating move for the GBP/USD pair.

Resistance: 1.3607, 1.3698, 1.3835

Support: 1.3417, 1.3353


USDCAD (4- Hour Chart)

After reaching a fresh monthly top above 1.264 level earlier on Thursday, the pair USD/CAD pulled back to 1.262 area amid renewed US dollar weakness. The pair pared its intraday gains and turned into negative territory, currently losing 0.04% on a daily basis. The upbeat US job data failed to boost the greenback today, as the DXY index dropped further to 95.55 area. Rising crude oil prices provided some bullish momentum for the commodity-linked loonie and dragged the USD/CAD pair lower. Market focus now shifts to Canada’s Retail Sales reports released on Friday, as investors looking for some trading impetus.

For technical aspect, RSI indicator 61 figures as of writing, suggesting bull movement ahead. But looking at the MACD indicator, a death cross is forming on the histogram and a bearish trend could be expected. As for the Bollinger Bands, the price is falling from the upper band and is likely to touch the moving average. In conclusion, we think market will be bearish as long as the 1.2648 support line holds.

Resistance: 1.2648, 1.2775, 1.2849

Support: 1.2493, 1.2387, 1.2288


Economic Data

Currency

Data

Time (GMT + 8)

Forecast

GBP

Retail Sales (MoM) (Oct)

15:00

0.5%

EUR

ECB President Lagarde Speaks

16:30

CAD

Core Retail Sales (MoM) (Sep)

21:30

-1.0%

VT Markets Notification of trading adjustment in holiday

Dear Client,

Please note that adjustment on following products due to Thanksgiving Day,and Day after Thanksgiving.

If you have any questions, our team will be glad to answer your questions. Please mail to [email protected] or contact the service online.

VT Markets The Adjustment Of Weekly Dividend Notification

Dear Client,

Warmly reminds you that the component stocks in the stock index spot generate dividends. When dividends are distributed, VT Markets will make dividends and deductions for the clients who hold the trading products after the close of the day before the ex-dividend date.

Indices dividends will not be paid/charged as an inclusion along with the swap component. It will be executed separately through a balance statement directly to your trading account, the comment for which will be in the following format “Div & Product Name & Net Volume ” .

Please note the specific adjustments as follows:

Note: The above data is for reference only, the actual execution data may be changed, please refer to the MT4/MT5 software for details.

If you’d like more information, please don’t hesitate to contact [email protected].

Market Focus

Equities retreated on concern that inflation could weigh on the global economic rebound, pushing central banks to raise interest rates sooner than expected.

Traders took some risk off the table as data signaled house builders are struggling to break ground on projects amid high materials prices and ongoing labor shortages. Target Corp. sank after warning that cost pressures are creeping up, stoking fears they will dent profits at retailers. In late trading, Cisco Systems Inc., the biggest maker of computer networking equipment, slumped on a lackluster revenue forecast, hurt by a shortage of components that’s making it difficult to keep up with demand.

一張含有 文字 的圖片

自動產生的描述

(The data mentioned below is provided by Bloomberg)

Private equity firms are pulling money out of their companies at a breakneck pace, thanks to investors that are pouring money into loan funds to get protection from inflation.

Companies this year have borrowed or are planning to borrow more than $88 billion in the U.S. leveraged loan market to fund dividend payments to their private equity owners. That’s the most for a year since at least 2013 when Bloomberg began compiling the data, which includes loans whose proceeds are in part for dividend payments but also go toward uses like refinancing debt.

Private equity firms are reaping the benefits, using the intense demand for loans to pile even more borrowings onto the heavily-indebted companies they own. KKR & Co.’s Internet Brands, whose assets include the WebMD medical advice website, is borrowing $4.8 billion to refinance debt and to pay a dividend of around $1 billion, according to a report by Moody’s Investors Service.


Main Pairs Movement:

The greenback’s recent hike seemed to run out of gas on Wednesday, with the dollar index falling back to the 95.80s by the end of the New York session having printed fresh 16-month highs at 96.26 in early Asia trade. The White House said a final decision on the Fed chair nominee would be made before Thanksgiving (11/25).

Mixed US housing data failed to spur the greenback higher as positive retail sales, regional Fed manufacturing survey and Consumer Price inflation data did in recent sessions. US yields pulled back a little, with the 10-year benchmark dropping 2bps back to 1.60%, somewhat eroding dollar’s rate advantage.

Most of the major currencies added value against the US dollar. Among all, the JPY was the best performer, as USD/JPY rallied 0.6% amid the US/Japan rate differentials tightened. On the flip side, the AUD/USD down 0.5%. RBA’s dovish stance starts to cap the Australian dollar as the inflationary pressure drives most major central banks to a tighter monetary policy.

Gold closed in green for another day after the two-day correction at the start of the week. Refreshed inflation fears help boost the yellow metal and analysts set up goal up to $1910/ounce. Crude oil prices, however, were smashed on Wednesday, with WTI dropped 3% to $78.20, and Brent declined 2.6% to $80.20.


Technical Analysis:

EURUSD (4- Hour Chart)

Following yesterday’s slide to 1.132 area, the pair EUR/USD continued to stay in negative territory on Wednesday. The pair tumbled further and touched new 2021 lows near 1.126 level in mid-Asian session, but then rebounded back above 1.132 to pared its intraday losses. The previous sharp pullback in the pair was mainly due to US dollar strength, as the upbeat Retail Sales data and rising US Treasury bond yields on inflation fears both acted as a tailwind for the greenback. In Eurozone, CPI report showed that inflation arrives at 4.1% YoY in October, which is the same as market expectations. Earlier in the day, ECB president Christine Lagarde said that tightening monetary policy to ease inflation could suppress the eurozone’s recovery, and the dovish comments dragged the pair lower.

For technical aspect, RSI indicator 23 figures as of writing, suggesting that the pair is in oversold zone, a trend reversal could be possible. For the MACD indicator, the MACD is now sitting below the signal line, which also indicates a possible downward trend for the pair. Looking at the Bollinger Bands, the price moves alongside the lower band, therefore the bearish momentum is likely to persist. In conclusion, we think market will be bearish as the pair still remain under pressure, and a test of the 1.1168 support is likely.

Resistance: 1.1464, 1.1608, 1.1692

Support: 1.1168, 1.0871


GBPUSD (4- Hour Chart)

The pair GBP/USD advanced on Wednesday, continuing to recover from yearly lows that touched last week. The pair preserved its bullish momentum and reached a fresh daily top near 1.349 area in early American session. The cable was last seen trading at 1.3485, rising 0.42% on a daily basis. Recent buying witnessed in GBP/USD pair arise from hotter-than-expected UK CPI report, which showed that consumer prices surged to 4.2% in October with the fastest pace since December 2011. The stronger data underpinned the GBP/USD pair and enhanced expectations for an early rate hike by BoE. However, the prospects for an early policy tightening by the Fed might cap the upside for the pair.

For technical aspect, RSI indicator 59 figures as of writing, suggesting bull movement ahead. Looking at the MACD indicator, the increasing positive histogram also indicates a possible upward trend for the pair. As for the Bollinger Bands, the price is moving out of the upper band, therefore a strong trend continuation could be expected. In conclusion, we think market will be bullish as the pair is heading to re-test the 1.3607 resistance. The bullish tone could be intensified if the pair break above that resistance.

Resistance: 1.3607, 1.3698, 1.3830

Support: 1.3353


USDCAD (4- Hour Chart)

Following previous day’s rebound from 1.250 area, the pair USD/CAD continued to climb further on Wednesday. The pair edged lower and touched a daily low in early European session, but started to see heavy buying entering American trading hours. Now USD/CAD pair is flirting with 1.260 level, currently rising 0.32% on a daily basis. Falling crude oil prices weighed heavily on the commodity-linked loonie and acted as a tailwind for the pair, as WTI dropped to fresh daily lows despite a positive inventory report. The surging oil demand might encourage the Biden administration to release crude oil reserves.

For technical aspect, RSI indicator 71 figures as of writing, suggesting that the pair is in overbought zone, a trend reversal could be possible. Looking at the MACD indicator, the MACD is now sitting above the signal line, which also indicates a possible upward trend for the pair. As for the Bollinger Bands, the price is moving out of the upper band, therefore a strong trend continuation could be expected. In conclusion, we think market will be bullish since the pair has rose above the previous 1.2605 support..

Resistance: 1.2648, 1.2775, 1.2849

Support: 1.2493, 1.2387, 1.2288


Economic Data

Currency

Data

Time (GMT + 8)

Forecast

USD

Initial Jobless Claims

21:30

260K

USD

Philadelphia Fed Manufacturing Index (Nov)

21:30

24.0

VT Markets Notification of Server Upgrade

Dear Client,

As part of our commitment to providing the best reliability and service to our client, we are planning an upgrade in our MT4/MT5 server and Client Portal on this weekend.

As a result, we will keep the maintenance according to the following schedule and will reopen for trading at 00:00 (GMT+2, system time) on Monday, November 22, 2021.

Kindly be reminded that the following things might be affected during this maintenance period:

1. The login and operation of the client portal

2. The login of the trading account

3. Demo accounts will be temporarily unavailable for opening/logging/trading.

4. The quotations on MT5 server will be paused. Clients might not be able to open new positions or close the held positions.

5. There might be a gap between the original price and the price after maintenance. Pending orders, Stop Loss, and Take Profit settings within the gap will be filled at the market price after maintenance ends.

After the upgrade, clients can login to trading account using the server which is shown in the account activation mail.

No action is required by our client. Your service will be back online after the maintenance is completed.

Thank you for your patience and understanding with regard to this important initiative.

If you’d like more information, please don’t hesitate to contact [email protected].

Market Focus

Eqiuities climbed after the largest increase in U.S. Retail Sales since March, with reports from industry leaders Walmart Inc. and Home Depot Inc. showing strong demand even as inflation pares down purchasing power.

The robust retail figures along with better-than-anticipated Industrial Production and Housing Market index helped lift the US stocks, overshadowing words from St. Louis Fed’s head James Bullard that the central bank should accelerate its cut on monetary stimulus to ease inflation. All major equity benchmarks advanced, with the S&P 500 extending its November uptrend, Nasdaq surging 0.76% to 15973.86, and Dow Jones up a modest 0.15%, closing the day at 36142.22.

一張含有 文字 的圖片

自動產生的描述

China is speeding up plans to replace American and foreign technology, quietly empowering a secretive government-backed organization to vet and approve local suppliers in sensitive areas from cloud to semiconductors, people familiar with the matter said.

Formed in 2016 to advise the government, the Information Technology Application Innovation Working Committee has now been entrusted by Beijing to help set industry standards and train personnel to operate trusted software. The quasi-government body will devise and execute the so-called “IT Application Innovation” plan, better known as Xinchuang (新創) in Chinese. It will choose from a basket of suppliers vetted under the plan to provide technology for sensitive sectors from banking to data centers storing government data, a market that could be worth $125 billion by 2025.

The existence of the Xinchuang white-list, whose members and over-arching goals haven’t been previously reported, is likely to inflame tensions just as Presidents Joe Biden and Xi Jinping wrapped up their first face-to-face virtual summit. It gives Beijing more leverage to replace foreign tech firms in sensitive sectors and quickens a push to help local champions achieve tech self-sufficiency and overcome sanctions first imposed by the Trump administration in fields like networking and chips.


Main Pairs Movement:

The greenback beat most of its major rivals amid the dollar index reaching fresh 2021 highs. The dollar was partially underpinned by a sour market mood, later by upbeat US Retail Sales.

Many fresh macro events were due on Tuesday. The upbeat UK labor market figures helped Cable to climb amid the robust USD, while the Euro pair continued its downtrend the previous day, as there was no surprise in the European GDP. Commodity-linked currencies were all shattered by the soaring dollar and the weakness of the oil prices, AUD/USD down 0.6% to 0.7300, and USD/CAD climbed 0.35% to 1.2550. The Japanese Yen was the worst performer, with USD/JPY surging 0.61% to a fresh yearly high at 114.85.

Gold reached a fresh multi-month high of $1,877.15 but pulled back to close in the red for a second consecutive day in the 1,850 price zone. Crude oil prices were mixed, with WTI down to $79.70 a barrel, and Brent posted a modest gain to $82.35. EU gas prices were up over 12%, as Germany suspended Nord Stream 2 certification. Geopolitical tensions escalated in Europe, along with the higher gas prices, would add pressure to current inflationary situations.


Technical Analysis:

EURUSD (4- Hour Chart)

The pair EUR/USD continued to fall on Tuesday, touching the lowest level since July 2020 and remains under heavy pressure. The pair was flirting with 1.137 area during Asian and early European session, but then dropped towards a fresh yearly low amid renewed US dollar strength. The pair is currently losing 0.20% on a daily basis. Furthermore, the US Retail Sales released today showed an expansion of 1.7% in October, while Industrial Production expanded 1.6%. The upbeat data underpinned the greenback and pushed the DXY index higher to 95.74 at the time of writing. Investors now awaits ECB President Lagarde’s speech, as a different tone might change the outlook on the EUR/USD.

For technical aspect, RSI indicator 18 figures as of writing, suggesting that the pair is in oversold zone, a trend reversal could be possible. For the MACD indicator, the MACD is now sitting below the signal line, which also indicates a possible downward trend for the pair. Looking at the Bollinger Bands, the price moves alongside the lower band, therefore the bearish momentum is likely to persist. In conclusion, we think market will be bearish as the continuation of the downtrend could drag the pair lower, a drop below 1.1168 opens the door to a deeper pullback.

Resistance: 1.1464, 1.1608, 1.3834

Support: 1.1168, 1.0871


USDCAD (4- Hour Chart)

The pair USD/CAD advanced on Tuesday, ending its previous two-day slide amid resurging US dollar. The pair followed yesterday’s bear movement and dropped to a four-day low in early Asian session, but then rebound back above 1.254 level during American session. The pair is currently rising 0.28% on a daily basis. In addition to the surprising US Retail Sales report, the cautious market sentiment and hawkish Fed expectations also supported the safe-haven US dollar, which caused the USD/CAD pair to see fresh buying. But the pull back witnessed in US Treasury bond yields might cap the upside for the pair. On top of that, falling crude oil prices also weighed on the commodity-linked loonie.

For technical aspect, RSI indicator 58 figures as of writing, suggesting bull movement ahead. Looking at the MACD indicator, the diminishing negative histogram also indicates a possible upward trend for the pair. As for the Bollinger Bands, the price crossed above the moving average after touching the lower band, therefore the upper band becomes the profit target. In conclusion, we think market will be bullish as the pair is heading to re-test the 1.2605 resistance. The bullish tone could be intensified if the pair break above that resistance.

Resistance: 1.2605, 1.2775, 1.2896

Support: 1.2387, 1.2288


AUDUSD (4- Hour Chart)

The pair AUD/USD tumbled on Tuesday, retreating from daily highs above 0.7365 level due to stronger US dollar across the board. The pair is surrounded by heavy selling pressure, losing 0.47% on a daily basis. Upbeat US Retail Sales data lend some support to the US dollar and dragged the AUD/USD pair lower. Moreover, the Reserve Bank of Australia announced its monetary policy minutes today, as the bank insisted on its previous standpoint that the cash rate will stay unchanged until 2024 unless wage growth and inflation targets are met. RBA Governor Philip Lowe also said that recent data would not support a rate hike in 2022.

For technical aspect, RSI indicator 38 figures as of writing, suggesting bear movement ahead. Looking at the MACD indicator, a death cross is forming on the histogram, which also indicates a bear market. As for the Bollinger Bands, the price crossed below the moving average after touching the upper band, therefore the lower band becomes the loss target. In conclusion, we think market will be bearish as the pair is eyeing a test of the 0.7277 support.

Resistance: 0.7371, 0.7431, 0.7471

Support: 0.7277, 0.7227, 0.7170


Economic Data

Currency

Data

Time (GMT + 8)

Forecast

EUR

ECB President Lagarde Speaks

09:20

GBP

CPI (YoY) (Oct)

15:00

3.9%

EUR

CPI (YoY) (Oct)

18:00

4.1%

USD

Building Permits (Oct)

21:30

1.638M

CAD

Core CPI (MoM) (Oct)

21:30

USD

Crude Oil Inventories

23:30

1.398M

Market Focus

After closing down 0.3% to 0.7% last week, the three major US stock indices opened higher this week. As optimistic Chinese economic data eased concerns about the slowdown in the world’s second largest economy, world stock markets are optimistic after recent record highs.

Five minutes after the market opened, the three indexes opened higher, the Dow Jones Industrial Average rose by 0.32%, the S&P500 Index rose by 0.23%, and the Nasdaq Index rose by 0.26%. However, as US Treasury yields reversed and climbed, these three indices became weaker. In the end, the S&P 500 Index closed flat at 0.0%, the Dow Jones Industrial Average fell 0.04%, and the Nasdaq Index fell 0.07%.

一張含有 文字 的圖片

自動產生的描述

Utilities, energy and consumer staples-the defensive sector of the market-led the gains, indicating that investor sentiment remains unstable. In the utility index, Entergy Corp outperformed the market on a strong trading day, rising 3.39% to $105.04. Tyson Foods has become the largest increase in consumer staples after announcing that its fourth-quarter earnings and profits exceeded expectations. Kinder Morgan, Phillips 66 and Chevron led gains in the energy sector, thanks to UBS’s upgrade to a neutral buy rating based on higher oil price expectations. On the other hand, the rise in U.S. Treasury yields is reflected in Tesla, dragging down consumer discretionary stocks. The company’s stock price fell 1.9% and continued to fall since last week, when CEO Elon Musk sold Tesla stock worth nearly $7 billion.


Main Pairs Movement:

After the optimistic Chinese data, market sentiment was positive at the opening of the market, but subsided after the opening of Wall Street. U.S. Treasury yields rose without a clear catalyst. The reversal of Treasury yield gave the greenback strong momentum, pushing the US dollar index above the level of 95, which is a new high since July 2020. As the US dollar climbed, the euro performed the worst, falling to a new low of 1.1381 against the dollar in 2021.On the other hand, as inflation hit a new high in the United States, the price of gold has climbed to its highest level in nearly three months. The gold after breaking through the pivot resistance level of $1,834, gold has set a five-month high of $1,870.The next important resistance level is $1,878, then $1,900.

On Tuesday, the Bank of Australia will release the latest meeting minutes, while the US will release October retail sales data. In addition, the UK will release employment data for October.


Technical Analysis:

GBPUSD (4- Hour Chart)

Following last Friday’s recovery move from yearly lows, the pair GBP/USD continued to rebound on Monday. The pair dropped to a daily low in early European session, but then started to see some fresh buying and climbed above 1.342 level amid US dollar’s weakness. The cable now stays in positive territory while rising 0.09% on a daily basis. The downbeat US consumer sentiment data and risk-on market sentiment undermined the safe-haven greenback and pushed the GBP/USD pair higher. However, concerns about that UK will trigger Article 16 of the Northern Ireland Protocol might cap the upside for the pair. The good news is, UK Prime Minister’s spokesman said their aim to reach a consensual solution on to the protocol remains.

For technical aspect, RSI indicator 46 figures as of writing, suggesting tepid bear movement ahead. But for the MACD indicator, the MACD is now sitting above the signal line, which also indicates a possible upward trend for the pair. Looking at the Bollinger Bands, the price rose from the lower band and crossed above the moving average, a bull market could be expected. In conclusion, we think market will be bullish as long as the 1.3353 support line holds, which is a yearly low that touched last week.

Resistance: 1.3607, 1.3698, 1.3834

Support: 1.3353


USDJPY (4- Hour Chart)

The pair USD/JPY stayed in positive territory on the first day of a new trading week, trading in a range below 114.00 level. The pair took a roller coaster ride most of the day without a specific direction, currently rising 0.20% on a daily basis. The risk-on sentiment around the equity markets and resurging US dollar strength both extended some support to the USD/JPY pair. Furthermore, the downbeat Japan Q3 GDP report which showed that the economy contracted more than expected by 0.8%, undermining the safe-haven Japanese Yen. The dovish comments by Bank of Japan Governor also kept a lid on any meaningful gains for the Yen.

For technical aspect, RSI indicator 58 figures as of writing, suggesting tepid bull movement ahead. But looking at the MACD indicator, the MACD is now sitting below the signal line, which indicates a possible downward trend for the pair. In conclusion, we think market will be bullish as the pair is heading to re-test the 114.3 resistance. If the pair break above that resistance line, a test of the monthly high at 114.70 seems likely.

Resistance: 114.30, 114.70

Support: 113.26, 112.73


AUDUSD (4- Hour Chart)

The pair AUD/USD advanced on Monday, gaining some bullish momentum for the second day amid the underlying bullish sentiment in the financial markets. The pair touched a three-day top near 0.737 level in mid-European session, now retreated slightly and pared some of its intraday gains. The recent buying witnessed in AUD/USD pair is mainly due to stronger Chinese macro data today. As the Chinese Industrial Production rose 3.5% in October, while Retail Sales rose 4.9%, both above economist’s forecasts. In addition to that, the risk-on market mood also acted as a tailwind for the riskier Aussie. Investors now await the RBA meeting minutes and RBA Governor’s speech tomorrow for trading impetus.

For technical aspect, RSI indicator 57 figures as of writing, suggesting bull movement ahead. Looking at the MACD indicator, the positive histogram shows big distance between the MACD and its signal line, which means bullish momentum is high. As for the Bollinger Bands, the price crossed above the moving average and ready to touch the upper band, which could be a buying signal for the pair. In conclusion, we think market will be bullish as the pair is eyeing a test of the 0.7432 resistance.

Resistance: 0.7432, 0.7471, 0.7556

Support: 0.7277, 0.7227, 0.7170


Economic Data

Currency

Data

Time (GMT + 8)

Forecast

AUD

RBA Meeting Minutes

08:30

GBP

Average Earnings Index +Bonus (Sep)

15:00

5.6%

GBP

Claimant Count Change (Oct)

15:00

USD

Core Retail Sales (MoM) (Oct)

21:30

1.0%

USD

Retail Sales (MoM) (Oct)

21:30

1.2%

Back To Top
server

Hello there 👋

How can I help you?

Chat with our team instantly

Live Chat

Start a live conversation through...

  • Telegram
    hold On hold
  • Coming Soon...

Hello there 👋

How can I help you?

telegram

Scan the QR code with your smartphone to start a chat with us, or click here.

Don’t have the Telegram App or Desktop installed? Use Web Telegram instead.

QR code