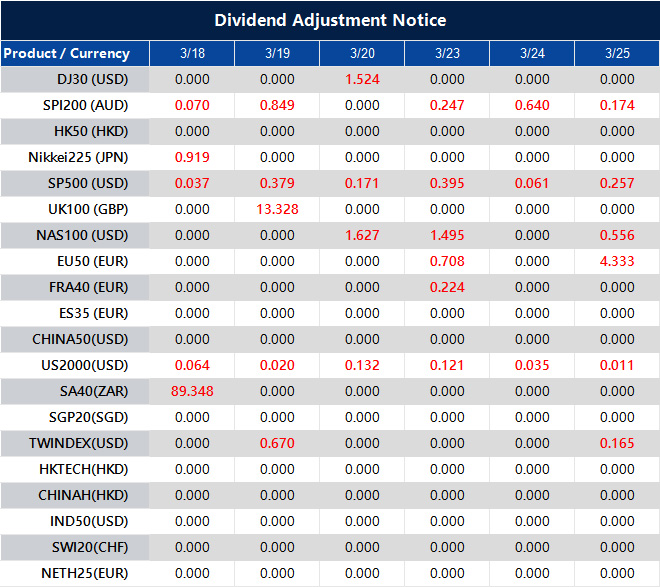
Please note that the dividends of the following products will be adjusted accordingly. Index dividends will be executed separately through a balance statement directly to your trading account, and the comment will be in the following format “Div & Product Name & Net Volume”.
Please refer to the table below for more details:
The above data is for reference only, please refer to the MT4/MT5 software for specific data.
If you’d like more information, please don’t hesitate to contact [email protected].
The United States military said it targeted sites along Iran’s coastline near the Strait of Hormuz, Reuters reported on Wednesday. It said Iranian anti-ship missiles there posed a risk to international shipping.
US Central Command (CENTCOM) said US forces used multiple 5,000-pound deep penetrator munitions. It said the strikes hit hardened Iranian missile sites along the coastline near the Strait of Hormuz.
At the time of writing, West Texas Intermediate (WTI) was down 0.31% on the day at $94.67.
We see that U.S. forces have struck Iranian missile sites along the coast near the Strait of Hormuz. This action targets hardened facilities that were deemed a threat to international shipping. The initial market reaction has been muted, with West Texas Intermediate crude oil actually ticking down slightly.
This price drop for WTI seems disconnected from the growing geopolitical risk and is likely due to domestic factors. The latest Energy Information Administration report showed a surprise inventory build of 3.2 million barrels at the Cushing, Oklahoma storage hub, easing immediate supply concerns in the U.S. market. This suggests the physical market is currently well-supplied, but this situation may not last.
The key indicator for us to watch is not the spot price, but implied volatility. The CBOE Crude Oil Volatility Index (OVX) has already jumped over 15% to 42.5, showing that options traders are pricing in a much higher probability of sharp price swings in the near future. This divergence between the calm spot price and the nervous options market presents an opportunity.
We learned from the shipping disruptions in the Red Sea back in 2025 that the direct impact on oil production isn’t the only factor. During that period, we saw the risk premium on Brent crude widen by nearly $10 per barrel due to increased shipping and insurance costs alone. A direct conflict in the Strait of Hormuz would have a much larger and more immediate effect.
The scale of the risk is immense, as nearly 21 million barrels of oil per day, or about 20% of global daily consumption, pass through this narrow waterway. Any significant disruption, or even the credible threat of one, could send prices soaring far beyond recent highs. This is not a risk that the market can ignore for long.
Given the elevated volatility, we should consider buying out-of-the-money call options on Brent crude for May and June expirations. This provides exposure to a potential price spike while limiting downside risk to the premium paid. Strike prices between $105 and $110 offer a cost-effective way to position for a significant escalation.
We should also monitor the spread between Brent and WTI crude. This spread, currently at $5.20, is likely to widen significantly if the crisis is localized to the Middle East, as international Brent prices would react more strongly than the more insulated U.S. benchmark. Trading this spread offers another way to capitalize on the developing situation.
Start trading now – Click here to create your real VT Markets account
Written on March 18, 2026 at 6:03 am, by josephine
WTI, the US crude oil benchmark, traded near $95.00 in early Asian hours on Wednesday. Traders awaited the US Energy Information Administration (EIA) report due later on Wednesday.
WTI rose amid fighting in the Middle East and supply disruption concerns. Iran attacked production facilities in the United Arab Emirates and Iraq on Tuesday.
The Guardian reported this was the first time since the war with the US and Israel began that Iran hit oil and gas production sites, rather than refineries, terminals, and storage. Separately, the Israeli military said Ali Larijani and Basij force head Gholamreza Soleimani were killed in Israeli air strikes.
These developments increased concern about retaliation and further supply cuts, which may support prices in the near term. However, rising US stockpiles could limit price gains.
The American Petroleum Institute (API) reported US crude inventories rose by 6.6 million barrels for the week ending March 13. This followed a 1.7 million barrel fall the week before, versus a market forecast for a 600,000 barrel decline.
We remember the sharp spike to $95 a barrel around this time in 2025 when direct conflict in the Middle East intensified. Those attacks on production facilities, a significant escalation at the time, serve as a potent reminder of how quickly the geopolitical risk premium can inflate prices. With WTI now trading closer to $82, much of that immediate fear has subsided, but the memory keeps volatility expectations elevated.
The fundamental supply picture today is vastly different from the fears that dominated last year. U.S. crude oil production remains robust, with recent Energy Information Administration (EIA) data showing output holding near a record 13.3 million barrels per day. This strong, non-OPEC supply provides a substantial buffer to global markets that did not feel as secure during the 2025 panic.
That surprising 6.6 million barrel inventory build reported in mid-March 2025 was a powerful early signal of underlying market softness, which was overshadowed by conflict. We are seeing echoes of that now, as the latest EIA report showed a surprise stock build of 1.4 million barrels last week, against forecasts for a draw. This signals that demand may be softer than anticipated, a trend supported by recent slowing industrial data from China.
Given this tension between persistent geopolitical risk and a well-supplied physical market, traders should consider strategies that manage volatility. Buying out-of-the-money call options provides a cheap way to gain exposure to a sudden price spike from another flare-up, while still limiting downside risk. At the same time, selling bearish call spreads could be effective, capitalizing on the strong price resistance formed by high U.S. production levels.
Start trading now – Click here to create your real VT Markets account
Written on March 18, 2026 at 6:02 am, by josephine
China’s digital yuan is evolving beyond payments into a core financial asset.
Digital Yuan 2.0 integrates with banking systems and offers deposit-like features.
Cross-border settlement via mBridge reduces reliance on the US dollar.
Global CBDC development is accelerating in response to China’s progress.
The FX market is shifting toward a more decentralised, multi-currency structure.
The Rise of the Digital Yuan
China’s digital yuan (e-CNY) remains the world’s most advanced large-economy central bank digital currency, having transitioned in 2026 from a retail pilot to a core pillar of the national financial system. By early 2026, cumulative transactions had surged to over RMB 16.7 trillion (≈US$2.3 trillion), with the currency now integrated into the deposit insurance system and supporting high-value cross-border trade through the mBridge platform.
If payment infrastructure remained in private hands, the system could become too large to fail while lacking transparency. The digital yuan emerged as a strategic response, allowing the state to reclaim control over the financial backbone.
Since pilot programmes began in 2019, adoption has expanded rapidly. Today, the digital yuan is widely used across China for daily transactions.
But its significance goes far beyond payments. Its rise signals a structural shift in the global foreign exchange system, with implications for trade, capital flows, and monetary sovereignty.
Digital Yuan Adoption Progress (Official PBOC Data)
Digital Yuan 2.0: From Payment Tool to Financial Asset
The transition from Digital Yuan 1.0 to 2.0 marks a fundamental shift in its role.
Previously, it functioned as digital cash. Now, under new regulations introduced in 2026, it has evolved into a hybrid monetary instrument that combines characteristics of deposits and currency.
Key changes include:
Integration into commercial bank balance sheets and reserve systems
Legal protection equivalent to traditional bank deposits
Ability for verified wallets to earn interest similar to demand deposits
This transformation blurs the line between bank accounts and digital wallets. Users can spend directly without manual top-ups, while individuals without bank accounts can still participate in the financial system through wallet-based access.
The addition of programmability introduces another layer of control. Funds can carry conditions through smart contracts, enabling targeted spending, improved compliance, and automated financial flows.
At the same time, the development of mBridge has extended the digital yuan into cross-border settlement, allowing it to move beyond domestic payments into global trade infrastructure.
A New Cross-Border Settlement System
The global financial system remains heavily anchored to the US dollar and the legacy SWIFT network. While effective, this structure creates friction, including multi-day settlement delays, intermediary costs, and geopolitical vulnerabilities where financial access can be restricted.
China’s response has not been to replace SWIFT directly, but to develop a parallel infrastructure. Through mBridge, a multi-CBDC platform built with the BIS Innovation Hub, participating central banks can settle transactions peer-to-peer on a shared ledger, enabling real-time cross-border payments without relying on correspondent banking networks.
By the end of 2025, digital yuan transactions had surpassed US$2.3 trillion, while mBridge processed more than 4,000 cross-border transactions worth over US$55 billion. The digital yuan accounted for roughly 95% of activity, highlighting its central role in the system.
The significance of this development lies in its ability to enable direct settlement between local currencies, removing the need to convert through a vehicle currency such as the US dollar. This reduces settlement costs and dramatically increases transaction speed.
For global markets, this shift signals the emergence of a more multi-channel financial architecture, where cross-border capital flows can operate through networks that are increasingly independent of traditional Western-led systems.
A Catalyst for Global Monetary Change
The rise of the digital yuan is accelerating the global race toward central bank digital currencies.
Countries such as India, Brazil, and the Bahamas are already operational
The EU and UK are progressing through regulatory and technical phases
The United States is focusing on regulating private stablecoins instead of issuing a CBDC
While stablecoins still dominate digital transactions, they lack sovereign backing and deposit protection. This creates a structural difference between privately issued digital dollars and state-backed currencies like the digital yuan.
As more countries adopt CBDCs, cross-border financial systems are likely to become cheaper, faster, and more transparent, gradually reducing reliance on the dollar in certain sectors.
mBridge Performance
Feature
Legacy SWIFT System
Project mBridge (MVP 2025)
Total Settlement Volume
N/A
$55.49 Billion
Transaction Count
N/A
4,047 High-Value Trades
e-CNY Share of Volume
0%
95.30%
Settlement Time
2–5 Days
Real-time (Seconds)
Primary Use Cases
General Banking
Energy & Commodities
Source: Atlantic Council / BIS Innovation Hub / PYMNTS (Jan 2026).
Over time, these features could reshape parts of the FX market, especially in commodity trade, regional partnerships, and emerging market transactions.
The long-term outcome is likely a multi-currency system, where efficiency and political alignment determine usage rather than legacy dominance alone.
Not in the near term. The dollar remains dominant, but the digital yuan introduces an alternative system that reduces reliance over time.
Why is mBridge important?
It allows direct cross-border settlement without using the dollar, lowering costs and improving efficiency.
How is Digital Yuan 2.0 different?
It functions more like a bank deposit than cash, offering interest, legal protection, and integration into the banking system.
Why are other countries developing CBDCs?
China’s progress is accelerating global competition, pushing countries to modernise their monetary systems.
What is the biggest impact on FX markets?
The shift toward faster, cheaper, and decentralised settlement systems that reduce reliance on traditional intermediaries.
What is the difference between Digital Yuan 1.0 and 2.0?
The transition to Digital Yuan 2.0 in 2026 marks its evolution from a simple retail payment tool into a core financial asset. While version 1.0 functioned as digital cash, 2.0 is integrated into commercial bank balance sheets and reserve systems, offering legal protections and interest-bearing features similar to traditional demand deposits.
How does mBridge reduce reliance on the US Dollar?
mBridge enables direct, peer-to-peer cross-border settlement between participating central banks without the need for an intermediary currency like the US dollar. Bypassing the traditional SWIFT network, it reduces settlement costs, increases transaction speeds, and limits the effectiveness of international financial sanctions.
Is the Digital Yuan a threat to global monetary sovereignty?
The e-CNY introduces a parallel financial infrastructure that allows for decentralised, multi-currency trade. While it does not replace the dollar overnight, it provides an alternative for commodity trade and emerging markets, allowing nations to settle transactions based on political alignment and efficiency rather than legacy dominance.
What are the benefits of “Programmable Money” in FX markets?
The digital yuan uses smart contracts to add a layer of programmability to financial flows. This allows for targeted spending and automated compliance, ensuring that funds are used for their intended purpose and reducing the risks associated with manual settlement and currency conversion.
What is the current adoption rate of the Digital Yuan in 2026?
By early 2026, the digital yuan became the world’s most advanced large-economy CBDC, with cumulative transactions surging over RMB 16.7 trillion (approx. US$2.3 trillion).
Start trading now – Click here to create your real VT Markets account
Written on March 18, 2026 at 6:00 am, by josephine
Australia’s Westpac leading index (month-on-month) fell to -0.1% in February. It had been -0.04% in the previous period.
The latest reading shows a slightly weaker month-on-month result than before. No further details were provided in the release.
Leading Index Signals Softer Momentum
The leading index for Australia has slipped further into negative territory, now at -0.1%. This points to a continued loss of economic momentum over the next three to six months. This fresh data reinforces the view that the Reserve Bank of Australia will be under pressure to consider easing its policy stance sooner than previously expected.
We see this as a clear signal to position for a weaker Australian dollar, particularly against the US dollar. With our own interest rates likely peaking, the yield advantage that supported the AUD through 2025 is now eroding. We should consider buying AUD/USD put options that expire in the second quarter to capitalize on this expected weakness.
For the stock market, this slowdown is a headwind for corporate earnings, especially in consumer-facing sectors. This aligns with recent statistics showing the unemployment rate has edged up to 4.0% and retail sales growth has stalled. Selling ASX 200 index futures or buying protective puts on major bank stocks is a prudent strategy.
This economic picture is also being clouded by softer global conditions, as key commodity prices like iron ore have recently fallen below $100 per tonne, a sharp contrast to the highs we saw in 2025. This increases the likelihood of market volatility in the coming weeks. We believe buying options that profit from a rise in the S&P/ASX 200 VIX index is a cheap way to gain exposure to this uncertainty.
Bond Markets Price In Easing
In the fixed income market, the data suggests that bond yields have more room to fall. As expectations for rate cuts build, existing bond prices should rise. We can act on this by buying Australian 3-year Treasury Bond futures, positioning for the market to price in a more dovish RBA.
Create your live VT Markets account and start trading now.
Start trading now – Click here to create your real VT Markets account
Written on March 18, 2026 at 5:59 am, by josephine
Japan’s adjusted merchandise trade balance moved to a deficit of ¥374.2bn in February.
In the previous period, it recorded a surplus of ¥455.5bn.
Shift From Surplus To Deficit
This marks a shift from surplus to deficit between the two readings.
This sharp reversal from a surplus to a ¥374.2 billion deficit in Japan’s trade balance is a significant signal for us. The data points towards a potential weakening of the Japanese Yen, as it suggests lower international demand for Japanese goods. We should therefore consider positioning for a higher USD/JPY in the coming weeks.
Traders should look at buying call options on the USD/JPY currency pair to capitalize on potential yen weakness with defined risk. Current market data shows the interest rate differential between the U.S. and Japan remains wide, with the Federal Reserve holding rates steady while the Bank of Japan maintains its accommodative stance, further supporting a stronger dollar. This fundamental backdrop makes long USD/JPY derivatives an attractive strategy.
For the Nikkei 225 index, the situation is more complex, creating opportunities for volatility plays. A weaker yen is typically beneficial for Japan’s large exporters, potentially boosting their stock prices. However, the underlying trade deficit hints at slowing global demand, which could hurt the very same companies.
Nikkei Volatility Strategy
This conflicting dynamic suggests an increase in market uncertainty and implied volatility. We can exploit this by purchasing straddles or strangles on the Nikkei 225 futures, which would profit from a large price move in either direction. Implied volatility on three-month Nikkei options has already risen from 16% to 18.5% in the past week, indicating the market is already pricing in more turbulence.
Looking back, we saw a similar situation in mid-2025 when rising energy import costs temporarily widened the trade deficit. That period led to a choppy but ultimately range-bound Nikkei, while the yen experienced a steady decline. This historical precedent reinforces the view that the clearest trade is on the currency.
Therefore, we must also monitor commodity prices, particularly crude oil, as a key driver of Japan’s import costs. Japan imports over 99% of its crude oil, and recent data shows Brent crude prices have climbed 8% in the last month to over $90 a barrel. A sustained rise in energy costs could keep the trade balance in deficit and put continued downward pressure on the yen.
Create your live VT Markets account and start trading now.
Start trading now – Click here to create your real VT Markets account
Written on March 18, 2026 at 5:58 am, by josephine
USD/JPY slipped by less than 0.1% on Tuesday and ended near 158.90 after a narrow session. It has now fallen for two days since last week’s year-to-date high around 159.75, with the 160.00 area still holding.
The Federal Reserve is expected to keep its policy rate at 3.75% on Wednesday, with markets pricing near-zero chance of a change. Focus is on the Summary of Economic Projections and Jerome Powell’s press conference, with 22 basis points of cuts priced for the full year.
The Bank of Japan is due on Thursday and is also expected to hold at 0.75%. Energy prices linked to the Strait of Hormuz closure are cited as a risk to Japan’s growth, while core inflation is above target and wage growth is firm.
On the daily chart, the pair trades at 158.93, above the 50-day EMA near 156.50 and the 200-day EMA just below 152.70. The Stochastic oscillator is above 90, and support sits at 158.00, 156.50, 154.30, and 152.70.
Resistance is at 159.50 and near 159.75, with 160.50 above that. The technical analysis was produced with help from an AI tool.
We remember how the USD/JPY was poised below the 160.00 level in late 2025, with everyone waiting on the central banks. The market was trapped, reluctant to push higher before getting more clarity on policy direction from both the Fed and the Bank of Japan. That period of consolidation was a direct result of uncertainty over future interest rate differentials.
Looking back, the Federal Reserve’s decision during that period was pivotal. While they held rates at 3.75%, their updated economic projections subtly shifted the dot plot, signaling a clearer path to the rate cuts we have seen since then. U.S. CPI data from early 2026 confirmed this disinflationary trend, with the headline figure recently falling to 2.9%, giving the Fed cover to continue its easing cycle.
The Bank of Japan remained cautious in 2025, citing energy price risks, but underlying wage pressures eventually forced their hand. We saw in the spring wage negotiations that major firms agreed to an average pay increase of 4.5%, the highest in decades, which fueled expectations for further policy normalization. This fundamental shift has provided underlying support for the yen that was absent last year.
From a technical standpoint, the overbought stochastic signal back in 2025 was a correct warning of exhaustion. The failure to decisively break above 160.00 led to the pullback we are now consolidating from. One-month implied volatility, which had spiked to over 10% around those meetings, has since settled into a more modest 7% range.
In the coming weeks, traders should consider that the path of least resistance has likely shifted. With the Fed now in a cutting cycle and the BoJ on a slow but steady tightening path, the powerful uptrend of 2025 is no longer in control. Selling out-of-the-money call options to collect premium on any rallies toward the 158.00 level could be a prudent strategy.
This view assumes a continued, orderly divergence in monetary policy. The primary risk is a surprise pause from the Fed, perhaps triggered by a rebound in U.S. service sector inflation, which has remained sticky above 4%. Such a development would challenge the current outlook and could trigger a sharp reversal back toward last year’s highs.
Start trading now – Click here to create your real VT Markets account
Written on March 18, 2026 at 4:59 am, by josephine
New Zealand’s Westpac Consumer Survey rose to 94.7 in the fourth quarter. It was 90.9 in the previous quarter.
We saw that piece of data on consumer confidence at the end of 2025, which showed a welcome improvement to 94.7. At the time, it suggested households were becoming less pessimistic, which was a tentative good sign for future spending. However, a reading below 100 still means there are more pessimists than optimists.
This data from last year was one of the early signals that the Reserve Bank of New Zealand (RBNZ) might have to hold interest rates high for longer than many anticipated. Increased confidence, even if small, can translate into more spending, making it harder to bring inflation down. This supported our view that the market was too aggressive in pricing in rate cuts for 2026.
Now that we are in March 2026, that caution was warranted, as the most recent quarterly inflation data showed core inflation remaining sticky at 4.3%, well above the RBNZ’s target band. The central bank has signaled no immediate plans to lower its 5.5% official cash rate, reinforcing a “higher for longer” stance. Gross Domestic Product data from late 2025 also showed the economy contracting by 0.2%, confirming a technical recession and complicating the RBNZ’s task.
In the coming weeks, traders should consider positioning for sustained high interest rates. This involves looking at interest rate swaps that pay a fixed rate, essentially betting that the official cash rate will not be cut as soon as the market hopes. Volatility in the rates market may also decline as the RBNZ’s path becomes more predictable, making strategies like selling strangles on bond futures potentially profitable.
This interest rate outlook should continue to support the New Zealand dollar. With our rates holding firm while other central banks are signaling cuts, the NZD becomes more attractive. We should look at using currency options to bet on the Kiwi dollar strengthening, perhaps buying NZD/USD call options with a three-month expiry.
For equity derivatives, the situation suggests a cautious approach. While better consumer sentiment is a positive, persistent high interest rates are a headwind for company earnings and valuations. Using NZX 50 index put options could be a prudent way to hedge against potential downside in the stock market over the next quarter.
Start trading now – Click here to create your real VT Markets account
Written on March 18, 2026 at 4:59 am, by josephine
UOB economists Enrico Tanuwidjaja and Sathit Talaengsatya forecast that the Bank of Thailand will keep the 1-D Repo Rate at 1.00% through at least 1Q27, even with higher headline inflation linked to an oil shock. They also expect the policy rate to remain at 1.00% in 2026.
The focus is on whether higher inflation spreads beyond the initial rise into transport fares, prepared food, service prices, wage-setting, or inflation expectations. The central bank is expected to watch for these follow-on effects.
Steady Policy And Targeted Fiscal Support
The suggested policy mix is steady monetary policy alongside fiscal measures that are targeted and temporary. Fiscal support is framed around helping vulnerable households, public transport, and other sensitive users.
Broad, open-ended subsidies are described as harder to finance and less transparent over time. The article notes it was produced with assistance from an AI tool and reviewed by an editor.
We expect the Bank of Thailand to keep its policy rate at 1.00% through next year, creating a stable interest rate environment. This view holds even as February’s headline inflation came in at 3.4%, which is above the central bank’s official target range. The bank appears focused on supporting the economy rather than reacting to the oil price shock we saw late last year.
For us, the key is not the headline inflation itself, but whether it spreads into wages, transport fares, and other core services. The central bank is signaling it will remain patient, looking for these second-round effects before making any changes. Upcoming labor market reports and core inflation data will therefore be far more important to watch than the headline numbers.
Swap And Currency Implications
This stable outlook on rates suggests that receiving fixed payments on Thai interest rate swaps continues to be a viable strategy. We have seen the 2-year swap rate hold steady around 1.15%, showing that the market is already pricing in this long pause. Any temporary jumps in swap rates caused by inflation headlines could be seen as good entry points.
With Thai interest rates anchored at a low level, the Baht will likely stay under pressure against currencies with higher interest rates. The USD/THB has been trading near 36.50, and we see few reasons for the Baht to strengthen significantly in the coming weeks. Using options to position for further, gradual Baht weakness seems like a logical approach.
This patient monetary policy is very similar to the approach we observed throughout 2025, when the bank also chose to support the economic recovery instead of reacting to early price increases. That experience showed us the BoT has a high tolerance for inflation temporarily going over its target. The government is expected to use targeted spending, not rate hikes, to provide relief to the public.
Create your live VT Markets account and start trading now.
Start trading now – Click here to create your real VT Markets account
Written on March 18, 2026 at 4:58 am, by josephine
New Zealand’s current account-to-GDP ratio fell to -3.7% in the fourth quarter. It was -3.5% in the previous quarter.
The slight worsening of our current account deficit to -3.7% of GDP is a bearish signal for the New Zealand dollar. This indicates we are more reliant on foreign capital to fund our spending, putting fundamental pressure on the currency’s value. We should anticipate this data weighing on the NZD against major trading partners in the near term.
Options Strategy For NzduSD Downside
Given this outlook, we see an opportunity in buying NZD/USD put options. With the spot rate currently hovering around 0.6150, options with a strike price of 0.6000 expiring in late April could provide a cost-effective way to speculate on further downside. This strategy defines our risk to the premium paid while offering significant upside if the currency weakens as expected.
This data complicates the picture for the Reserve Bank of New Zealand, making it less likely they will cut the Official Cash Rate from its current 5.50% anytime soon. Lowering rates would likely weaken the currency further, fueling inflation on imported goods, which is already sticky at an annualized rate of 3.8%. The central bank is effectively constrained by this external imbalance.
We must remember this trend is not new, as we look back at the economic performance in 2025. We saw then that demand for our key exports, particularly from China, softened considerably in the second half of the year. Statistics from last year showed dairy and meat exports fell by a combined 7% in the final six months, a headwind that is clearly continuing.
This sustained pressure suggests implied volatility on the Kiwi may begin to rise from its current lows. Traders with existing long NZD exposure should consider hedging by selling NZD futures contracts. This can protect portfolios against a potential break below the critical 0.6100 psychological support level in the coming weeks.