VT Markets The Adjustment Of Weekly Dividend Notification

Dear Client,

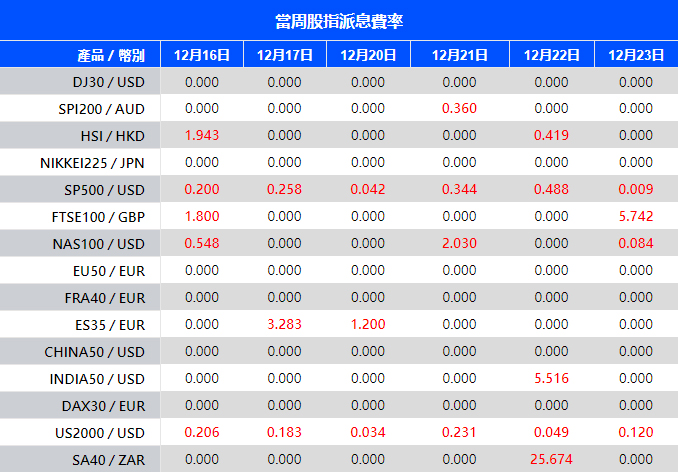
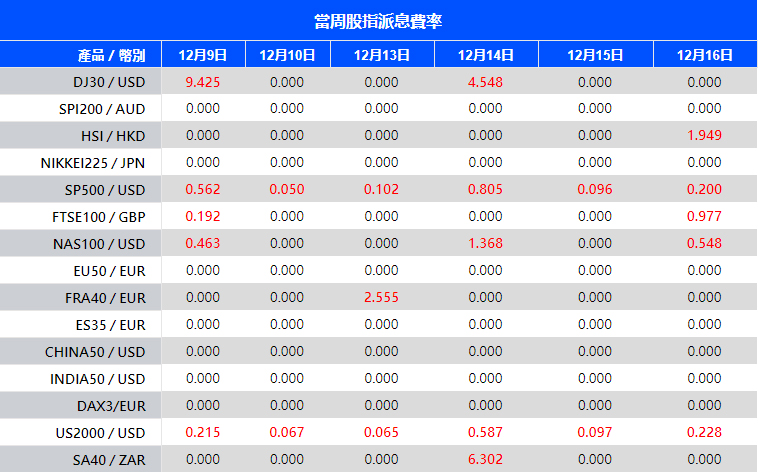
Warmly reminds you that the component stocks in the stock index spot generate dividends. When dividends are distributed, VT Markets will make dividends and deductions for the clients who hold the trading products after the close of the day before the ex-dividend date.

Indices dividends will not be paid/charged as an inclusion along with the swap component. It will be executed separately through a balance statement directly to your trading account, the comment for which will be in the following format “Div & Product Name & Net Volume ” .

Please note the specific adjustments as follows:

Note: The above data is for reference only, the actual execution data may be changed, please refer to the MT4/MT5 software for details.

If you’d like more information, please don’t hesitate to contact [email protected].

Market Focus

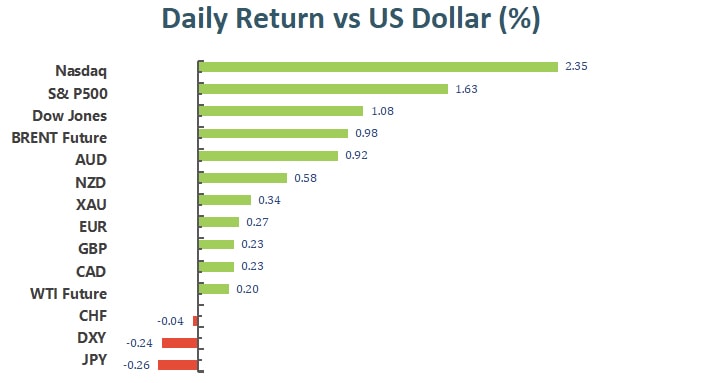
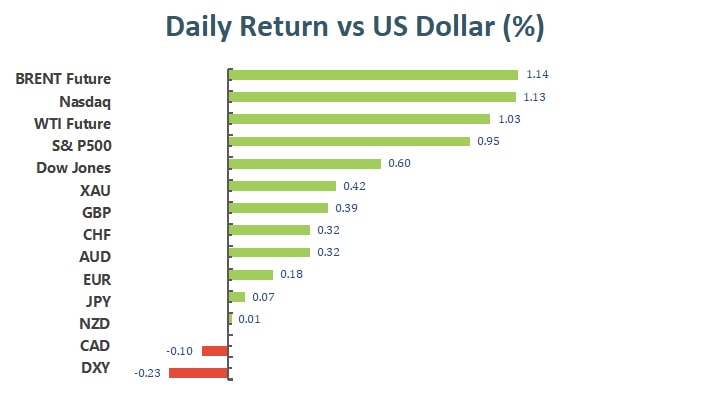
After the Federal Reserve announced that it will accelerate the reduction of monthly asset purchases in the context of rising inflation, three indices hit theirs best gain in a week on Wednesday. The Fed stated that it will increase its bond purchases by $30 billion per month in January, which is twice the $15 billion per month announced in November. The timetable for raising interest rates is advanced. It is expected that the interest rate will be raised up to three times next year, and then three more in 2023, bringing the Fed’s benchmark interest rate to 1.6%. The risk sentiment has improved after the statement was announced, because before the Fed meeting, the sentiment of monetary policy tightening was tense, and the previous increase has been basically digested. At the end of the market, the Dow Jones Industrial Average rose 1.1% to 35,927.44 points, the S&P 500 index rose 1.63% to 4,709.85 and the Nasdaq Composite Index added 2.1%.

一張含有 文字 的圖片

自動產生的描述

In the S&P 500 sector, the only loser is the energy sector. The main reason is that people are still worried about oversupply, although people are still worried about Omicron’s threat to travel and energy demand, making energy still under pressure and oil prices still falling. Devon Energy, Occidental Petroleum and Diamondback Energy fell more than 2%. On the other hand, the biggest winner of the index sector is undoubtedly the technology sector related to interest rates. With interest rates unchanged, the technology sector led to a rocket up. Nvidia and AMD lead the technology sector, followed by Alphabet, Microsoft, Facebook and Apple, contributing to the index’s performance.


Main Pairs Movement:

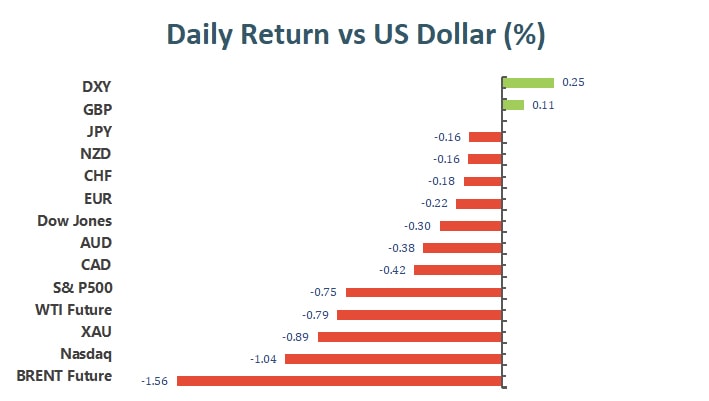
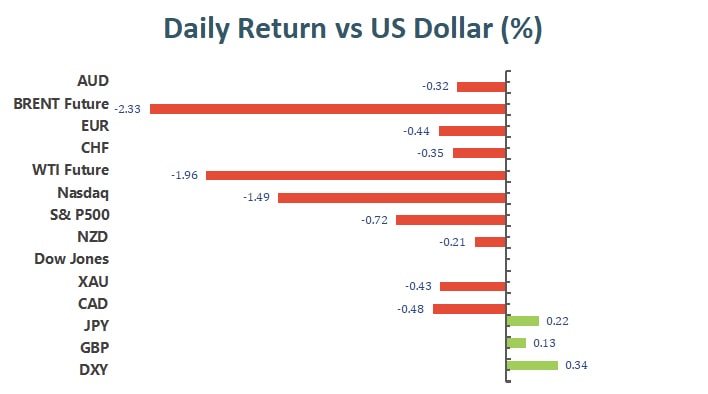
Before the Fed’s monetary policy decision was released, market participants expected that monetary policy would be tightened and accompanied by nervousness. This caused the DXY to soar to almost annual highs, but then interest rates remained unchanged, and the only news is that they will speed up the reduction in bond purchases starting in January 2022, so the dollar index turned south and closed at 96.33.

The EUR/USD is close to the 1.1300 level, but it was still below that level before the European Central Bank meeting, which will be held on Thursday. The ECB will announce its monetary policy decision, but the market is generally expected to maintain the current policy, this means the euro is hardly to get extra impetus.

GBP/USD closed at 1.32582, also staying at recent levels without any breakthrough. The UK will announce its PMI later on Thursday, which may provide some strength for the pound.

Gold hit a new low of 1,752 in several months and then rebounded to around $1,778 per ounce. Crude oil prices have risen with the stock market, and WTI is currently trading at approximately $71.50 per barrel.


Technical Analysis:

XAUUSD (4- Hour Chart)

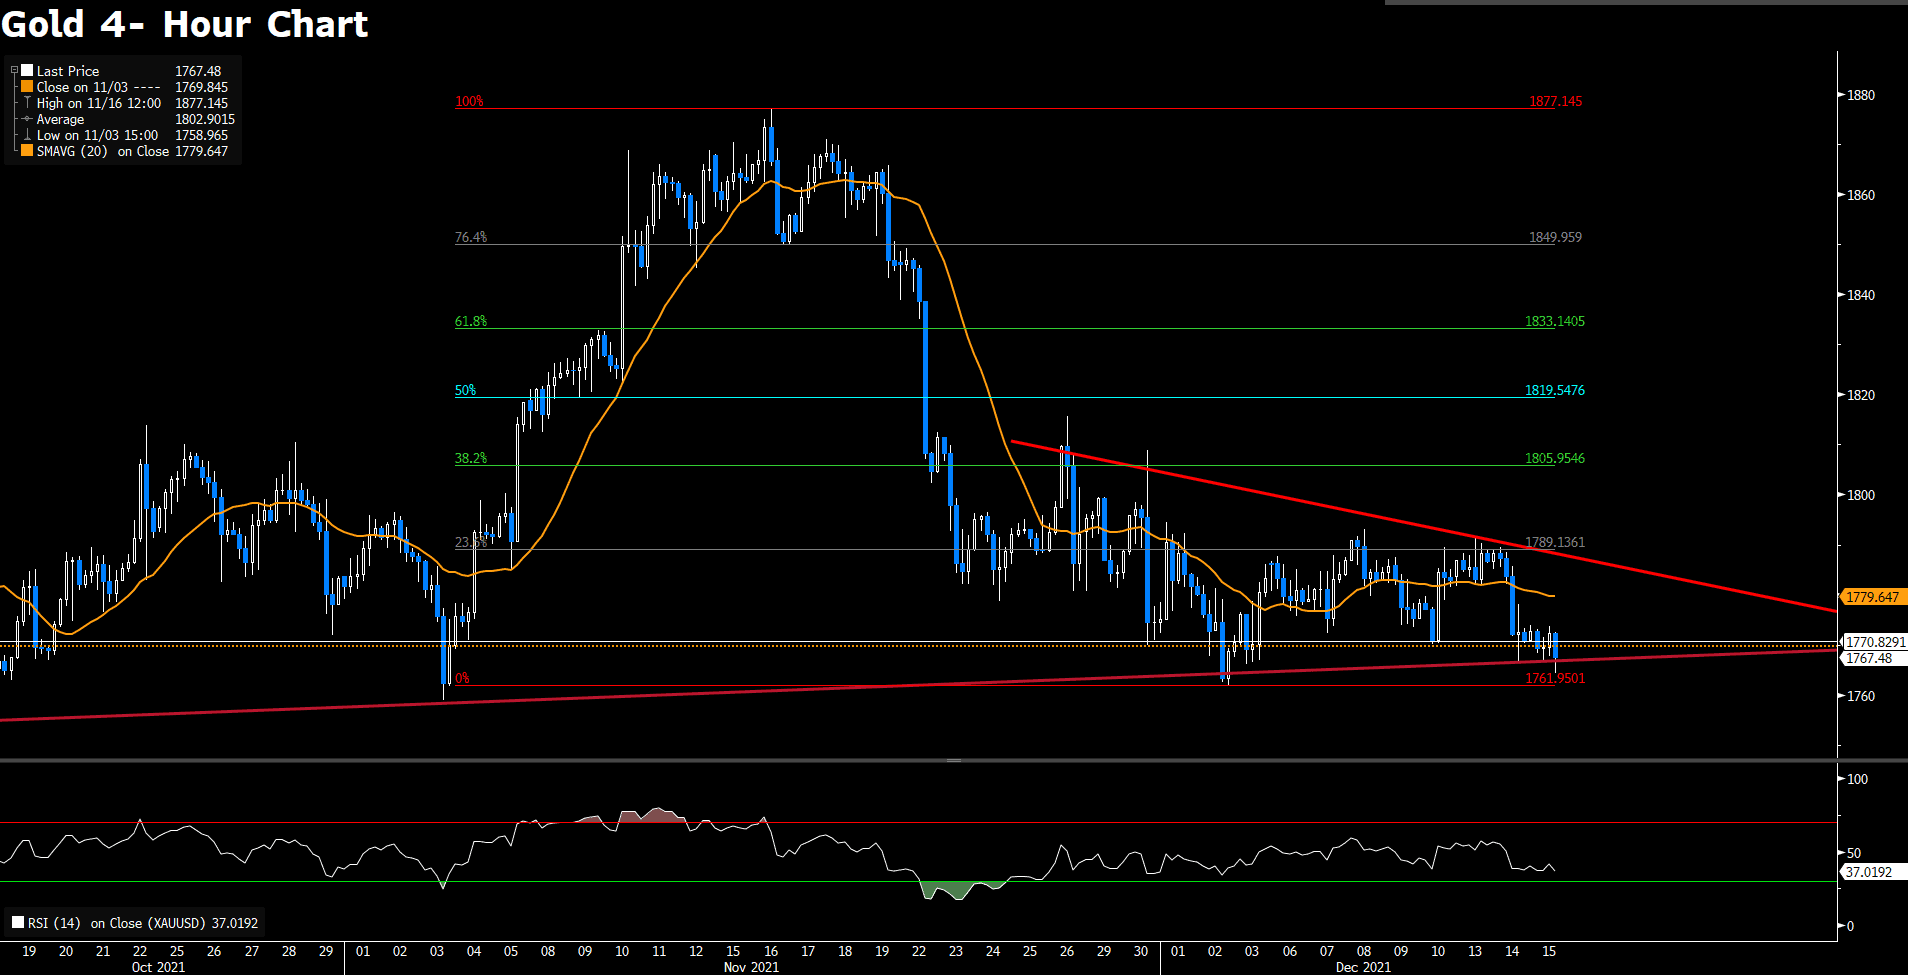
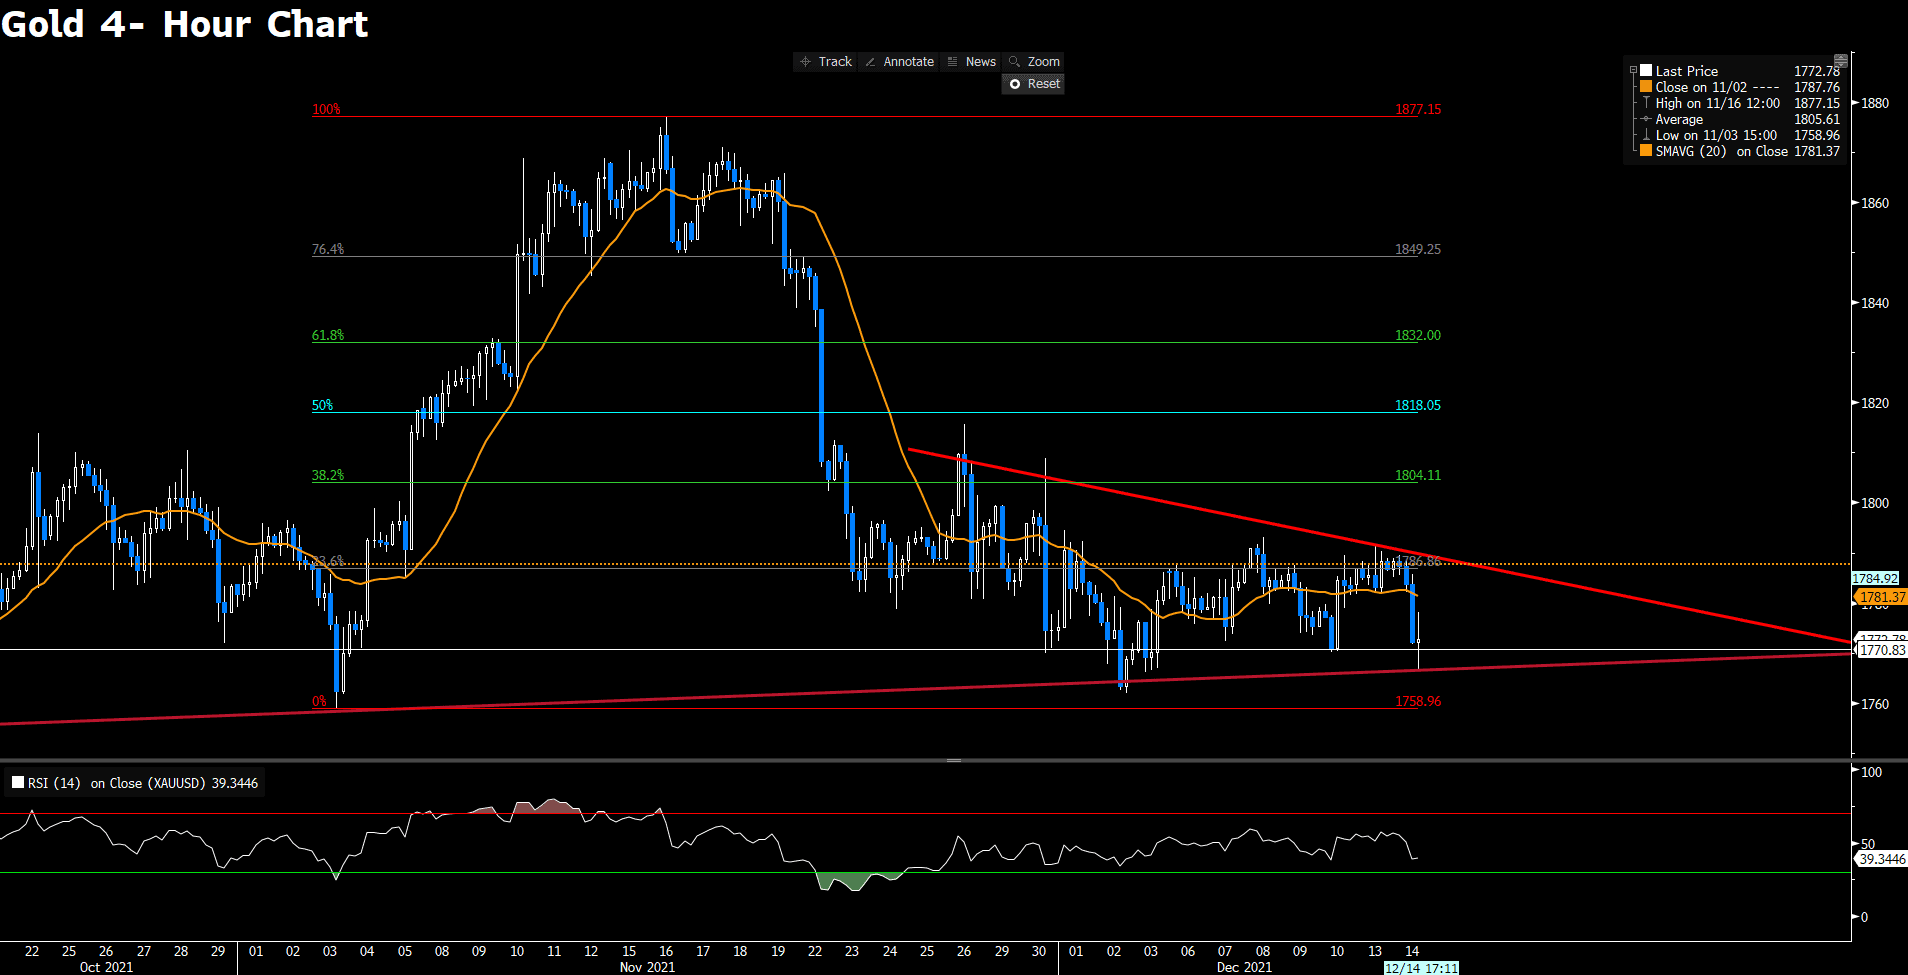
Gold price struggles to rebound, hovering below 1770, as focus shifts to FOMC meeting. Gold price is undermined since the market expects the hawkisk Fed will pace its tapering and the interest rates. From the technical analysis, as the time of writing, gold bears now target the descending wedge around 1765. Gold will re- confirm a bearish outlook if the wedge is breached downwardly. Alternatively, the recovery now needs to face stiff resistance at 1770, followed by 1789, in order to turn a bearish- to- bullish trend on the 4- hour chart. However, it looks like bears are still in control as the RSI indicator has not reached the oversold territory, suggesting a continuation of selling pressures. And the next relevant support is at 1761.

Resistance: 1770, 1789, 1805

Support: 1761


GBPUSD (4- Hour Chart)

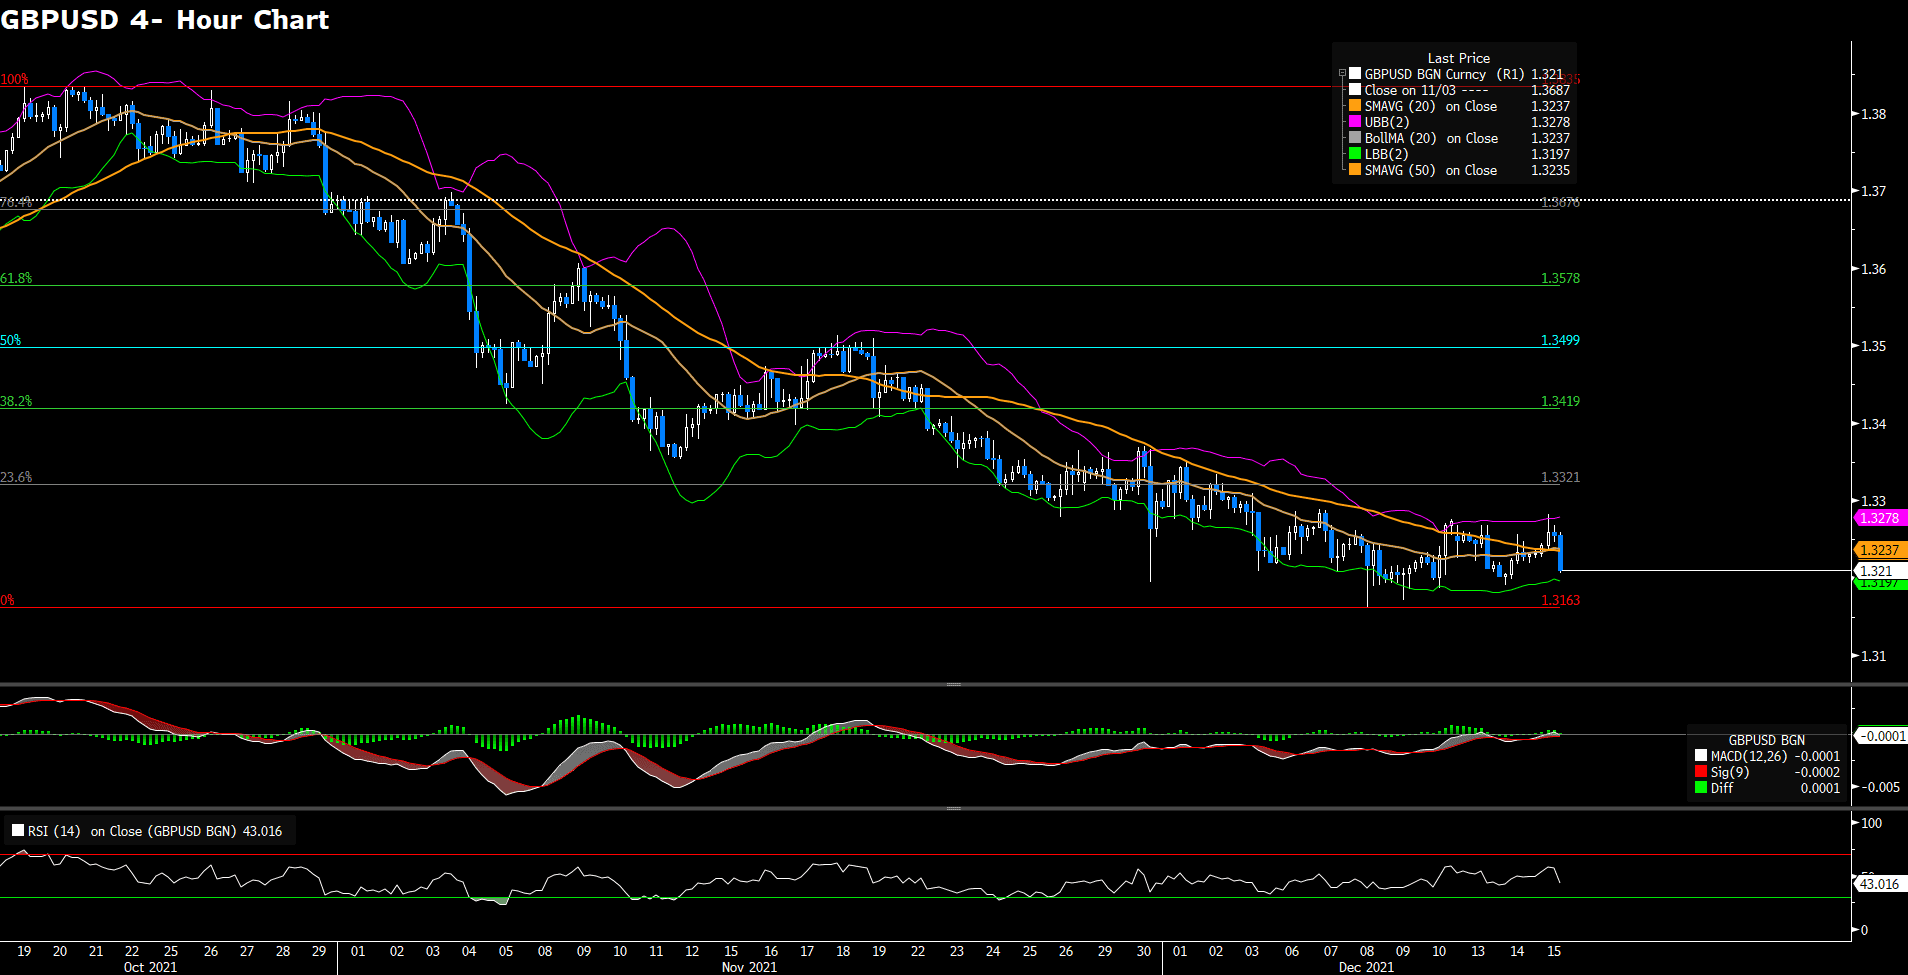
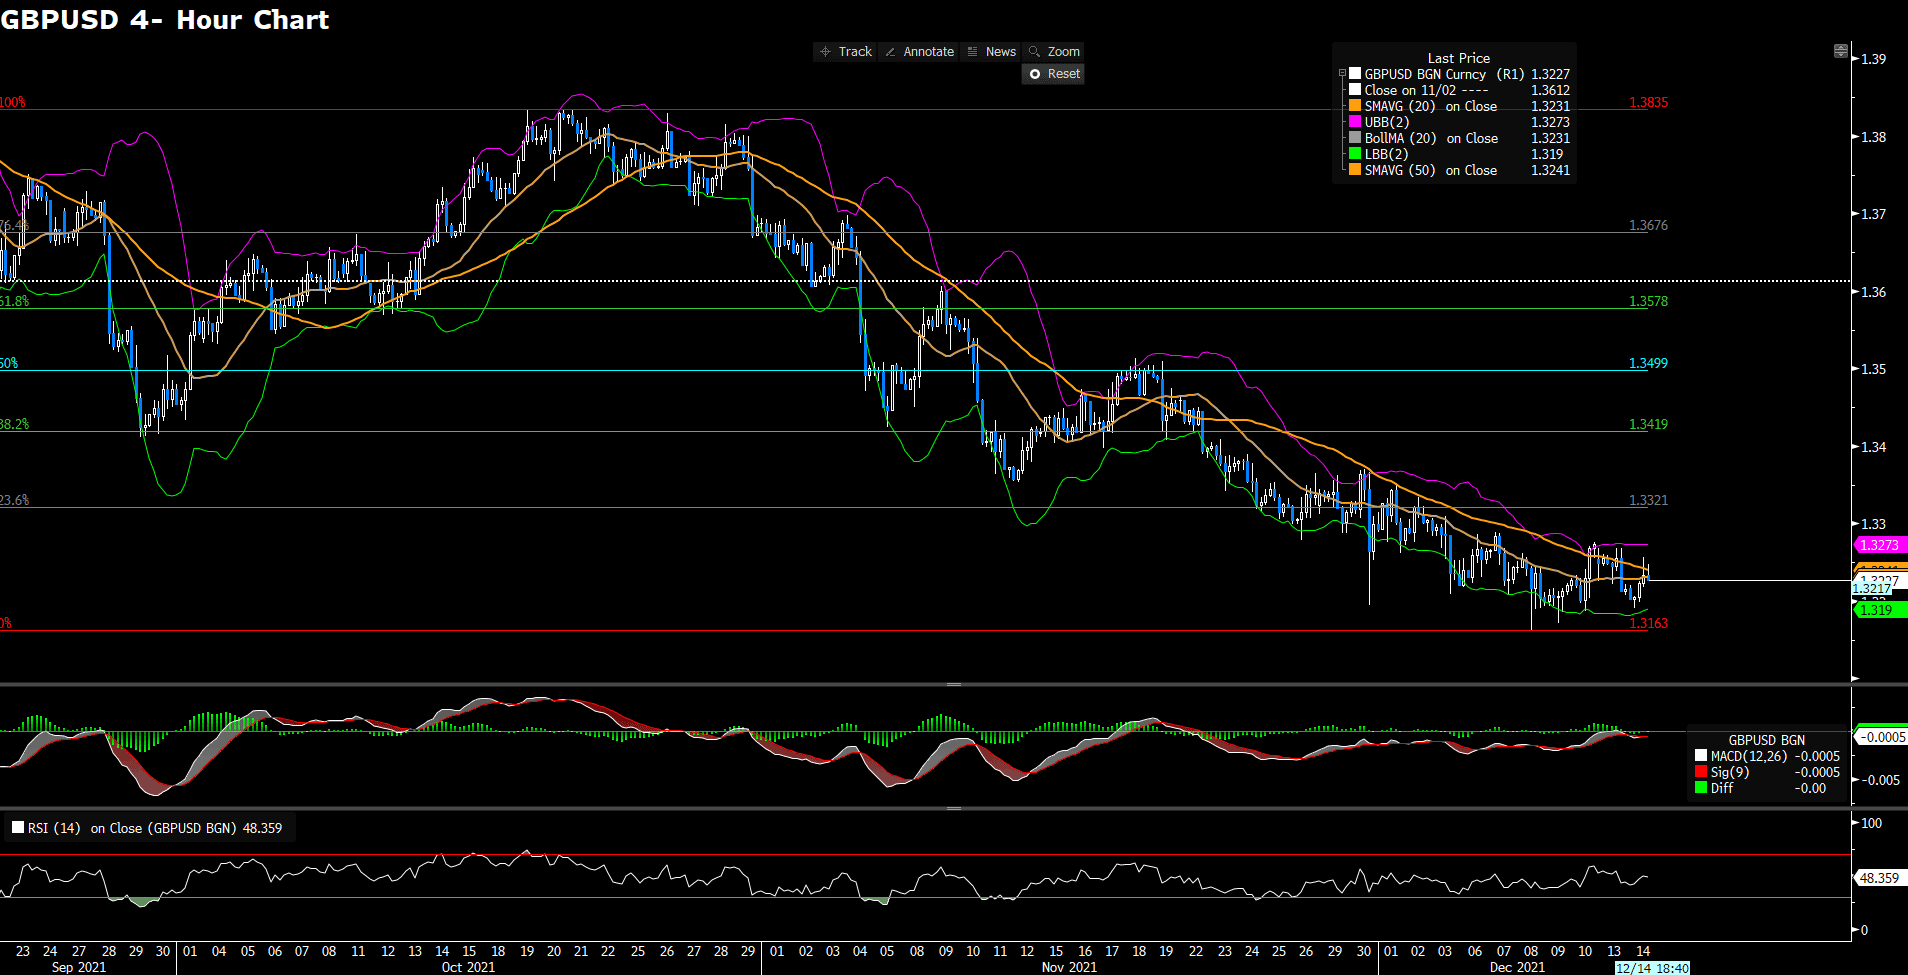
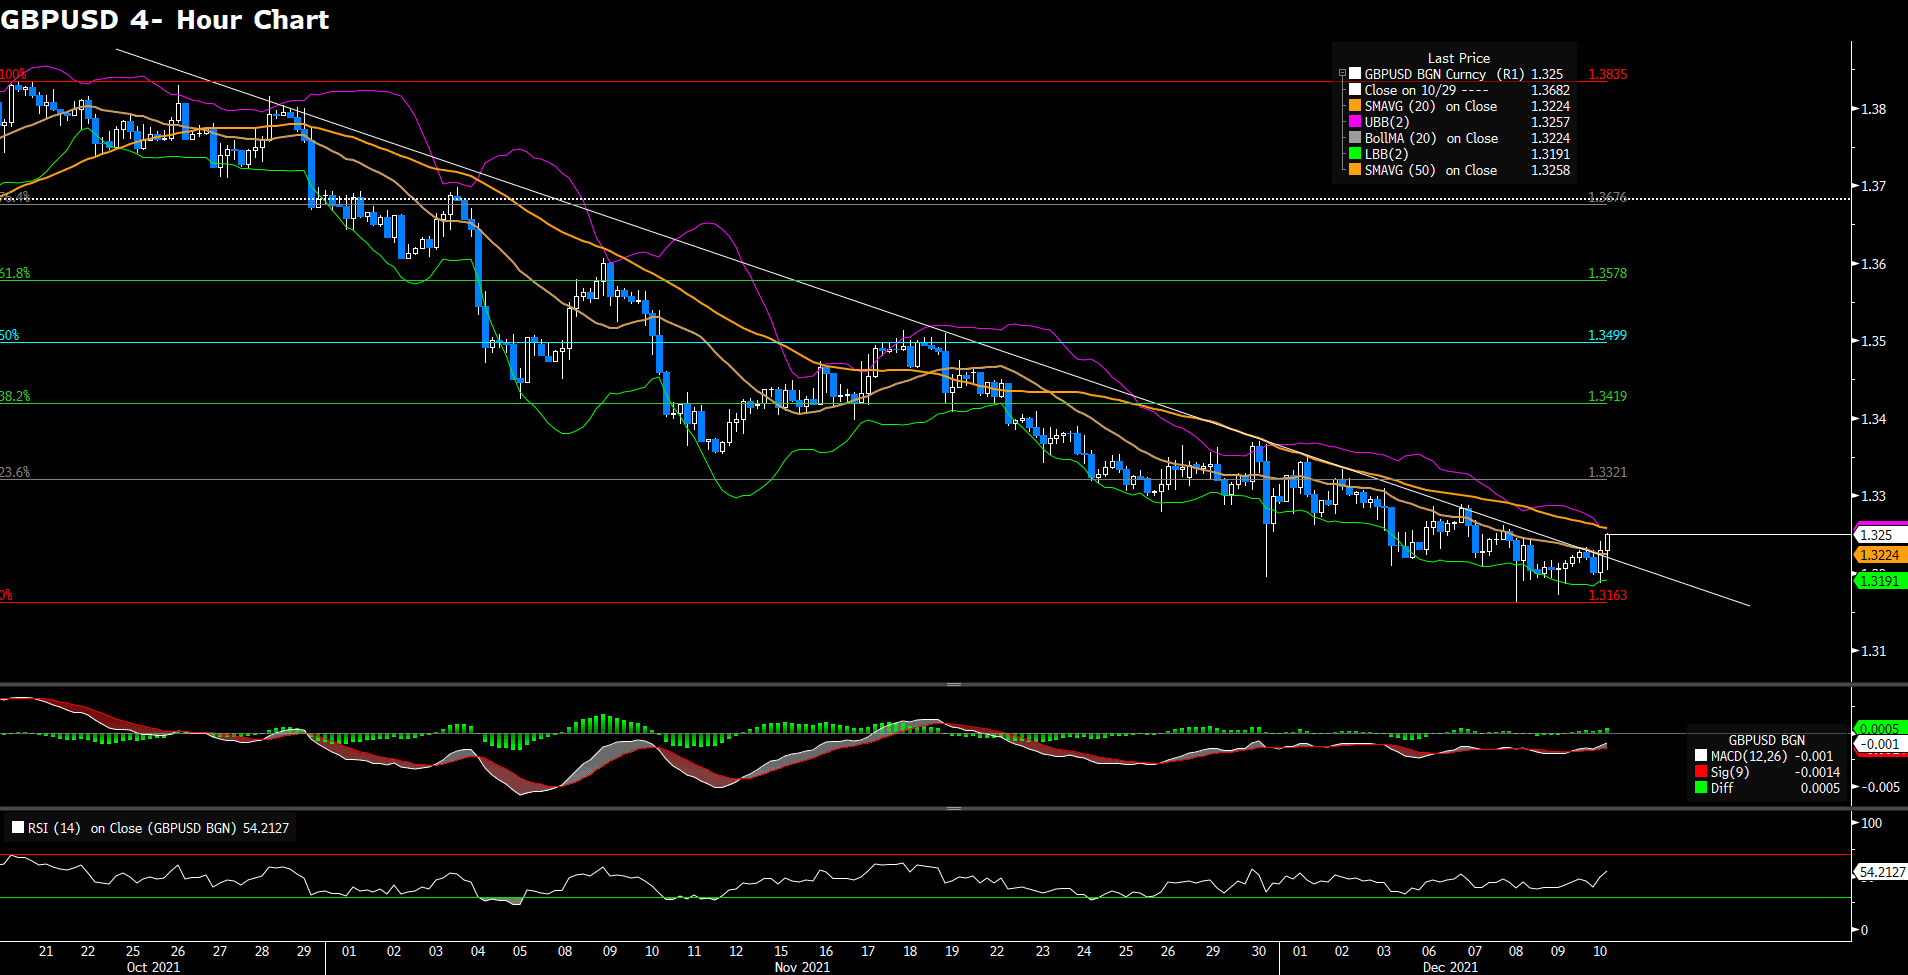
GBPUSD declined toward 1.3200 after the soaring UK inflation report, resulting in a renewal of the US dollar demand. From the technical perspective, the outlook of the currency pair becomes bearish on the 4- hour char as it trades below its 20 and 50 simple moving averages, indicating a bearish condition in the near- term. Since the RSI has not yet reached the oversold condition, sellers are still in control; thus, GBPUSD is expected to head toward its immediate support at 1.3163. Furthermore, the MACD is also turning negative as the time of writing, meaning that the pair has essentially turned from buying to selling. On the upside, GBPUSD’s bulls need to climb above the static level at 1.3321 to reclaim positive move. More price action will eye on today’s FOMC meeting and tomorrow’s ECB meeting.

Resistance: 1.3321, 1.3419, 1.3499

Support: 1.3163


EURUSD (4- Hour Chart)

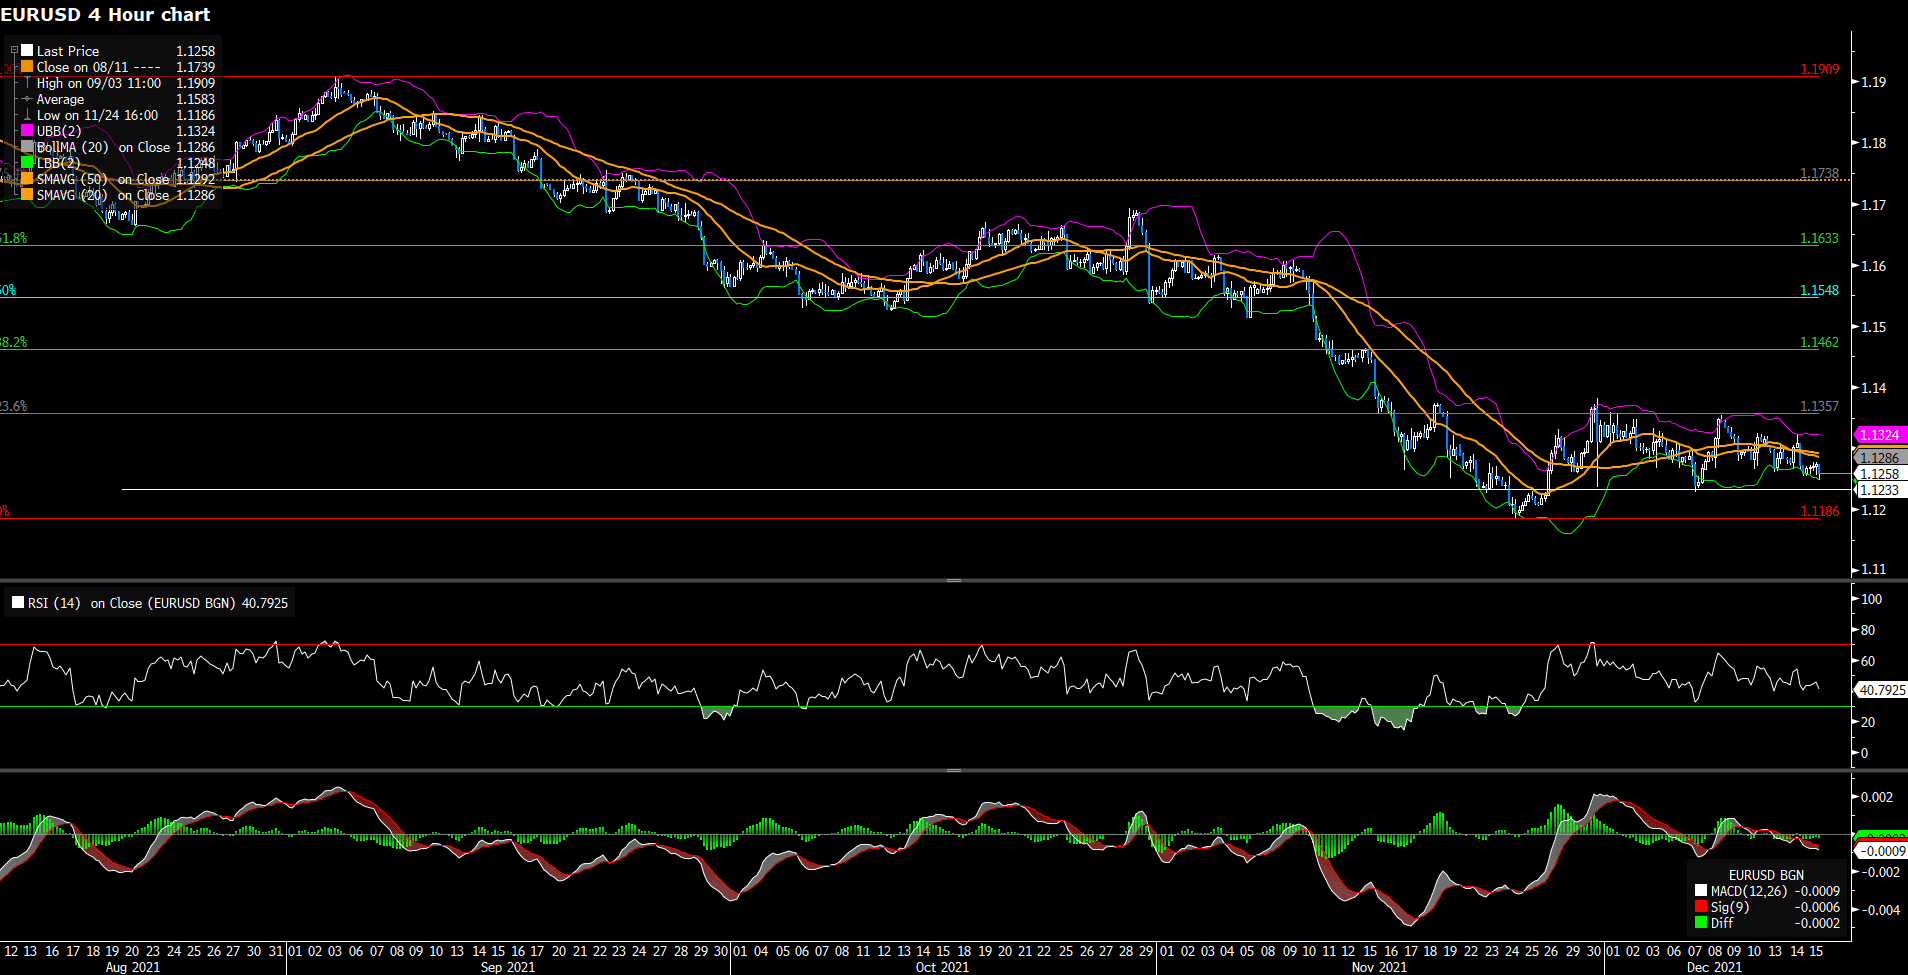
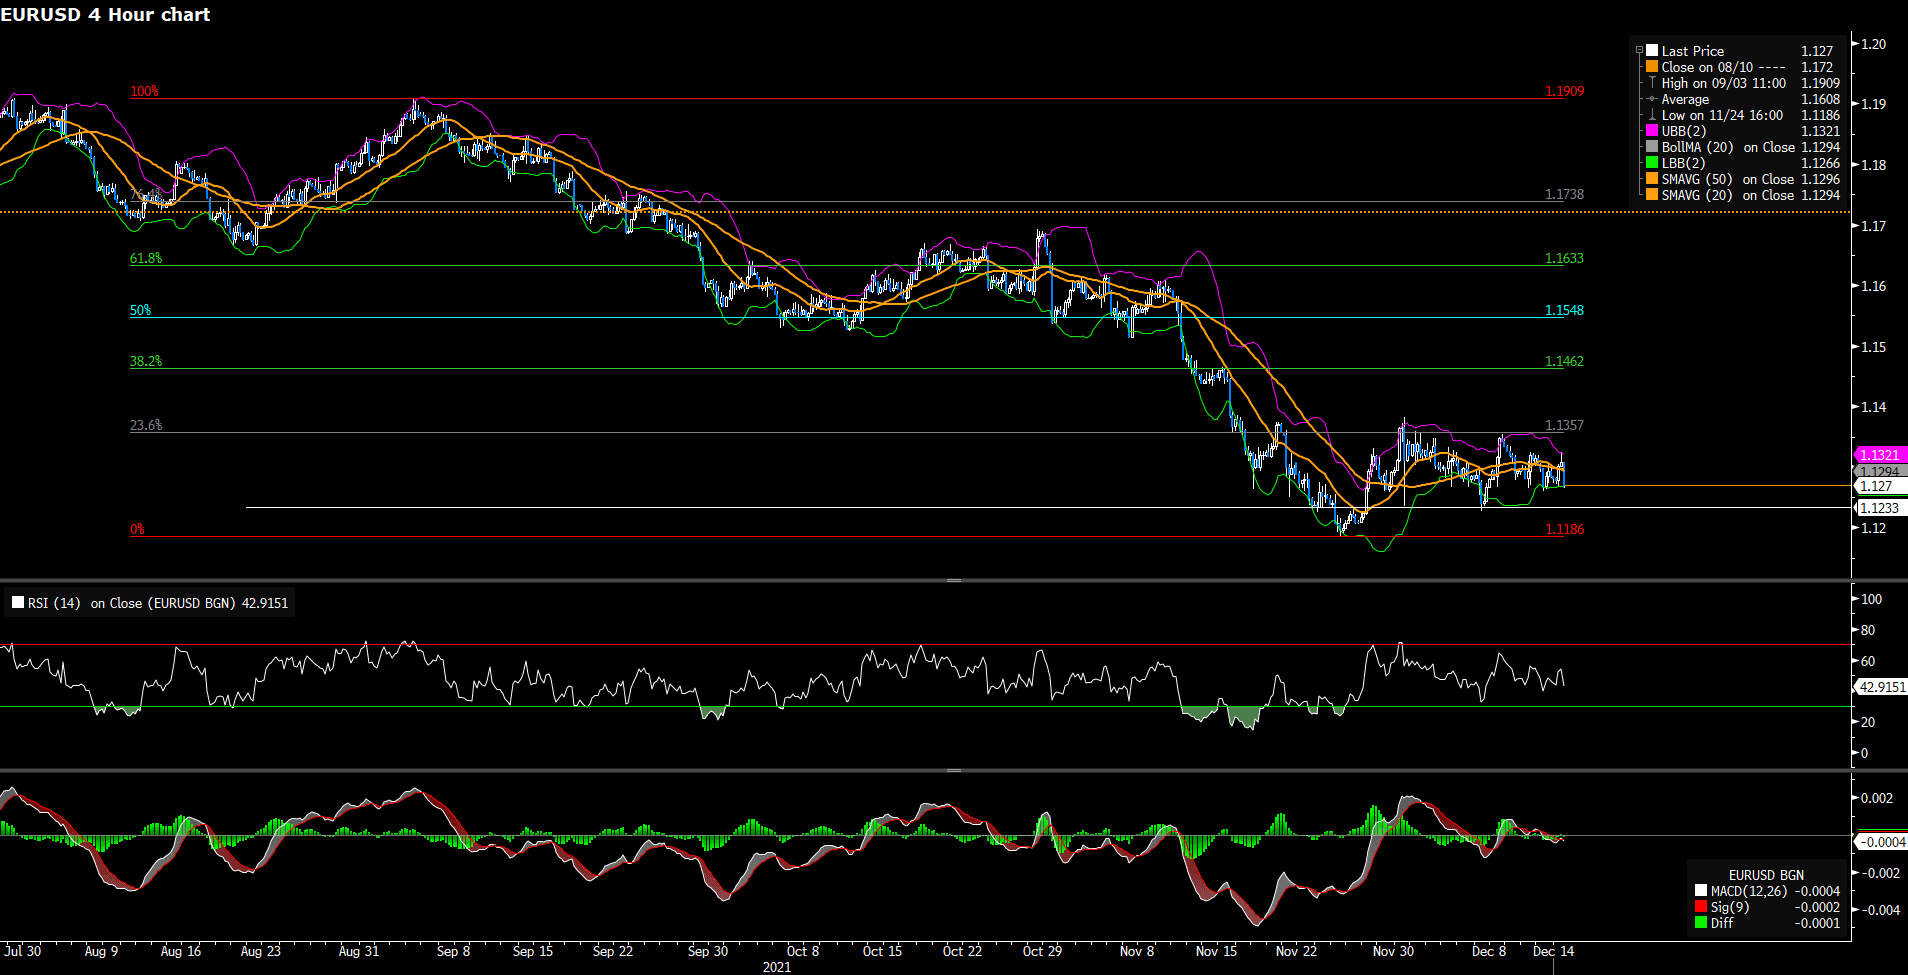
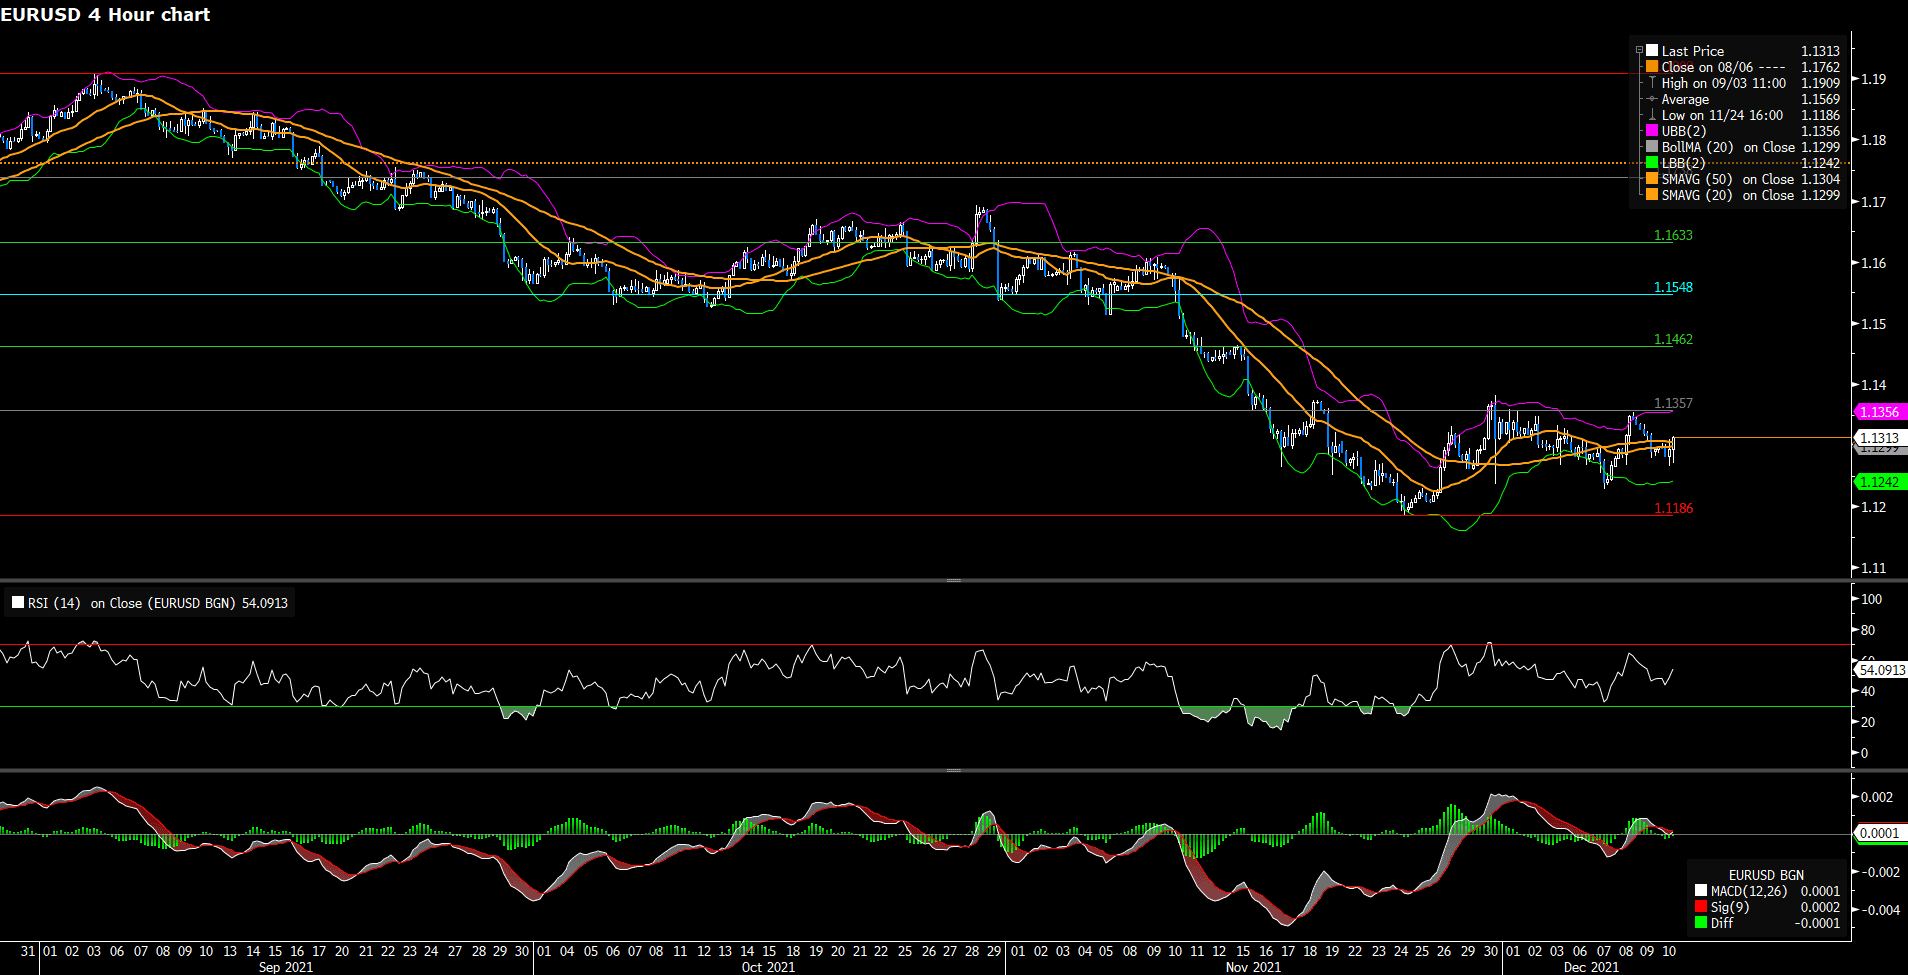
EURUSD declines merely trading at 1.1250 as the US dollar’s momentum picks up. From the technical aspect, EURUSD looks to test its immediate support at 1.1233, followed by 1.1186. The outlook remains neutral in the near- term as the technical indicator, RSI, lacks directional strength, steadily holding slightly below 50th mark. The support level at 1.1233 could be breached with the US Fed’s announcement later; if that is the case, EURUSD will become bearish in the near- term. On the upside, the currency pair needs to extend further north above the acceptance level at 1.1357 in order to turn upside.

Resistance: 1.1357, 1.1462, 1.1548

Support: 1.1233, 1.1186


Economic Data

Currency

Data

Time (GMT + 8)

Forecast

USD

FOMC Economic Projections

03:00

N/A

USD

FOMC Statement

03:00

N/A

USD

Fed Interest Rate Decision

03:00

0.25%

USD

FOMC Press Conference

03:00

N/A

NZD

GDP(Q3) YoY

05:45

-4.5%

GBP

Composite PMI

17:30

57.6

GBP

Manufacturing PMI

17:30

58.1

GBP

Services PMI

17:30

58.5

EUR

ECB Monetary Policy Statement

20:45

N/A

EUR

ECB Interest Rate Decision (Dec)

20:45

N/A

USD

Building Permits (Nov)

21:30

1.663M

USD

Initial Jobless Claims

21:30

200K

USD

Philadelphia Fed Manufacturing Index (Dec)

21:30

30

VT Markets Notification of trading adjustment in holiday

Dear Client,

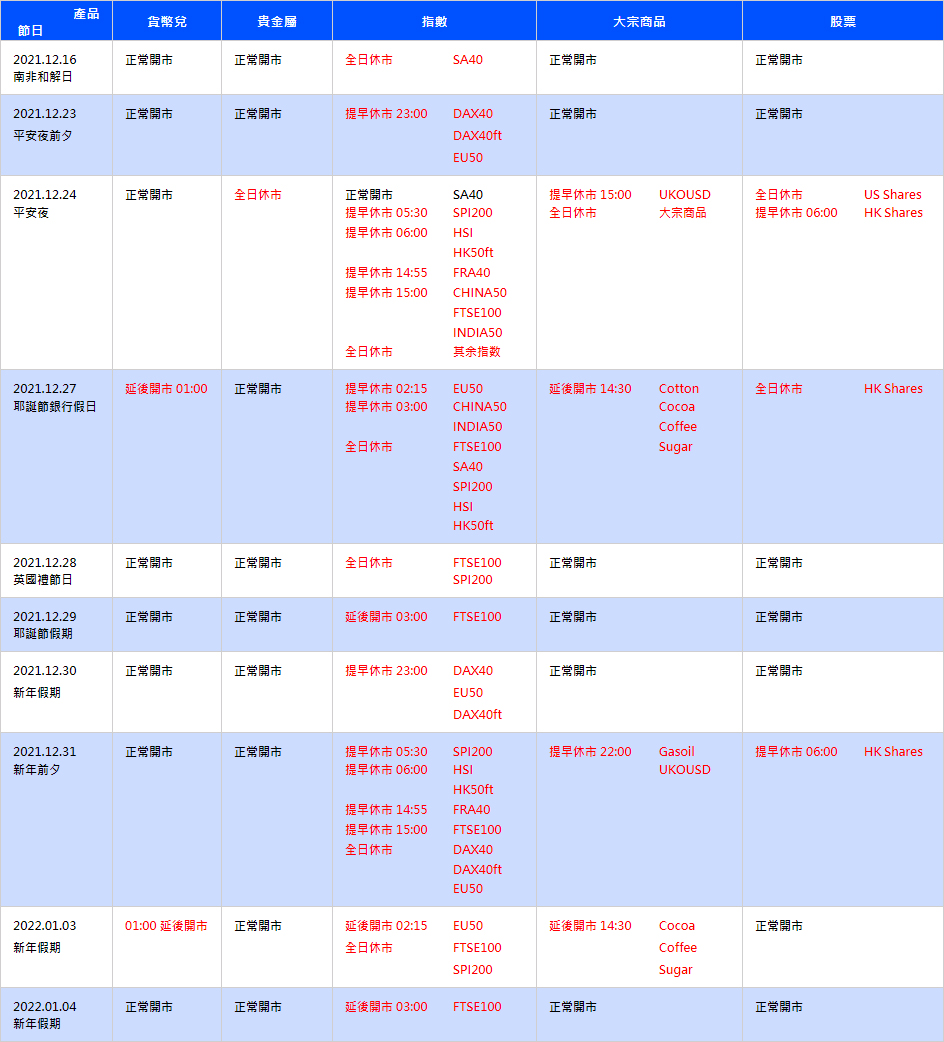
Please note the adjustment on following products due to international holiday in December:

The above time is MT4/5 server time. The trading time of other products is not affected. The above data may be subject to change. Please refer to the actual time on MT4/5.

If you have any questions, our team will be happy to answer your questions.
Please mail to [email protected] or contact the service online.

VT Markets New Product launch

Dear Client,

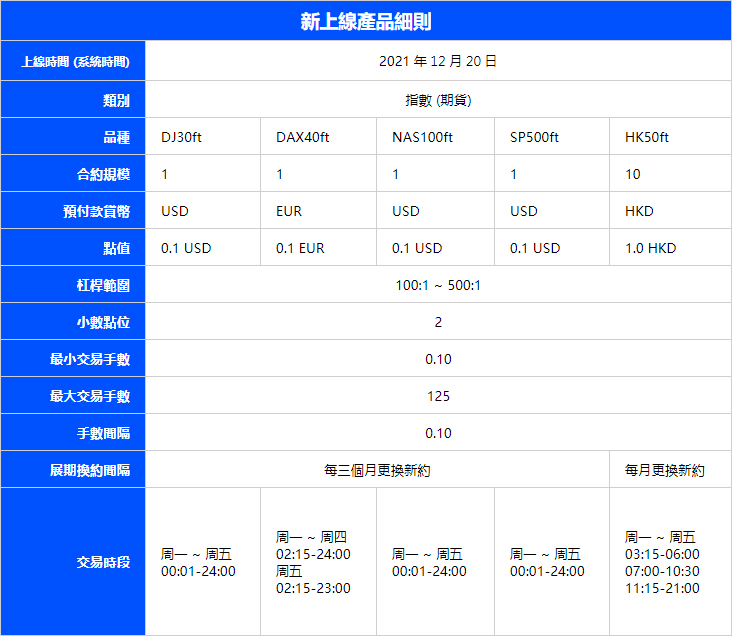
To provide our clients with a wealth of trading options, VT Markets will launch new CFDs on Index Futures on Dec 20th, 2021.

Kindly reminder that HK50ft will rollover firstly on Dec 29th, 2021.

The specifications of the new products as shown in the table below.

The above data is for reference only, please refer to the MT4/MT5 software for specific data.

Please check our official page to get more detail about
Forex: https://www.vtmarkets.com/trading/markets/indices/

Please contact [email protected] if you would like more information regarding to this.

Market Focus

US stock declined on Tuesday amid downbeat market sentiment, as pressures increased on the Federal Reserve to tighten monetary conditions in a faster than expected pace. The headline US Producer Price Index (PPI) released on Tuesday rose at an annual pace of 9.6% in November, which is more than market’s expectation of 9.2%. The surging US PPI and CPI data weighed on the equity market as investors worried that this could make the Fed to act more aggressively, despite the officials have give no signs that they would rush up to tighten monetary policy. On top of that, concerns about the spread of new Omicron variant still remained as the UK reported one death related to the newly discovered variant. Investors now await the critical Federal Reserve monetary policy decision on Wednesday, which might provide some clues on the pace of bond tapering and interest rate hikes.

The benchmarks, S&P 500, Nasdaq 100 and the Dow Jones Industrial Average both dropped on Tuesday amid downbeat market mood and a perspective that relief that Fed is about to end the cycle of easy money. S&P 500 was down 0.7% on a daily basis and the Dow Jones Industrial Average declined with a 0.3% loss for the day. Ten out of eleven sectors stayed in negative territory as the information technology and real estate sectors are the worst performing among all groups, losing 1.64% and 1.27%, respectively. The Nasdaq 100 dropped the most with 1.0% loss on Tuesday and the VIX rose almost 12%, as investors started to move their investments from stocks to other asset.

一張含有 文字 的圖片

自動產生的描述

In Asia, China will release Industrial Output for November and retail sales data, which are expected to show slower economic activity due to a real-estate recession and falling consumption. Meanwhile, Chinese property developer shares and bonds plunged to the lowest since early 2017.


Main Pairs Movement:

The US dollar advanced on Tuesday , staying in positive territory amid risk-off market sentiment. The DXY index dropped to a daily low under 96.15 in mid-European session, but then started to see heavy buying and rebounded towards 96.5 level. The higher yields and weaker stocks both lend support to the greenback, which rose 0.21% on a daily basis. Investors now expect the Fed to tighten its monetary policies in a faster pace due to higher PPI and CPI data.

GBP/USD advanced 0.10% on Tuesday amid upbeat UK jod data, as the number of people claiming unemployment-related benefits declined by 49.8K in November. The cable touched a daily top in late European session, then retreated back to surrender some of its intraday’s gain. Meanwhile, EUR/USD dropped to a weekly low under 1.126 area, losing 0.21% for the day.

Gold slipped and touched a daily low around $1766 amid renewed US dollar strength. The falling US stock market failed to pushed the precious metal higher, which dropped 0.87% on a daily basis. Meanwhile, WTI oil tumbled 1.16% for the day, as more countries reimpose restrictions to avoid an Omicron variant outbreak. The rising Covid-19 cases and the downbeat market mood both acted as a headwind for the black gold.


Technical Analysis:

XAUUSD (4- Hour Chart)

The precious metal, gold, slipped to fresh daily low below 1780 after the annual PPI surged to 9.6% in November. The sell- off mainly came from the market’s reaction as a high inflation might quicken the pace of the US Fed’s QE taper as well as hikes in the interest rates. From the technical perspective, gold continues to trade in a subdued manner within 1786- 1770 ranges. In the near term, the outlook of gold looks bearish as it trades below the 20 SMA, and heading to test its support at 1770. For now, any further rallies below 1770 will confirm a sell as if gold penetrates the level, it will at the same time break the descending wedge. More price action is likely to be in place after Wednesday’s FOMC policy announcement.

Resistance: 1786, 1804, 1818

Support: 1770, 1758


GBPUSD (4- Hour Chart)

GBPUSD stays in the positive territory neat 1.3230 on Tuesday as the US dollar has a difficult time to find the demand after the release of PPI report. However, the pound’s demand is at the same time at stake as the Omicron infections in the UK looks worse than expected. As a result, further price action eyes on Wednesday’s FOMC announcement. From the technical aspect, despite the recent rebound, the outlook of the currency pair continues to remain bearish as it still trades below the 20 and 50 SMAs on the four- hour chart. In the meantime, the RSI is neither in the oversold nor overbought territory, punctuating the lack of upside strength. On the upside, GBPUSD needs to at least trade above the SMAs to reclaim bullish momentum in the near- term. Trading above the resistance at 1.3321 will re- confirm a bearish- to- bullish trend.

Resistance: 1.3321, 1.3419, 1.3499

Support: 1.3163


EURUSD (4- Hour Chart)

EURUSD trades near its weekly low at 1.1269 amid the advances in the US government bond yields. The focus remains on Wednesday’s US Fed decision and Tuesday’s the ECB meeting. From the technical analysis, EURUSD continues to seesaw within 1.1233- 1.1357 range. On the four- hour chart, the outlook remains bearish as the pair continues to trade below the 20 and 50 Simple Moving Averages; in the meantime, it trades within the lower bounce of Bollinger Band. The RSI indicator remains neutral, suggesting a directionless situation. On the upside, EURUSD needs to trade above 1.1357 in order to begin another bullish trend; the pair might extend further gain p to 1.1462 if it successfully breaches the immediate resistance at 1.1357.

Resistance: 1.1357, 1.1462, 1.1548

Support: 1.1186


Economic Data

Currency

Data

Time (GMT + 8)

Forecast

NZD

RBNZ Gov Orr Speaks

03:00

N/A

CNY

Industrial Production (YoY) (Nov)

10:00

3.6%

GBP

CPI (YoY) (Nov)

15:00

4.7%

USD

Core Retail Sales (MoM) (Nov)

21:30

0.9%

USD

Retail Sales (MoM) (Nov)

21:30

0.8%

CAD

Core CPI (MoM) (Nov)

21:30

N/A

USD

Crude Oil Inventories

23:30

-2.600M

Market Focus

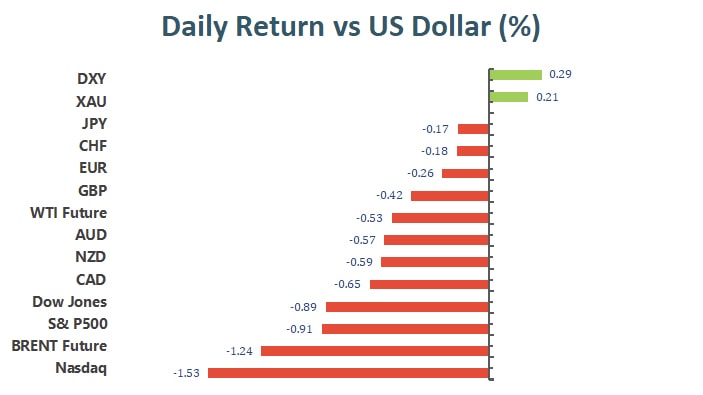
US stocks fell on Monday due to concerns about the Omicron coronavirus variant before the Federal Reserve meeting later this week. The decline was mainly concentrated in the oil and gas, consumer services and technology sectors. At the end of the market, the Dow Jones Industrial Average lost 0.89% to 35,650.96 points, the S&P 500 index lost 0.91% to 4,668.98 and the Nasdaq Composite Index, dropped 1.39%.

一張含有 文字 的圖片

自動產生的描述

Seven of the 11 major sectors of the S&P 500 fell, with only defensive stocks such as real estate, utilities, consumer staples and healthcare rising. Travel-related stocks fell because the fast-spreading Omicron accounted for about 40% of COVID-19 infections in London, and at least one person died in the UK. On the other hand, the best-performing stock in the Dow Jones Industrial Average was Coca-Cola Company, which rose 2.63%, Walmart rose 1.80% and Johnson & Johnson rose 1.79% in late trading. The worst performing stock was Boeing, which fell 3.74%, the Dow fell 2.49% and the Home Depot fell 2.45%. In addition, the best performing company in the Nasdaq Composite Index was SeaChange International Inc, which rose 128.81%, Arena Pharmaceuticals Inc soared 80.38% after Pfizer agreed to acquire a $6.7 billion all-cash transaction, Pfizer also rose 5.3%, and Foghorn Therapeutics Inc rose 54.96%. The worst performers were Nisun International Enterprise Development Group Co Ltd, which fell 60.29%, X4 Pharmaceuticals Inc fell 44.13%, and IGM Biosciences Incclose fell 41.31%.
 

Main Pairs Movement:

The three most important central banks in the world will hold their last monetary policy meeting in 2021, which will exacerbate weak sentiment. The Federal Reserve will announce its monetary policy decisions on Wednesday, while the Bank of England and the European Central Bank will announce their monetary policy decisions on Thursday. Concerns about how the ongoing Omicron epidemic might affect such decisions and global economic growth continue. At the same time, the UK reported its first death related to the Omicron variant, which stimulated market risk aversion.

In the US Treasury market, the 10-year long-term Treasury bond yields fell, and the 20-year and 30-year Treasury yields fell 7-8 basis points to close at 1.414%, 1.84% and 1.80%, respectively.

The EUR/USD hovered below 1.1300, while the GBP/USD fell to the 1.3200 area. Due to the slight decline in U.S. stocks, commodity-related currencies faced selling pressure and rebounded slightly before the close. The AUD/USD fell by 0.54%, and the USD/CAD rose by 0.62%. The safe-haven currencies Swiss franc and Japanese yen changed little against the U.S. dollar each day, and both fell 0.19% against the greenback.

Gold rose 0.21% and hovered at $1786 per ounce area, while WTI oil dropped 1.08% to $71.16 per barrel.


Technical Analysis:

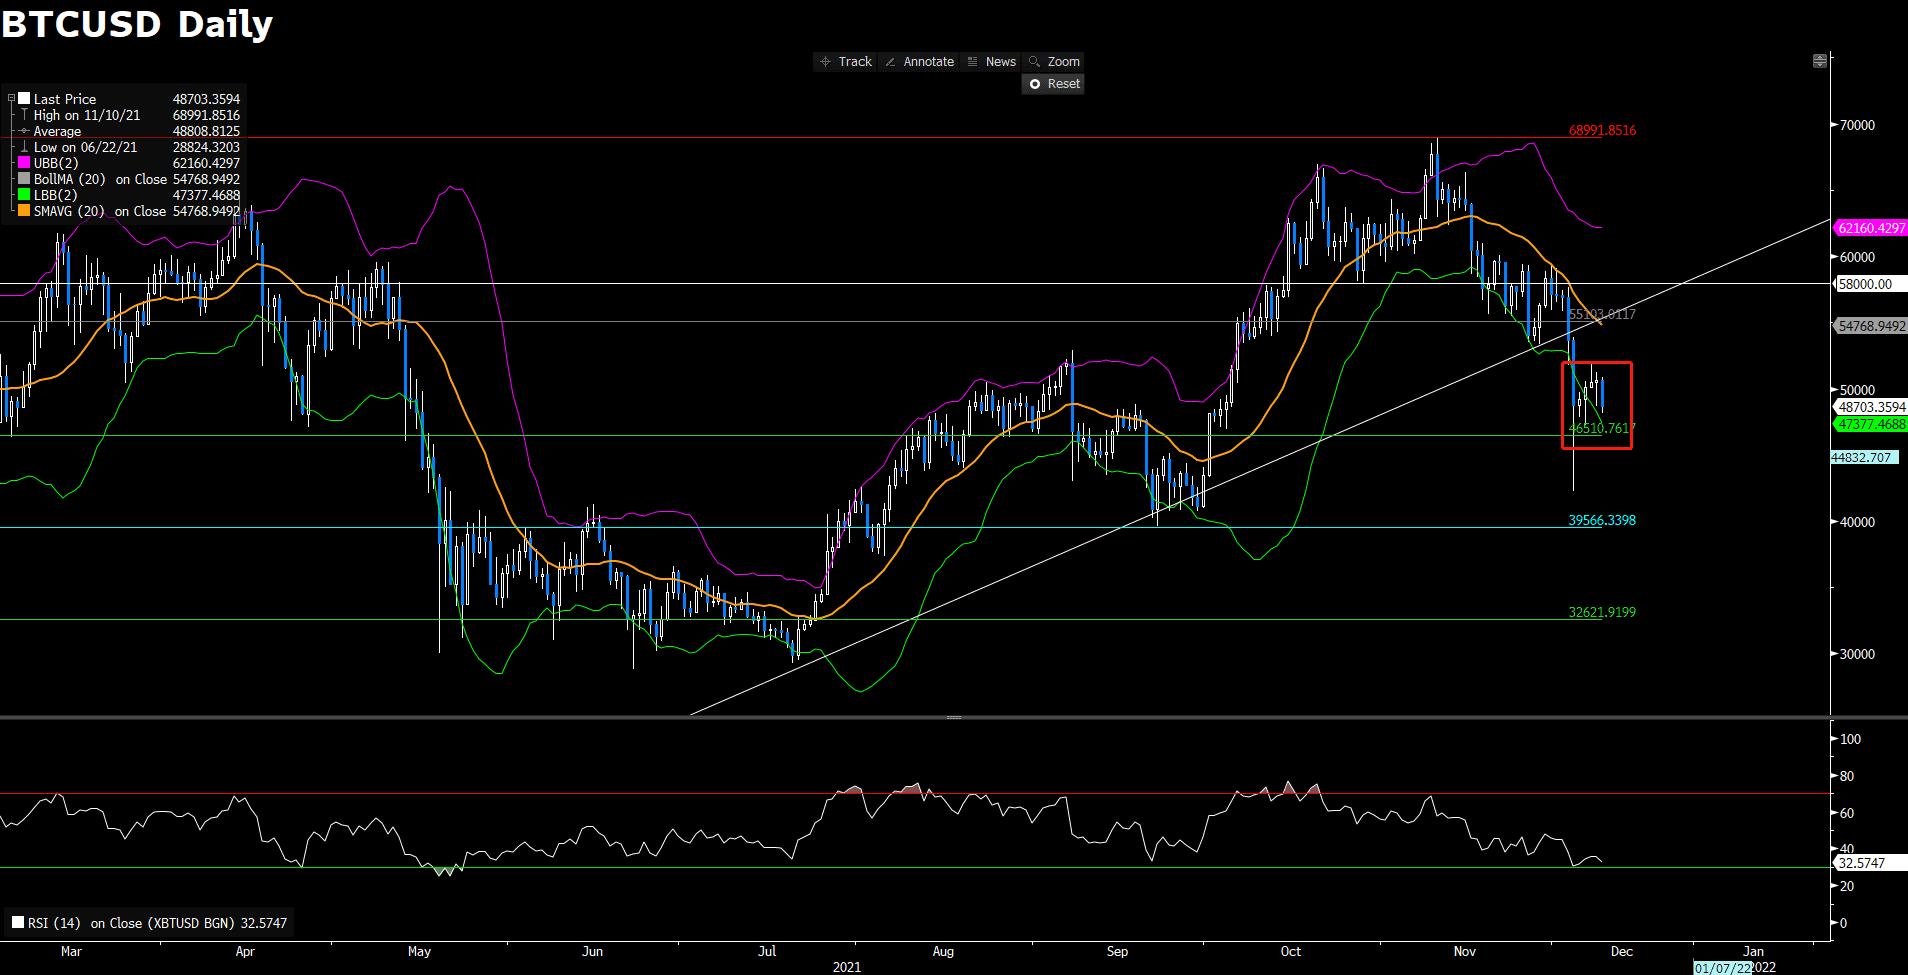
BTCUSD (Daily Chart)
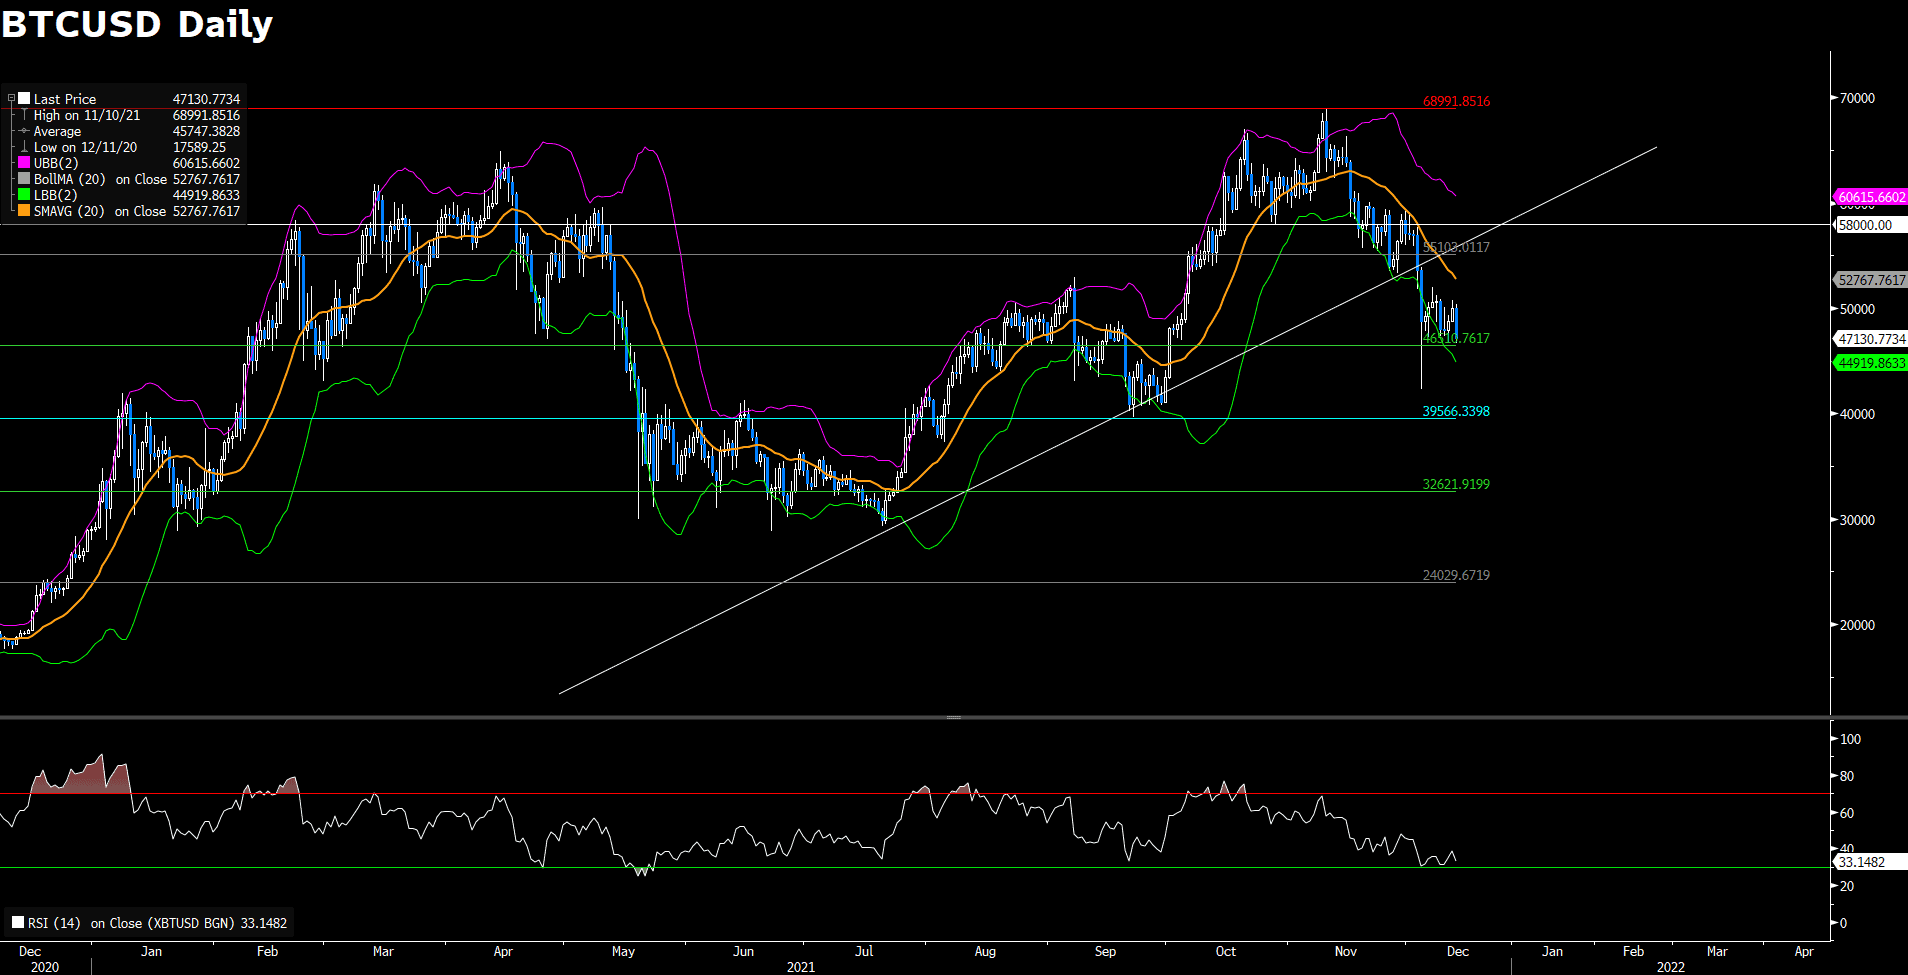
On Monday, 90% of Bitcoin have been mined according to the tracker from Blockchain.com. That being said, 90% of the coin are on the open market. From the technical aspect, Bitcoin falls back from $50,132, a 1.41% rise on Sunday. Bitcoin starts the week by re- testing the support pivot again at $46,510. On the daily chart, Bitcoin needs to move back through $55,103 to initiate the first bullish momentum into play. Failure to move back though the immediate resistance would continue to make Bitcoin downside. If the support at $46,510 cannot hold, then Bitcoin will head toward the next support at $39,566. However, it looks like that the bearish momentum is being weakened as the RSI remains oversold condition, due for a bounce back.

Resistance: 55,103, 58,000, 68,991

Support: 46,510, 39,566, 32,621


GBPUSD (4- Hour Chart)
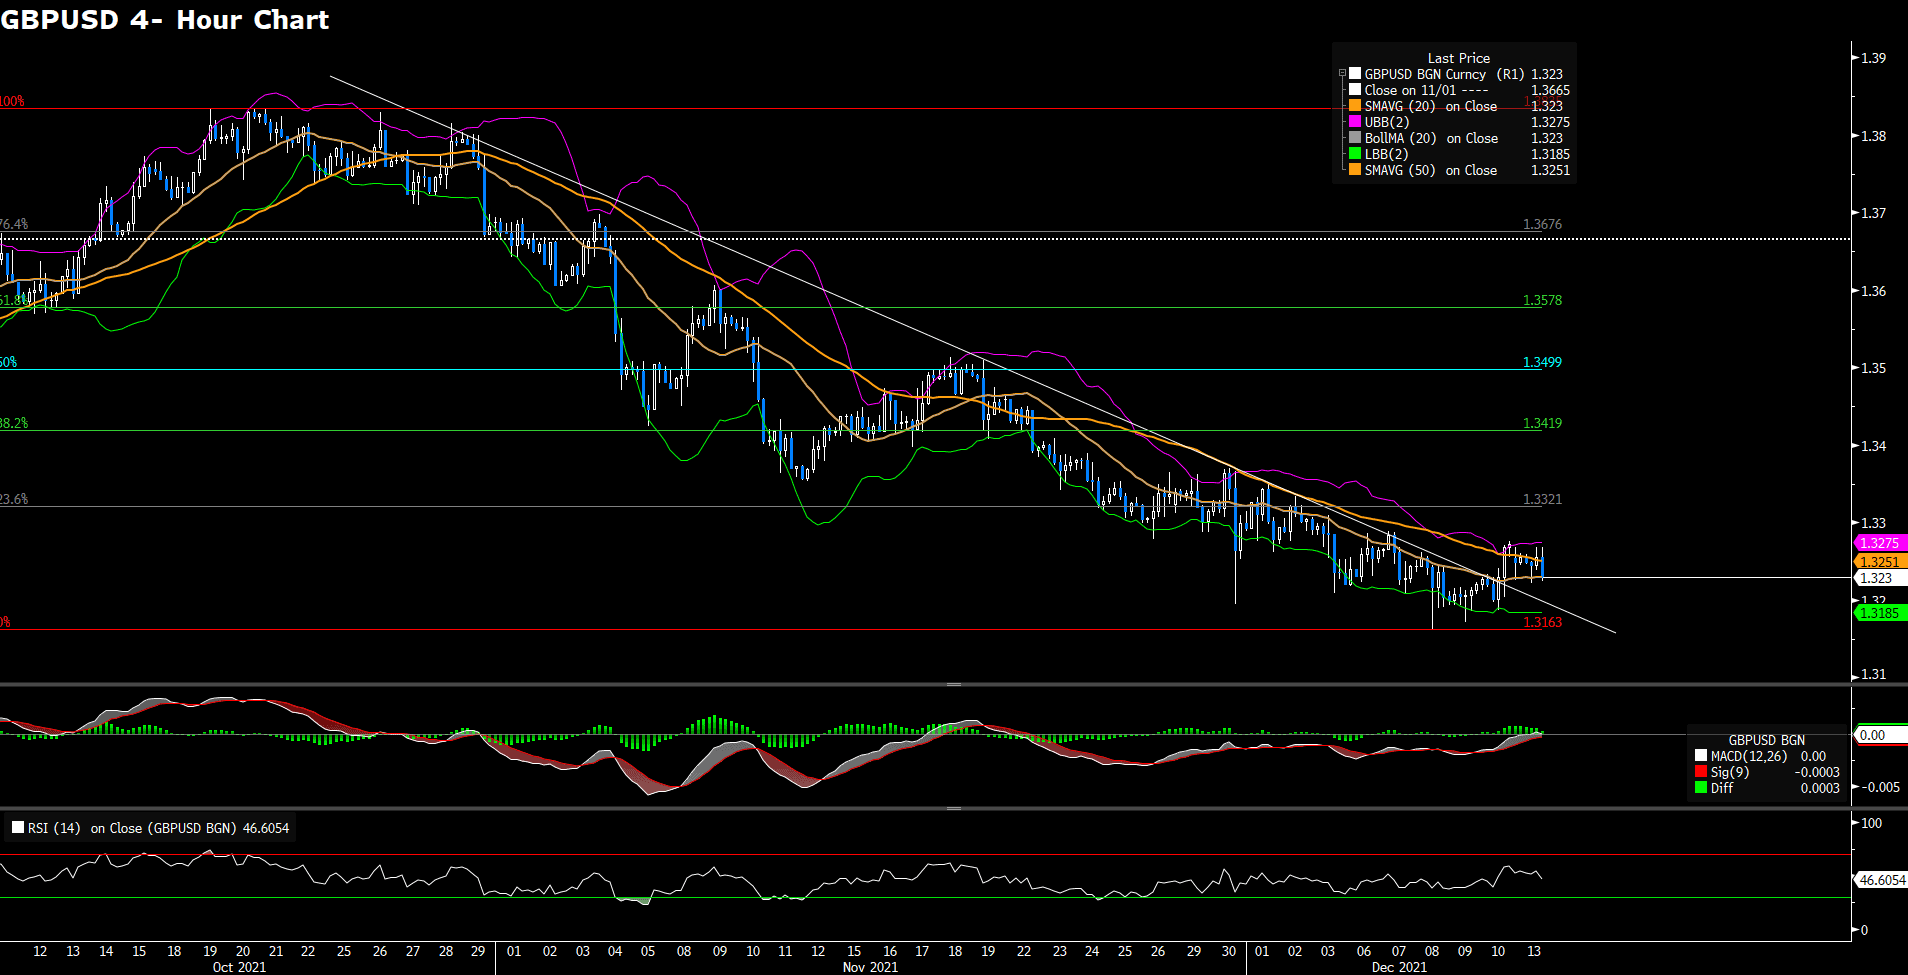
GBPUSD edges higher on Monday as the US dollar struggles to preserve its strength to start the week. From the technical perspective, the outlook of the pair turns upside in the near term as it has breached the descending trendline and is trading above the 50 moving averages. However, the upside momentum seems lack of strength as the currency continues to consolidate in the range from 1.3321 to 1.3163. Moreover, the RSI indicator has hovered around the midline, suggesting that buyers and sellers show less interest in the pair for the time being. On the downside, if the pair falls below the bearish trendline, then it will turn bearish in the near- term and head toward 1.3163. Current resistance awaits at 1.3163 while supports are located at 1.3321, followed by 1.3419.

Resistance: 1.3321, 1.3419, 1.3499

Support: 1.3163


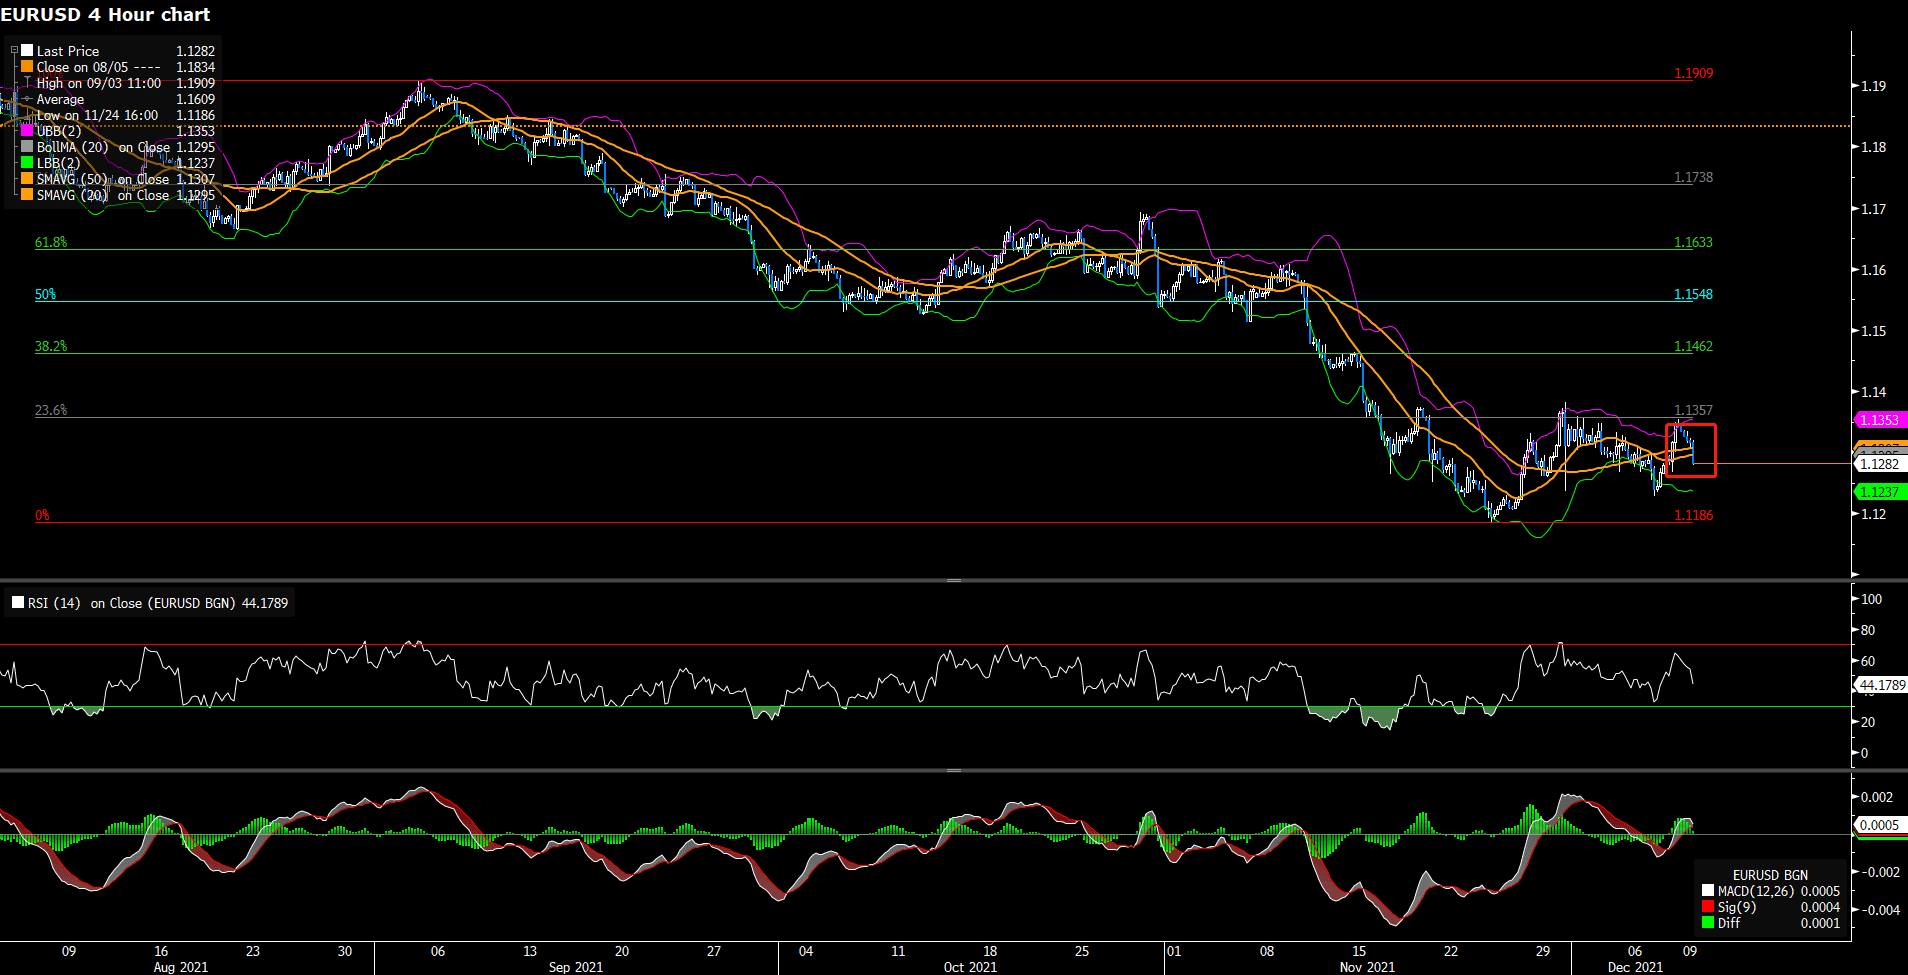
EURUSD (4- Hour Chart)
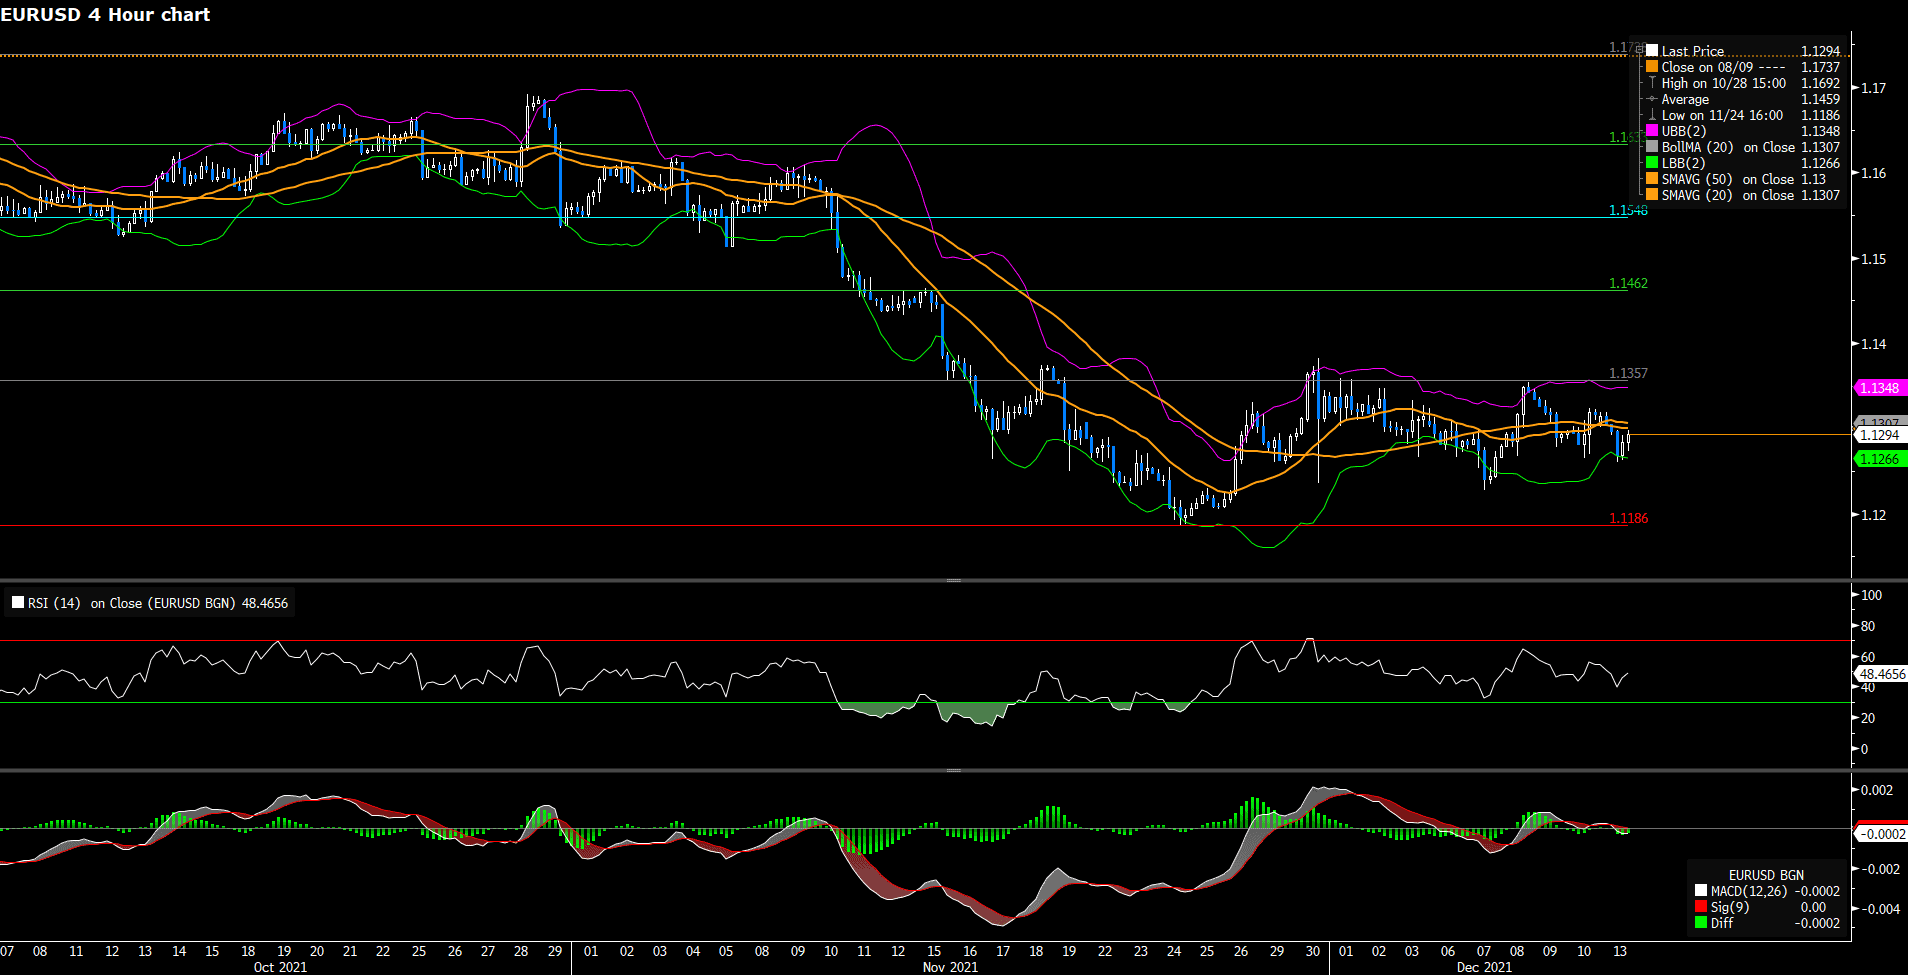
EURUSD rebounds toward 1.1300 to start the new week as the decline of the US bonds makes it difficult for the US dollar to outperform its rival currencies. From the technical perspective, the 4- hour outlook hints that the bullish momentum is still being limited as EURUSD continues to develop below the simple moving averages, currently hovering below the 20 and 50 SMAs. In the meantime, EURUSD keeps trading within the lower bounce of Bollinger Band after bottoming at 1.1259. It is expected to see the pair consolidate below the moving averages as the RSI is currently neutral, hovering around the midline; furthermore, the MACD is flat, neither supporting buyers nor sellers. Further movements of the pair will eye on Tuesday’s US PPI report.

Resistance: 1.1357, 1.1462, 1.1548

Support: 1.1186


Economic Data

Currency

Data

Time (GMT + 8)

Forecast

GBP

Average Earnings Index +Bonus (Oct)

15:00

4.6%

GBP

Claimant Count Change (Nov)

15:00

N/A

BRL

BCB Copom Meeting Minutes

19:00

N/A

USD

PPI (MoM) (Nov)

21:30

0.5%

Market Focus

US stock advanced on Friday, recovering from previous day’s slide. Market now tends to believe that the Federal Reserve won’t have to accelerate plans to tighten monetary policy after the release of a in-line inflation data. The US CPI came in 6.8%, which is the highest since 1982 but correspond with market’s expectations. Therefore, the fact that high US inflation wasn’t even higher supports the equity market. Also, Consumer Sentiment in US improved from a decade-low in November. On top of that, concerns about the spread of new Omicron variant keep weighing on market sentiment, as companies in UK have started to tell employees to work from home. Investors now await the key Fed meeting this week, which might provide some clues on the pace of bond tapering and interest rate hikes.

The benchmarks, S&P 500, Nasdaq 100 and the Dow Jones Industrial Average both rose on Friday amid upbeat market mood and relief that Fed won’t have raise interest rates too early. S&P 500 was up 1.0% on a daily basis and the Dow Jones Industrial Average advanced with a 0.7% gain for the day. All eleven sectors stayed in positive territory as the information technology and consumer staples sectors are the best performing among all groups, gaining 2.07% and 1.99%, respectively. The Nasdaq 100 advanced the most with 1.1% gain on Friday and the VIX fell a further more than 2.0 points to under 19.50.

一張含有 文字 的圖片

自動產生的描述

In Asia, after disclosures that came a day after the developer officially defaulted on their dollar debt, China Evergrande Group chairman Hui Ka Yan was forced to sell pledged shares in the company. Therefore, shares of Evergrande declined 1.7% lower as well as Chinese real estate stocks, which also down 1.5%.


Main Pairs Movement:

The US dollar edged 0.2% lower last Friday, staying in negative territory amid improved market sentiment. The DXY index gained bullish momentum and touched a daily top above 96.42 level during European session, but then pulled back to below 96 and surrendered its intraday gains at the end of the day. The in-line US CPI data supported major US equities and put pressure on the greenback. Markets focus now shift to the Fed meeting this week, as investors expect a speed up bond tapering.

GBP/USD and EUR/USD both advanced last Friday amid US dollar weakness, climbing 0.34% and 0.20%, respectively. The cable saw fresh buying and touched a three-day high above 1.327 during American session. Meanwhile, EUR/USD recovered from a two-day low that touched earlier in the day, trading at around 1.131 area at the end of the day.

Gold advanced and touched a daily top around $1790 amid high US inflation report, which rose the most since the early 1980s. The renewed selling witnessed in greenback also acted as a tailwind for the precious metal, which gained 0.41% on a daily basis. WTI oil surged 1.81% for the day, closing out its best weekly performance since August. The growing confidence that the new Omicron variant is set to be far milder than past variants like delta pushed oil prices higher.


Technical Analysis:

AUDUSD (4- Hour Chart)

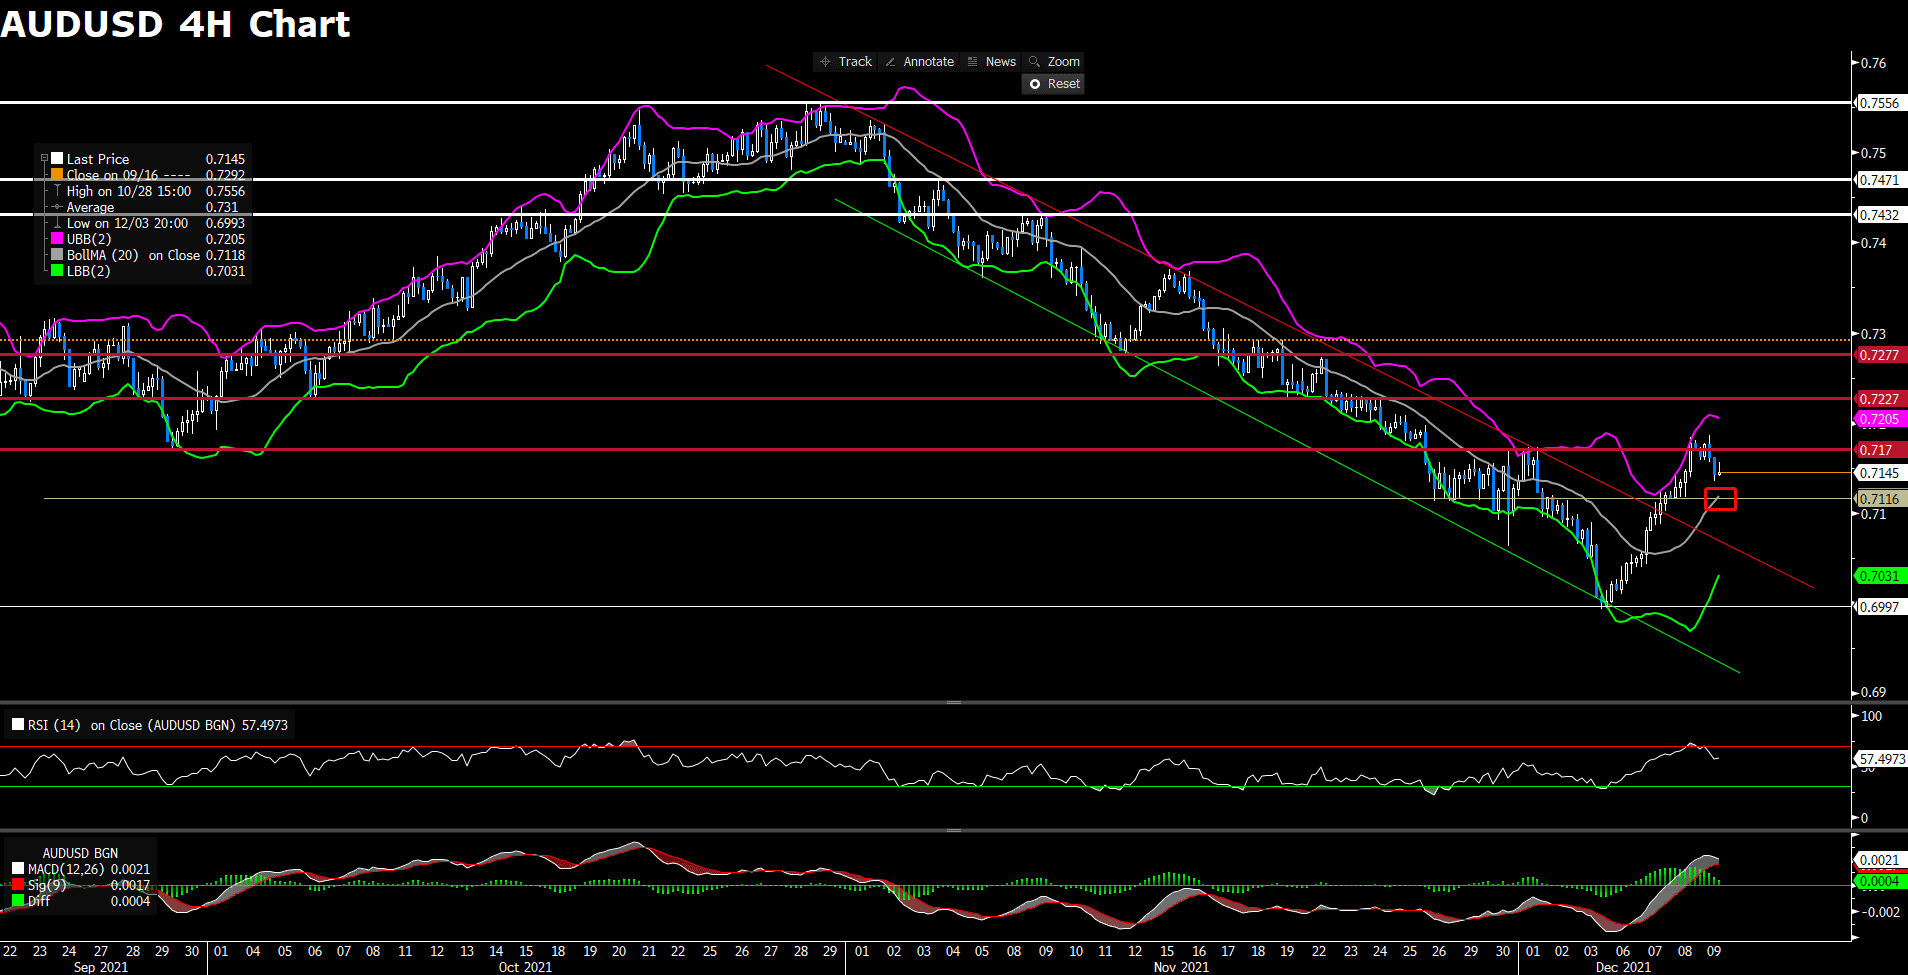
AUDUSD retests 0.717, gaining some positive traction after the US CPI report. From the technical perspective, the pair is currently challenging its immediate hurdle at 0.717. The outlook turns positive as the pair has breached the bearish trendline. If AUDUSD can officially trade above the 0.717, then it will reaffirm its upside momentum in the near term. From either the RSI or the MACD, a buying opportunity occurs as both indicators currently favor buyers. On the flip side, if AUDUSD falls below its support at 0.7116, then it will turn downside as it will falls within the bearish trendline.

Resistance: 0.717, 0.7227

Support: 0.7116, 0.6997


GBPUSD (4- Hour Chart)

GBPUSD climbs above 1.3230 on worrisome US inflation report, hitting the highest in almost four decades. The US dollar seems vulnerable after the inflation report; in the meantime, heating US inflation figures might hint at steeper US Fed tightening. From the technical aspect, today’s upside momentum seems to bring GBPUSD out of the bearish trendline on the 4- hour chart, suggesting an overturn from bearish to bullish in the near term. A neutral RSI looks to favor bullish traders, who are also supported by a positive MACD. The next relevant resistance is set at 1.332, followed by 1.3417. On the flip side, if the pair fails to close its intraday price above the bearish trendline, then a selling opportunity will occur. The next relevant support is set at 1.3163.

Resistance: 1.3321, 1.3419, 1.3499

Support: 1.3163


EURUSD (4- Hour Chart)

EURUSD bounces modestly above 1.1300 after the US inflation report at 6.8% in November, reaching the highest in almost four decades. From the technical aspect, the overnight pullback from weekly lows seems to turn the currency pair back to bullish mode in the near term. Climbing back above 1.1300 favors bullish traders as EURUSD is now trading above its 20 and 50 SMAs; in the meantime, the MACD indicator is now turning into positive levels as the time of writing. The current upside momentum is expected to bring the pair toward its immediate resistance at 1.1357. On the flip side, selling below 1.1299 region will reaffirm the negative bias and accelerate the downside momentum toward its support at 1.1186.

Resistance: 1.1357, 1.1462, 1.1548

Support: 1.1186


Economic Data

Currency

Data

Time (GMT + 8)

Forecast

JPY

Tankan Large Manufacturers Index (Q4)

07:50

19

JPY

Tankan Large Non-Manufacturers Index (Q4)

07:50

6

VT Markets Notification of Server Upgrade

Dear Client,

As part of our commitment to providing the best reliability and service to our client, we are planning an upgrade in our server on December 11th 2021.

As a result, we will be conduct maintenance according to the schedule below.
Start date and time: 2021-12-11 13:00 GMT+2(Server time)
End date and time: 2021-12-11 19:00 GMT+2(Server time)

Kindly be reminded that the following things might be affected during this maintenance period:

1. The login and operation of the client portal

2. The login of the trading account

3. The quotations of products will be paused. Clients might not be able to open new positions or close the held positions.

4. There might be a gap between the original price and the price after maintenance. Pending orders, Stop Loss, and Take Profit settings within the gap will be filled at the market price after maintenance ends.

After the upgrade, clients can login to trading account using the server which is shown in the account activation mail.

No action is required by our client. Your service will be back online after the maintenance is completed.

Thank you for your patience and understanding with regard to this important initiative.

If you’d like more information, please don’t hesitate to contact [email protected].

Market Focus

US stock declined on Thursday, ending its three day winning streak. Investors now worried about that the restrictions to stop the spread of new Omicron variant could harm the economic recovery. A study has found that new Omicron is 4.2 times more transmissible than the delta variant in its early stages. On top of that, UK PM Boris Johnson announced that the UK would started to reimpose Covid-19 restrictions on everyday life and people are encouraged to work from home. Investors now await the key US inflation data on Friday, which might provide some clues on the pace of bond tapering.

The benchmarks, S&P 500 and Nasdaq both dropped on Thursday as market sentiment soured and the bearish news about rising Omicron fears acted as a headwind for the equity markets. S&P 500 was down 0.7% on a daily basis and the Nasdaq 100 declined with a 1.5% loss for the day. Nine out of eleven sectors stayed in negative territory as the consumer discretionary and real estate sectors are the worst performing among all groups, losing 1.70% and 1.36%, respectively. The Dow Jones Industrial Average was little changed on Thursday.

一張含有 文字 的圖片

自動產生的描述

In Asia, China Evergrande Group and Kaisa Group Holdings Ltd. officially defaulted on their dollar debt, and the China authorities have made it clear that they have no intention of bailing out the Evergrande Group to prevent scenarios of an collapse. Moreover, the People’s Bank of China raised its foreign currency reserve requirement ratio for a second time this year.

Main Pairs Movement:

The US dollar edged higher on Thursday, staying in positive territory amid risk-off market sentiment. The DXY index gained bullish momentum and touched a daily top above 96.3 level during American session, but pulled back slightly and surrendered some of its intraday gains at the end of the day. Markets focus now shift to US Core CPI reports on Friday, as the Fed said it would be appropriate to discuss speeding the QE taper at next week’s meeting due to rising inflation pressure.

GBP/USD advanced on Thursday, climbing towards 1.322 area and recovered from yearly lows that touched earlier this week, despite UK promoted the work-from-home culture on Omicron variant threat. Meanwhile, EUR/USD dropped to daily lows below 1.129 level and posted a 0.47% loss on a daily basis, as investors now await the ECB monetary policy meetings next week.

Gold dropped to $1775 area amid Covid-19 restrictions spurred by the Omicron variant’s rapid spread. The recovery witnessed in greenback also weighed on the precious metal, which slided 0.48% on a daily basis. WTI oil tumbled 2.78% for the day, ending its previous rally. Covid-19 restrictions and the spread of the omicron variant both decreased the oil demand, dragging oil prices lower.

Technical Analysis:

AUDUSD (4- Hour Chart)

AUDUSD witness a turnaround from a two- week high as hawkish Fed expectations have renewed US dollar buying. Moreover, the US dollar regains strength after the economic data, initial jobless claims, has shown a better- than- expected result. In the meantime, the latest US CPI report on this Friday will heavily influence the US dollar price dynamics. From the technical perspective, the 4- hour outlook remains bullish as it has not yet fell within the bearish channel. The pair fails to challenge the resistance of 0.7170, giving the pair potentials to consolidate in the range of 0.7170 and 0.7116. The downside momentum is limited as the RSI is clear from the overbought condition while the MACD is still positive. The pair needs to fall below the support of 0.7116 and the midline of Bolliger Band to present a negative level

Resistance: 0.717, 0.7227

Support: 0.7116, 0.6997

BTCUSD (Daily Chart)

The Bitcoin hashrate, which is a measure of computing power, has almost recovered to its level in May when Chinese government started a crackdown on the mining industry. From the technical perspective. Bitcoin’s bulls have attempted to recover after hitting its support level at $46,510 last week, but it seems to hit a curb after reclaiming the psychological resistance at $50,000. The daily outlook looks bearish as it continues to trade below the ascending trendline, re- challenging its support at $46,510. Bitcoin’s bulls need to defend its support level in order to keep a further bullish correction alive. If it fails to defend, then the bearish momentum can go further toward the next support at $39,566. However, as the RSI indicator has almost reached the oversold territory, the bearish price action might fade soon. In the meantime, Bitcoin has reached the lower bounce of Bollinger Band, suggesting a pullback. To the upside, Bitcoin needs to climb above the acceptance level at $55,103 in order to regain strength; otherwise, its daily outlook remains bearish.

Resistance: 55,103, 58,000, 68,991

Support: 46,510, 39,566, 32,621

EURUSD (4- Hour Chart)

EURUSD declines below 1.1300 after the market is anticipating over a potential increase in the APP at its meeting next week. Dovish ECB headlines weigh on the euro dollar. At the same time, the US dollar rebounds amid a cautious mood on the new variant Covid. From the technical perspective, EURUSD trades below its 20 and 50- day SMAs, losing its positive momentum on the 4- hour chart, but still not yet claiming an upcoming decline as the MACD indicator is still positive, lending supports to bulls. In the same chart, if the currency pair remains below the SMAs, then it might head to the support at 1.1186 to extend its bearish mode. On the contrary, the pair needs to trade above the SMAs in order to reclaim and remain within positive levels.

Resistance: 1.1357, 1.1462, 1.1548

Support: 1.1186

Economic Data

Currency

Data

Time (GMT + 8)

Forecast

GBP

GDP (MoM)

15:00

0.4%

GBP

GDP (YoY) (Q3)

15:00

22.2%

GBP

Manufacturing Production (MoM) (Oct)

15:00

0.1%

EUR

ECB President Lagarde Speaks

17:05

N/A

USD

Core CPI (MoM) (Nov)

21:30

0.5%

VT Markets The Adjustment Of Weekly Dividend Notification

Dear Client,

Warmly reminds you that the component stocks in the stock index spot generate dividends. When dividends are distributed, VT Markets will make dividends and deductions for the clients who hold the trading products after the close of the day before the ex-dividend date.

Indices dividends will not be paid/charged as an inclusion along with the swap component. It will be executed separately through a balance statement directly to your trading account, the comment for which will be in the following format “Div & Product Name & Net Volume ” .

Please note the specific adjustments as follows:

Note: The above data is for reference only, the actual execution data may be changed, please refer to the MT4/MT5 software for details.

If you’d like more information, please don’t hesitate to contact [email protected].

Back To Top
server

Hello there 👋

How can I help you?

Chat with our team instantly

Live Chat

Start a live conversation through...

  • Telegram
    hold On hold
  • Coming Soon...

Hello there 👋

How can I help you?

telegram

Scan the QR code with your smartphone to start a chat with us, or click here.

Don’t have the Telegram App or Desktop installed? Use Web Telegram instead.

QR code