Market Focus

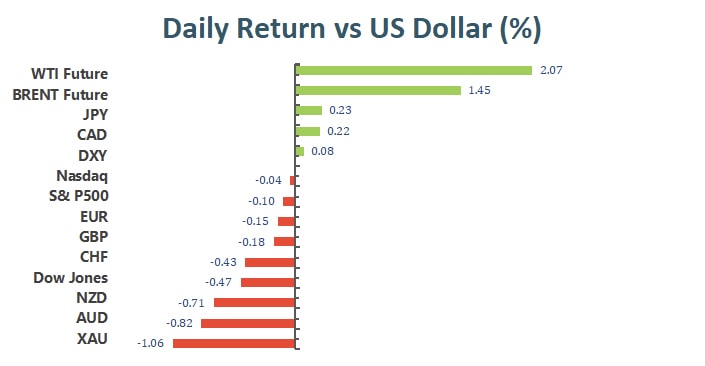
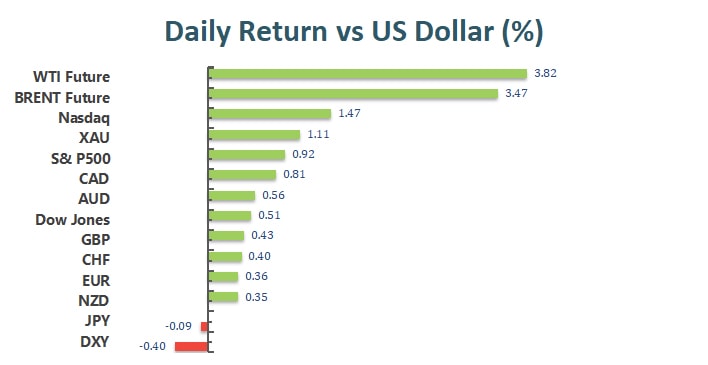
The broad U.S. equity market rebounded last night as Federal Reserve chairman Jerome Powell smoothed tightening fears across markets. The Dow Jones Industrial Average gained 0.51% to close at 36252.02, the S&P 500 gained 0.92% to close at 4713.07, and the Nasdaq composite gained 1.41% to close at 15153.45. The benchmark U.S. 10 year treasury yield lowered slightly to 1.746%, while the 30 year treasury yield also slid to 2.076%.

一張含有 文字 的圖片

自動產生的描述

The energy sector gained an impressive 3.41% over the course of yesterday’s trading. Oil prices has risen from its year end low and is currently trading at $81.343/ bbl. Market participants have reassessed the Omircron variant’s impact on travel. APA Corp., and Occidental Petroleum Corp. both enjoyed more that 7% gains.
  

Main Pairs Movement:

Federal Reserve Jerome Powell’s testimony on Tuesday proved to be soothing for equity trader, but the rather mild tone by chairman Powell brought across the board weakness to the Greenback. The Dollar Index lost 0.36% over the course of yesterday’s trading.

Cable gained amid a weaker Dollar. Tonight’s U.S. CPI data could fuel the Sterling’s recent upward momentum.

The Euro-Dollar pair gained 0.36% over the course of yesterday’s trading. Most of the upward price action came after the U.S. equity markets opened and is continuing to rise over the early sessions of Wednesday.

Gold gained an impressive 1.1% over the course of yesterday’s trading. The precious metal is continuing its 3 days win streak, but the U.S. CPI data could bring substantial volatility to Gold.


Technical Analysis:
GBPUSD (Daily Chart)

一張含有 文字, 電線, 光 的圖片

自動產生的描述

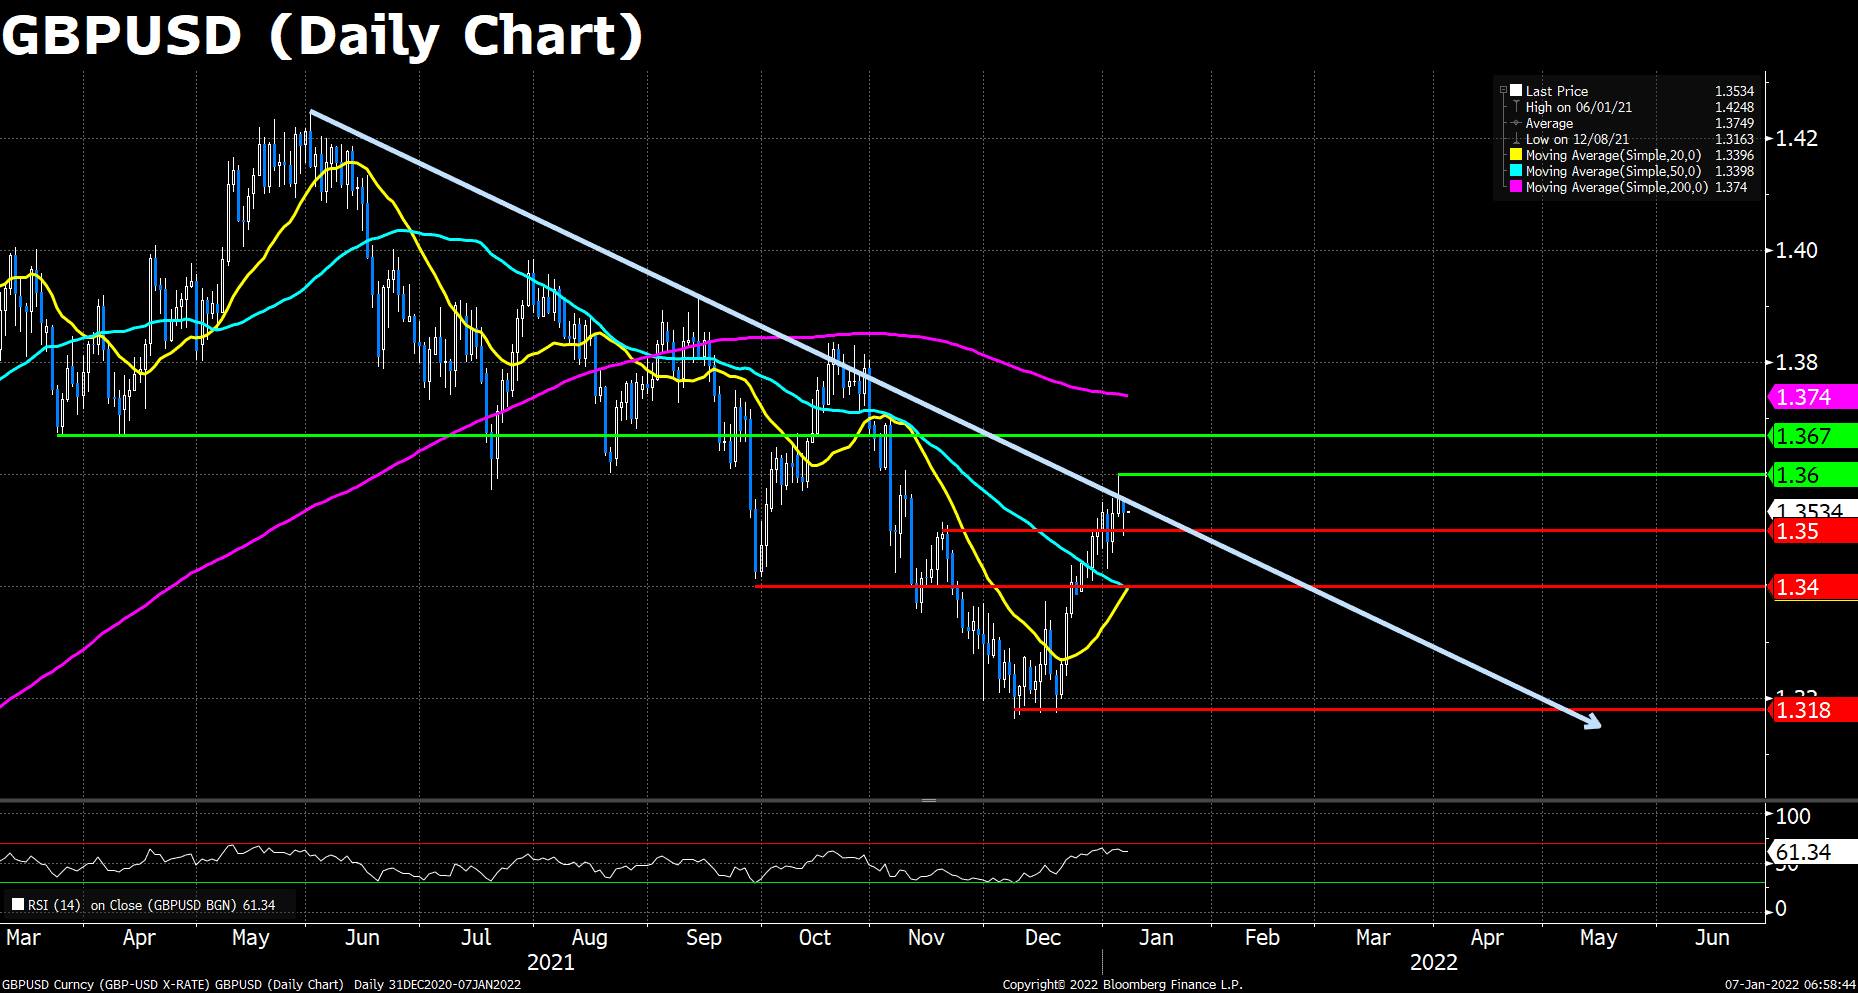
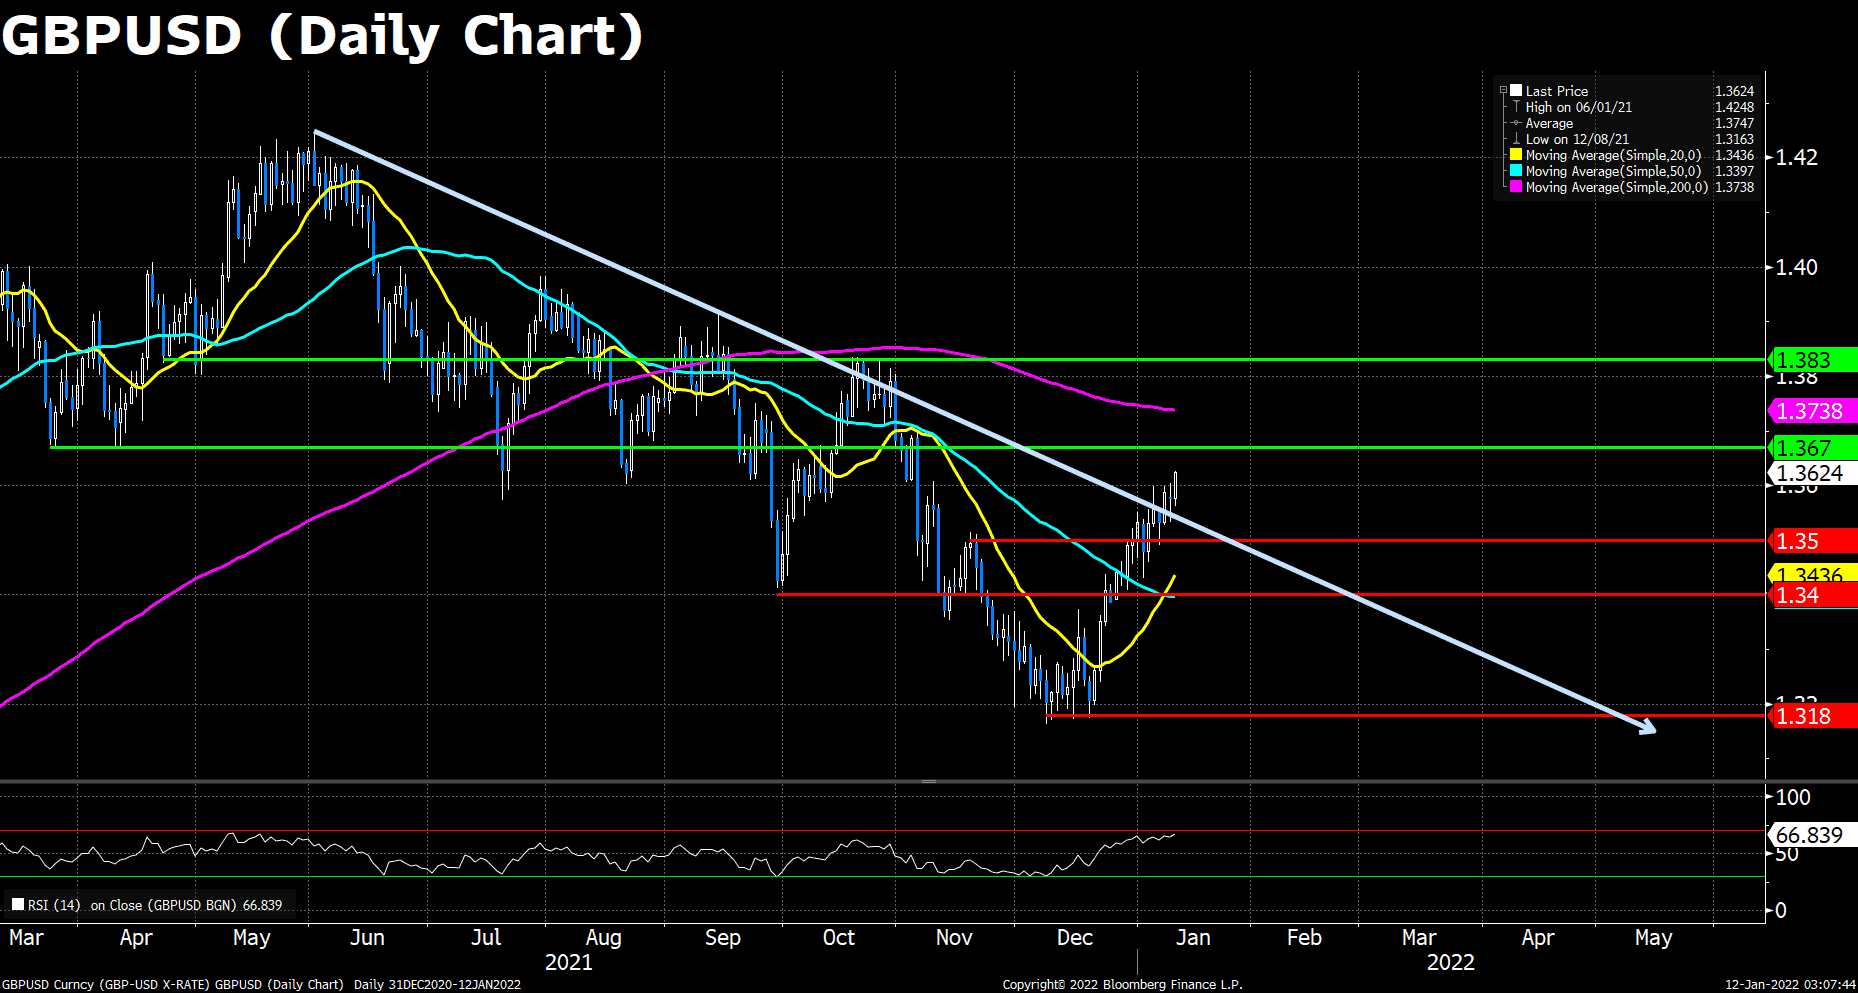
Cable gradually climbed up from Monday’s dip in the Asian and European trading hours amid the global equity markets’ rebound. The pair now trades at around 1.3620, firmly above the past strong 1.3600 resistance. Fed Chair Jerome Powell went to his nomination hearing earlier the day, and fortunately he didn’t mention any new tightening policies or plans during the testimony, which eases the appreciation pressure of the dollar, and thus benefits the non-US currencies, including GBP.

On the technical front, GBP/USD jumped further away the past downtrend line and over the critical 1.3600 level. The RSI indicator is around 67, and the price action is above its 20 and 50 DMA, suggesting a sturdy bullish traction pulling the pair to the north.

Resistance: 1.3670, 1.3830

Support: 1.3500, 1.3400, 1.3180
  

EURUSD (Daily Chart)

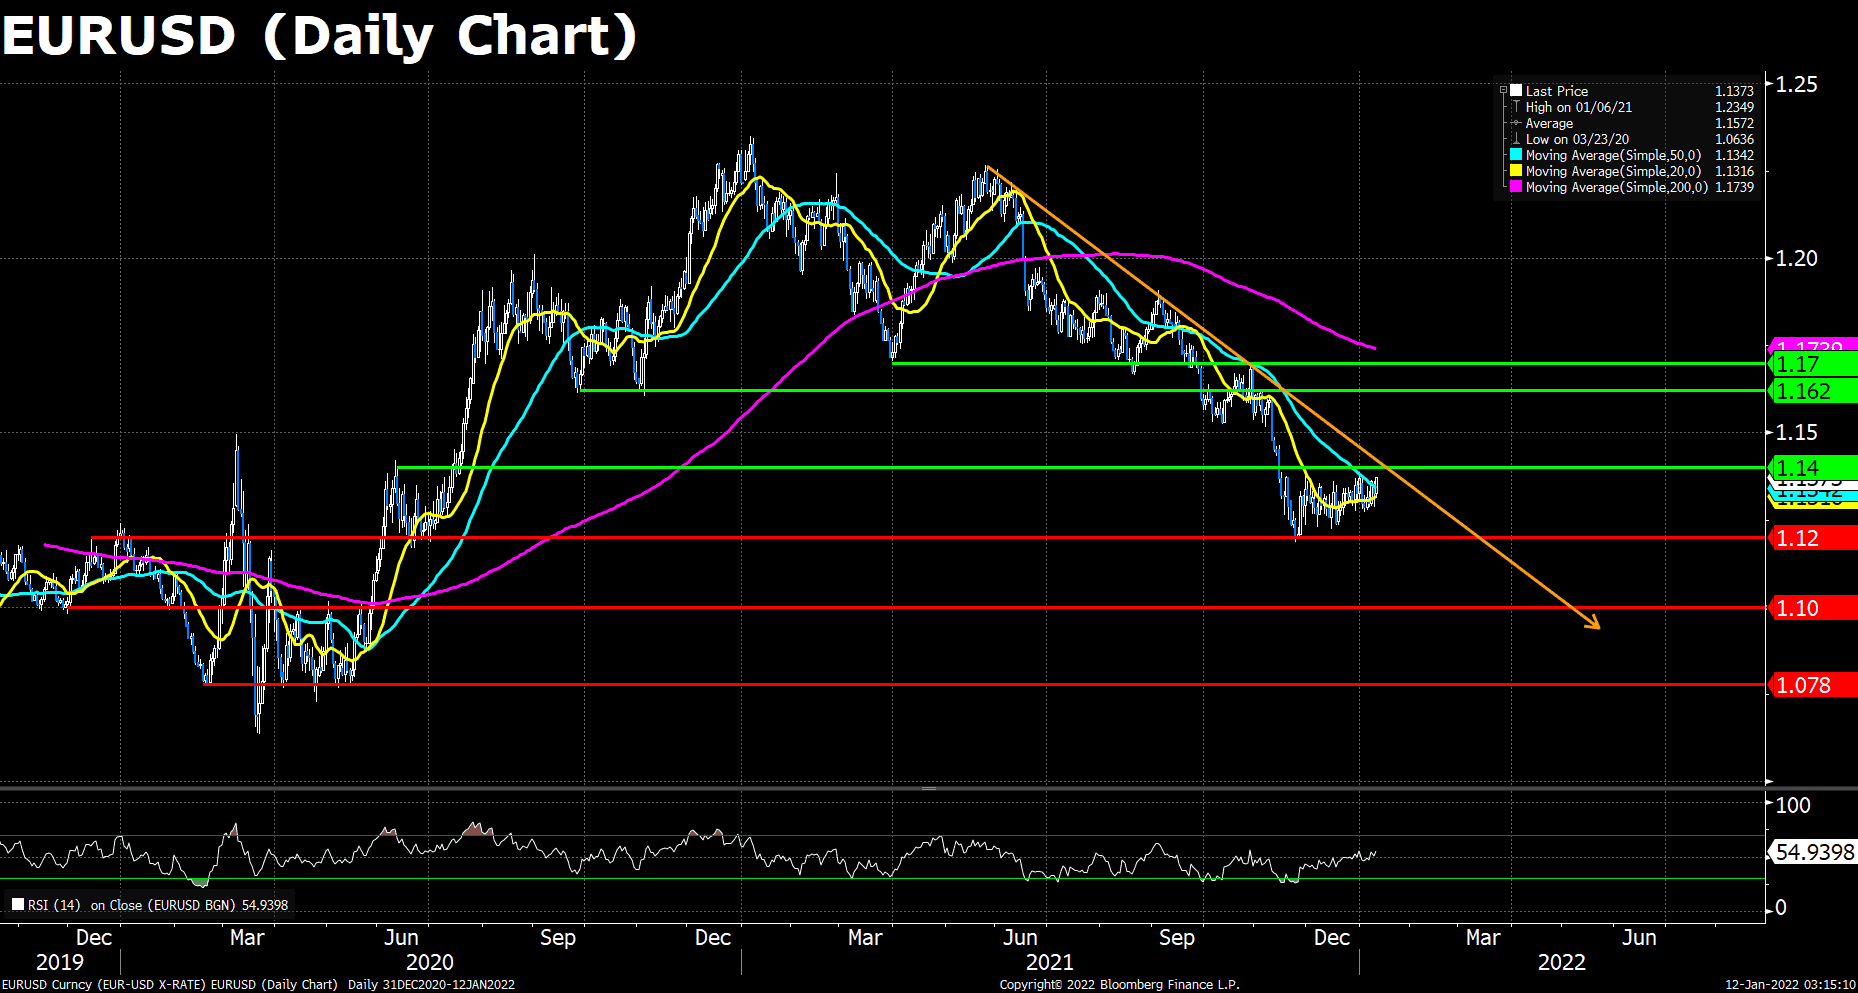
The shared currency price consolidated during the first half of the day, and surged after the Wall Street opening, especially during the Powell’s hearing, as no new policies or plans were announced, and Fed’s confidence toward the US economic outlook relieves the market’s worries about additional tightenings in the coming month. However, the dovish stance of the ECB keeps weighing on Euro. An ECB executive board member Isabel Schnabel said in her Saturday speech that only in circumstances that the current surging energy prices transmitted to other economic fields, or the green transition policies severely jacked up the energy prices, will ECB consider to take actions to ease the inflation.

On the technical, though the Euro pair advanced quite a bit (0.41%) during today’s tradings, it is still under its 200 DMA, and hasn’t cross over the critical 1.1400 resistance line. The RSI indicator remains around the average line, providing almost no instructions about the future route of the pair. As previously mentioned, the pair must stand firmly above the key 1.1400 resistance to claim a meaningful rebound. On the flip side, a slip below the 1.1200 support may indicate the resuming of the selling streak.

Resistance: 1.1400, 1.1620, 1.1700

Support: 1.1200, 1.1000, 1.0780
 

XAUUSD (Daily Chart)

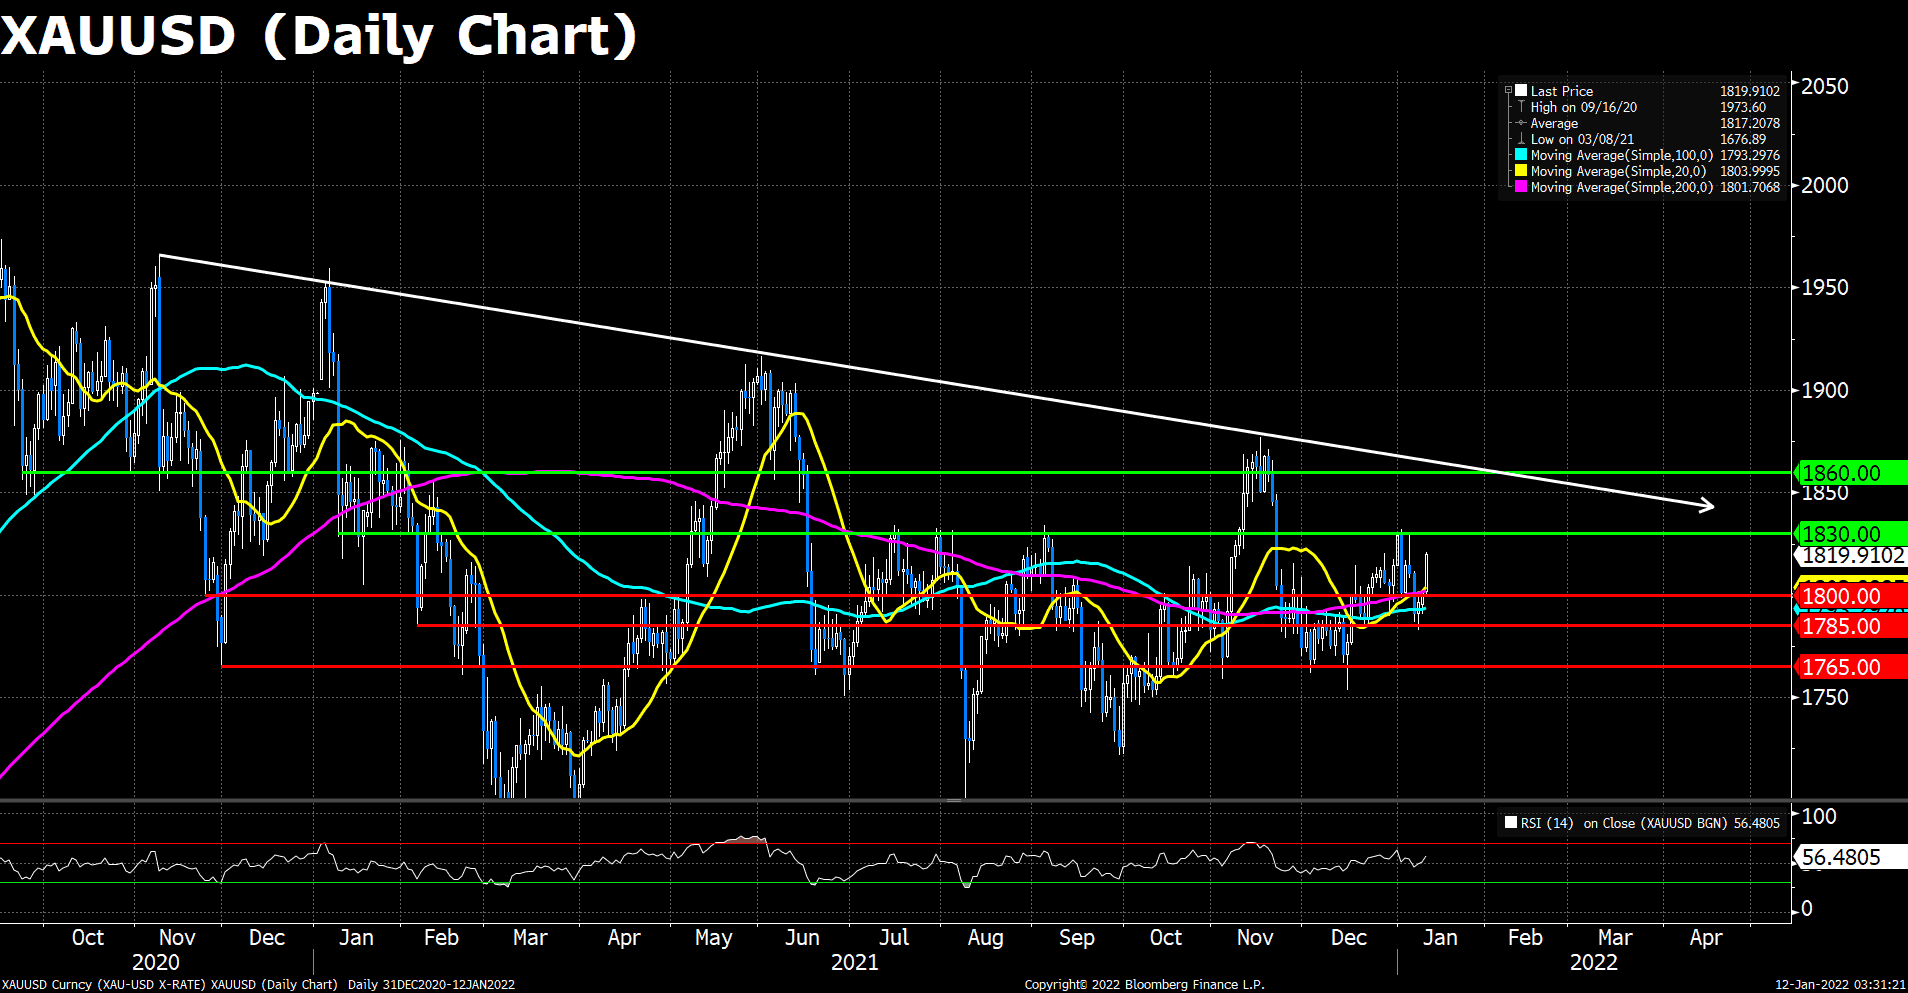
Gold went up in the third consecutive day amid the weakness of the dollar, as the Fed Chair Powell didn’t pull out new tightening policies during today’s testimony, which eases the public concerns about a potential fourth rate hike at the end of the year warned by Goldman Sach analysts. The yellow metal now trades at $1,818 per troy ounce, heading to the key $1,830 resistance where it got blocked for several times. The rally of the pair is expected to continue before the Fed takes further actions. That’s said, the current cautious market mood is in favor of the save-haven gold, but the looming rate hikes of the Fed acts as an obvious headwind limiting the upside of the pair.

As to technical, gold remains firmly above the $1,800 support during today’s trades. The recent dollar weakness as well as the cautious market mood help gold price to cross over all its major moving averages and open a short-term winning streak. The RSI for gold reads 56.21, suggesting a neutral-to-bullish sentiment in this spot. However, gold’s price action is still capped by the long term downtrend started in November 2020. A breach of that trend will need a breakthrough over the $1,860 resistance, which is almost impossible to achieve without significant catalyst. On the flip side, if the pair failed to cling on $1,800, a short-term support will appear at $1,785 and the next support level will be at $1,765 once it plummeted further.

Resistance: 1830, 1860

Support: 1800, 1785, 1765


Economic Data:

Currency

Data

Time (GMT + 8)

Forecast

USD

Core CPI (MoM) (Dec)

21:30

0.5%

USD

Crude Oil Inventories

23:30

-1.904 M

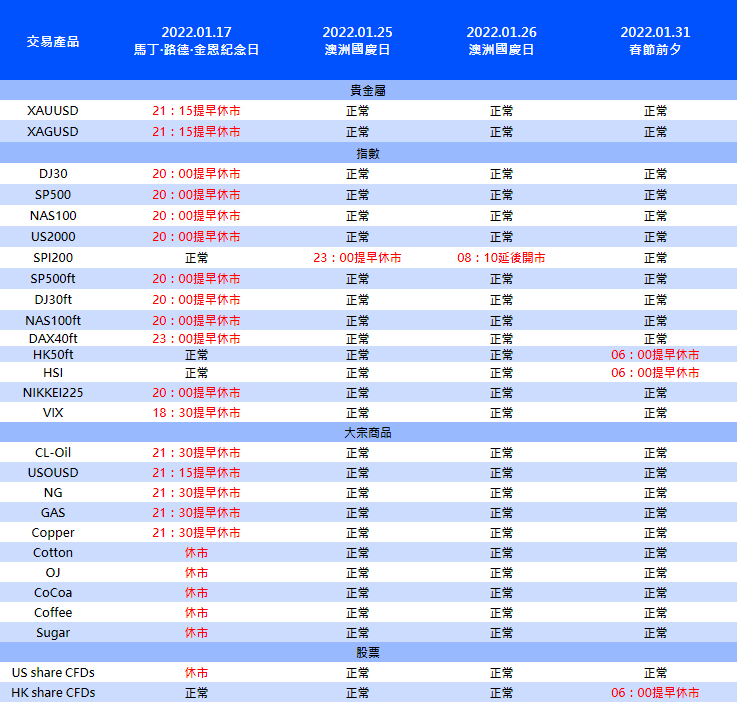
VT Markets Notification of trading adjustment in holiday

Dear Client,

Please note the adjustment on the following products due to international holiday in January:

The above time is MT4/5 server time. The trading time of other products is not affected. The above data may be subject to change. Please refer to the actual time on MT4/5.

If you have any questions, our team will be happy to answer your questions.
Please mail to [email protected] or contact the service online.

Market Focus

The broad U.S. equity market continued to suffer for the second week of 2022. The Dow Jones Industrial Average lost 0.45% to close at 36068.87, the S&P 500 lost 0.14% to close at 4670.29, while the Nasdaq gained 0.05% to close at 14942.83 and end a 5 day losing streak. The benchmark U.S. 10 year treasury yield remained little changed at 1.769% and the 30 year treasury yield sits at 2.1%.

一張含有 文字 的圖片

自動產生的描述

Federal Reserve chairman Jerome Powell is scheduled to speak on the Fed’s rate hike outlook later today, and the statement is expected to bring volatility to all markets. The health care sector gained the most yesterday, as new mutations of the COVID-19 virus was discovered in Cyprus. The newly discovered “Deltacron” present yet another hurdle to global economic and tourism recovery. Moderna enjoyed a 9.28% gain in share price as market participants reassess pandemic fears and vaccination expectations.


Main Pairs Movement:

The Dollar Index, which measures the Greenback against a basket of major foreign currencies, began recovery over the course of Monday’s trading. Federal Reserve chairman Jerome Powell statement tonight could, however, edge the Greenback even higher as market participants expects continued tightening by the Fed.

Cable retreated 0.07% over Monday’s trading. The stronger Dollar on Monday rejected any upward movement of the Sterling; furthermore, on the technical side, Cable faces strong resistance at the 1.36 price level.

The Euro-Dollar pair lost 0.32% over the course of Monday’s trading. The ECB’s president Lagarde is due for a statement later today.

The precious metal, Gold, found further upward momentum as pandemic fears reignite. Gold continued its two day winning streak and sees solid support near its current price.


Technical Analysis:

GBPUSD (Daily Chart)

GBP/USD consolidated at the start of the week in the Asian and early European session, even once bounced off the 1.3600 strong resistance. However, the pair plummeted at the Wall Street opening, as the fresh fears of the potential new Omicron lockdowns and early US tapering spread, damaging the US equity market and the risk-sensitive Sterling. Cable now trades at around 1.3560, waving back and forth within the 1.3500 and 1.3600 price range.

On the technical front, GBP/USD’s outlook still seems optimistic as the RSI reads 62.16 which is healthy, and the price action remains above the downward trendline. However, the strong 1.3600 threshold is still present. Cable has to stand firmly above it to prove its thorough comeback.

Resistance: 1.3600, 1.3670

Support: 1.3500, 1.3400, 1.3180


EURUSD (Daily Chart)

Euro price took a roller-coaster ride during Monday’s trading as the EUR/USD pair declined around 70 pips from the start of the day, but then regained over half of the losses after the US equity market opening, as the major indices dropped sharply due to the Omicron fears and rate hike worries. The pair now settles around the 1.1325 level, and investors are all eye on Tuesday’s ECB Chair Lagarde’s speech to see if Europe will catch up on UK and US’s pace to further cuts its pandemic bond buying plans.

On the technical, the Euro pair managed to cling on its 20 DMA at the moment, eyeing the next resistance at its 50 DMA, and then 1.14. The RSI indicator remains around the average line, showing no directions amid a light trading day. As previously mentioned, the pair must breached the key 1.1400 resistance to claim a meaningful rebound. On the flip side, a slip below the 1.1200 support may indicate a resume of the selling streak.

Resistance: 1.1400, 1.1620, 1.1700

Support: 1.1200, 1.1000, 1.0780


XAUUSD (Daily Chart)

Proceeding its Friday’s rally, gold again stepped on the 1800 threshold during the panicking selloff at the start of Monday’s US equity tradings. The pair now trades at $1,801 per troy ounce, advanced a mild 0.2% than its open price. The upside traction of the yellow metal is expected to last in the short term, as the fresh Omicron fears and the unstable stock markets will flock the investors back to the safe assets.

As to technical, gold finally made itself to the $1,800 thanks to yet another day of US market plummet. The fresh risk-off mood further pushes gold toward the next resistance at the 200 DMA, which it failed to breach latter the day as the market mood improved in the second half of the trading period. The RSI for gold remains lingering around the average line, suggesting a lack of direction in this spot. Generally speaking, a firm daily close above the $1,800 resistance, better above the critical 200 DMA, would suggest more gains ahead for the XAU/USD pair. Conversely, if the pair failed to cling on $1,800, a short-term support will appear at $1,785 and the next support level will be at $1,765 once it plummeted further.

Resistance: 1830, 1860

Support: 1785, 1765, 1720


Economic Data:

Currency

Data

Time (GMT + 8)

Forecast

AUD

Building Approvals (MoM) (Nov)

08:30

-0.5%

EUR

Unemployment Rate (Nov)

18:00

7.2%

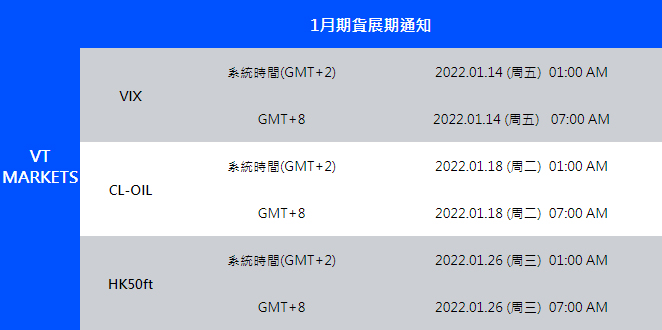
VT Markets Jan futures rollover announcement

Dear Client,

New contracts will automatically rolled-over as follows:

Please note:

• The rollover will be automatic, and any existing open positions will remain open.

• Positions that are open on the expiration date will be adjusted via a rollover charge or credit to reflect the price difference between the expiring and new contracts.

• To avoid CFD rollovers, clients can choose to close any open CFD positions prior to the expiration date.

• Clients should ensure that take profits and stop losses are adjusted before this rollover occurs.

If you’d like more information, please don’t hesitate to contact [email protected].

Market Focus

The S&P 500 index closed almost unchanged on Thursday as technology stocks fell, but financial and energy stocks provided support a day after the market sold off due to the hawkish tendencies in the Fed’s meeting minutes.  On the economic front, data shows that ISM Non-Manufacturing PMI has weakened more than expected, and the Initial Jobless Claims unexpectedly rose to 207K. At the end of the market, the Dow Jones Industrial Average slipped 0.47% to 36,236.48 points, the S&P 500 index lost  0.1% to 4,696.04 and the Nasdaq Composite Index fell 0.04%.

一張含有 文字 的圖片

自動產生的描述

The S&P 500 financial stock index rose 1.6%, continuing the strong gains this week, and energy rose 2.3%, more than 9% since December 31. Energy sector was pushed higher by rising U.S. oil prices, however, since the omicron variant threatened demand when the supply increased in the first quarter, some people believed that headwinds were about to occur. With the 10-year Treasury bond yield approaching a 52-week high, the Fed is expected to tighten its policy sooner, and financial stocks, mainly bank stocks, are in an upward mode, supported by the rising U.S. Treasury bond yields. Signature Bank, SVB Financial and People’s United Financial were among the top gainers, rising 6.29%, 7.53% and 3.98% respectively.


Main Pairs Movement:

Despite the disappointing US data, the US dollar maintained most of its gains after the FOMC meeting minutes. The stock market maintains a weak tone, while U.S. Treasury yields are still close to the multi-month high set on Wednesday. In the end, the 10-year Treasury bond yield continued to rise, closing at 1.725%. Due to the strong yield trend, the US dollar index also remained a winner and hovered around the 96.24 level.

The focus on Friday will be the Nonfarm Payrolls report. Following the addition of 210K jobs in November, the country is expected to add 400K jobs. The unemployment rate is expected to be 4.1%, lower than the previous 4.2%, but the underemployment rate is expected to rise, from 7.8% to 8%.

The EUR/USD continued to fluctuate at a low level and closed at around 1.1290, while the GBP/USD trend slowed down, trading at around 1.3528.

AUD/USD slipped lowered and fell 0.83%, finally hovering in the 0.7160 area. On the other hand, the Canadian dollar appreciated against the U.S. dollar, and the USD/CAD traded in the 1.2720 area, as crude oil prices soared to a new high in several months. The highest price of WTI crude oil was $80.22 per barrel, and the Brent oil was$82.81 per barrel.


Technical Analysis:

GBPUSD (Daily Chart)

Cable remains on the back foot on Thursday’s Wall Street tradings despite a weaker than expected US December ISM Services PMI survey. The pair failed to regain 1.3550 mark earlier, trading lower by around 30 pips to Thursday’s open, and 75 pips to the 1.3600 key resistance. It is surprising that the greenback hasn’t strengthened more in wake of the latest Fed minutes, where the unexpected rate hike acceleration disclosed.

On the technical front, Cable consolidates between the two key points 1.3500 and 1.3600. A breach to either side should indicate the market sentiment of GBP/USD being positive or the opposite, and we expected the current tug of war between the bulls and the bears will end after the important US NFP released on Friday. The price action is now above its 20 and 50 DMA. The RSI for Cable reads 61.33, still in a healthy bullish range that underpins the sterling’s price.

Resistance: 1.3600, 1.3670

Support: 1.3500, 1.3400, 1.3180


EURUSD (Daily Chart)

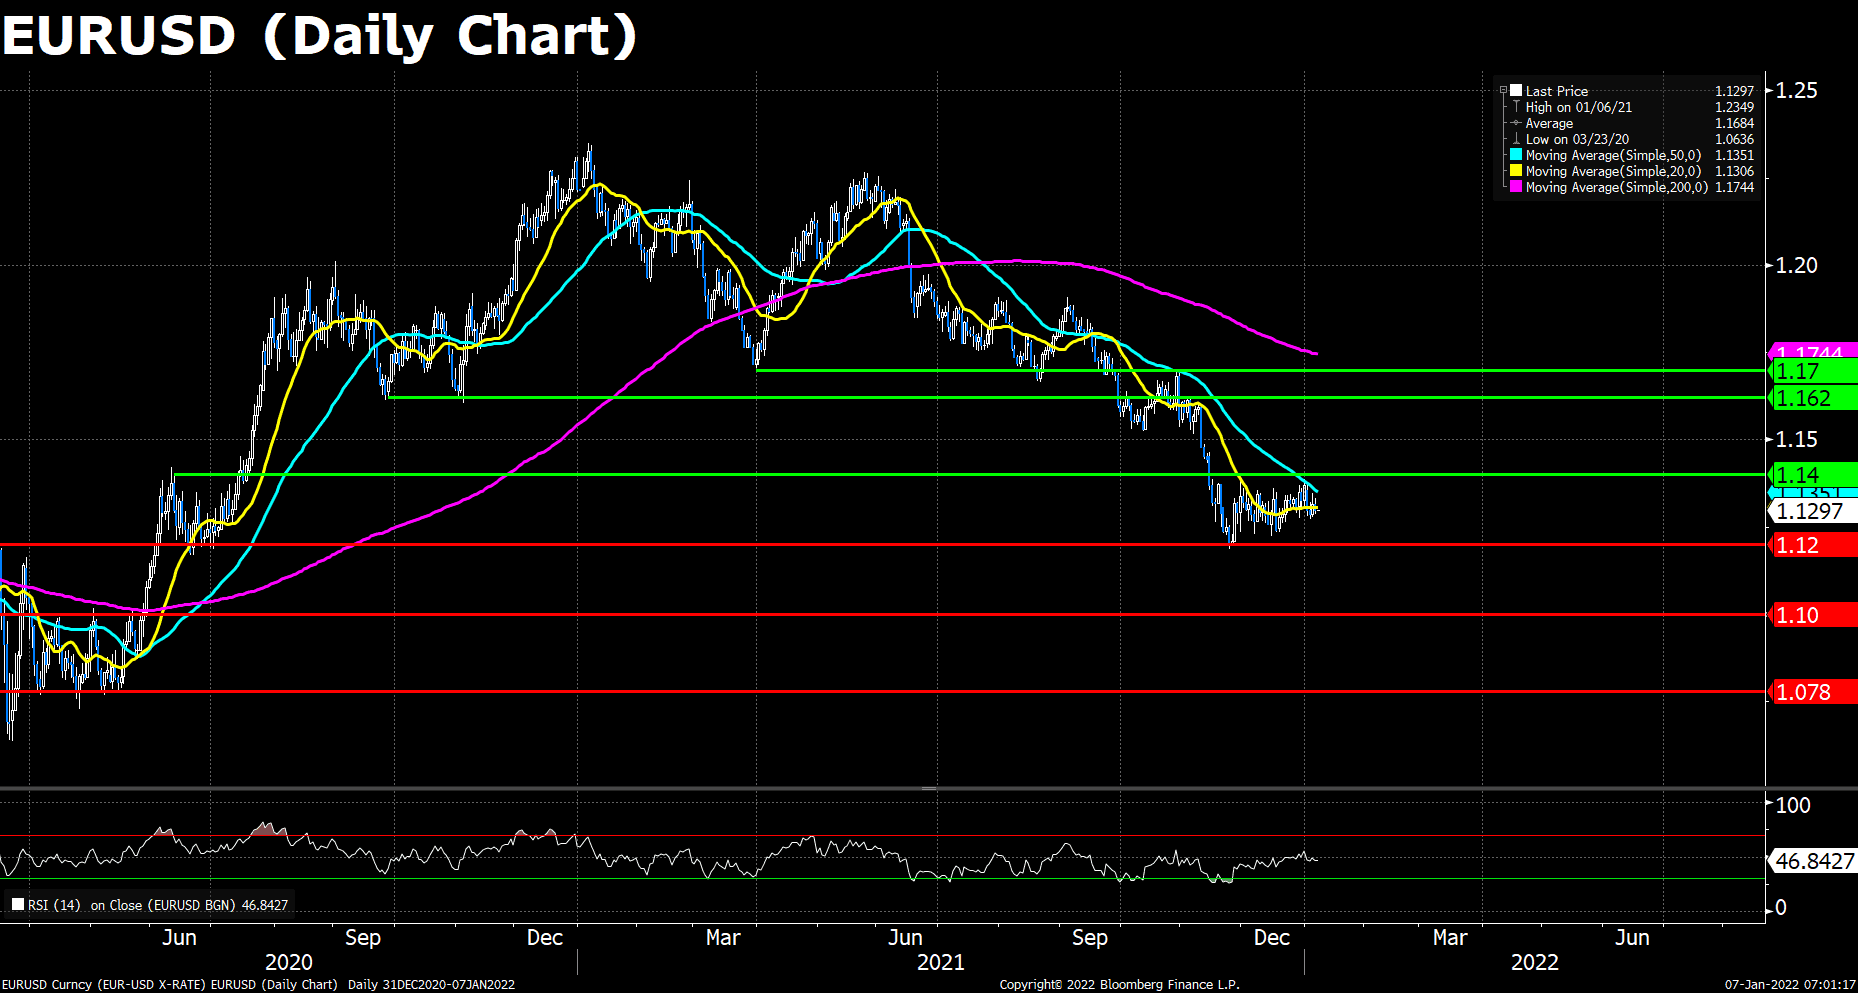
The Euro pair seesaws around the 1.1300 level throughout the day, failing to advance amid dismal US ISM figures. The pair now trades at 1.1297 as of writing but is expected to dip further, as the Fed’s moving up their tightening timetable, compared to the ECB’s dovish stance on their monetary policies, makes investors worry about the widening rate gap between the two currencies. Looking forward, the US NFP and the Retail Sales data of both the EU and the US are on the way to release.

On the technical, the Euro pair has retreated down below its 20 DMA, not to mention the 50 and 200 DMAs. The RSI indicator remains slightly below the average line, showing a neutral-to-bearish market sentiment. As previously mentioned, the pair must breached the key 1.1400 resistance to prove a convincing comeback. On the flip side, a slide below the 1.1200 support may indicate a continuation of the bearish trendline.

Resistance: 1.1400, 1.1620, 1.1700

Support: 1.1200, 1.1000, 1.0780


XAUUSD (Daily Chart)

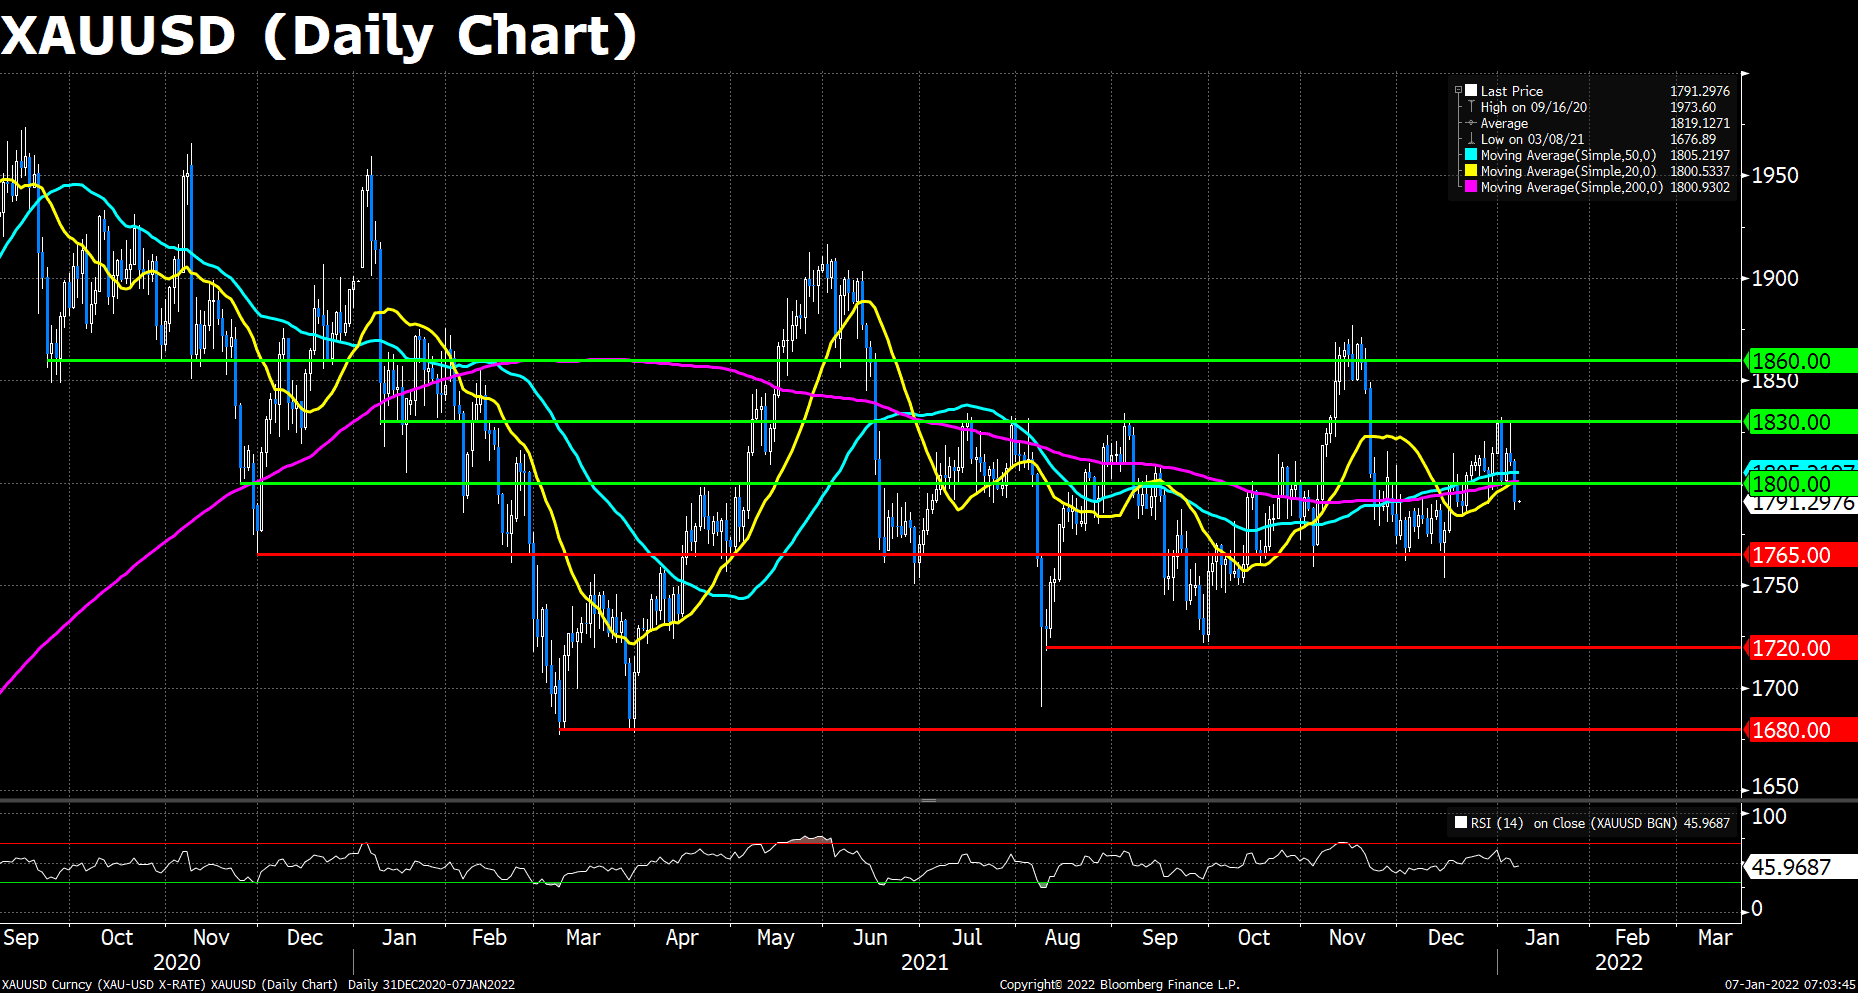
Spot gold price has tumbled from Asia Pacific session levels in the $1810 area to current levels (and session lows) around $1790, with on-the-day losses currently standing at just over 1%. A late-Asian afternoon rebound that saw spot prices climb from the mid-$1790s to near the $1810 level again ultimately proved nothing more than an intra-day dead-cat bounce and a good opportunity for gold bears to add to short positions. Selling pressure in gold markets derived from the rallying US yields, which was boosted by the hawkish talks in the FOMC meetings on Wednesday.

As to technical, the pair has fallen below all its moving averages during today’s tradings, while the RSI for gold is hovering slightly below the average line. The fresh bearish sentiments amid the hiking US yields may pressure the gold price to go further south. The previous $1800 defence was lost, eyeing to the next support level at $1,765. On the flip side, a bounce back above $1,800 before the end of the day would suggest more gains ahead for the yellow metal.

Resistance: 1800, 1830, 1860

Support: 1765, 1720, 1680


Economic Data:

Currency

Data

Time (GMT + 8)

Forecast

GBP

Construction PMI (Dec)

17:30

54.0

EUR

CPI (YoY) (Dec)

18:00

4.7%

USD

Nonfarm Payrolls (Dec)

21:30

400K

USD

Unemployment Rate (Dec)

21:30

4.1%

CAD

Employment Change (Dec)

21:30

27.5K

CAD

Ivey PMI (Dec)

23:00

VT Markets Notification of Server Upgrade

Dear Client,

As part of our commitment to provide the best reliability and service to our client, we are planning an upgrade to our server on January 8th, 2022.

As a result, we will be conduct maintenance according to the schedule below.
Start date and time: 2022-01-08 02:00 GMT+2(Server time)
End date and time: 2022-01-08 17:00 GMT+2(Server time)

Kindly be reminded that the following things might be affected during this maintenance period:

1. The login and operation of the client portal

2. The login of the trading account

3. The quotations of products will be paused. Clients might not be able to open new positions or close the held positions.

4. There might be a gap between the original price and the price after maintenance. Pending orders, Stop Loss, and Take Profit settings within the gap will be filled at the market price after maintenance ends.

After the upgrade, clients can login to trading account using the server which is shown in the account activation mail.

No action is required by our client. Your service will be back online after the maintenance is completed.

Thank you for your patience and understanding with regard to this important initiative.

If you’d like more information, please don’t hesitate to contact [email protected].

VT Markets The Adjustment Of Weekly Dividend Notification

Dear Client,

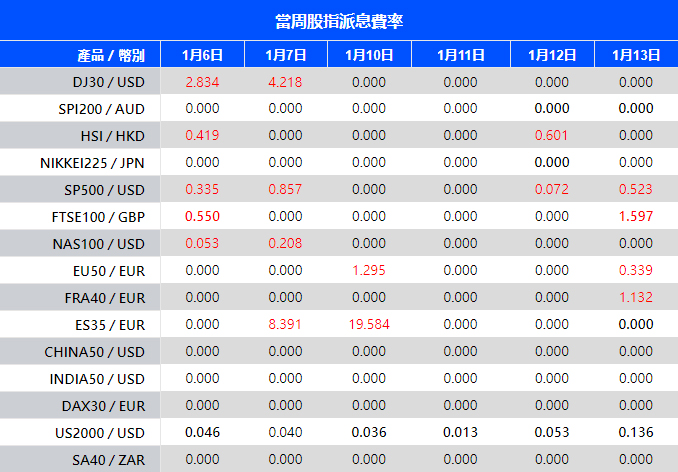
Warmly reminds you that the component stocks in the stock index spot generate dividends. When dividends are distributed, VT Markets will make dividends and deductions for the clients who hold the trading products after the close of the day before the ex-dividend date.

Indices dividends will not be paid/charged as an inclusion along with the swap component. It will be executed separately through a balance statement directly to your trading account, the comment for which will be in the following format “Div & Product Name & Net Volume ” .

Please note the specific adjustments as follows:

Note: The above data is for reference only, the actual execution data may be changed, please refer to the MT4/MT5 software for details.

If you’d like more information, please don’t hesitate to contact [email protected].

Market Focus

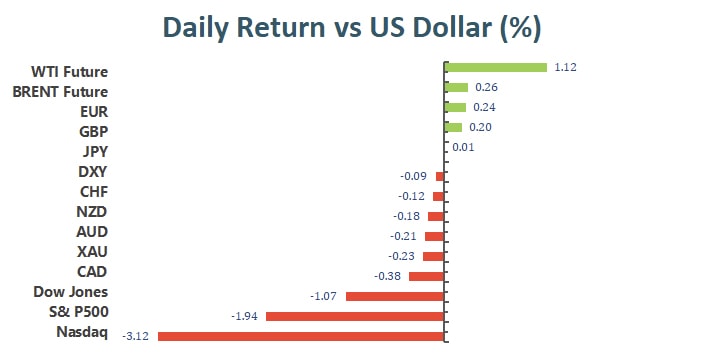
The U.S. stocks market faced gloom on Wednesday. The Nasdaq Index plummeted by more than 3%, marking the biggest one-day percentage drop since February. Earlier minutes of the Federal Reserve meeting suggested that the central bank may raise interest rates sooner than expected. After the meeting minutes were released, the three major stock indexes quickly expanded their declines. Investors think the minutes of the meeting are more hawkish than they feared. The Dow Jones Index, which set a record high earlier in the day, reversed the trend and closed down more than 1%. At the end of the market, the Dow Jones Industrial Average fell 1.07 to 36,407.11 points, the S&P 500 index lost  1.94% to 4,700.58 and the Nasdaq Composite Index plummeted 3.34%.

一張含有 文字 的圖片

自動產生的描述

All S&P 500 sectors closed down, while the Cboe Volatility index closed at its highest level since December 21. Undoubtedly, concerns about rising interest rates severely hit the technology sector and the real estate sector. The technology sector fell 3.13%, which was the biggest drag on the benchmark index, while the interest rate-sensitive real estate sector fell 3.2%, the biggest one-day percentage drop since January 4, 2021. In the terms of the tech stocks, AAPL droped 2.66%, TSLA fell 5.35%, and Nvidia dwon 5.76%.


Main Pairs Movement:

The dollar fell on Wednesday but recovered its lost ground after the FOMC meeting, the meeting showed that the Fed may need to act more quickly to raise interest rates to combat inflation. In addition, the statement caused losses in all major indexes, and the 10-year yield has reached the important threshold of 1.70%. As the yield rose, the U.S. dollar index surged 0.22% in the last hour to closed at 96.171.

The pound almost touched the 1.3600 level and maintained a strong upward trend.

However, as the U.S. dollar soared eroded the pound’s gains and closed at 1.35520.

The euro continued to fall against the US dollar, and the currency pair remained slightly fluctuating between 1.12690 and 1.13829.

The price of gold peaked at 1,829.70 and began to fall before the Fed meeting. It closed at $1810.14 per ounce after the meeting, which means it almost lost a whole day of gains. Crude oil maintained a moderate increase, but also lost after the meeting and closed at $77.17 per barrel.


Technical Analysis:

GBPUSD (Daily Chart)

Cable gained another 70 pips during the New York session but snapped nearly half of its gains after the Fed’s hawkish talks during the latest FOMC meetings. The pair now trades at 1.3592 at the time of writing. The market sentiment turned soar, with US equities plummeted. Investors are all eye on Friday’s US Nonfarm Payroll for further catalyst.

On the technical front, Cable lingers around the top of the June downslope trendline. The 1.3600 resistance is close at hand, and a solid breakthrough of that level could be a good indication that a recovery is on the way, as the nearest resistance after that is 230 pips above. The price action is now above its 20 and 50 DMA, still far from the key 200 DMA. The RSI for Cable is 63.70, still plenty of rooms ahead of the overbought territory.

Resistance: 1.3600, 1.3670

Support: 1.3500, 1.3400, 1.3180


EURUSD (Daily Chart)

The Euro pair managed to cling on the 1.1300 level despite a broader strength of the greenback, trading at 1.1310 as of writing. However, the rally of the shared currency seems somewhat temporary, as the ECB’s dovish stance on the monetary policies makes investors worry about the widening rate gap between EU and the other main currencies. Looking ahead, the investors are waiting for further catalyst, including the upcoming FOMC minutes, as well as Friday’s US NFP and the Retail Sales data of both the EU and the US.

On the technical, the pair has just climbed above its 20 DMA. The RSI indicator remains slightly below the average line, showing the market sentiments are not pretty well. Amid the mixed technical indications, the pair must breached 1.1400 resistance to prove a convincing comeback. On the flip side, losing the 1.1200 support may be the last straw for the pair to continue its downward sliding.

Resistance: 1.1400, 1.1620, 1.1700

Support: 1.1200, 1.1000, 1.0780


XAUUSD (Daily Chart)

XAU/USD advances during the first half of the North American session, but slid sharply to $1813.8 after the hawkish FOMC statements. Gold’s short term decline may extend to Friday, when the US NFP provides further instructions.

As to technical , though the pair still above all its moving averages, the fresh selling pressure amid strengthened US dollar may push the gold price to dip further. If the retreat of the pair continues, a strong support will appear at $1800, which once breach should increase the bearish pressure, targeting $1,790. On the flip side, a bounce to the upside will lead the price action to $1,830. A close clearly above $1,830 would suggest more gains ahead for the yellow metal.

Resistance: 1830, 1860, 1900

Support: 1800, 1765, 1725


Economic Data:

Currency

Data

Time (GMT + 8)

Forecast

GBP

Composite PMI (Dec)

17:30

53.2

GBP

Services PMI (Dec)

17:30

53.2

USD

Initial Jobless Claims

21:30

197K

USD

ISM Non-Manufacturing PMI (Dec)

23:00

66.9

Market Focus

The broad U.S. equity market kicked off 2022 with modest gains. The Dow Jones Industrial Average closed 0.68% higher to close at 36585.06, the S&P 500 gained 0.64% to c;pse at 4796.56, and the Nasdaq composite advanced 1.2% to close at 15832.8. TSLA and many Chinese EV companies enjoyed strong gains as EV delivery figures pleasantly surprised market participants; while vaccine shares, such as MRNA (Moderna) and other bio-tech firms suffered as market participants reassess COVID threats.

一張含有 文字 的圖片

自動產生的描述

The Federal reserve is expected to enact its first rate increase in roughly two months. The sudden increase in the U.S. 10 year treasury yield over yesterday’s trading showed early signs of how markets could move once the world enters Fed’s rate increase environment. As of writing, the U.S. 10 year treasury yield sits at 1.623%. Among commodities, Gold suffered the most as it dropped more than 1% against the Greenback.


Main Pairs Movement:

Strong U.S. equity markets performance, combined with large yield increases, strengthened the Greenback against other major currency pairs. The Dollar Index advanced more than 0.5% over the course of yesterday’s trading.

Cable lost more than 0.4% over the course of yesterday’s trading as the Dollar gained demand. RSI for Cable remains strong at 59. Further bearing sentiment surround the pair, however, as the Dollar continues to rise against other currencies.

The Euro suffered against the Dollar as well. With the ECB’s unwillingness to increase interest rates to control inflation, the Dollar shall continue to gain against the Euro as the Fed begin to increase interest rates towards the end of Q1.

Gold dropped more than 1% over the course of yesterday’s trading. The flash drop caught investors off guard overall market sentiment remains somewhat risk off. As of writing, Gold has gained back some lost ground, but the precious metal has resumed trading around the 1800 region.


Technical Analysis:

GBPUSD (Daily Chart)

Cable surprisingly plummeted at the first trading day of the year as the greenback soared amid a sudden rise of the US Treasury yields. The GBP/USD pair failed to hold above 1.3500 and tumbled, reaching 1.3430, the lowest level since last Wednesday. Cable remains near the daily low, under pressure of a stronger US dollar across the board.

On the technical front, Cable has clearly broken the key 1.3500 level and probably opened another downtrend if it doesn’t bounce back at the end of the day. The RSI indicator slipped sharply from near the overbought level to approaching the average line, showing that a strong selling power is oppressing the pair’s recovery attempts; however, the price action remains above the 20 and 50 DMA, added that the key 1.3400 has proven robust in the previous tests, there are still chances that the Cable’s overall rebound will continue.

Resistance: 1.3500, 1.3570, 1.3670

Support: 1.3400, 1.3180


EURUSD (Daily Chart)

Like Cable, the EUR/USD pair experienced a flash drop amid the first half of the American session, but unlike its British peer, the shared currency didn’t regain its lost ground in the short run. Even worse, EUR/USD continues to fall as the inflation fears are more worrisome on the mainland amid ECB’s dovish stance toward its monetary policies.

On the technical, the price action of the pair retreated back below all of its major moving averages. The RSI indicator also fell under the average line, indicating a bearish sentiment weighing on. The next support level lies at 1.2000, still 86 pips ahead. On the flip side, the pair must breached 1.1400 resistance to prove a convincing comeback.

Resistance: 1.1400, 1.1620, 1.1700

Support: 1.1200, 1.1000, 1.0780


XAUUSD (Daily Chart)

Gold plummeted at the start of the year as the revived risk-on sentiment shown in Monday’s equity tradings. The price of the yellow metal plunged over $20 ahead of the Wall Street opening and soon slid another $10 as the US Treasury yields continued to rise. At the moment, XAU/USD settles around the key level $1800, losing most of the gains from the previous days and waiting for further catalyst.

As to technical , gold seems to lose directions as it went back to $1800, where most its moving averages lie and away from either its resistances or supports. The RSI indicator went back to the average line, showing the lack of momentum in the price action. Looking forward, the looming rate hike has been a huge headwind weighing on Gold, the yellow metal will have to breach the long-term downtrend to prove a upward traction is still available.

Resistance: 1830, 1860, 1900

Support: 1765, 1725, 1680


Economic Data:

Currency

Data

Time (GMT + 8)

Forecast

USD

ADP Nonfarm Employment Change (Dec)

21:15

400K

USD

Crude Oil Inventories

23:30

-3.400M

Market Focus

The broad U.S. equity markets closed lower on the last trading day of 2021. The Dow Jones Industrial Average dropped 0.16%, the S&P 500 lost 0..26%, while the Nasdaq lost 0.61%; despite losing ground on the last trading day, all three major indices ended the year with tremendous gains since the beginning of 2021—18.73%, 26.89%, and 21.39%, respectively.

一張含有 文字 的圖片

自動產生的描述

It remains to be seen if equity markets will perform as well as 2021 in 2022. Several challenges are already present. The planned rate hikes by the Federal Reserve will present tremendous pressure on the technology sector, while supply chain issues remain largely unsolved. On the bright side, multiple sources are projecting that COVID-19 will finally end in 2022 as the virus enters its final stage of mutation and begin to exhibit symptoms that are less life threatening and more in line with the flu.


Main Pairs Movement:

On Friday, the Greenback lost steam as U.S. equity markets retreated. The Dollar Index dropped 0.34%, against a basket of major currencies. As 2022 marks its arrival, so do rate hikes. The Federal Reserves’ plan of raising the Federal Funds Rate 3 times over the course of 2022 should see the Greenback more desirable over other major currencies.

Cable experienced strong growth heading into 2022. The pair gained for the entire last week of 2021, and closed the year losing 1.08%. Falling U.S. treasury yields assisted the Sterling in gaining ground over the last month of 2021.

The Eurodollar closed the year losing 0.03%. The ECB’s dovish attitude and its unwillingness to increase interest rates will present Euro with tremendous challenges as we head into a rate increase environment.

Gold ended the last month of 2021 with a 3.08% gain as market participants fear over the increased spread of the Omicron variant. 2022 could potentially mark the end to the pandemic and bring plentiful price action for the previous metal.


Technical Analysis:

GBPUSD (Daily Chart)

GBPUSD now trades firmly above the previous resistance level 1.3500 where it struggles to cling on with several attempts. However, the greenback seems to regain some demands at the last hours of the year as the Omicron fears bring investors back to embrace the safe haven, and the looming Brexit import controls add more pressure onto the sterling.

On the technical front, we could see the 1.3500 resistance/support has been the turning point for Cable for many times, and this time is no exception. The RSI indicator is approaching the overbought level, suggesting a correction might happen in some near futures; however, the price action is back to above the 20 and 50 DMA, encouraging the bulls to keep pushing the pair north. The consolidation of the pair is expected to end at the start of the new year as the major investors come back from their holiday.

Resistance: 1.3570, 1.3670

Support: 1.3400, 1.3180


EURUSD (Daily Chart)

EURUSD regains some of its losses from Thursday but remains liveless throughout the day amid a lack of major data or events and mixed catalysts as traders brace for 2022. Major Asia-Pacific markets are off while some in Europe will also cheer New Year’s Eve, contributing to the inactive day. That said, the recent consolidation in EURUSD could be linked to the US dollar’s mixed performance and an absence of major bond traders.

As to the technical indicators, both RSI and MACD of EURUSD seem in a healthy spot right now. The price action remains above the 20-DMA, suggesting a relatively optimistic outlook in the short term.

Resistance: 1.1400, 1.1620, 1.1700

Support: 1.1200, 1.1000, 1.0780


XAUUSD (Daily Chart)

Gold is set to end the year on a good note as it rises over 0.80% amid the two-day trading session. After the release of U.S. initial job claims figures on Thursday, gold initially dropped but quickly gained ground as investors’ fear over Omicron resurfaced. Risk off sentiment also spilled over into equity markets as the Dow Jones snapped its 6th straight winning session on Thursday and keeps falling amid Friday’s Wall Street trading.

On the technical side, gold seems to have broken out of the downward trend it displayed recently, but it remains to be seen if the yellow metal would be able to return to previous highs. RSI for the pair has risen to 62.11 as of writing. Gold is trading above its 20, 50, and 200 DMA.

Resistance: 1830, 1860, 1900

Support: 1765, 1725, 1680


Economic Data:

Currency

Data

Time (GMT + 8)

Forecast

EUR

German Manufacturing PMI (Dec)

16:55

57.9

USD

ISM Manufacturing PMI (Dec)

23:00

60.2

Back To Top
server

Hello there 👋

How can I help you?

Chat with our team instantly

Live Chat

Start a live conversation through...

  • Telegram
    hold On hold
  • Coming Soon...

Hello there 👋

How can I help you?

telegram

Scan the QR code with your smartphone to start a chat with us, or click here.

Don’t have the Telegram App or Desktop installed? Use Web Telegram instead.

QR code