Market Focus

Wall Street’s major indexes continued their sharp losses on Thursday, especially evaporating late in the session as investors considered whether stocks were cheap after a sell-off at the start of the year and the Nasdaq slipped into correction territory. In addition, the S&P 500’s plummet was largely driven by a slump in consumer discretionary stocks and renewed weakness after tech stocks failed to hold onto their intraday gains for the second day in a row. At the end of the market, the Dow Jones Industrial Average fell 0.89% to 34,715.39 points, the S&P 500 index lost 1.10% to 4,482.73 and the Nasdaq Composite Index dropped 1.3% to 14,154.02 points

一張含有 文字 的圖片

自動產生的描述

10 of the 11 major sectors in the S&P 500 ended lower, with the consumer discretionary sector down 1.9%, followed by the materials sector, down 1.43%, and the lone winner was utilities, which edged up 0.1%. Consumer discretionary stocks were led lower by Amazon, Garmin and VF Corporation, which lost 1.30%, 6.05% and 5.73%, respectively. On the other hand, the Dow’s worst intraday performances were Dow Inc. down 3.39%, Intel Corp down 2.95% and Home Depot down 2.81%.
 

Main Pairs Movement:

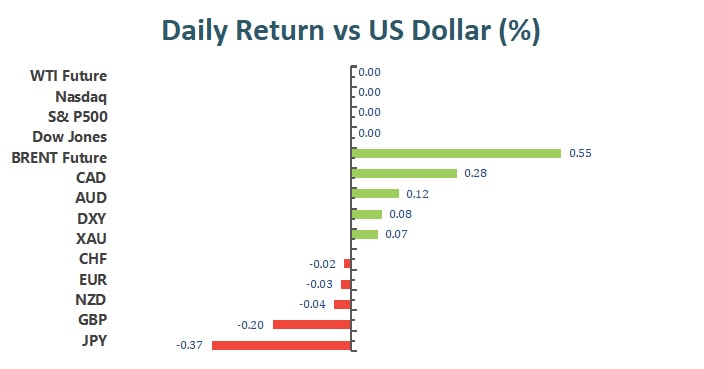
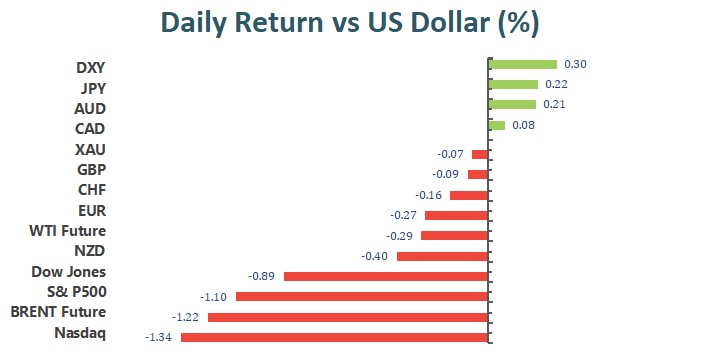
Disappointing U.S. jobs-related data weakened the dollar in U.S. session, with initial jobless claims unexpectedly jumping to 286K for the week ended Jan. 7, the highest level since late October. But then, as the three major indexes plummeted, the dollar index began to soar and reached around 96.

Sterling was down just 0.1% at the end of the day. A lack of specific data was released, but the pair gained 0.6% intraday as the greenback weakened, but then fell as the greenback strengthened. On Friday, core retail sales data and comments from BOE members may provide some direction on the way forward.

A similar situation occurred in the euro, which rose first and then fell against the dollar. Later in the day, ECB President Christine Lagarde is due to speak, but a rate hike remains less likely.

Gold settled little changed at around $1,840 an ounce but managed to hit a fresh two-month high of $1,847.92 an ounce. Meanwhile, crude prices surged to fresh multi-year highs, with WTI hitting $87.08 a barrel and Brent hitting $89.46 a barrel.


Technical Analysis:

GBPUSD (Daily Chart)

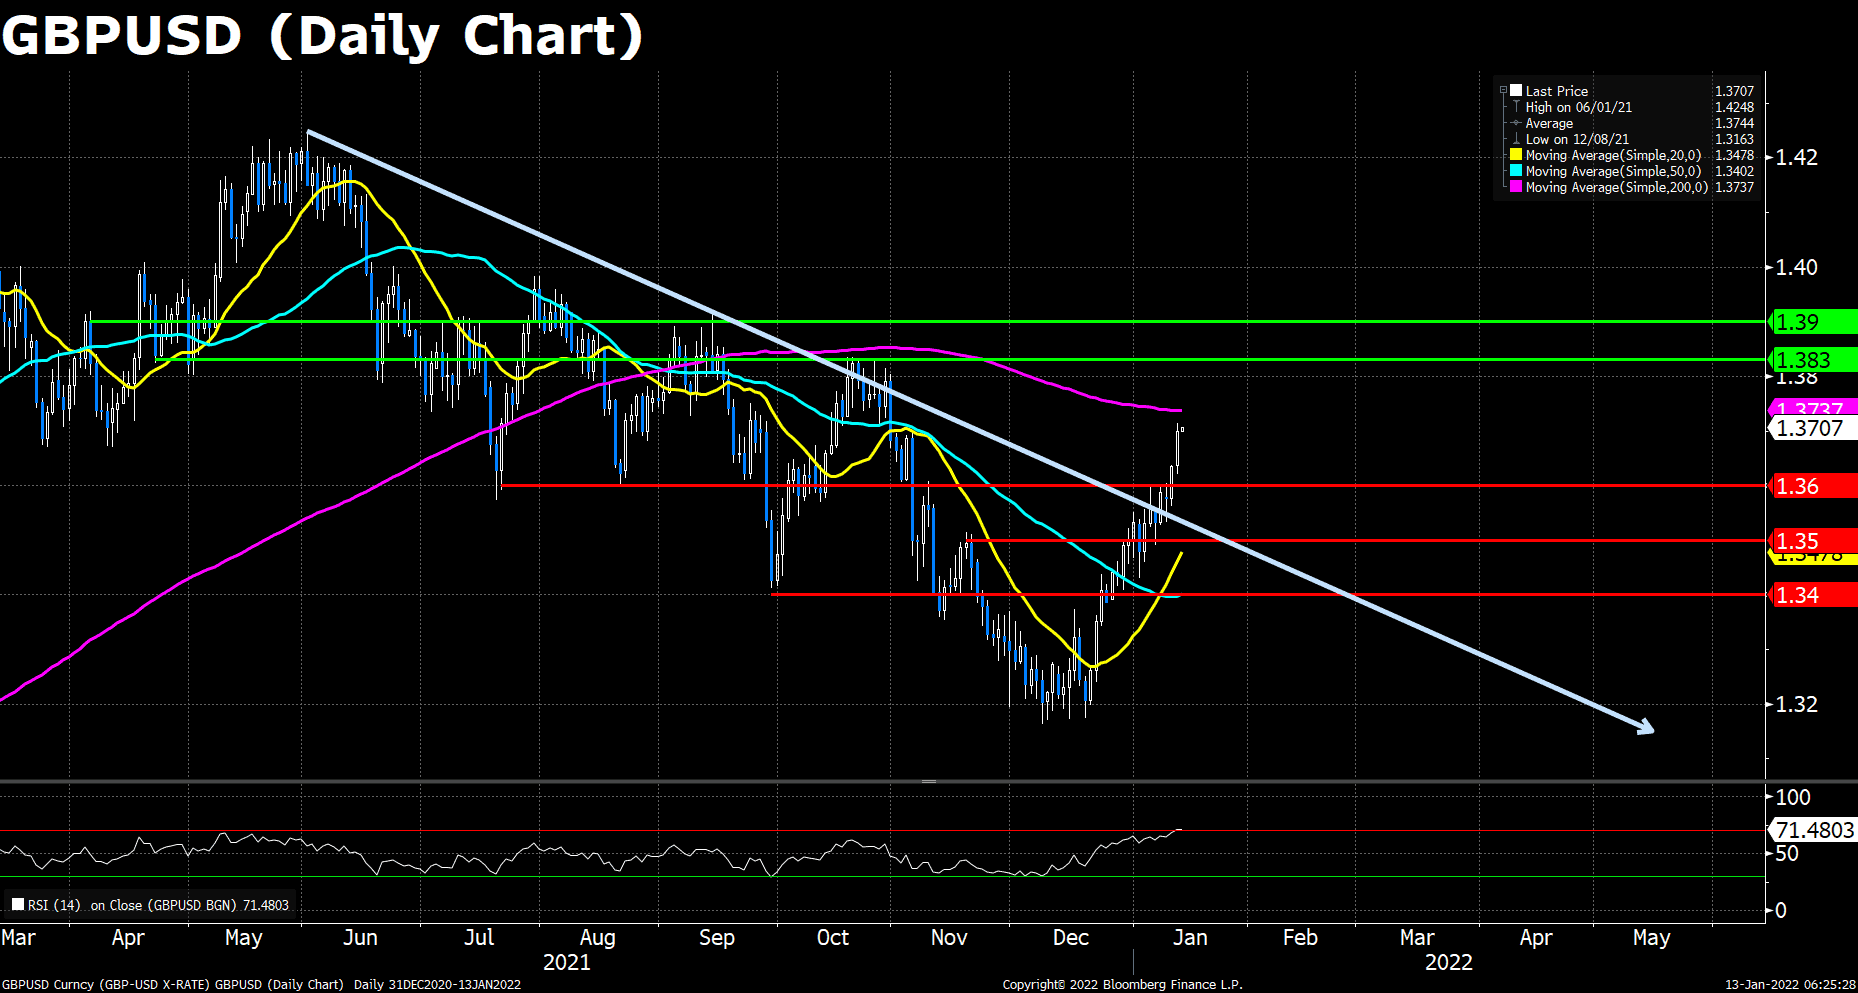
Cable made a mild slide in the Asian session but jumped fiercely at the start of the European trading hours and extended further to the north after the dismal US job data came out, which weighed heavily on the dollar’s demands. The pair now trades around 1.3645, posting 0.23% gains during the intraday trades. The rate competition between the hawkish Bank of England and the Federal Reserve will continue to be the main driver to Cable’s future price actions, as the Fed has announced its rate hike timetable that has been priced in by the market, we expect that GBP/USD to climb further once new BoE hawkish policies being announced. Investors are all eye on the February 3rd BoE meeting.

On the technical front, the RSI for Cable remains around 60, and the pair settles above its 20 and 50 DMA, eyeing on the critical 200-day one. Cable lingers around the 1.3640-50 level at the moment. To the upside, if the pair break through its 200 DMA, the next resistance will be at 1.3830, then 1.3900; on the flip side, if the pair failed to cling on the 1.3600 level, the next effective support will appear at 1.3400, followed by 1.3200, where the one-year lows lie.

Resistance:  1.3734 (200 DMA), 1.3830, 1.3900

Support:  1.36600, 1.3400, 1.3200


EURUSD (Daily Chart)

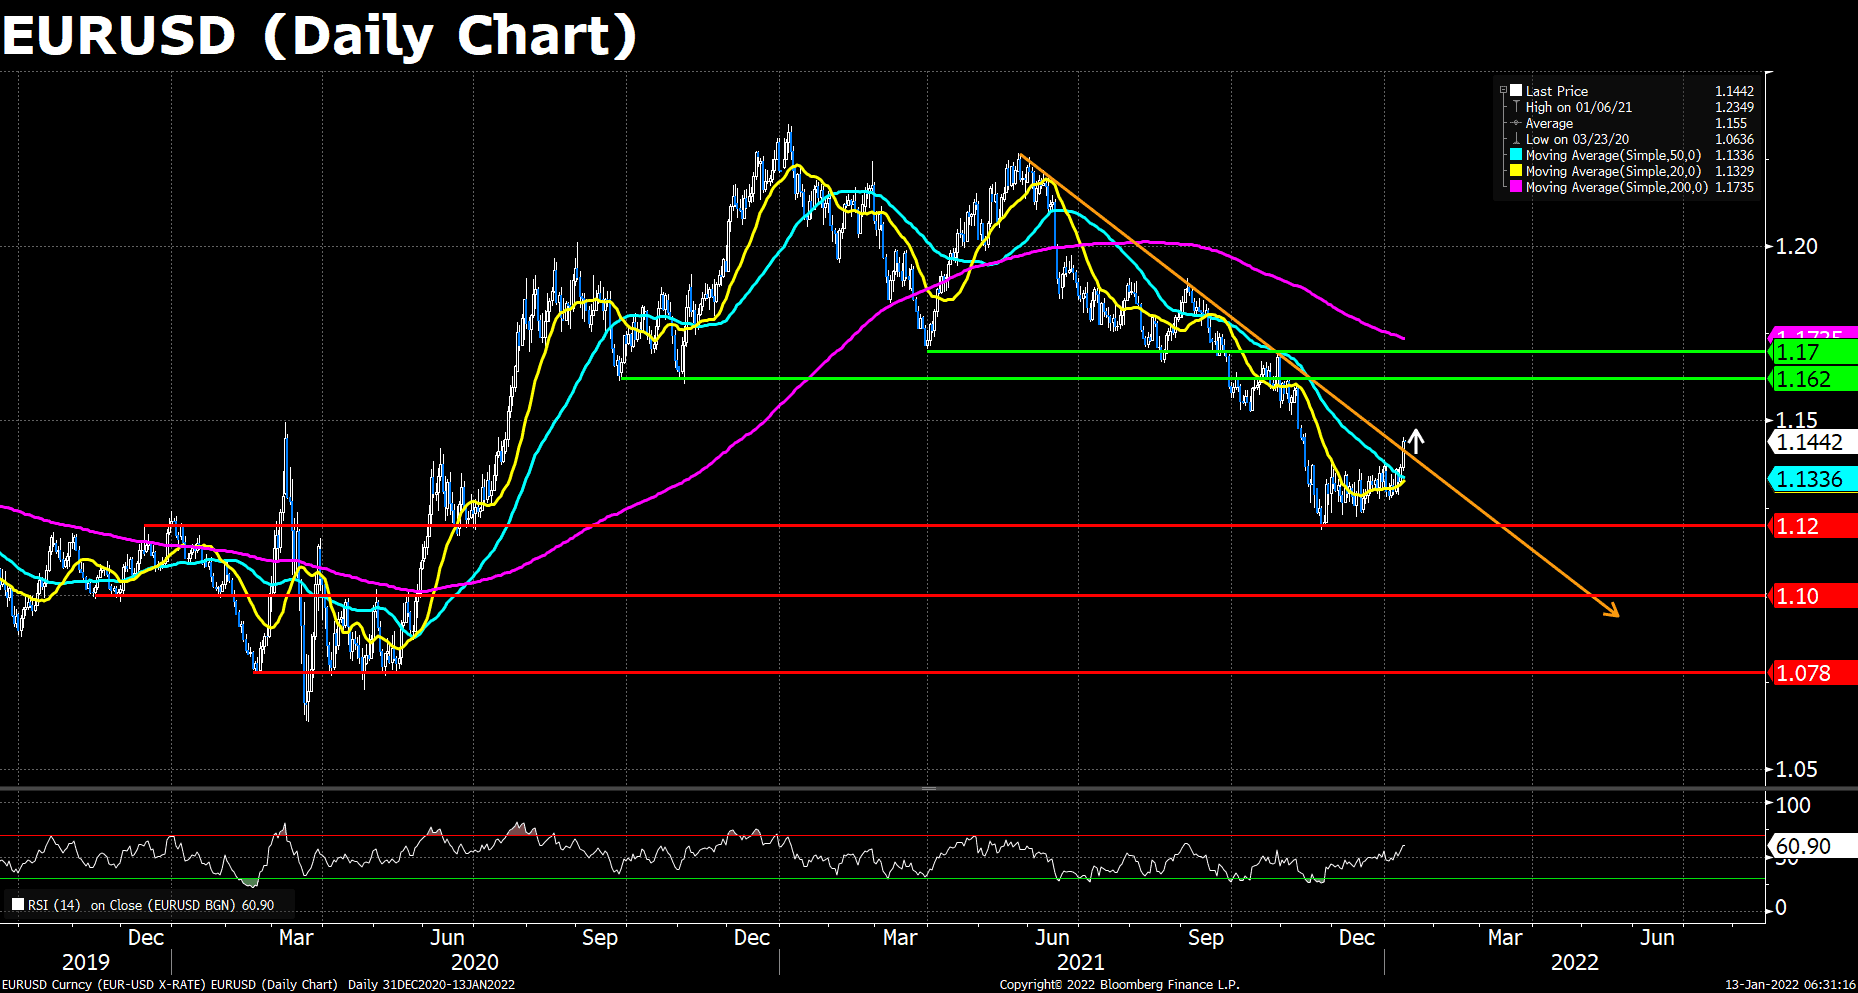
The euro pair is holding the lower ground below 1.1350, as the US dollar attempts a bounce in tandem with the Treasury yields amid a risk-on mood. The sentiment on Wall Street improved quite a bit, in anticipation of the corporate earnings reports. That fueled a fresh sell-off in the US Treasuries, which in turn, prompted the yields to resume their uptrend. The upturn in the yields lifted the sentiment around the dollar at the euro’s expense. Escalating Russia-Ukraine crisis, with the US imposing sanctions on four Ukrainian officials, accusing them of destabilizing Ukraine, also boosts demand for the safe-haven US dollar.

As to technical, the EUR/USD pair’s price actions shifted to the south, heading to the next retracement line at around 1.1300. The RSI for the pair continues to fall, now reading 47.74, showing a stronger downside pressure weighing on Euro. As previously mentioned, the pair could fell over the 1.1300 support and then season lows around the 1.1200 support. The pair still capped by its 20 and 200 DMA, slight above the 50 DMA.

Resistance: 1.1380, 1.1440,1.1500

Support: 1.1300, 1.1200


XAUUSD (Daily Chart)

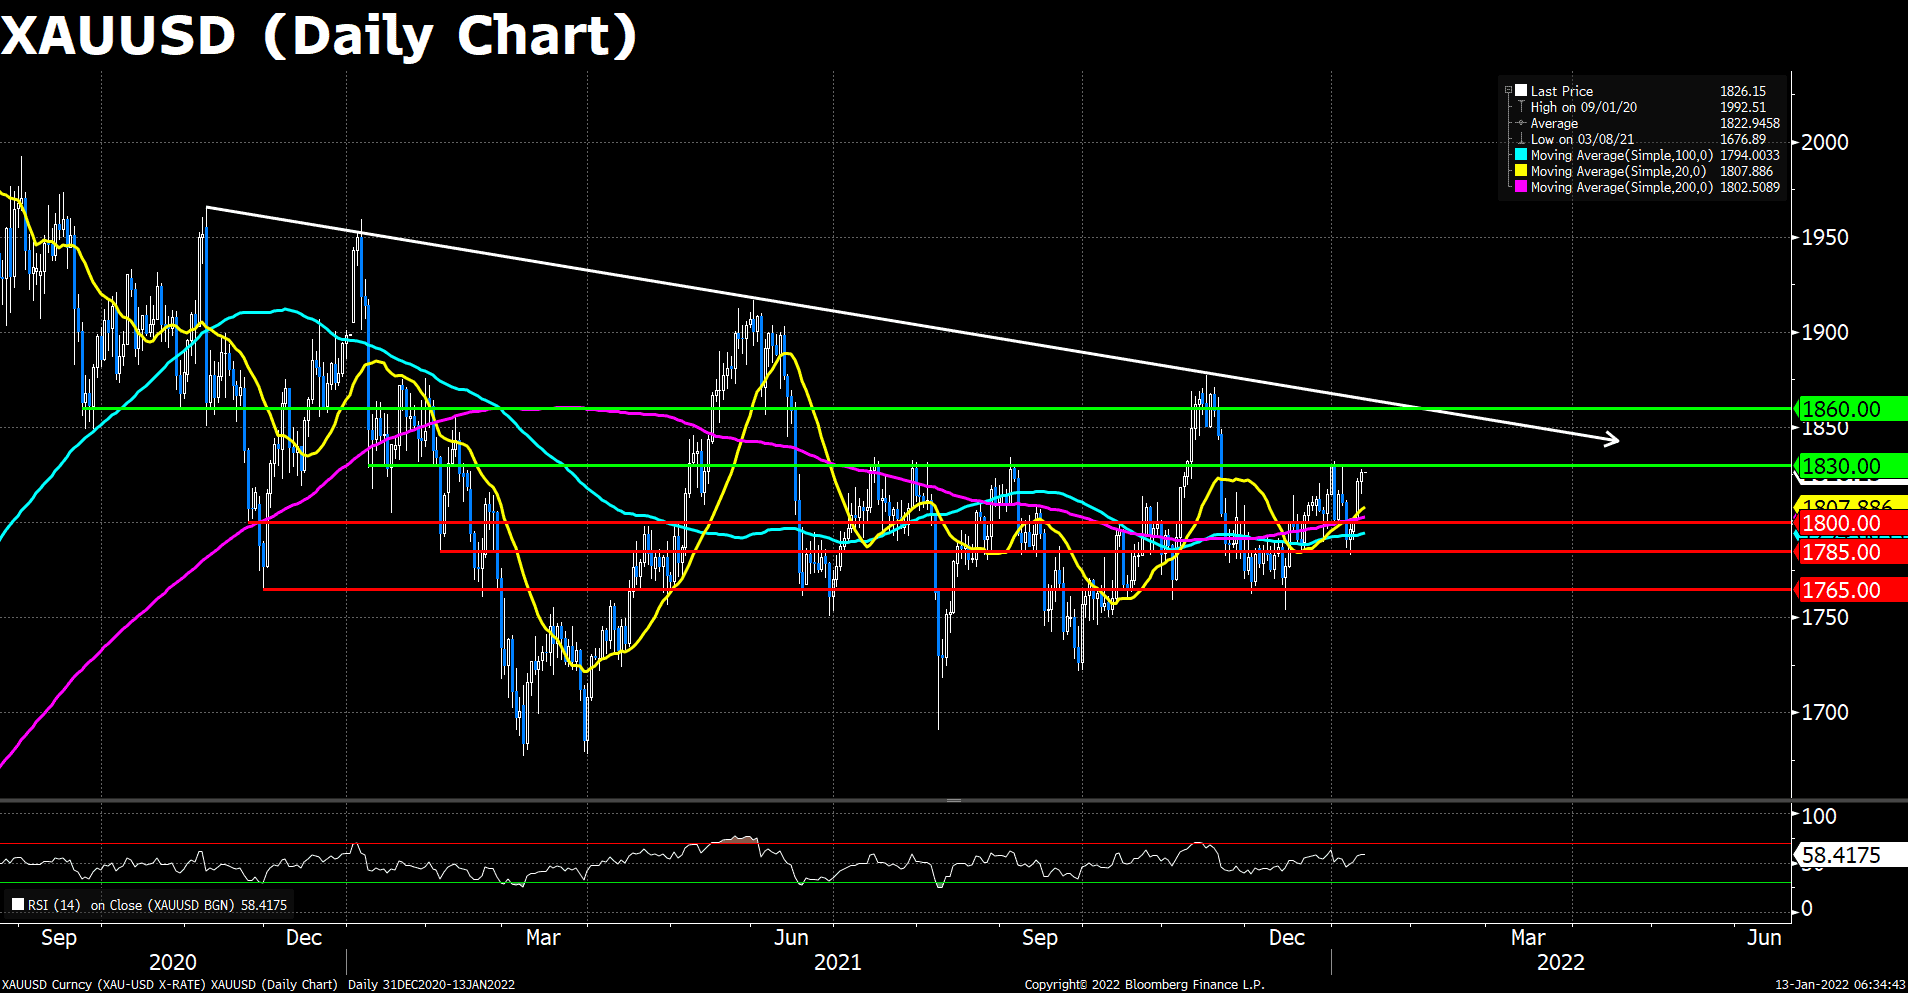
Gold price is trading almost unchanged on the day around $1,841 a troy ounce, as it fades its uptick from fresh two-month highs of $1,848. The latest leg down in gold price could be associated with a tepid bounce seen in the US Treasury yields, which helps put a fresh bid under the dollar. Additionally, a broad rebound across markets fuel risk-on flows, dulling gold’s appeal as a safe-haven. Despite the pullback, the yellow metal remains supported by soaring inflation globally and negative real returns, along with escalating geopolitical tensions surround US, Russia and Ukraine amid a probable invasion by the Kremlin of the latter.

From the technical perspective, the RSI bias continues to point to the upside, after breaking the $1830 area on Wednesday. Since the next resistance lies $20 above the current price level, there’s still room for the gold’s traction. As previously mentioned, we expect the short-term uptrend to reach the critical $1,860 resistance, though the downside risk will gradually increase during its climb.

Resistance: 1860, 1900

Support: 1830, 1800, 1765


Economic Data:

Currency

Data

Time (GMT + 8)

Forecast

GBP

Retail Sales (MoM) (Dec)

14:00

-0.6%

EUR

ECB President Lagarde Speaks

20:30

CAD

Core Retail Sales (MoM) (Nov)

21:30

1.3%

VT Markets The Adjustment Of Weekly Dividend Notification

Dear Client,

Warmly reminds you that the component stocks in the stock index spot generate dividends. When dividends are distributed, VT Markets will make dividends and deductions for the clients who hold the trading products after the close of the day before the ex-dividend date.

Indices dividends will not be paid/charged as an inclusion along with the swap component. It will be executed separately through a balance statement directly to your trading account, the comment for which will be in the following format “Div & Product Name & Net Volume ” .

Please note the specific adjustments as follows:

Note: The above data is for reference only, the actual execution data may be changed, please refer to the MT4/MT5 software for details.

If you’d like more information, please don’t hesitate to contact [email protected].

Market Focus

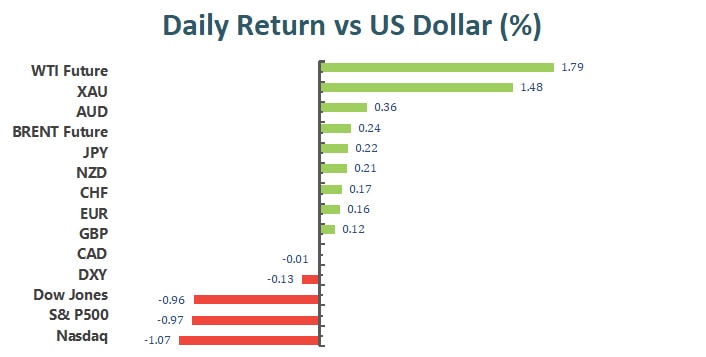
The broad U.S. equity markets continued to fall on Wednesday’s trading. The Dow Jones industrial average lost 0.96% to close at 35,028.65, the S&P 500 lost 0.97% to close at 4532.76, and the Nasdaq composite lost 1.15% to close at 14,340.25. The benchmark U.S. 10 year treasury yield continues to edge higher and is currently sitting at 1.865%; meanwhile, the 30 year treasury yield inched higher, as well, and is currently at 2.169%.

一張含有 文字 的圖片

自動產生的描述

With earnings seasons well underway, Bank of America and Morgan Stanley have both reported better than expected earnings results; however, the broad equity market is already bracing for the Fed’s imminent rate hike. Among the 11 sectors that make up the S&P 500, only consumer staples and utilities were able to post moderate gains.

Meanwhile, the cryptocurrency market suffered as well. Bitcoin has fallen back below 42,000, more than a 35% drop from its November, 2021 high. Ethereum lost 2.53% against the Dollar and is currently trading at 3114.36.


Main Pairs Movement:

The Dollar Index, which measures the Greenback against a basket of major foreign currencies, dropped 0.11% over the course of yesterday’s trading.

Cable gained 0.13% over the course of yesterday’s trading. Britain’s CPI data indicated the largest inflationary pressure in nearly 30 years. Market participants interpreted this information as a possible trigger for the BOE increase interest rates once again.

The Euro gained against the Dollar amid broad-based Dollar weakness. With interest rate divergence on the horizon, upward momentum for the Euro remains weak.

The precious metal, Gold, enjoyed a 1.48% gain against the Dollar over the course of yesterday’s trading. With inflation rising, globally, market participants have once again turn to the precious metal as a hedge against inflation.


Technical Analysis:

GBPUSD (Daily Chart)

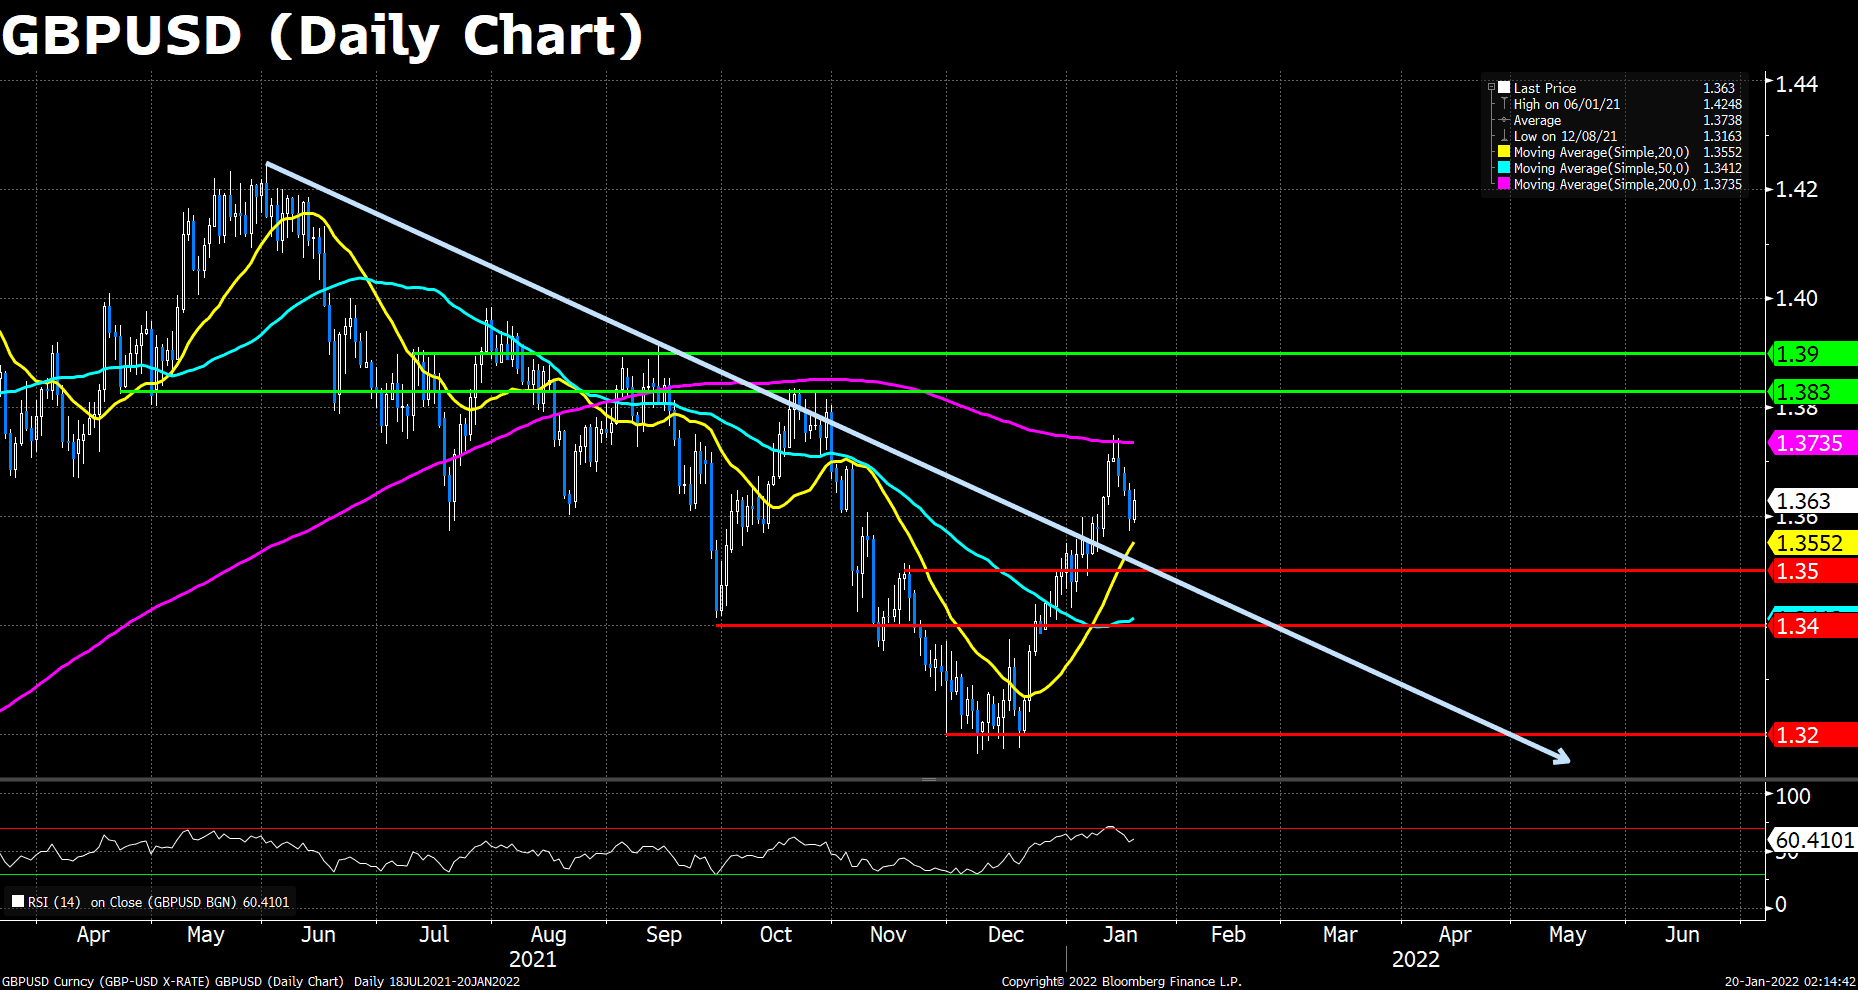
Cable regained traction and rebounded on Wednesday, signaling an end of three-day retreat, triggered by a double rejection at 200 DMA (1.3736) last week. Sterling was boosted by UK CPI data which showed that inflation in Britain continued to rise and hit the highest level in nearly 30 years in December, hammering policymakers’ general view of transitory process and boosting hopes for another BoE’s rate hike on its February 3rd meeting.

On the technical front, owing to the fundamental supports, the RSI indicator bounced back to 60, suggesting a recovery in the bulls’ strength. Cable has jumped above the 1.3600 resistance and is heading to the critical 200 DMA pressure level at the moment. A breakthrough of that level indicates that there’s more room for Pound to appreciate, eyeing on 1.3830.

Resistance: 1.3736 (200 DMA), 1.3830, 1.3900

Support:  1.3500, 1.3400, 1.3200


EURUSD (Daily Chart)

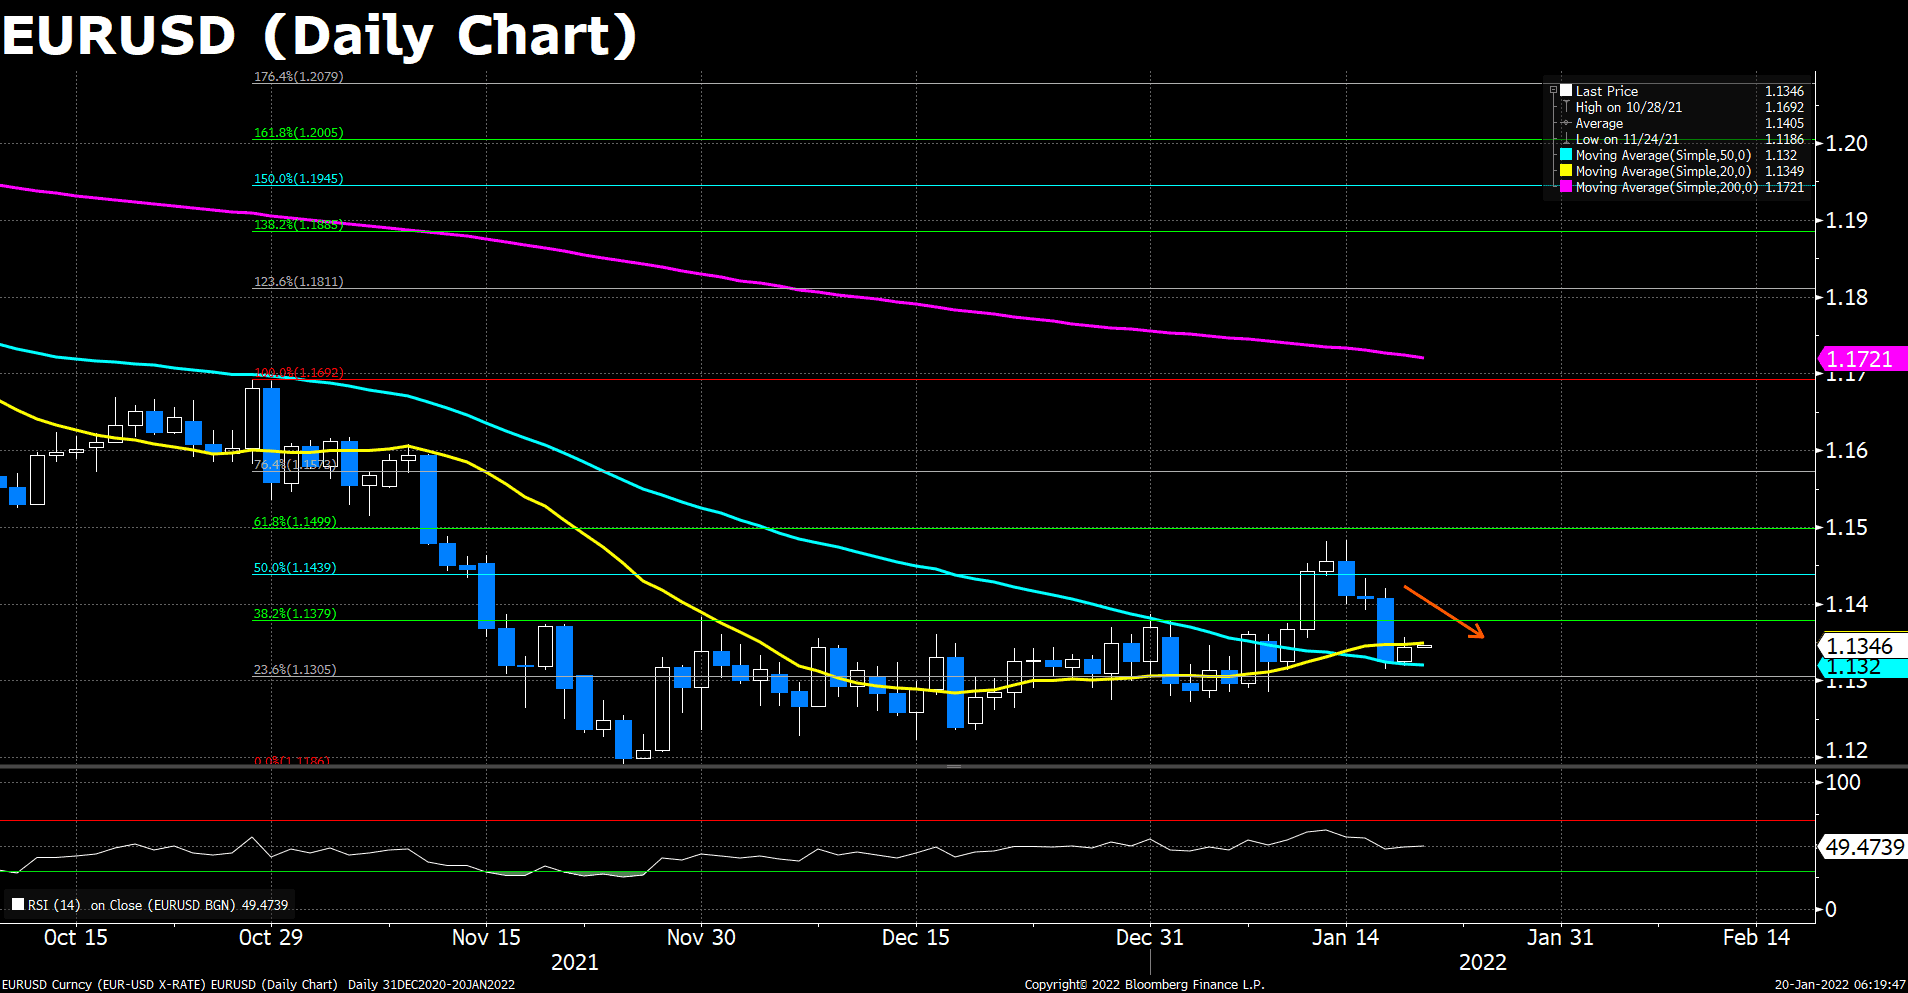
The EUR/USD pair is following its British peer’s rally with a modest 0.2% gain, which has barely regained about a quarter of its Tuesday’s decline. However, considering the weak outlook of the monetary policy divergences between the two central banks, and the risk of losses on Russia and Ukraine tensions, it is expected that the pair will eventually break under 1.1300 in the near term, and potentially post a fresh 2-year low as the Fed’s tightening cycle kicks off .

As to technical, the Euro pair doesn’t recover to the 38.2% Fibonacci during today’s trading, showing its intraday gains are nothing but a mild correction. The RSI for the pair marks 49.47, indicating the shared currency remain under selling pressure. To the downside, the pair could fell over the 1.1300 support and then season lows around the 1.1200 support. The pair still capped by its 20 and 200 DMA, slight above the 50 DMA.

Resistance: 1.1380, 1.1440,1.1500

Support: 1.1300, 1.1200


XAUUSD (Daily Chart)

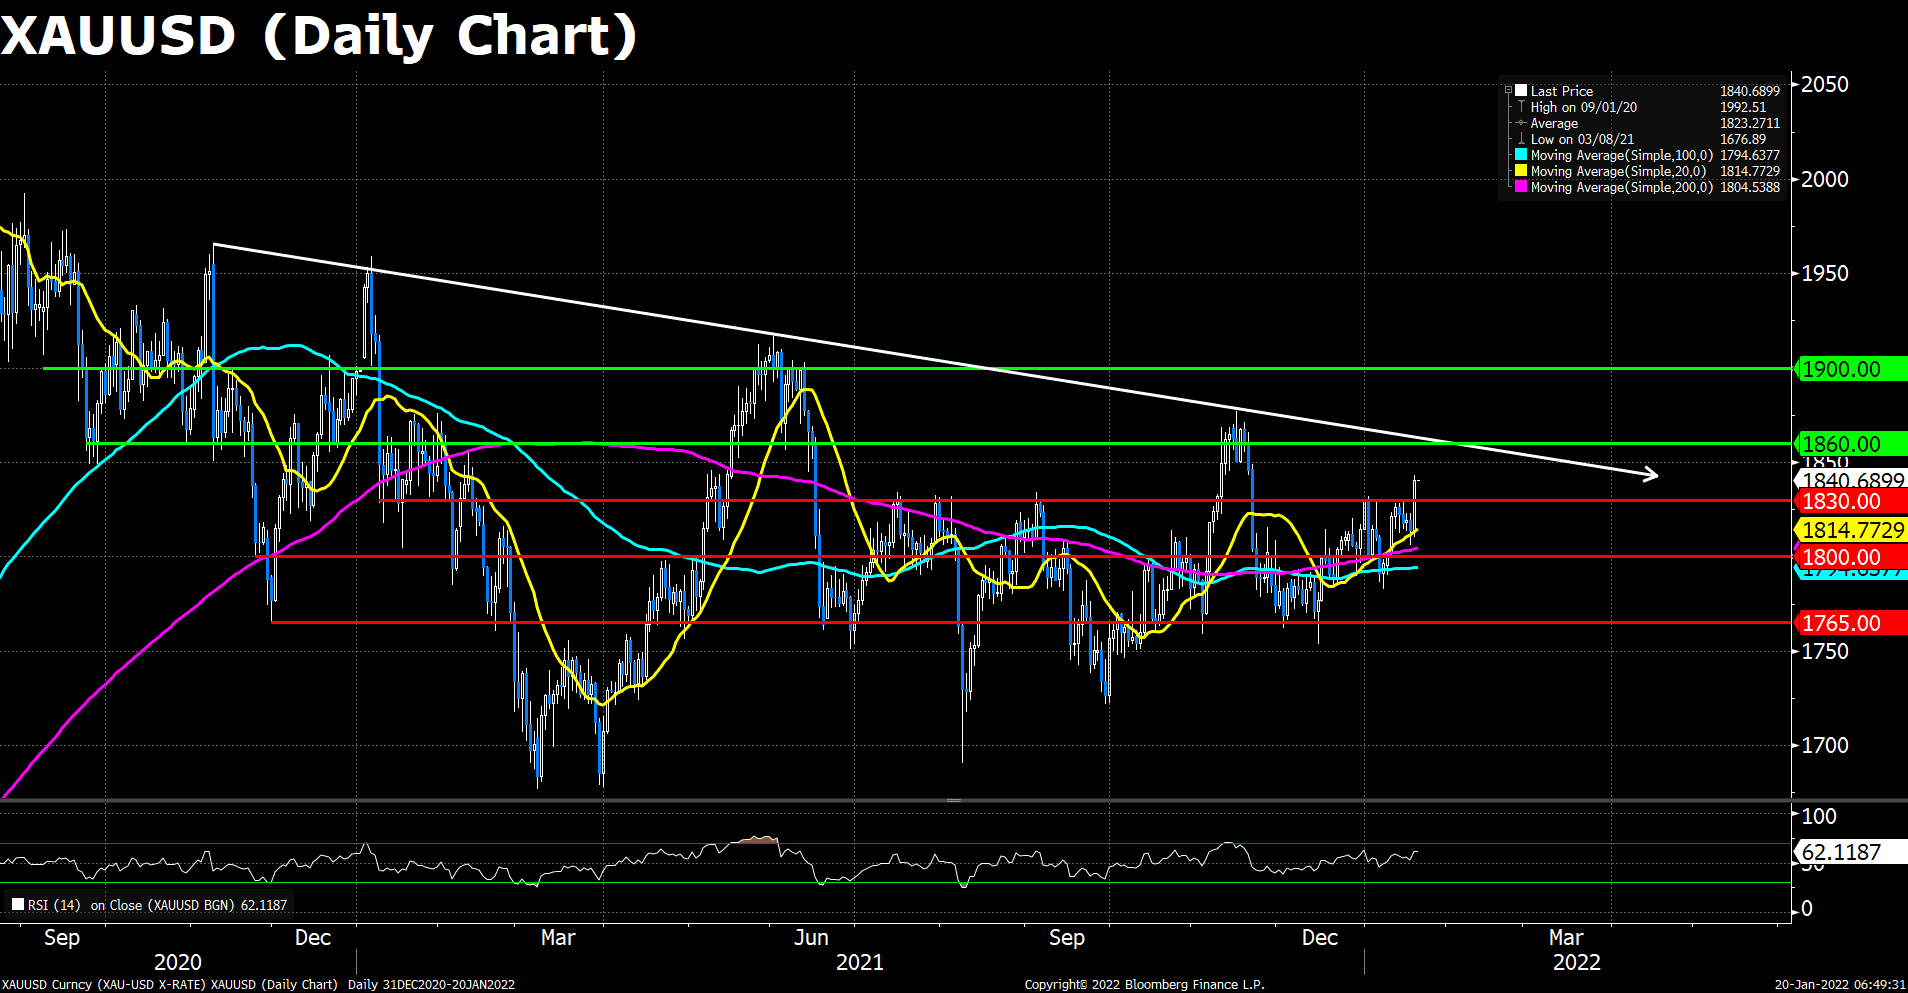
Gold’s upside momentum has waned in recent trade, with prices trading in more of a subdued manner near $1842 after bursting above resistance in the $1830s for the first time in over two months. The speed of the pair’s latest advances, especially between the $1830 to $1840 area, is suggestive of a stop run, as many short traders may have had their stop loss sat somewhere in the $1830s. However, it is unlikely that spot gold can resist the advances of the US dollar and US real yields forever, and expectations for a very hawkish Fed in 2022 suggest continued upside risks for both.

From the technical perspective, though gold’s intraday hike, the pair’s mid-term bearish tractions are still above the price action. Gold price now trades above all its moving averages, and the RSI indicator reads 62.12, suggesting a bullish outlook. We expect the short-term uptrend to reach the critical $1,860 resistance, though the downside risk will get bigger and bigger during its climb.

Resistance: 1860, 1900

Support: 1830, 1800, 1765


Economic Data:

Currency

Data

Time (GMT + 8)

Forecast

AUD

Employment Change (Dec)

08:30

43.3 K

CNY

PBoC Loan Prime Rate

09:30

EUR

CPI (YoY) (Dec)

18:00

5.0%

EUR

ECB Publishes Account of Monetary Policy Meeting

20:30

USD

Philadelphia Fed Manufacturing Index (Jan)

21:30

220 K

USD

Initial Jobless Claims

21:30

20.0

USD

Existing Home Sales (Dec)

23:00

6.44 M

Market Focus

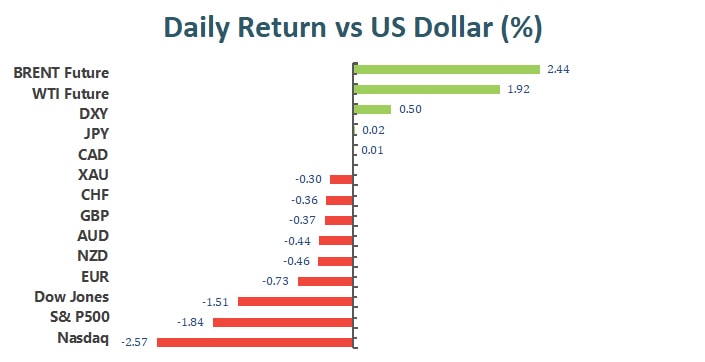
Wall Street’s main indexes fell sharply on Tuesday as soaring U.S. Treasury yields hit tech stocks in the U.S. and Europe, while losses at Goldman Sachs led to losses in U.S. financial stocks. U.S. 10-year yields now rose to a two-year high of 1.875%, while two-year yields also rose above 1%, as traders braced for the Federal Reserve to be more aggressive in tackling unabated inflation. At the end of the market, the Dow Jones Industrial Average slid 1.51% to 35,368.47 points, the S&P 500 index lost 1.84% to 4,577.11 and the Nasdaq Composite Index, slipped 2.6% to 14,506.9 points. On the other hand, European tech stocks were also under pressure and fell 2.2%, causing the pan-European STOXX 600 index to drop as much as 1.44% during the session before closing down 0.97%.

一張含有 文字 的圖片

自動產生的描述

Of the 11 sectors in the S&P 500, 10 ended lower, information technology was the biggest loser, down 2.48%, followed by interest-rate-sensitive financials, down 2.27%. Energy, the biggest gainer so far in 2022, was the only sector in positive territory, up 0.4%. Large-cap stocks such as Microsoft, Apple and Meta fell 2.43%, 1.89% and 4.14% respectively, weighing on the information technology sector. In addition, the worst performance of the Dow Jones index was Goldman Sachs Group, which fell 6.97%, JPMorgan Chase fell 4.19%, and Cisco Systems fell 2.66%. The worst performers on the S&P 500 were Moderna Inc, down 8.85%, Applied Materials, down 8.77%, and KLA-Tencor Corporation, down 7.20%.


Main Pairs Movement:

The U.S. dollar is the overall winner compared to all its major competitors. U.S. Treasury yields surged to the milestones, with the 10-year yield at 1.856% and the 2-year yield over 1%. Stocks edged lower and global indices closed lower.

As Treasury yields continued to rise, the dollar was fueled. The Dollar Index moved on its winning streak, gaining 0.5% to end at 95.7.

Cable started to fall and dipped below 1.3600. The unemployment rate fell to 4.1% in the three months to November, while the number of unemployed fell by 43.3K in December. Meanwhile, a scandal over Downing Street parties has put Prime Minister Boris Johnson’s leadership at risk during Britain’s worst lockdown.

The same pattern scenario for EUR/USD, after reaching the 1.14500 level, the pair declined and is currently back in the consolidation zone. Despite Germany’s ZEW survey showing a sharp rebound in economic sentiment, it offered little help.


Technical Analysis:

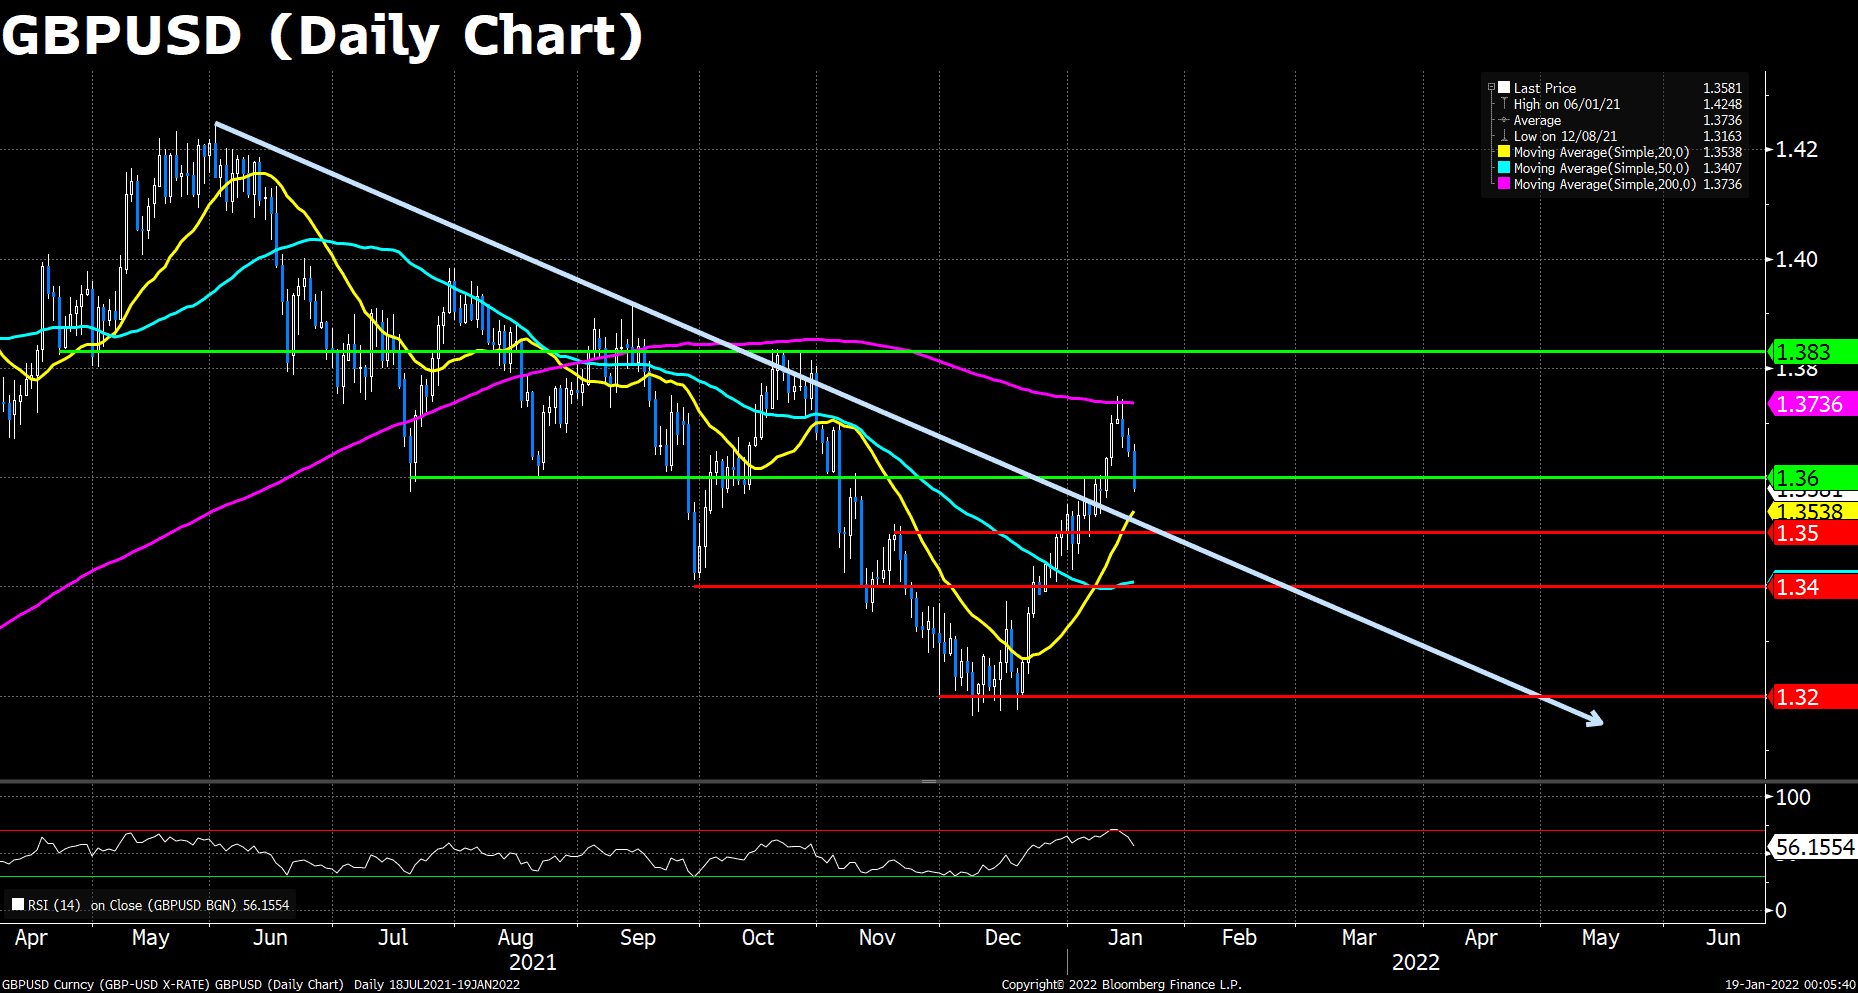
GBPUSD (Daily Chart)

Cable headed to the south for the third consecutive day as the hawkish Fed rate hike timetable has been finally in effect. The GBP/USD pair traded sidelined during the Asian Pacific session, but then plummeted at the beginning of the European trading hours, and dropped further after the Wall Street opening as the US equities opened low. That’s said, the tightened US policies and the risk-off market mood boosted the greenback.

On the technical front, the RSI indicator reads 56.23 as of writing, retreated from yesterday’s 60s, suggesting a depletion in the bulls’ strength. Moreover, Cable has made several attempts to regain 1.3600 intraday but failed, indicating that a strong selling power is hovering around that critical resistance level, and making the pair’s comeback more difficult.

Resistance:  1.3600, 1.3736 (200 DMA), 1.3830

Support:  1.3500, 1.3400, 1.3200


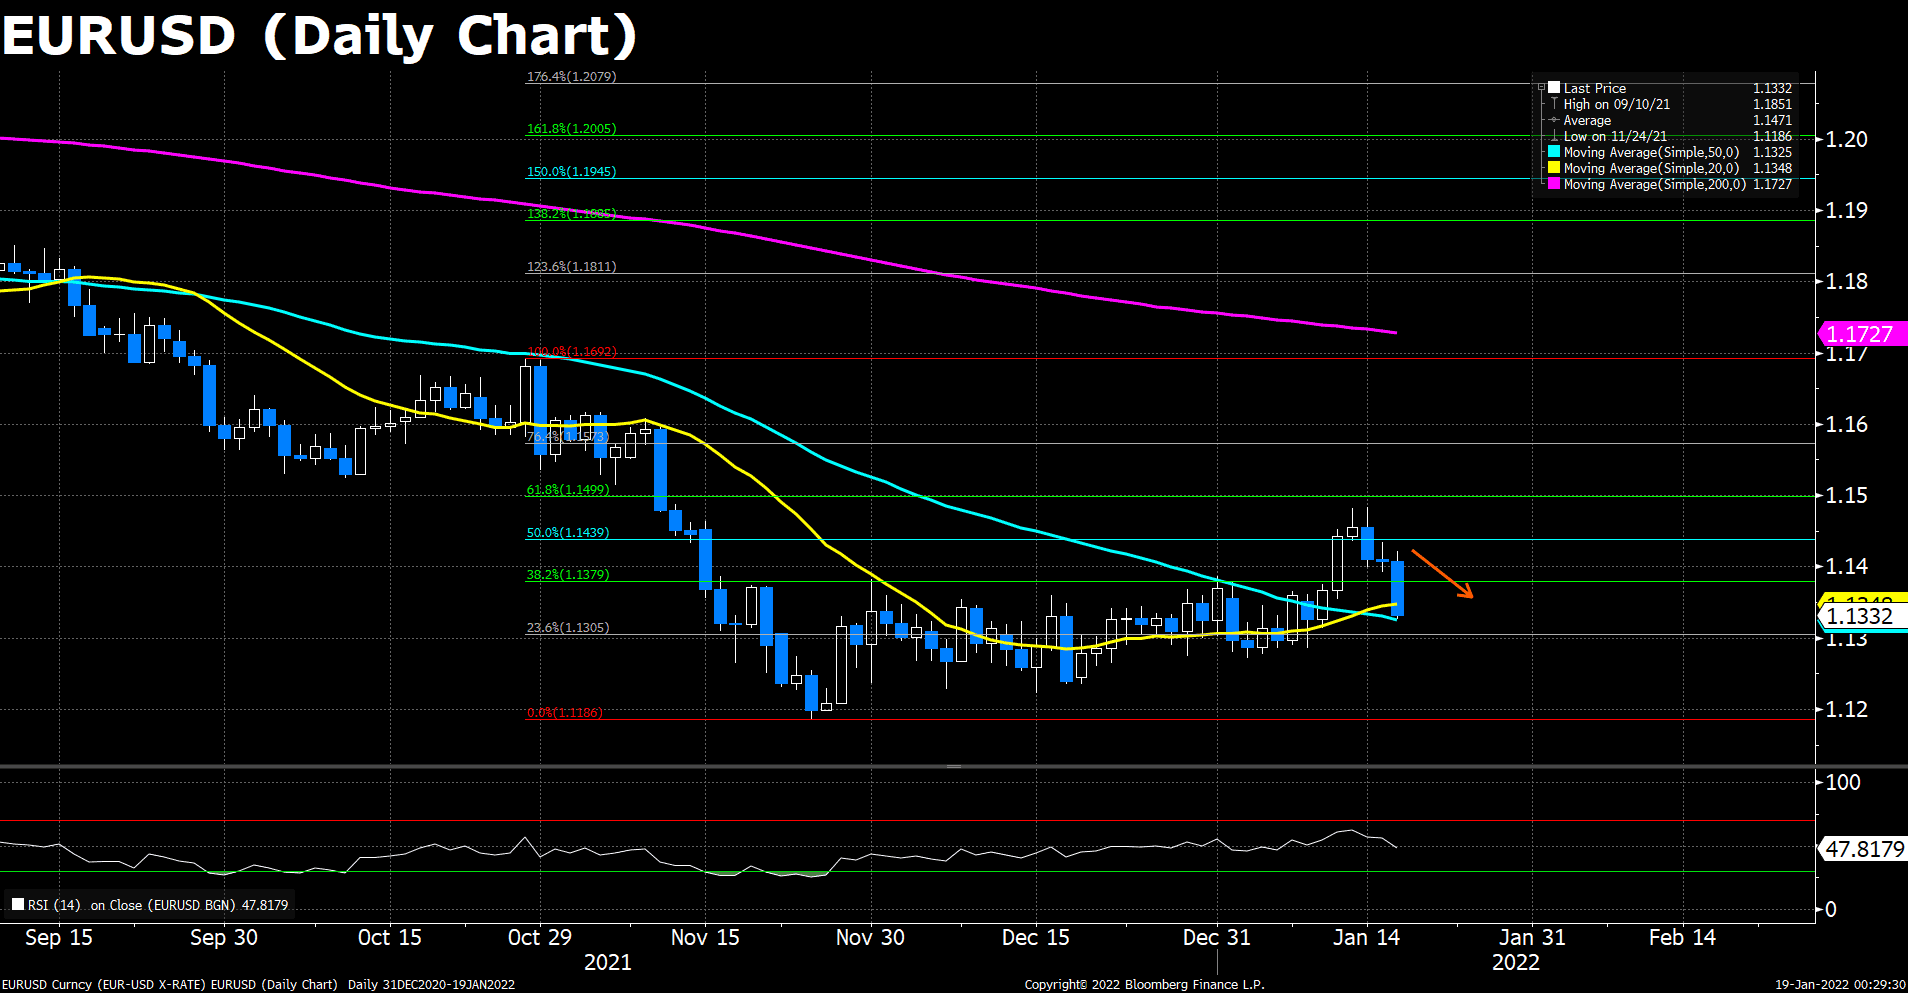
EURUSD (Daily Chart)

The Euro pair’s price actions are similar to Cable ones, but as the ECB is more conservative in monetary policies, the shared currency is more vulnerable to unfavorable circumstances, such as the recent US dollar rally and equity crashes. The pair now hovers around 1.1330, seventy pips down during today’s trading with the negative tone intact.

As to technical, if the EUR/USD pair fails to recover over 38.2% Fibonacci, then it could remain under pressure, looking at the 1.1300 zone and then season lows around the 1.1200 support. The slide pushed the pair back below all its major moving averages and into the previous consolidation phase in December 2021.

Resistance: 1.1380, 1.1440,1.1500

Support: 1.1300, 1.1200


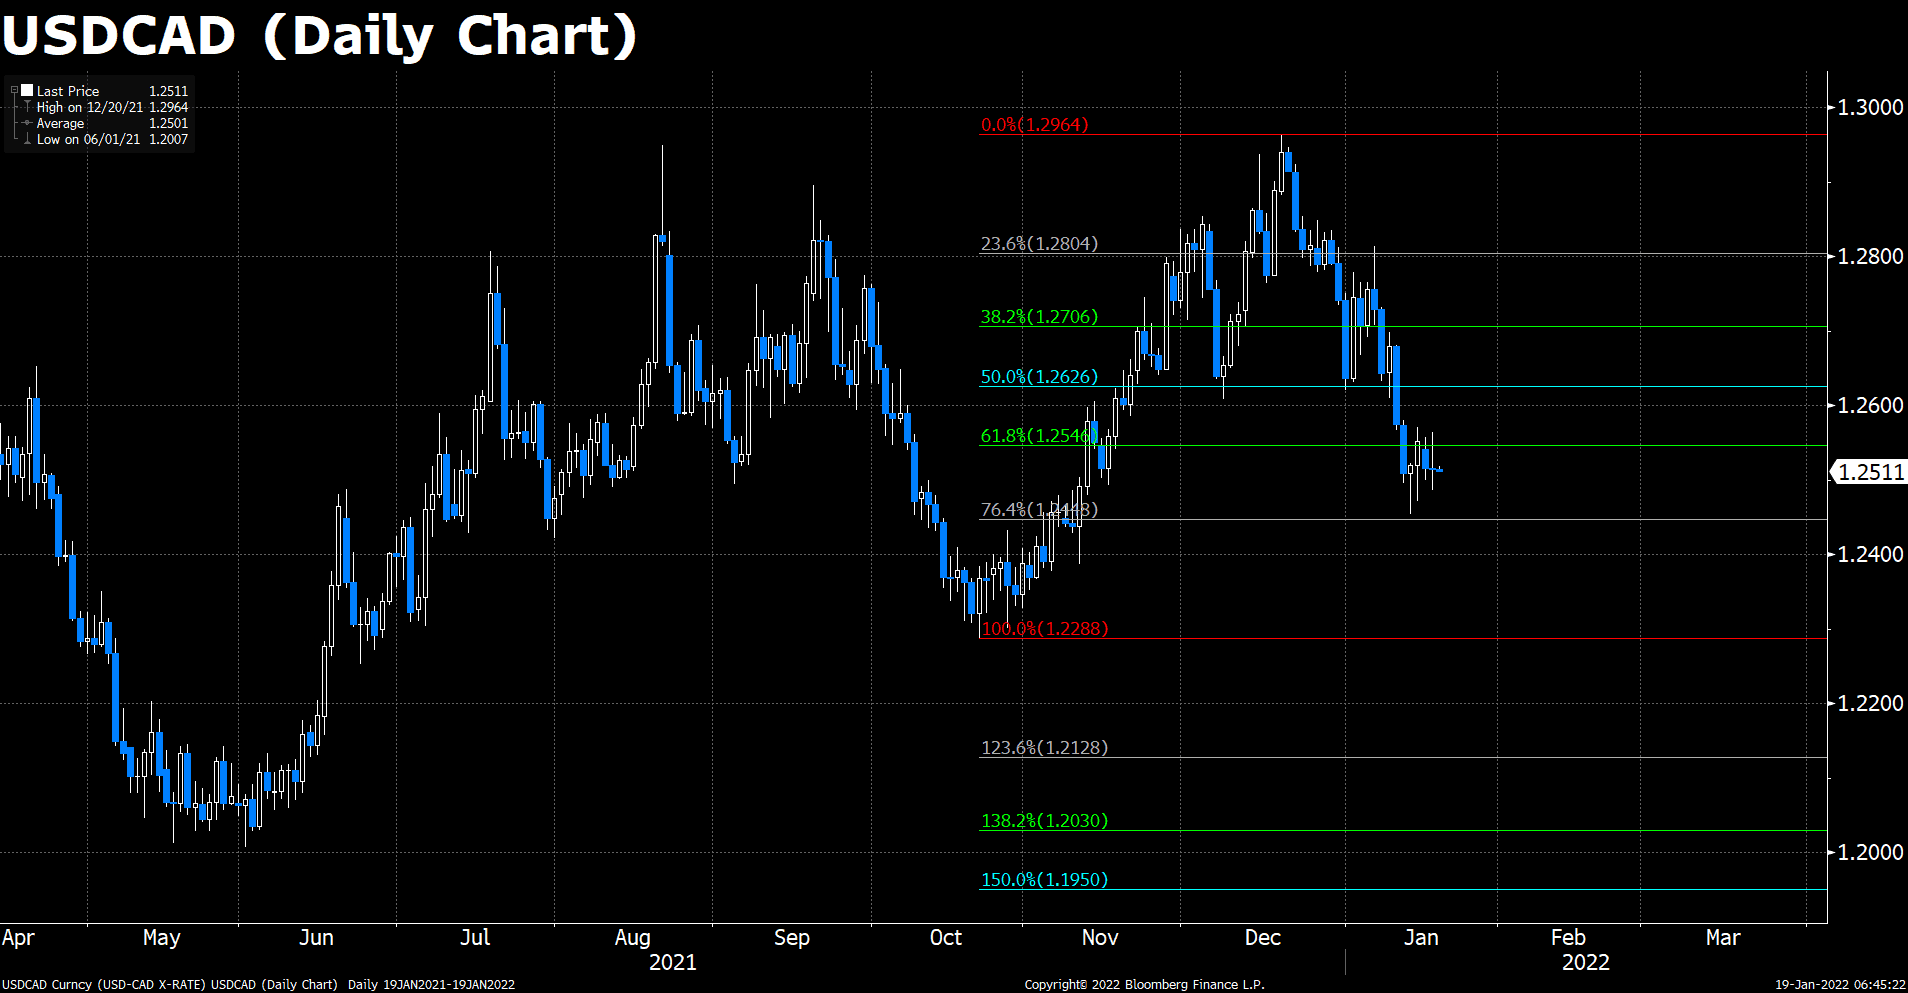
USDCAD (Daily Chart)

Loonie has had a subdued session on Tuesday, with the pair having dropped back to trading just above its 200-day moving average at the 1.2500 level after briefly surpassing the 1.2550 mark midway through US trade. Surging crude oil prices failed to push USD/CAD below support in the 1.2500 area, with the pair supported by a broad recovery in the US dollar as US government bond yields advanced to reflect new hawkish Fed tightening bets ahead of next week’s meeting.

From the technical perspective, the pair’s mid-term bearish tractions seems to be weakened a lot during January’s trading, indicating that the recent sharp pullback from the December high might soon be over. That said, repeated failures to find acceptance below the 1.2500 mark shows the unlikelihood to set off any further near-term depreciating move.

Resistance: 1.2550, 1.2630, 1.2700

Support: 1.2450, 1.2290


Economic Data:

Currency

Data

Time (GMT + 8)

Forecast

GBP

CPI (YoY) (Dec)

15:00

5.2%

USD

Building Permits (Dec)

21:30

1.701 M

CAD

Core CPI (MoM) (Dec)

21:30

GBP

BoE Gov Bailey Speaks

22:15

Market Focus

U.S. markets were closed on the 17th in observance of Dr. Martin Luther King day and markets will resume trading on the 18th. The benchmark U.S. 10 year treasury yield edged higher to 1.811% and the 30 year treasury yield also edged higher to 2.14%. China released its fourth quarter GDP for 2021 yesterday and the nation saw an 8.1% growth, year over year; however, retail sales figures missed expectations by about 2%. Furthermore, the central bank of China has decided to lower medium term loan rates in order to percent any economic slowdown. The current medium term loan rate set by the PBOC sits at 2.95%, and the central bank is lowering it by 10 basis points to 2.85%.

一張含有 文字 的圖片

自動產生的描述

The cryptocurrency market once again retreated slightly after yesterday’s trading. Bitcoin lost close to 2% and is currently trading below 42,200; on the other hand, Ethereum experienced a deeper drop by 4.15% and is currently trading at 3210.


Main Pairs Movement:

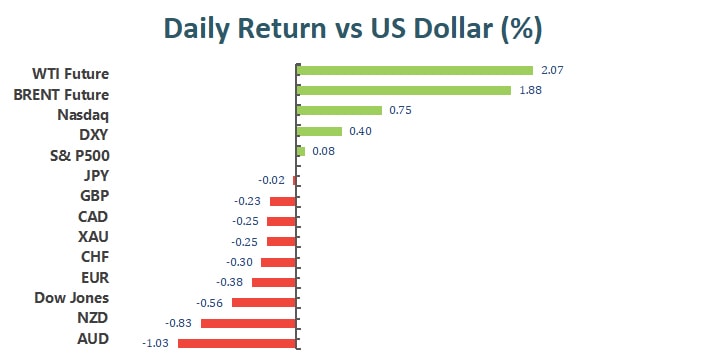
The Dollar Index recovered from last Friday’s low and is currently trading above 95.25. Continued rising treasury yields have propelled the Dollar. A parallel shift of the yield curves could further fuel the Dollar’s demand.

Cable continued to drop amidst a stronger Dollar across the board. Strong selling pressure appeared once the European session began.

Cotton has gained steam over the past month, as global demand for the commodity continue to rise and supply interrupted due to unfavorable weather conditions.

Natural gas has resumed to trading around 4.11 as the supply chain issue, which appeared last week, eases. Demand for the commodity remains high, but it remains to be seen if the commodity will recapture the 6.6-dollar mark of late 2021.


Technical Analysis:

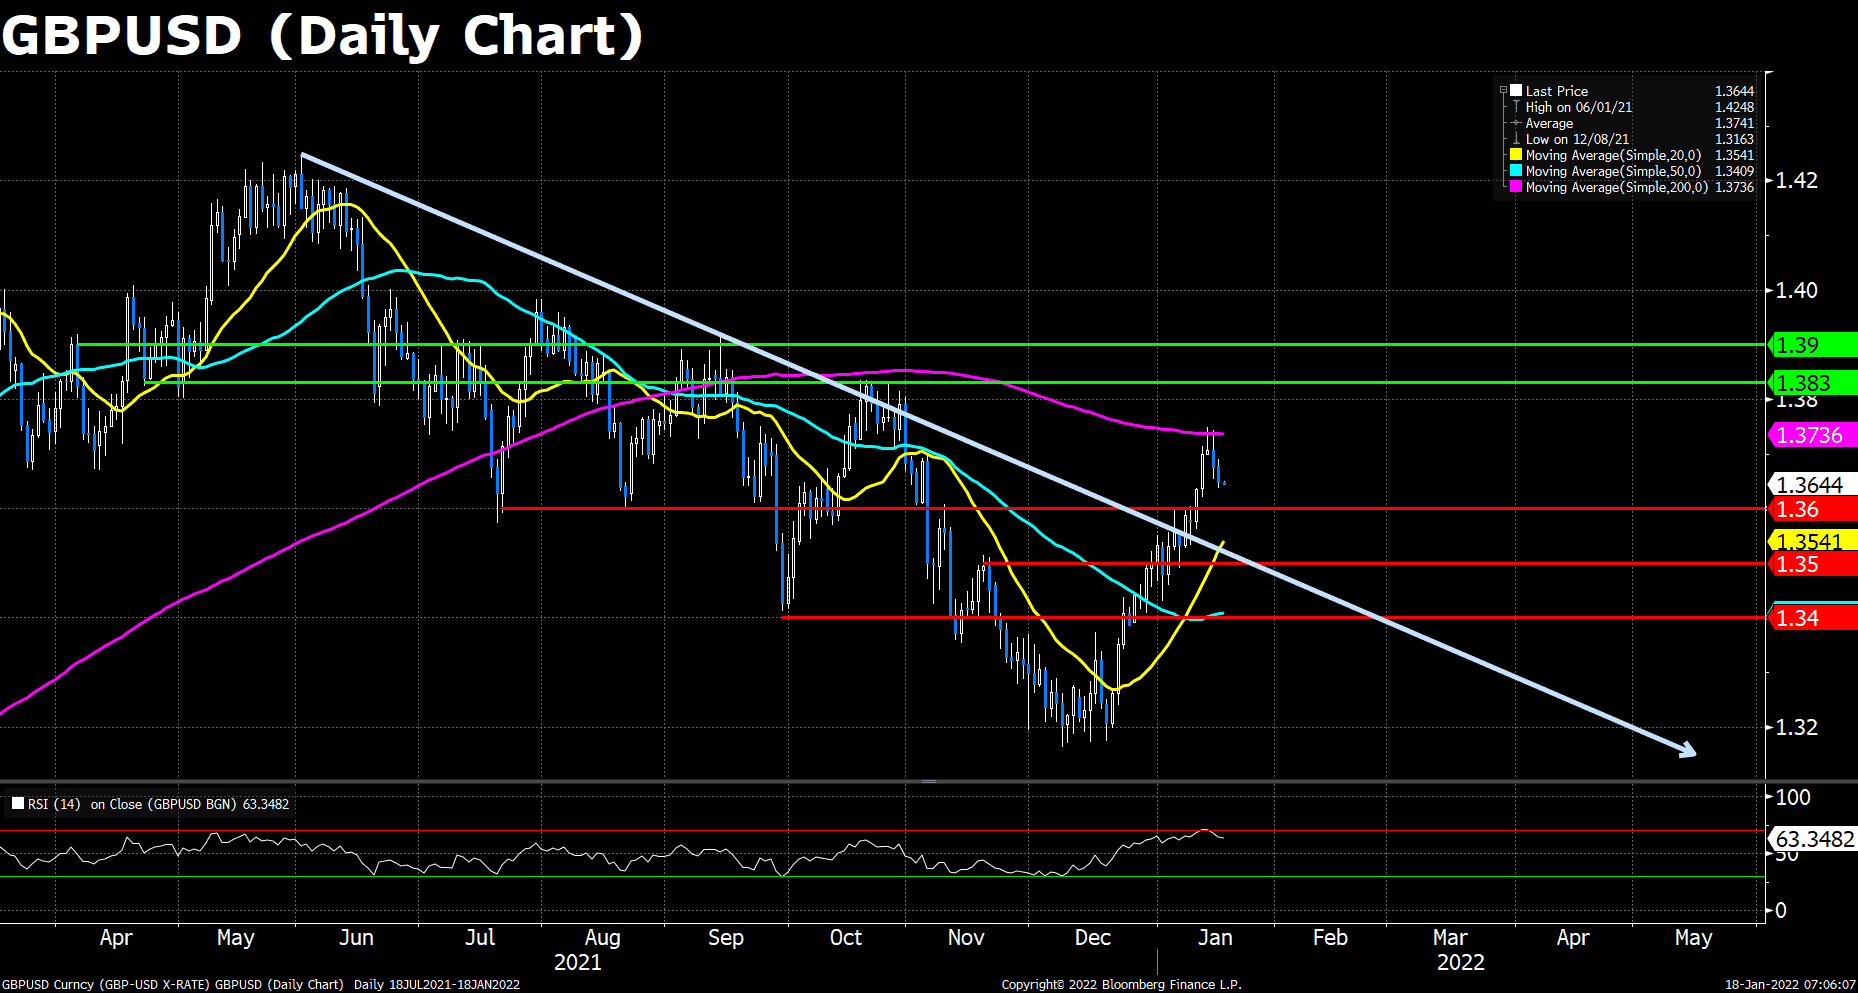
GBPUSD (Daily Chart)

The GBP/USD pair edged lower on Monday, following last Friday’s sharp retreat from a three-month high above 1.373 level. The pair was surrounded by bearish momentum and dropped to a daily low during Asian and European session, staying relatively quiet below 1.3700 heading into the New York session. At the time of writing, GBP/USD pair started to see fresh selling and targeted at 1.3600 area. The cable was last seen trading at 1.3645.

For technical aspect, RSI indicator reads 63.35 as of writing, suggesting bulls still robust at the moment. In conclusion, we think market will be bearish as the pair failed to gain a sustained strength beyond the 200 DMA. The pair could extend its downward correction toward 1.360.

Resistance: 1.3736 (200 DMA), 1.3830, 1.3900

Support: 1.3600, 1.3500, 1.3400


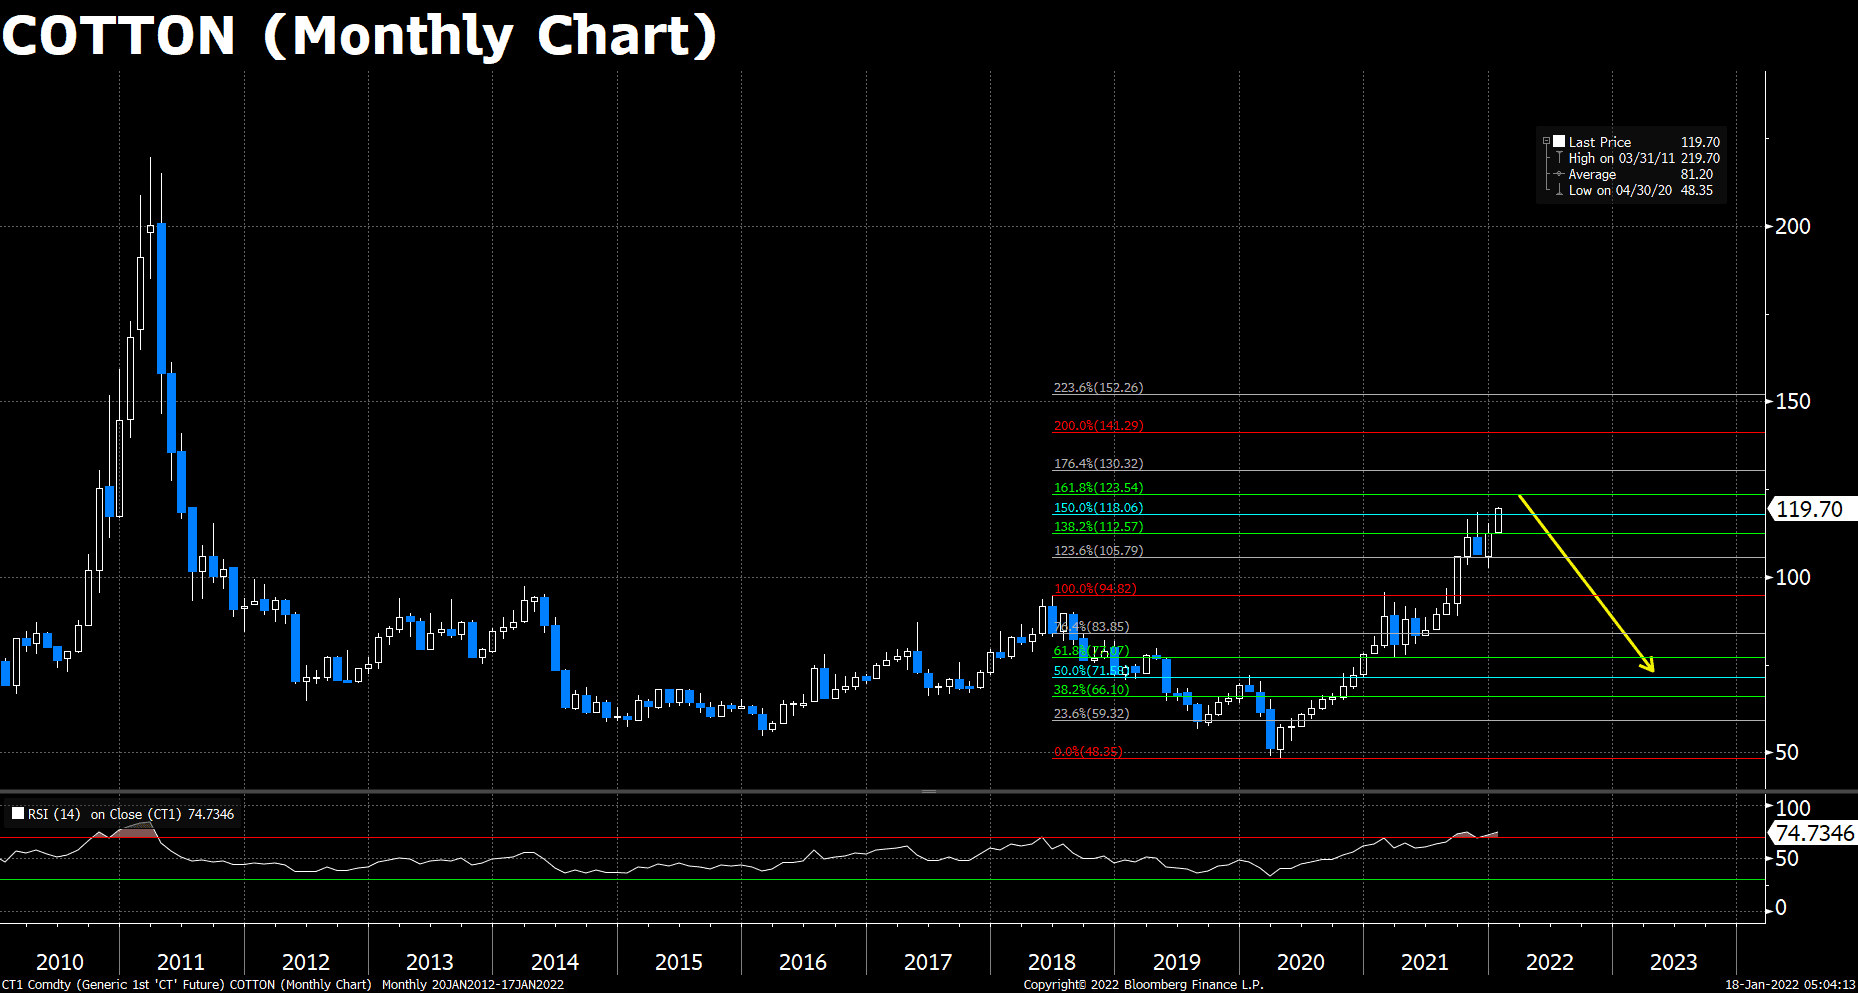
COTTON (Monthly Chart)

Cotton continues trading with a positive bias, and it is for the first time in a decade when cotton prices has fetched the farmers above $100, not to mention the current price near $120. The multi-month price rally was mainly because of the surging demand recovery post-COVID, followed by a drastic fall in production due to unfavorable weather conditions. However due to expensive offers, there are chances of an increase in selling interest as the market prices are quite lucrative profits. That is, a correction is expected in the next few weeks.

On the technical, cotton prices have breached the 150% Fibonacci and are approaching the 161.8% resistance. The RSI reads 74.73, suggesting that cotton has been highly overbought, and the cotton price is highly likely to experience a correction in the near term. We expect the price of the cotton to drop to around $95 if it is blocked by the 161.8% or 176.4% Fibonacci, and the price will further decline to normal (around $66) around 2022 Autumn, when the season for cotton harvest begins.

Resistance: 123 (161.8% Fib), 130 (176.4% Fib)

Support: 105 (123.6% Fib), 95 (100% Fib)


Natural Gas (Daily Chart)

In last week’s trading, natural gas price surged to monthly highs around $4.80, though it dropped sharply in the coming days, the price actions remain above $4.00 per MMBtu. Recent volatility in the natural gas price derived from the winter weather expectations, the potential for extreme weather events such as the latest cold snap in northeast America, and a rise in demand for natural gas imports in Europe and Asia. As the supply chain bottleneck is expected to ease at the second half of 2022, the natural gas demand is likely to remain resilient in the short term, but will slightly fall once the supply catch up with the demand.

As to technical, natural gas prices have broken through its past resistance $4.00, once bounced off the next resistance at $4.80, and linger around $4.20 per MMBtu as of writing. The price action is now above its 20 and 200 DMA, and just slightly below the 50 one. The RSI reads 53.13, suggesting a neutral-to-bullish sentiment. The uptrend of the pair seems convincing, eyeing on the $4.80 price level.

Resistance: 4.80, 5.50

Support: 4.20, 4.00, 3.55


Economic Data:

Currency

Data

Time (GMT + 8)

Forecast

JPY

BoJ Monetary Policy Statement

Tentative

JPY

BoJ Outlook Report (YoY)

Tentative

JPY

BoJ Press Conference

Tentative

GBP

Average Earnings Index +Bonus (Nov)

15:00

4.2%

GBP

Claimant Count Change (Dec)

15:00

-38.6 K

EUR

German ZEW Economic Sentiment (Jan)

18:00

32.0

Market Focus

The broad U.S. equity market close the week mixed. The Dow Jones Industrial Average retreated 0.56% to close at 35911.81, the S&P 500 gained 0.8% to close at 4662.85, and the Nasdaq composite gained 0.59% to close at 14893.75. This week marks the beginning of earnings season, as companies release Q4 results from 2021. Goldman Sachs and Bank of America are among the bigger companies that will be releasing earning results this week, then followed by Netflix and Procter and Gamble. The benchmark U.S. 10 year treasury yield remains at 1.793%, while the 30 year treasury yield sits at 2.127%.

一張含有 文字 的圖片

自動產生的描述

On this week’s economic docket, China’s GDP figures, Britain’s CPI and unemployment data, the Eurozone’s CPI data, and U.S. Initial Jobless claims figures are due for release. The U.S. equity markets will be closed on Monday, due to Dr. Martin Luther King’s day.


Main Pairs Movement:

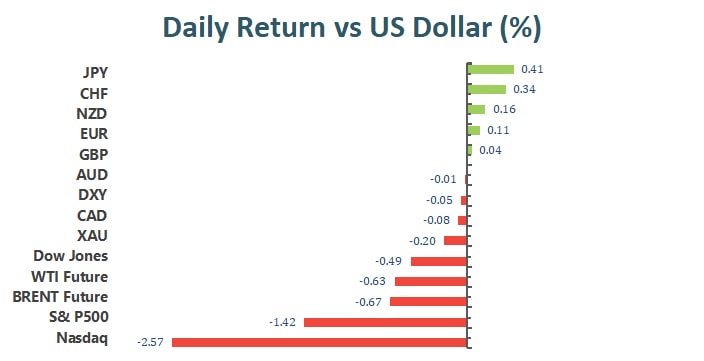
The Dollar Index rose 0.32% over the course of Friday’s trading. The Dollar rose amid weaker than expected retail sales figures. Market participants may have interpreted the weak retail sales figure as a signal to a weaker U.S. economic environment, however with imminent rate hikes on the horizon and continuously rising bond yield’s the Dollar seems unstoppable.

Cable lost 0.23% over the course of Friday’s trading. Britain’s better than expected quarterly GDP growth did not provide enough upward momentum for the Pound, but Cable ended the week with a solid 0.71% gain.

The Euro-Dollar pair retreated 0.35% over the course of Friday’s trading. The ECB’s president failed to provide any fuel to the recovery of the Euro.

Gold also faltered against the Dollar on Friday. The precious metal lost 0.27% against the Dollar.


Technical Analysis:

GBPUSD (Daily Chart)

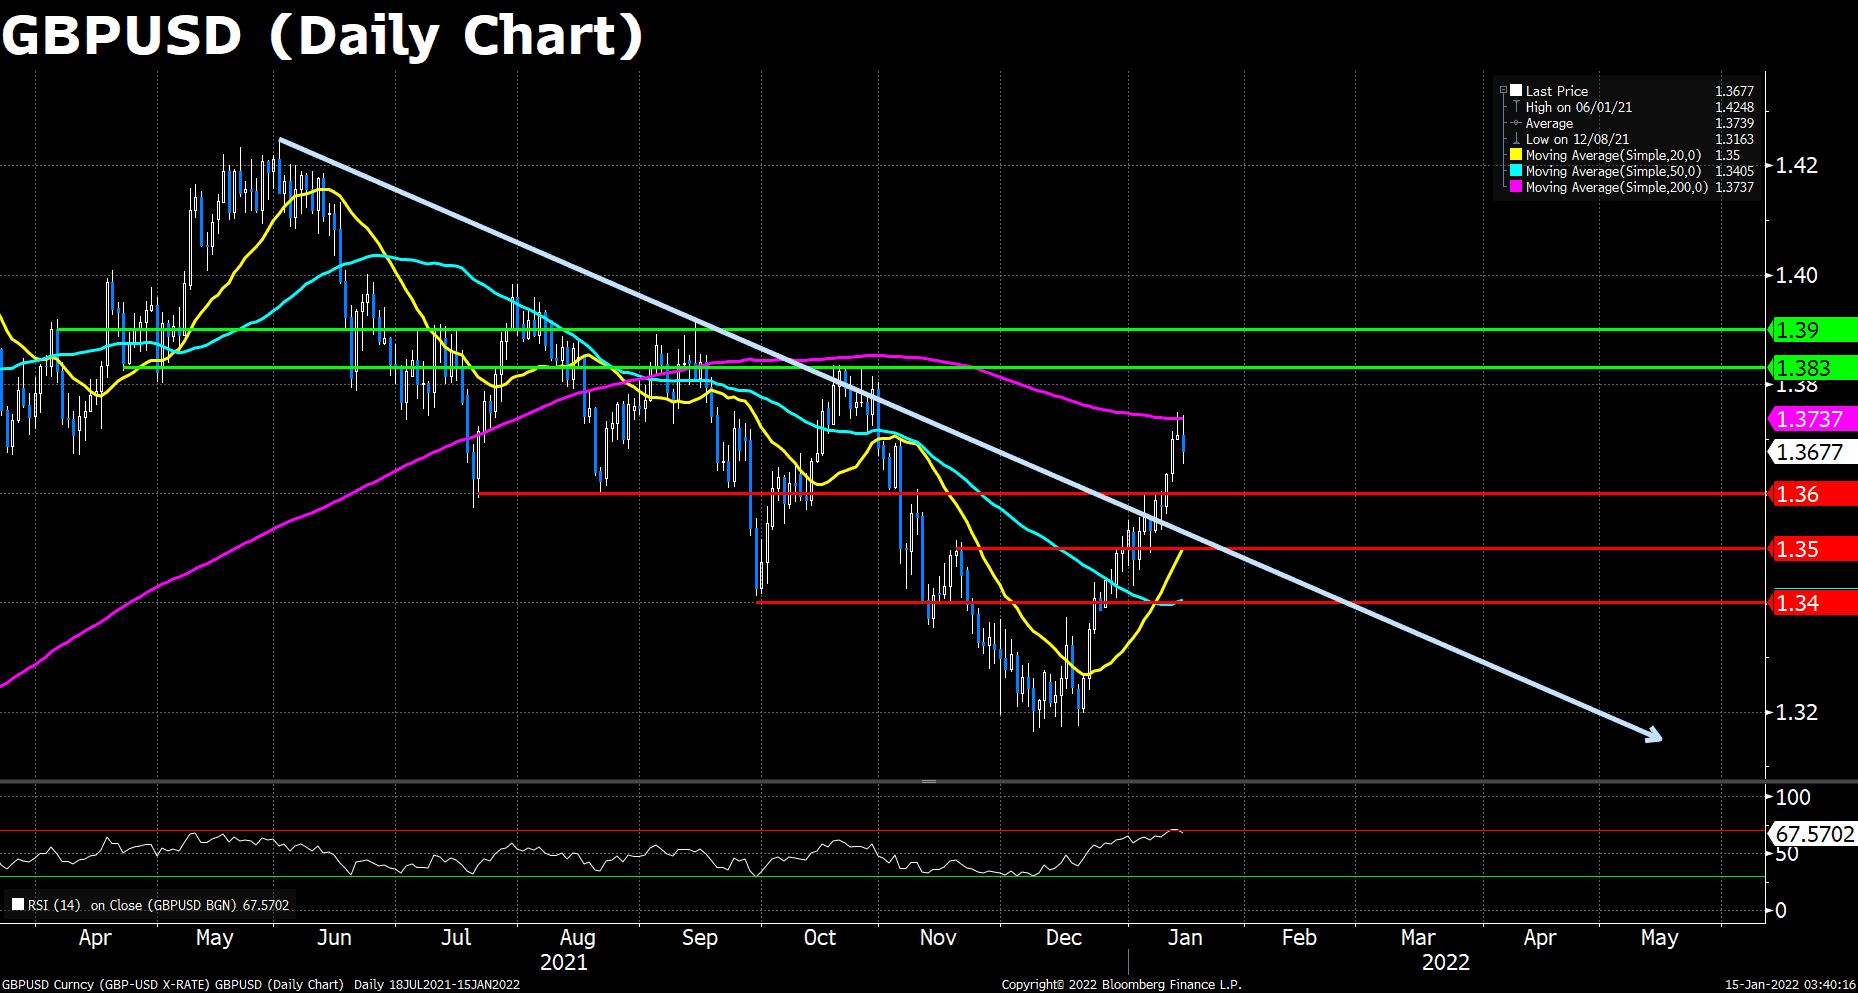
On Friday, a pack of solid UK macroeconomic data failed to underpin the British pound, which struggled to cling to the 1.3700 figure, falling during the New York session. At the time of writing, the GBP/USD is trading at 1.3675. It is worth noting that the US Dollar Index reclaimed the 95.00 level, up some 0.25%, sitting at 95.05, underpinned by the rise of the US 10-year T-bond yield, up to 1.75%, a three basis points gain. Moreover, the dismal sentiment in the equity markets revived the demand for safe haven assets, which is also in favor of the greenback.

On the technical front, after being rejected by the persistent 200 DMA resistance, Cable keep falling during Friday’s trading, heading to the next support line at 1.3600. The RSI for the pair reads 67.44, dropped out from the overbought territory, but not necessarily will the pair bounced back as the dollar starts to price in the effect of the rate hike announcements by Fed.

Resistance: 1.3737 (200 DMA), 1.3830, 1.3900

Support: 1.3600, 1.3500, 1.3400


EURUSD (Daily Chart)

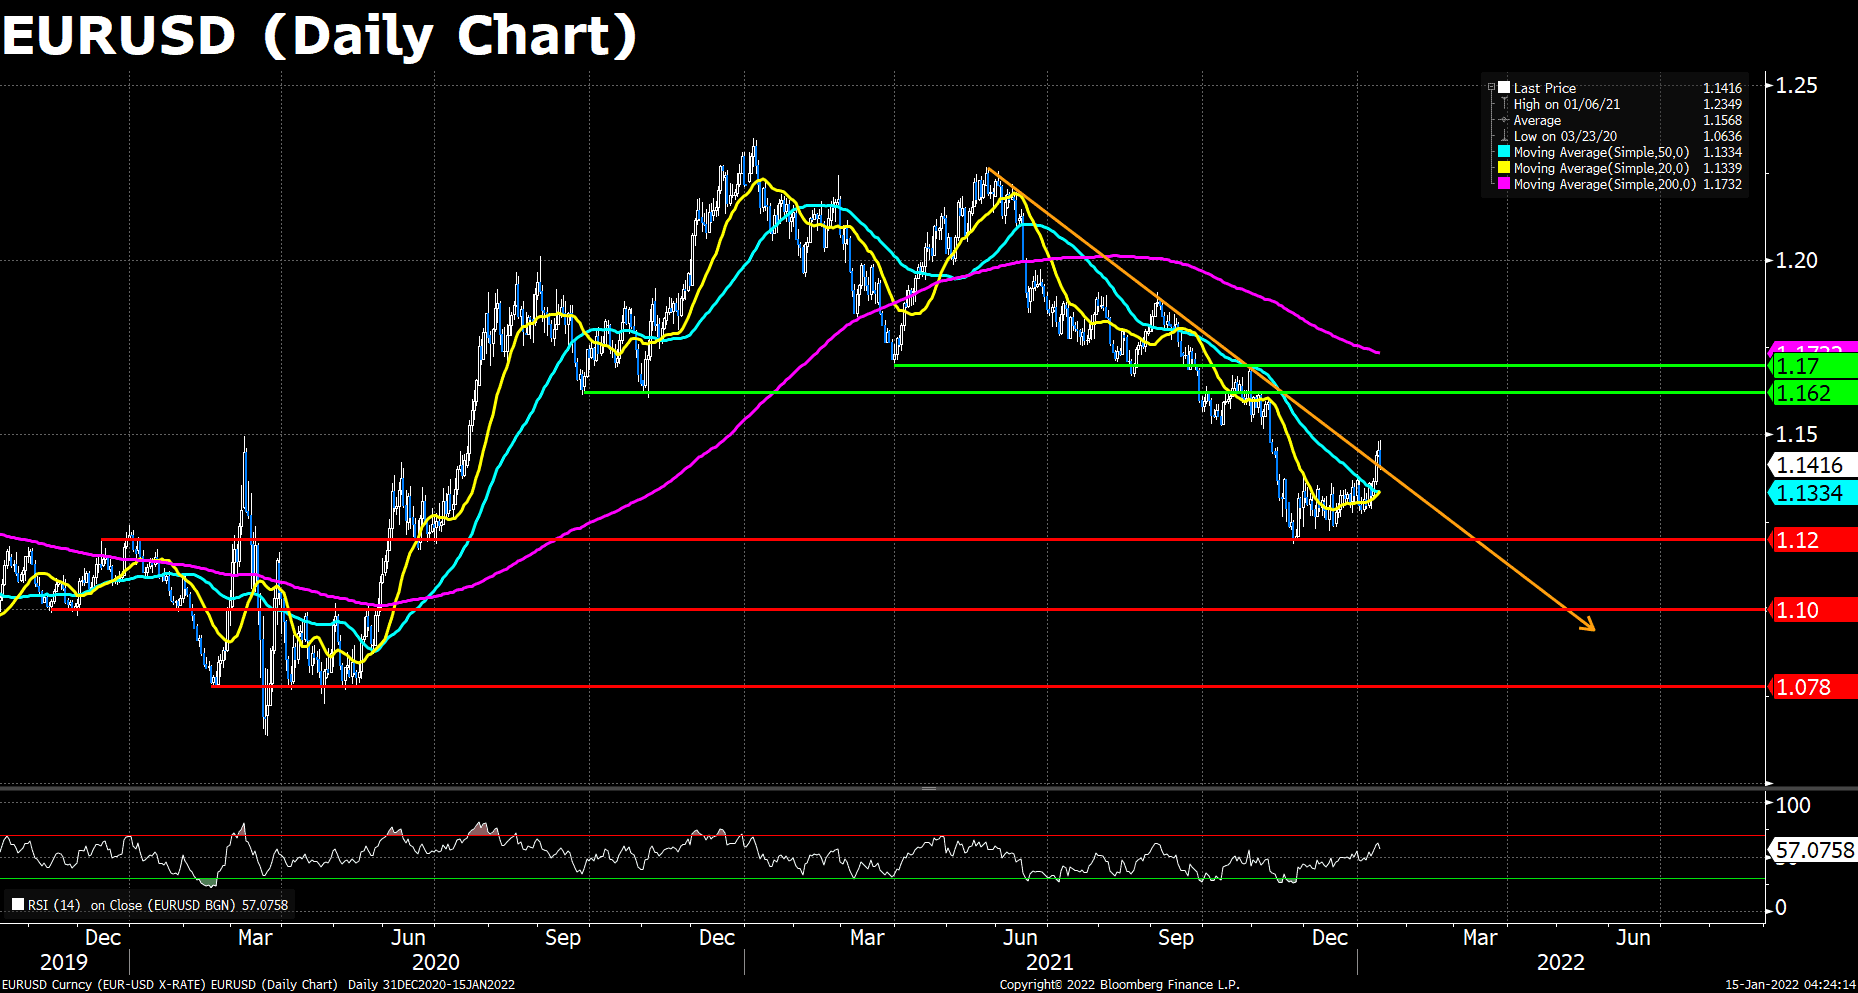
The Euro selling has continued into the North American session, though the bearish intra-day momentum has for the moment eased with the pair finding support above the psychologically important 1.1400 figure. At current levels around the 1.1415 mark, the pair is trading lower by about 0.4% and is over 0.6% lower versus its month highs in the 1.1480s. Apparently, the downbeat US data released on Friday didn’t scare of the dollar bulls, as they bet the Fed will focus more on the elevating inflation and the tight labour market, rather than a monthly Retails Sales or a non-deadly Omicron spread.

On the technical, Euro bears once tested the 1.1400 support but was rejected. The pair lingers around 1.1415 at the moment, and as the dollar strengthened, the downside risk increased. The RSI for EUR/USD has dropped from the 60s, suggesting the upside traction is diminishing. As previously mentioned, If the pair managed to cling on the 1.1400 threshold at the end of the week, then we could expected the pair to reach the next resistance level at 1.620; however, if failed, the looming Fed’s hawish monetary policies may push the dollar up, again dragging the Euro pair to the downside.

Resistance: 1.1620, 1.1700

Support: 1.1200, 1.1000, 1.0780


XAUUSD (Daily Chart)

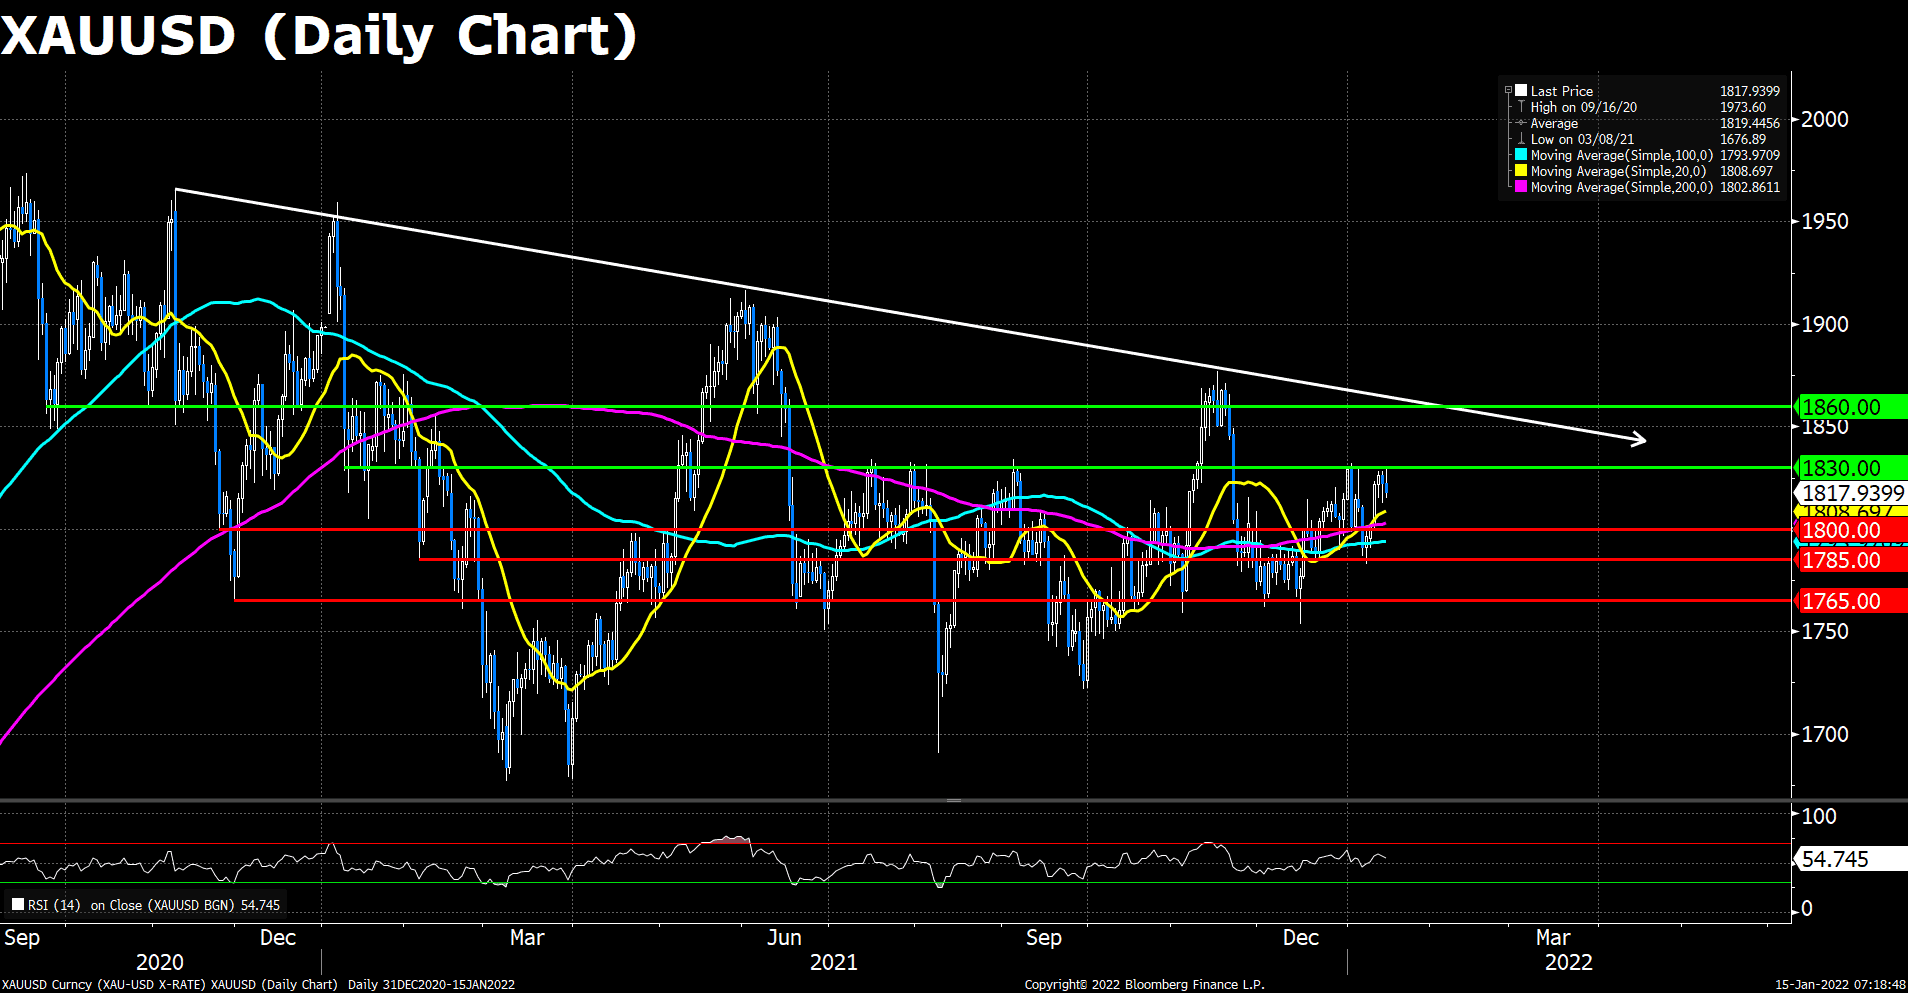
Gold slipped for the second-consecutive day amid dismal US economic data revealed on Friday. XAU/USD closed the day at $1,818 a troy ounce. During the New York trading hours, Gold failed to capitalize on negative readings on US Retail Sales and Industrial Production, and disappointing Consumer Sentiment. In the meantime, the US 10-year benchmark yield advances firmly five basis points, sitting at 1.771%, heading to the weekly highs around 1.80%.

As to technical, market sentiments toward the yellow metal remains the slight optimism since Wednesday. However, the revived dollar strength is weighing on the yellow metal, as it makes the Dollar a better safe-haven assets than the Golds. The RSI for Gold reads 54.75, showing that the demand for gold remains positive. The pair now lies above its 20, 50 and 200 DMAs.

Resistance: 1830, 1860

Support: 1800, 1785, 1765


Economic Data:

Currency

Data

Time (GMT + 8)

Forecast

CNY

GDP (YoY) (Q4)

10:00

3.6%

CNY

Industrial Production (YoY) (Dec)

10:00

3.6%

EUR

CPI (YoY) (Dec)

18:00

4.9%

Market Focus

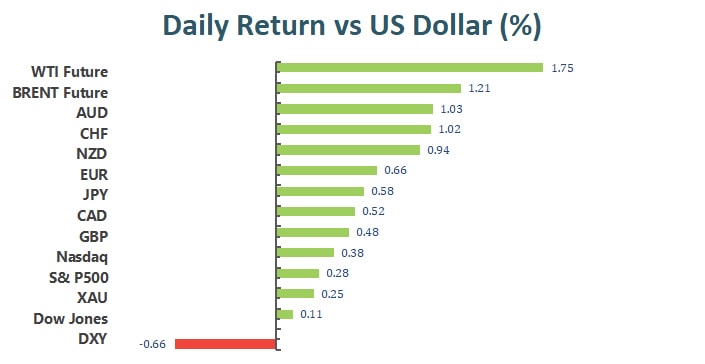
In two economic data releases on Thursday, the PPI rose 0.2%, well below expectations and down from a 1.0% gain in November. In the labor market, weekly jobless claims unexpectedly rose by 23,000, with economists citing the effect of the Omicron variable. The three major indexes ended lower on Thursday, with the Nasdaq leading a 2.5% loss, as investors took profits, especially in tech stocks after a three-day rally, while several Fed officials talked about inflation and interest rate hikes. At the end of the market, the Dow Jones Industrial Average slipped 0.5% to 36,113.63 points, the S&P 500 index fell 1.4% to 4,659.02 and the Nasdaq Composite Index lost 2.5% to 14806.81. The top performers in the Dow Jones Industrial Average were Boeing, up 2.97%, Caterpillar, up 2.07%, and Walmart, up 1.42%. The worst performers in the session were Microsoft, down 4.23%, Salesforce, fell 3.87%, and Apple, lost 1.90%.

一張含有 文字 的圖片

自動產生的描述

Rate-sensitive growth stocks such as technology have lagged market indexes. Among the S&P 500 sectors, the biggest losers on the day were technology, down 2.7%, the consumer discretionary index fell 2% and health care fell 1.63%. The best performers in the S&P 500 were Biogen, up 5.03%, Kroger up 4.96% and American Airlines Group up 4.54%. The worst performers were ServiceNow, down 9.31%, Lumen Technologies down 7.67% and Bio-Techne down 7.16%. On the other hand, in the health care sector, Moderna down more than 5%.


Main Pairs Movement:

The dollar continued its losses on Thursday but weakening risk appetite prevented the greenback from falling further. The dollar’s intraday gains helped correct oversold conditions reached after Wednesday’s sell-off. The dollar index fell 0.2% to 94.791, its lowest since Nov. 10.

Sterling rose 0.11% to $1.372, its highest level since late October, as traders believed the UK economy could withstand a surge in COVID-19 cases and the Bank of England could raise interest rates again as early as next month.

EUR/USD hit 1.1481 and closed near 1.1460. The European economy is adapting to the coronavirus pandemic, ECB Deputy President Luis de Guindos said, and he expects inflation to fall below the ECB’s target in 2023 and 2024.

Gold retreated slightly to settle at around $1,820 an ounce, while crude oil prices were weighed down by weakness in equities, with WTI at $81.70 a barrel and Brent at $84.07 a barrel.


Technical Analysis:

GBPUSD (Daily Chart)

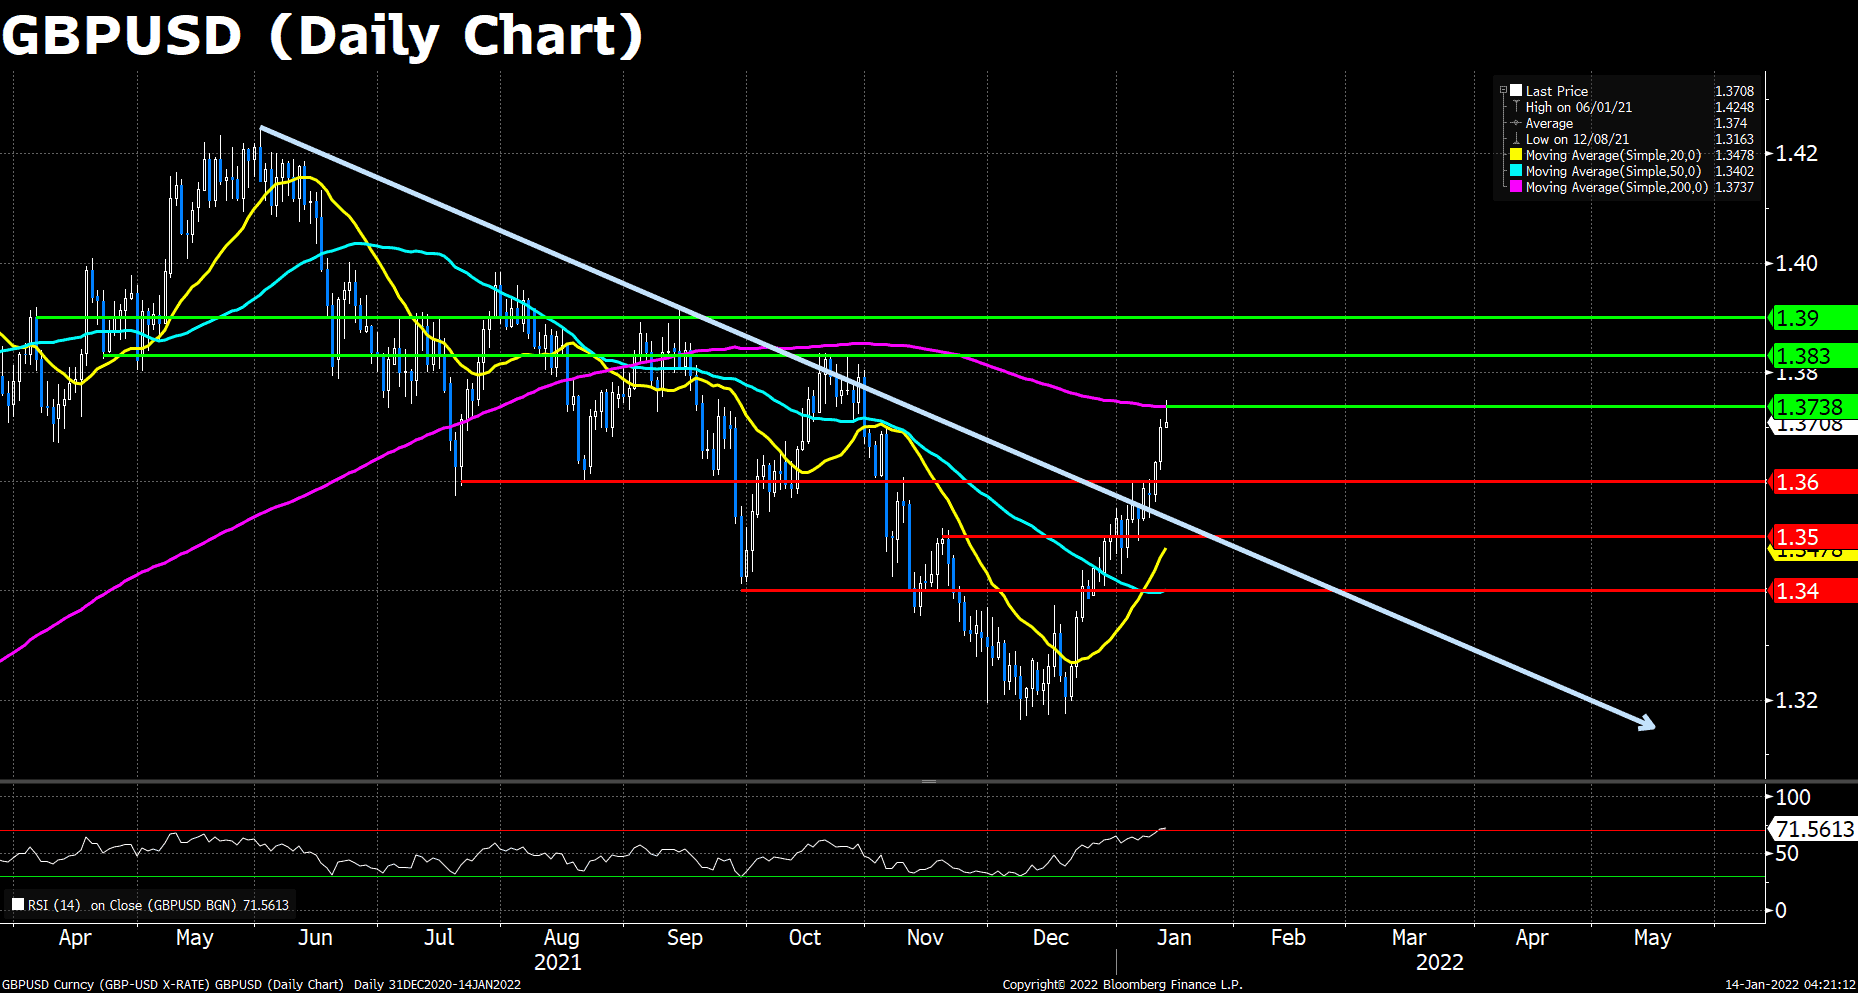
Cable surged for yet another day amid the weakness of the US dollar. The pair touched the daily high at 1.3749, and now trades at around 1.3708 as of writing. It is said that the recent rally of the non-US currencies was due to a squeeze on the market’s excessive long-dollar positioning, as the recent depreciation of the Greenback has seemingly gone against the fundamentals.

On the technical front, the robust 200 DMA resistance forced Cable into a retracement back down just before mid-day on Thursday. The consolidating decline appeared to find support in Wednesday’s close near the 1.3700 level. The RSI for the pair reads 71.56, further into the overbought territory, indicating a near-term correction seemingly inevitable. Despite the potential headwinds, we believed that there’s still rooms for the Pound’s upside in the short term as long as the GBP/USD pair closed the week above its 200 DMA, but further catalysts are needed for the mid-to-long term growth of the Cable.

Resistance:  1.3738 (200 DMA), 1.3830, 1.3900

Support:  1.3600, 1.3500, 1.3400


EURUSD (Daily Chart)

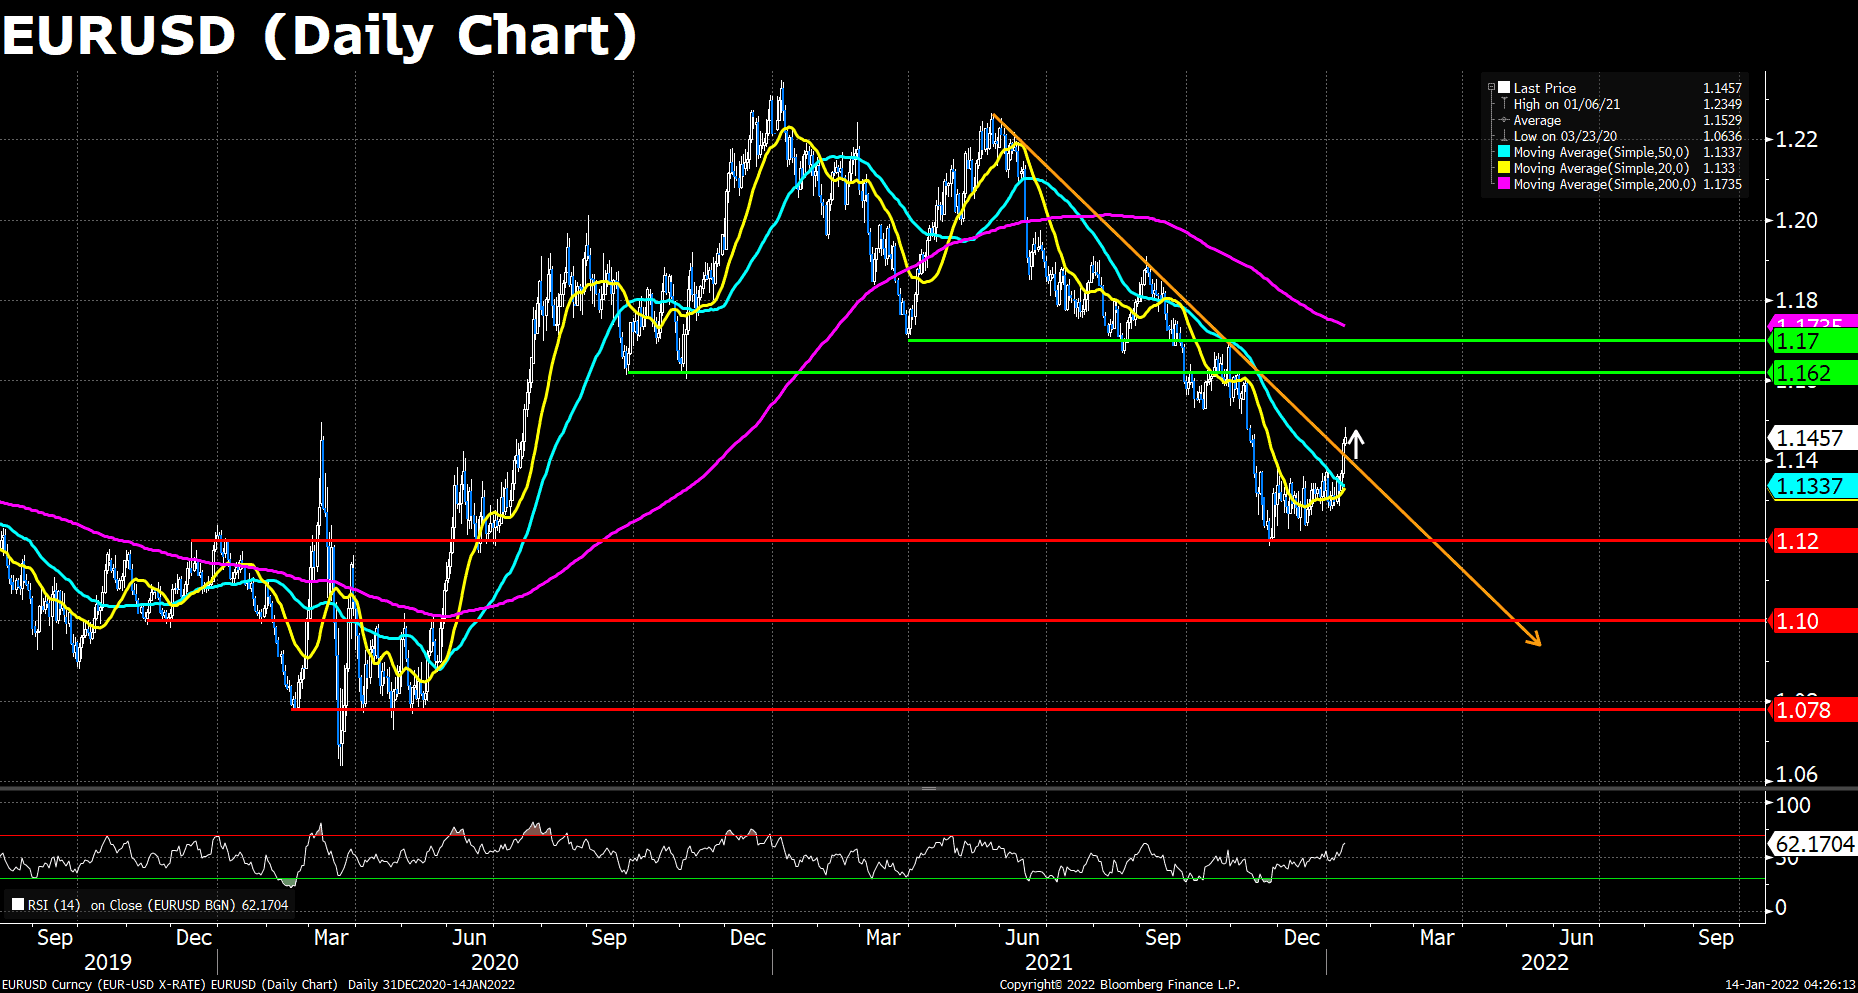
The EUR/USD pair advanced for the third consecutive day amid the worse-than-anticipated US Initial Jobless Claims and December PPI. The ECB Vice President Luis de Guindos said the European economy is getting used to the coronavirus, adding that “perhaps inflation won’t be as transitory as forecast only some months ago.” Although he expects inflation to stay below the ECB’s target in 2023 and 2024, the investors still bet an early rate hike from the ECB when the inflation loses control.

On the technical, the Euro pair went up to around 1.1460 during today’s trading, but the upside momentum seems diminishing. The RSI for EUR/USD is still above 60, suggesting the bulls are still in hope. If the pair managed to cling on the 1.1400 threshold at the end of the week, then we could expected the pair to reach the next resistance level at 1.620; however, if failed, the looming Fed’s hawish monetary policies may push the dollar up, again dragging the Euro pair to the downside.

Resistance: 1.1620, 1.1700

Support: 1.1200, 1.1000, 1.0780


XAUUSD (Daily Chart)

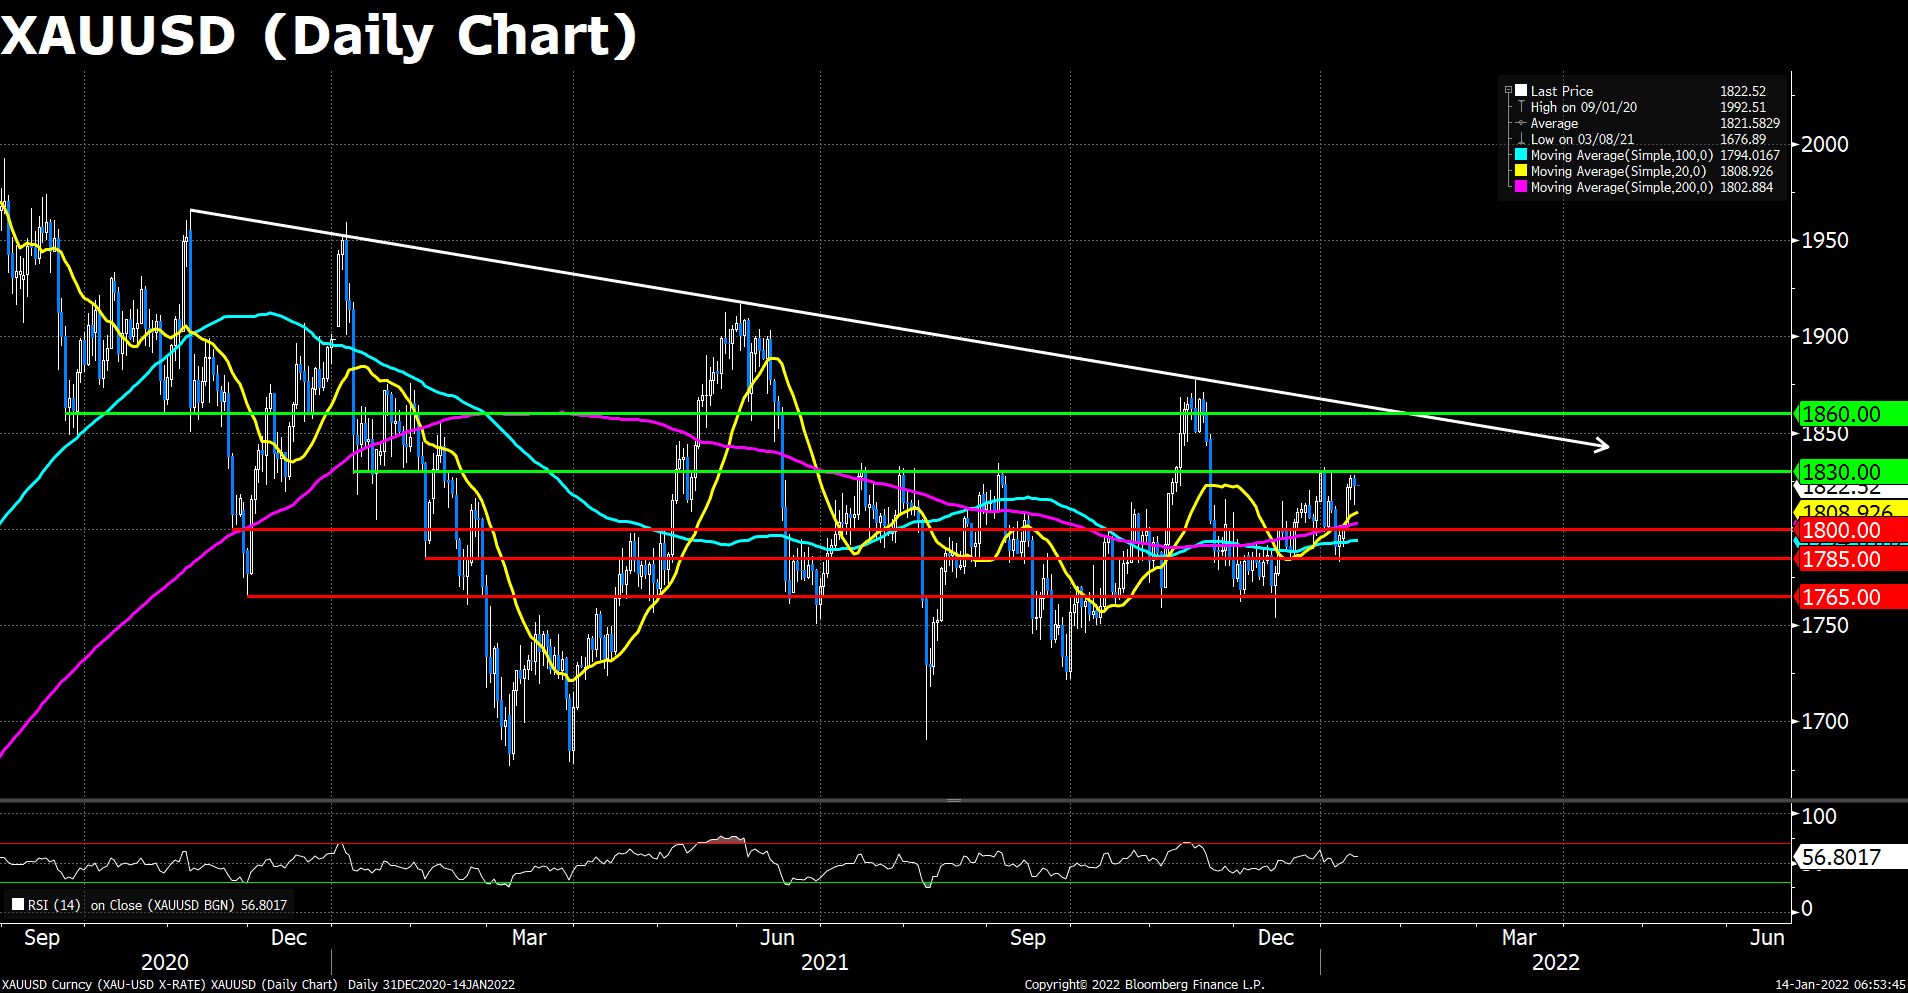
XAU/USD have pared back from early European session highs at the $1,828 mark in more recent trade though have for the most part remained support above $1,820. Some traders have been disappointed at gold’s struggles to benefit from this week’s run of US dollar weakness. The winning streak has run out of steam ahead of this year’s $1830 highs.

As to technical, market sentiments toward the yellow metal remains a slight optimism. The remaining dollar weakness and the dismal equity markets underpinned the gold’s price at the short-term support $1,820. The RSI for gold reads 56.80, showing that the demand for gold still strong. The pair now lies above its 20, 50 and 200 DMAs.

Resistance: 1830, 1860

Support: 1800, 1785, 1765


Economic Data:

Currency

Data

Time (GMT + 8)

Forecast

GBP

GDP (MoM)

15:00

GBP

Manufacturing Production (MoM) (Nov)

15:00

0.2%

GBP

Monthly GDP 3M/3M Change

15:00

USD

Core Retail Sales (MoM) (Dec)

21:30

0.2%

USD

Retail Sales (MoM) (Dec)

21:30

-0.1%

EUR

ECB President Lagarde Speaks

21:30

VT Markets The Adjustment Of Weekly Dividend Notification

Dear Client,

Warmly reminds you that the component stocks in the stock index spot generate dividends. When dividends are distributed, VT Markets will make dividends and deductions for the clients who hold the trading products after the close of the day before the ex-dividend date.

Indices dividends will not be paid/charged as an inclusion along with the swap component. It will be executed separately through a balance statement directly to your trading account, the comment for which will be in the following format “Div & Product Name & Net Volume ” .

Please note the specific adjustments as follows:

Note: The above data is for reference only, the actual execution data may be changed, please refer to the MT4/MT5 software for details.

If you’d like more information, please don’t hesitate to contact [email protected].

VT Markets Notification of Server Upgrade

Dear Client,

As part of our commitment to provide the best reliability and service to our client, we are planning an upgrade to our server on January 15th, 2022.

As a result, we will be conducting maintenance according to the schedule below.

Start date and time: 2022-01-15 02:00 GMT+2 (Server time)
End date and time: 2022-01-15 17:00 GMT+2 (Server time)

Kindly be reminded that the following things might be affected during this maintenance period:

1. The login and operation of the client portal

2. The login of the trading account

3. The quotations of products will be paused. Clients might not be able to open new positions or close the held positions.

4. There might be a gap between the original price and the price after maintenance. Pending orders, Stop Loss, and Take Profit settings within the gap will be filled at the market price after maintenance ends.

After the upgrade, clients can login to trading account using the server which is shown in the account activation mail.

No action is required by our client. Your service will be back online after the maintenance is completed.

Thank you for your patience and understanding with regard to this important initiative.

If you’d like more information, please don’t hesitate to contact [email protected].

Market Focus

The consumer price index rose 0.5% in December, slightly above expectations, taking the year-over-year consumer price index increase to 7% through December, in line with expectations and the fastest pace of growth since 1982. A drop in longer-dated U.S. Treasury yields on Wednesday also helped for most stock sectors. A sharp rise in U.S. 10-year yields has weighed on stocks in recent weeks, especially in interest-rate-sensitive growth sectors such as technology. At the end of the market, the Dow Jones Industrial Average rose 0.11% to 36,290.32 points, the S&P 500 index rose 0.28% to 4,726.35 and the Nasdaq Composite Index added 0.23% to 15,188.39 points.

一張含有 文字 的圖片

自動產生的描述

Among the S&P 500 sectors, the biggest gainer on the day was materials, up nearly 1%, consumer discretionary up 0.6% and technology up 0.4%, while healthcare was the only loser. In the tech sector,

Tesla rose 3.9%, ahead of Microsoft, Google, the latter rose more than 1%. The healthcare index was weighed down by shares of drugmakers Eli Lilly and Biogen, which fell 2.4% and 6.7%, respectively. On the other hand, the biggest drags on the Dow on the day were Goldman Sachs, down 3% on the day, Morgan Stanley down 2.7% and their smaller rival Jefferies down 9% after missing quarterly earnings estimates .


Main Pairs Movement:

The dollar plummeted and fell to a two-month low after the release of U.S. inflation data. December CPI was confirmed as expected at 7% year-on-year growth, while the core reading beat expectations by a whopping 5.5%. The news usually sparks risk aversion, but this time it had the opposite effect. Because the data failed to provide any new impetus to the Fed’s policy normalization efforts. At the end, the dollar index was down 0.7 % at 94.987, after falling to 94.907, its lowest since Nov. 11.

Sterling rallied on a weaker dollar and continued to move north, having jumped to the 1.3700 level, its highest level since October.

EUR/USD also gained momentum from a weaker dollar, breaking out of a consolidation zone to hit 1.1400, its highest level since November.

Gold edged higher to settle at around $1,827 per ounce. Crude oil prices also rose, with WTI at $82.60 a barrel and Brent at $84.72 a barrel.


Technical Analysis:

GBPUSD (Daily Chart)

Cable extended further north during the Wednesday’s trades and is eyeing on the next resistance level at 1.3830. The pair consolidated around the similar levels in the Asian and European session, and surged aggressively after the US CPI data released, which is generally in line with the expectations and thus pushed the rate sensitive currencies like Sterling to gain value. The pair now trades at around 1.3707, up around 0.44% from today’s open price.

On the technical front, GBP/USD price has been further away the long-term downside trajectory and is heading to its 200 DMA. The RSI indicator has just entered the overbought territory, and the correction pressure is expected to appear at around 1.3700. Cable is now experiencing a stream of short term optimistic buying amid the dollar’s weakness, and this risk-off market mood may last until March when the scheduled US rate hike is in effect.

Resistance:  1.3830, 1.3900

Support:  1.3600, 1.3500, 1.3400


EURUSD (Daily Chart)

After two months’ consolidation, the euro pair finally crossed over the robust 1.1400 resistance as the decent US CPI data lowered the investors’ guard about additional tightening potentials from the Fed. Despite no news from the ECB, market participants seem to bet high inflation and the spillover effect of the Fed’s dynamic will force the ECB to act. This is providing the shared currency with some degree of support by limiting the extent of US – euro area rates discrepancy.

On the technical, the Euro pair surprisingly managed to break through the persistent downtrend line and the meaningful 1.1400 resistance. We can see that the RSI for EUR/USD have come above 60, indicating an overall bullish sentiment around the market. If the pair successfully closed beyond the 1.1400 threshold at the end of the week, then a fresh upside trend could be confirmed, heading the pair all the way to the next resistance level at 1.620; however, if failed, Euro will be back to the previous consolidation phase and keep falling in the near future when Fed raise rates.

Resistance: 1.1620, 1.1700

Support: 1.1200, 1.1000, 1.0780


XAUUSD (Daily Chart)

XAU/USD buoyed for the fourth consecutive day as the revealed US inflation is generally as expected, easing the rates hike fears and causing a decline to the US yields. The US 10-year Treasury yield is down almost two basis points, weighing on the greenback. At the time of writing, gold is trading at $1,826 per troy ounce post New York trading hours.

As to technical, Gold’s price seems to be neutral-bullish biased, but downside risks remain, with the long-term downward sloping resistance still capping its upside outlook. The continuation of the dollar weakness and the cautious market mood keep pushing gold price to its resistance at $1,830. The RSI for gold reads 58.92, showing that there are still rooms for the gold’s uplift. The pair now lies above its 20, 50 and 200 DMAs.

Resistance: 1830, 1860

Support: 1800, 1785, 1765


Economic Data:

Currency

Data

Time (GMT + 8)

Forecast

USD

Initial Jobless Claims

21:30

200 K

USD

PPI (MoM) (Dec)

21:30

0.4%

Back To Top
server

Hello there 👋

How can I help you?

Chat with our team instantly

Live Chat

Start a live conversation through...

  • Telegram
    hold On hold
  • Coming Soon...

Hello there 👋

How can I help you?

telegram

Scan the QR code with your smartphone to start a chat with us, or click here.

Don’t have the Telegram App or Desktop installed? Use Web Telegram instead.

QR code