Although this month was a favorable month for US equity, quarterly it decreased mostly owing to the FED’s threat to reduce inflation and affected by conflict situations in Ukraine. According to MT4 VT Markets data, the SP500 was down 1.32 percent daily and down 5 percent quarterly, the NAS100 was down 1.22 percent and down 9.08 percent quarterly, and the DJ30 was down 1.23 percent and down 4.58 percent quarterly.

Source: Shutterstock

Today’s US jobs report will be the market’s focus, as it is one of the statistics that will support a judgment on whether the FED is likely to hike interest rates by 50 basis points in May, to combat increasing inflation. The consumer price index (CPI) reached 7.9 percent, the highest level in 40 years. The FED’s Core PCE statistics jumped to 5.4 percent, significantly over the central bank’s target of 2 percent. Several US central bank governors, including Fed Chair Jerome Powell, have signaled in recent weeks that they are open to the possibility of a 0.5 percent rate hike, so the non-farm employment change data is critical to monitor.

Source: Forex Factory

Many analysts anticipate a 492K gain this month (estimate from forex factory), which is a significant increase but still falls short of last month’s 678K. The unemployment rate is expected to fall to 3.7 percent from 3.8 percent, while average hourly earnings are expected to rise 0.4 percent from 0.0 percent last month.

Main Pairs Movement

Several technology companies continued to fall; AAPL fell 1.04 percent to $175.95, INTEL fell 2.56 percent to $50, NVIDIA fell 0.65 percent to $275.73, and TSLA fell 0.69 percent to $1086. 29

USOUSD (WTI Texas) momentarily dipped below $100, or as much as 5.70 percent, as a result of US President Joe Biden’s directive to unleash US oil reserves and push drillers to raise output.

The USDX (USD Index) plummeted as high as 0.59 percent, signaling that the USD is weakening. However, due to concerns about the conflict in Ukraine, the EURUSD plummeted as much as 0.81 percent on Thursday. Aside from that, there hasn’t been much movement in Major Currencies. The GBP gained ground against the EUR, causing the EURGBP currency pair to fall 0.85 percent.

BTCUSD (Bitcoin) declined 3.18 percent as the market anticipates the release of US jobs data today.

Technical Analysis

GBPUSD (4-Hour Chart)
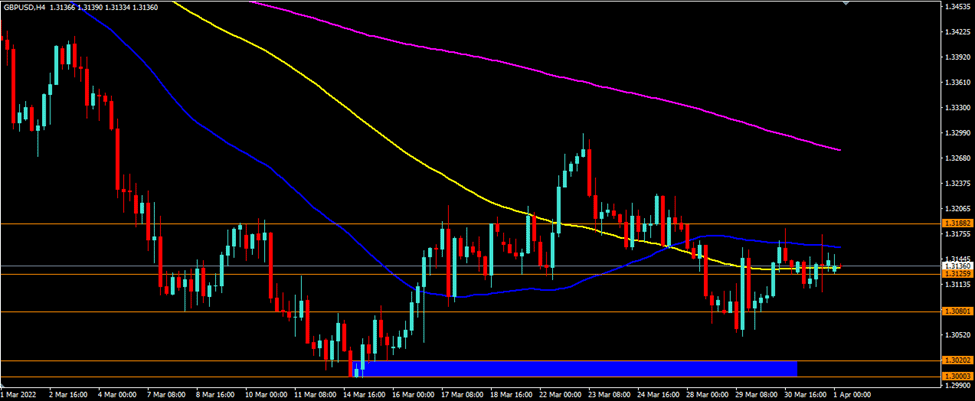
Yesterday, GBPUSD gained ground in the early European session before closing with a gain of only 14.1 pips, or 0.11 percent. GBPUSD is currently trading above the 1.3126 level and is moving pretty flat in anticipation of today’s labor report. Today’s support is around 1.3080, while the resistance is at 1.3188. GBPUSD is trading below its 50-day and 200-day simple moving averages (SMAs) and is hovering around its 100-day SMA on the four-hour chart.

Resistance: 1.3188

Support: 1.3080

EURUSD (4-Hour Chart)

After two days of gains, the EURUSD fell to the previous support level of 1.1070 and subsequently to 1.1040. The resistance levels are 1.1131 and 1.1156. On the four-hour chart, EURUSD is trading above its 50-day and 100-day SMAs but below its 200-day SMA (SMAs).

Resistance: 1.1131. 1.1156

Support: 1.1070, 1.1040

XAUUSD (4-Hour Chart)

The XAUUSD rose somewhat on Thursday, although the market is still waiting for a major move from US jobs data. XAUUSD briefly tested our resistance level of $1948 and is now trading slightly above the $1936 level. Our resistance level is still $1948, with the next one at $1964, and support levels at $1921 and $1910. XAUUSD is now trading below its 100-day simple moving average but above its 50-day and 200-day SMAs on the four-hour chart.

Resistance: $1948, $1964

Support: $1921, $1910

Lesson 1: What does “forex” mean?

Forex – often spelled FX – is an abbreviation for “Foreign Exchange.” Fundamentally, it is similar to a stock exchange in that it is a market where one can exchange multiple currencies worldwide. According to a 2019 triennial report from the Bank for International Settlements (a global bank for national central banks), the daily trading volume for Forex reached $6.6 trillion in April 2019.

What Is the Forex Market?

The foreign exchange market is where currencies are traded. Currencies are important because they allow us to purchase goods and services locally and across borders. International currencies need to be exchanged to conduct foreign trade and business.

If you are living in the United States and want to buy cheese from France, then you or the company from which you buy the cheese must pay the French for the cheese in euros (EUR). The US importer would have to exchange the equivalent value of US dollars (USD) for euros.

You’re travelling from Australia to the United States in our scenario. You have AUD 1,000 to spend on your trip and thus visit a currency exchange to convert your Australian dollars to US dollars.

Assume the exchange rate was 1 AUD to 0.7 USD. This means that for each AUD you hand over to the currency broker, you will receive 0.7 USD in exchange. Given that you have 1,000 Australian dollars, you would obtain US$700 in this exchange.

Unfortunately, some things came up before your scheduled flight to New York, and you couldn’t go. As a result, you cancel your vacation and return to the currency dealer to exchange your US$700 for Australian dollars. To your amazement, the dealer hands you AUD 1,100 – a sum greater than the AU$1000 you had paid.

Consider the possibility that the currency broker made an error. Let us re-examine.

In this case, you made a profit of AUD 100. You originally spent AUD 1,000 to purchase US$700, but now you’re paying the same US$700 and receiving AUD 1,100 in return. That is a brief overview of Forex trading; it is not only about exchanging one currency for another but also about attempting to benefit from it.

In this instance, we profited since the US Dollar rose against the Australian Dollar while we held it. This enabled us to convert our original US$700 for more Australian Dollars than we had previously.

One unique aspect of this international market is that there is no central marketplace for foreign exchange. Instead, currency trading is conducted electronically over the counter (OTC), meaning that all transactions occur via computer networks among traders worldwide rather than on one centralized exchange.

The market is open 24 hours a day, five and a half days a week, and currencies are traded worldwide in the major financial centres of Frankfurt, Hong Kong, London, New York, Paris, Singapore, Sydney, Tokyo, and Zurich—across almost every time zone.

This means that the forex market begins anew when the US trading day ends in Tokyo and Hong Kong. The forex market can be highly active anytime, with price quotes changing constantly.

A Brief History of Forex

In its most basic sense, the forex market has been around for centuries. People have always exchanged or bartered goods and currencies to purchase goods and services. However, as we understand it today, the forex market is a relatively modern invention.

After the Bretton Woods accord began to collapse in 1971, more currencies were allowed to float freely against one another. The values of individual currencies vary based on demand and circulation and are monitored by foreign exchange trading services.

Commercial and investment banks conduct most of the trading in forex markets on behalf of their clients. Still, there are also speculative opportunities for trading one currency against another for professional and individual investors.

There are two distinct features of currencies as an asset class:

  • You can earn the interest rate differential between two currencies.
  • You can profit from changes in the exchange rate.

An investor can profit from the difference between two interest rates in two different economies by buying the currency with the higher interest rate and shorting the currency with the lower interest rate. Before the 2008 financial crisis, shorting the Japanese yen (JPY) and buying British pounds (GBP) was expected because the interest rate differential was huge. This strategy is sometimes referred to as a carry trade.

VT Markets Notification of trading adjustment in holiday

Dear Client,

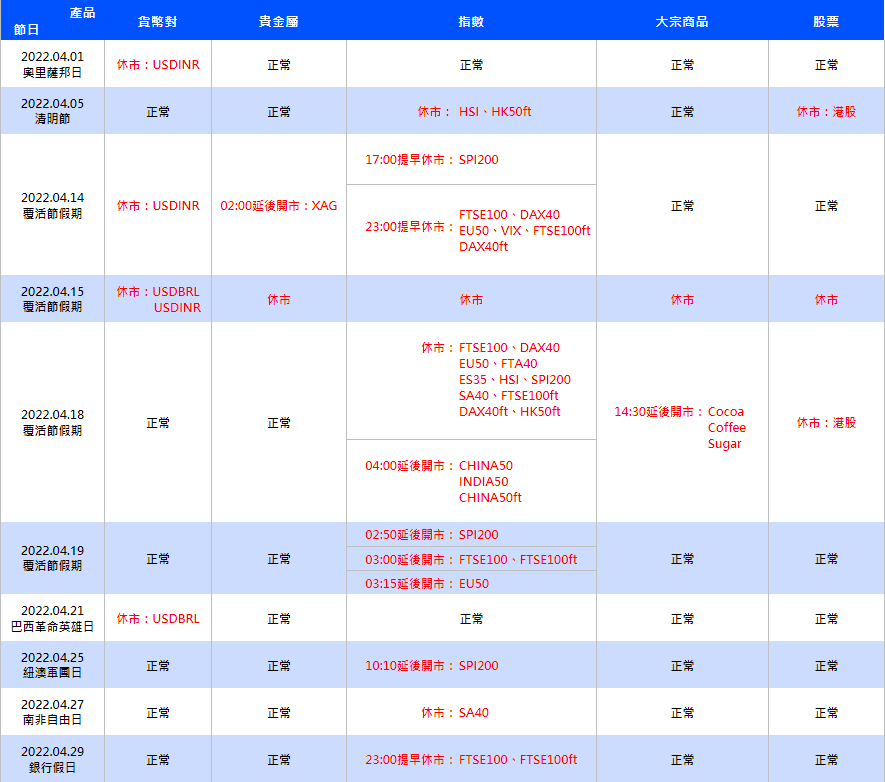
Please note the adjustment on the following products due to the international holiday in April:

The above time is MT4/5 server time. The trading time of other products is not affected. The above data may be subject to change. Please refer to the actual time on MT4/5.

If you have any questions, our team will be happy to answer your questions. Please mail to [email protected] or contact the service online.

VT Markets The Adjustment Of Weekly Dividend Notification

Dear Client:

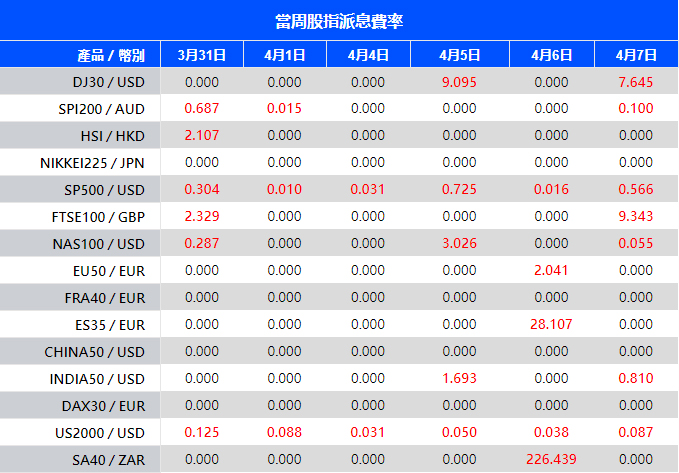
Warmly reminds you that the component stocks in the stock index spot generate dividends. When dividends are distributed, VT Markets will make dividends and deductions for the clients who hold the trading products after the close of the day before the ex-dividend date.

Indices dividends will not be paid/charged as an inclusion along with the swap component. It will be executed separately through a balance statement directly to your trading account, the comment for which will be in the following format “Div & Product Name & Net Volume ”.

Please note the specific adjustments as follows:

Note: The above data is for reference only, the actual execution date may be changed, please refer to the MT4/MT5 software for details.

If you’d like more information, please don’t hesitate to contact [email protected].

US Equity move lower on Wednesday after some days of increases. This is due to the market’s continued focus on the outcome of the meeting between Russia and Ukraine, as well as mixed data from the United States. The SP500 was down 0.42 percent, the NAS100 was down 0.79 percent, and the DJ30 was down 0.08 percent, according to MT4 VT Markets data.

Economic growth appears to be stable in the United States in 2021, as last night’s Final GDP statistics showed 6.9 percent growth, indicating that the Federal Reserve may continue to raise interest rates aggressively this year.

Source: Shutterstock

Several analysts believe that a rapid withdrawal of liquidity will impair domestic and global economic growth in the future, as seen by the inverted yield curve that has occurred since the beginning of this month.

Aside from the Fed’s policies, the capital market was also burdened by high inflation rates produced by rapid money circulation and skyrocketing global oil prices. The next market players will await US job data and inflation figures, which will affirm the US economy’s current strength.

The softening of Russia’s invasion of Ukraine does not indicate that the battle between the two nations has ended, resulting in continued high oil and natural gas prices. This scenario was compounded by Germany’s policy of barring energy imports from Russia, putting more strain on Europe’s economic growth. Due to the scarcity of fuel, both oil and gas, in the European Union zone, inflation rates can rise, posing a risk of a recession on the continent.

Main Pairs Movement

Several technology companies fell after gaining momentum for a few days; AAPL declined 0.82 percent to $177.07 after advancing for 11 consecutive days.

Meanwhile, INTEL and NVIDIA also declined significantly. INTEL lost 1.46 percent to $51.32, while NVIDIA sank 2.33 percent to $276.19.

USOUSD (WTI Texas) finished higher at $106.45, up 2.26 percent, as prospects for a resolution to the Ukraine conflict dwindled.

The USD’s weakness versus several major currencies was triggered by the revelation of data that was not supportive of the USD. This resulted in a 0.65 percent increase in the EURUSD and a 0.82 percent decline in the USDJPY.

Technical Analysis

GBPUSD (4-Hour Chart)

On Wednesday, the GBPUSD rose further, breaking past the resistance level at 1.3126 and approaching the next resistance level at 1.3188. GBPUSD is now attempting to trade within a broader range of 1.3080 to 1.3188. On the four-hour chart, GBPUSD is trading below its 50-day and 200-day simple moving averages (SMAs) and slightly above its 100-day SMA.

Resistance: 1.3188

Support: 1.3080

EURUSD (4-Hour Chart)

EURUSD strengthened more and broke through our Resistance levels with 1.1221 and 1.1245 are the following resistance levels. In terms of support, we see that previous resistance levels 1.1131 and 1.1156 revert to become the support levels. EURUSD is trading above its 50-day, 100-day, and 200-day simple moving averages on the four-hour chart (SMAs).

Resistance: 1.1221. 1.1245

Support: 1.1131, 1.1156

XAUUSD (4-Hour Chart)

XAUUSD gained up to 0.70 percent following a break of our resistance level at $1936. Currently, XAUUSD is awaiting the release of US labor statistics and updates on the condition of the Russia-Ukraine conflict. At the moment, the movement is seen between $1921 and $1936, with the possibility of breaking through the barrier at $1936. If it breaches $1936, the next resistance levels will be $1948 and $1964, while if it breaches $1921, the next support levels will be $1910 and $1893. On the four-hour chart, XAUUSD is presently trading below its 50- and 100-day simple moving averages, and while it is currently above them, it appears to be attempting to break below its 200-day SMA.

Resistance: $1936, $1948, $1964

Support: $1921, $1910, $1893

VT Markets Notification of US stock trading conditions optimization

Dear clients:

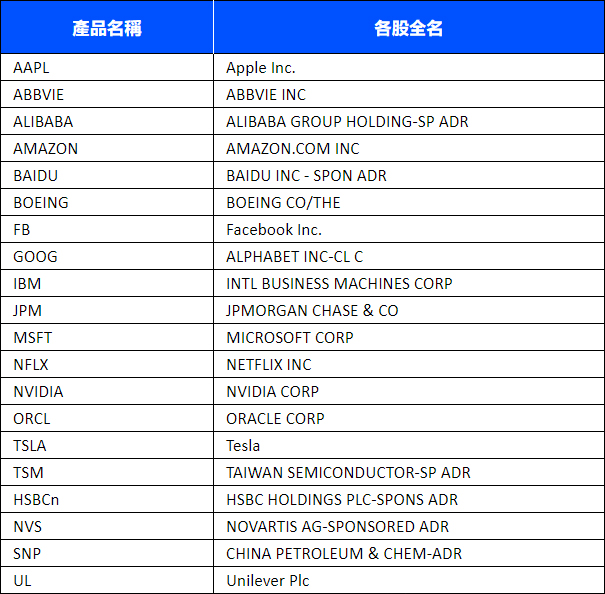
VT Markets continues to optimize the trading environment and expand our global business. We are honoured to announce that the trading fees for some popular US stock products have been optimized recently.

All VT Markets clients can trade the 20 U.S. stock contracts listed in the table below on the preferential terms of 0 commission from March 28th.

Note: The above data is for reference only, the actual execution date may be changed, please refer to the MT4/MT5 software for details.

If you’d like more information, please don’t hesitate to contact [email protected] or contact us via the official website live chat.

On Tuesday, US equity markets climbed significantly as a result of Russia’s determination to engage in talks with Ukraine and begin reducing troop operations surrounding the city of Kyiv. The S&P 500 index increased by 1.13 percent, the Nasdaq 100 increased by 1.62 percent, and the Dow Jones Industrial Average increased by 0.90 percent.

On the other hand, market players continue to be concerned about the potential of recession, owing to the higher short-term US bond yields relative to long-term US bond yields. While the 2-year yield on US Treasuries is technically equal to the 10-year yield, the intersection of the 5-year yield curve has exceeded the 10-year or even 30-year yield, as it did in 2006, precipitating the Great Recession in 2008.

This existence will undoubtedly weaken the US Dollar index in the future, but it will rebound again as a result of the Fed’s aggressive monetary policy this year. Commodity prices are beginning to fall as the Russian invasion of Ukraine subsides, putting pressure on the Australian dollar soon.

Main Pairs Movement

AAPL increased 1.23 percent to close at $178.76 for the 11th consecutive day.

TSLA closed somewhat lower on the day following a very large surge at the session’s start, but it still prints extremely high at $1098.64.

INTEL also increased following Monday’s flat performance, closing at $52.23, up 0.40 percent.

USOUSD (WTI Texas) concluded higher than its opening price and gained as much as 1.65%, following a period of lower movement and a brief dip below $100.

The USD’s weakness versus several major currencies resulted in the strongest strengthening of the EURUSD, which increased by 0.97 percent, and the weakest USDJPY.

Technical Analysis

GBPUSD (4-Hour Chart)

GBPUSD temporarily climbed on Tuesday before closing with only a modest increase over the opening price. Had broken through the resistance level of 1.3125 and the support level of 1.3080, however, the price of GBPUSD is currently trading above the 1.3080 support level. GBPUSD continues to trade in a range of 1.3080 – 1.3125, with a probable breakout. If it breaks through 1.3125, the next target for GBPUSD will be 1.3188. Concerning the lower level, if GBPUSD falls below 1.3080, a move to the support range between 1.3000 and 1.3020 is possible. On the four-hour chart, GBPUSD is trading below its 50-day, 100-day, and 200-day simple moving averages (SMAs).

Resistance: 1.3126, 1.3188

Support: 1.3080, area (1.3000 – 1.3020)

EURUSD (4-Hour Chart)

EURUSD was the major currency pair that gained the most in the majors after breaking through our resistance levels. EURUSD is currently stalled at the 200-day simple moving average, with immediate resistance located between 1.1131 and 1.1156. While 1.1070 and 1.1040 serve as support levels. EURUSD is currently trading above its 50-day and 100-day simple moving averages (SMAs) on the four-hour chart while attempting to break above the 200-day SMA.

Resistance: 1.1131. 1.1156

Support: 1.1070, 1.1040

XAUUSD (4-Hour Chart)

Yesterday, XAUUSD plummeted to our lowest support level of $1893 but was able to end the day back up to $1919. Today’s movement in XAUUSD appears to be a little weaker, with the pair attempting to breach the support levels once more. Currently, the range is $1910 – $1936, with some resistance at $1921. $1948 and $1964 remain resistance levels, while $1893 is the next support level. XAUUSD is currently trading below its 50-day, 100-day, and 200-day simple moving averages on the four-hour chart.

Resistance: $1936, $1948, $1964

Support: $1910, $1893

US equities were up on Monday due to the strength of technology and mega caps stocks. The S&P 500 gained 0.78 percent, while the Nasdaq 100 gained 1.54 percent and the Dow Jones Industrial Average gained 0.33 percent.

The US bond market is a source of concern since current conditions are particularly concerning for the long-term growth of the US economy. The 5-year US bond yield is currently slightly higher than the 30-year yield, with the 5-year yield at 2.56 percent and the 30-year yield at 2.55 percent.

However, when compared to rates between 2- and 10- years, the current situation is still better; however, crossing between 5- and 30-year yields can be an early warning of a future recession in the long term.

Rising inflation rates due to high energy prices, supply chain disruptions, and the prospect of an economic downturn due to the conflict in Eastern Europe are the key causes of the inverted yield curve, as well as the Fed’s proactive stance.

The impact of an inverted yield curve may cause investors to stockpile cash again, putting pressure on the US stock market in the future.

Main Pairs Movement

The TSLA jumped as much as 2.38 percent in response to plans to seek shareholder approval for procedures that would allow for another stock split.

AAPL continued to rise until the tenth day, setting a record for the longest period since 2010, with a 1.75 percent gain.

The US dollar (WTI) plummeted as much as 6.68 percent as the virus spread across China, the world’s largest crude oil importer.

Because of the sustained negative feeling toward the yen, the USDJPY rose as much as 1.54 percent.

The biggest performer was BTCUSD, which gained 3.90 percent due to the market’s perception of adverse global economic prospects, particularly in the United States.

Technical Analysis

GBPUSD (4-Hour Chart)

The lowering cable broke through our support region at 1.3125-1.3150 but became somewhat rejected around 1.3080. It is now expected that the cable will move in the range of 1.3080 – 1.3126, with a possible breakout. A breach of the 1.3126 level indicates that the probable resistance is 1.3188, while a break below 1.3080 indicates that the cable is heading to the support area of 1.3000 – 1.3020. The cable is trading below its 50-day, 100-day, and 200-day simple moving averages (SMAs) on the four-hour chart.

Resistance: 1.3126, 1.3188

Support: 1.3080, area (1.3000 – 1.3020)

EURUSD (4-Hour Chart)

On Monday, the EURUSD was flat, hovering around the 1.0969 level. At the time of writing, the EURUSD is attempting to break through the 100-day Simple Moving Average (SMA). Immediate resistance is still at 1.1008 and 1.1046, while support is at 1.0925 and 1.0899. On the four-hour chart, EURUSD is now trading below its 50-day and 200-day simple moving averages (SMAs) while attempting to break above the 100-day SMA.

Resistance: 1.1008. 1.1046

Support: 1.0925, 1.0899

XAUUSD (4-Hour Chart)

XAUUSD fell more on Monday, approaching our support level of $1921. Currently, the level of $1921 can sustain the weakening of the XAUUSD, but more weakness is still possible given the state of the crisis between Russia and Ukraine, which has begun to diminish. XAUUSD is projected to trade in a range of $1921 to $1936 for the foreseeable future until one of the levels is breached. If it breaks above $1936, the next resistance levels are at $1948 and $1964, while a breach below $1921 will continue to support levels of $1910 and $1893. On the four-hour chart, XAUUSD is now trading below its 50-day and 100-day simple moving averages but slightly above its 200-day SMA.

Resistance: area $1936, $1948, $1964

Support: $1921, $1910, $1893

U.S. equities were mixed on Friday but ended generally higher following a string of up and down days on Wall Street as investors pondered the route forward for interest rates and fresh sanctions against Russia. The Dow Jones Industrial Average finished the day 0.30 percent higher; the S&P 500 finished 0.44 percent higher, and the Nasdaq Composite finished the day -0.09 percent lower.

Source: DW

Even while negotiations between the two countries are still ongoing, Ukrainian troops continue to oppose. This situation undoubtedly causes commodity prices to rise more, particularly oil prices, which remain above $100 per barrel. High global oil costs cause worldwide inflation rates to rise further, weighing on the economic progress of every country on the planet.

The yield on 10-year US bonds has reached 2.4 percent, while the yield on 5-year bonds has reached 2.5 percent, indicating that market participants’ views on long-term uncertainty are beginning to emerge. The Inverted Yield Curve is an indicator of a coming economic recession, as market players are beginning to mistrust the long-term payment of government bonds due to the war in Ukraine, rising oil costs, and the Fed’s aggressive stance of raising interest rates this year.

Furthermore, the threat of a recession has prompted many investors to convert their financial instrument holdings into cash and cryptocurrencies such as bitcoin.

Main Pairs Movement

We can notice some market activity based on MT4 from VT Markets over the last week.

The US Dollar was up 8.44 percent, Bitcoin was up 7.97 percent, and Apple stock was up 6.28 percent.

Meanwhile, the USDJPY increased by 2.57 percent, and the XAUUSD increased by up to 1.85 percent.

The SP500 was up 1.72 percent and the NAS100 was up 2.31 percent on the US Index.

Technical Analysis

GBPUSD (4-Hour Chart)

The cable remains pretty solid; our resistance level of 1.3209 has not been broken, but upward momentum is weakening as we approach our next resistance area of 1.3269 – 1.3300. The cable is presently approaching our support areas of 1.3125 and 1.3150. On the four-hour chart, the cable is trading below its 50- and 200-day simple moving averages (SMAs), but above its 100-day SMA.

Resistance: 1.3209, area 1.3269 – 1.3300

Support: 1.3125-1.3150

EURUSD (4-Hour Chart)

The EURUSD is unable to hold above our resistance level of 1.1008 and is falling back below it, breaking below 1.0969, which we can mark as our nearest resistance. The nearest support levels for the EURUSD are around 1.0925 and 1.0899. On the four-hour chart, EURUSD is currently trading below its 50-day, 100-day, and 200-day simple moving averages (SMAs).

Resistance: 1.0969, 1.1008

Support: 1.0925, 1.0899

XAUUSD (4-Hour Chart)

XAUUSD fell down below our 61.8 Fibonacci level of $1953 per ounce, as well as our resistance level of $1948 per ounce. For today, we can choose $1948 – $1953 per ounce as our nearest resistance level, with the next resistance levels at $1974 and $2000 per ounce. In the meantime, our support levels will be set at $1921 per ounce. On the four-hour chart, XAUUSD is now trading above its 50-day and 200-day SMAs but below its 100-day SMA.

Resistance: area $1948 – $1953, $1974, $2000

Support: $1921

VT Markets Notification of Server Upgrade

Dear Client:

As part of our commitment to provide the best reliability and service to our clients, the trading hours of certain products will be adjusted as follows due to the maintenance.

Available trading hours:

2022/03/26 18:00 – 24:00 (Server time)
2022/03/27 00:00 – 24:00 (Server time)

Please note that 24 trading hours will take effect from the 26th of March 2022 onwards.
Please be reminded that the following aspects might be affected during this maintenance period:

1. The functions of client portal operations might be disabled during this period.

2. There might be a gap between the original price and the price after maintenance. Pending orders, Stop Loss, and Take Profit settings within the gap will be filled at the market price after maintenance activity ends.

3. The quotations of products will be paused. Clients may not be able to open new positions or close the held positions.

No action is required by our client. Your service will be back online after the maintenance is completed.

Thank you for your patience and understanding about this important initiative.

If you’d like more information, please don’t hesitate to contact [email protected].

Back To Top
server

Hello there 👋

How can I help you?

Chat with our team instantly

Live Chat

Start a live conversation through...

  • Telegram
    hold On hold
  • Coming Soon...

Hello there 👋

How can I help you?

telegram

Scan the QR code with your smartphone to start a chat with us, or click here.

Don’t have the Telegram App or Desktop installed? Use Web Telegram instead.

QR code