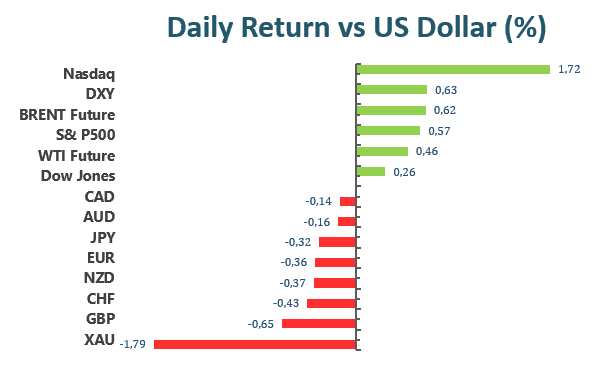
U.S. equities experienced a sharp sell-off over the course of the previous trading day. The Dow Jones Industrial Average plummeted 3.12% to close at 32997.97, the S&P 500 fell 3.57% to close at 4146.87, and the Nasdaq Composite crashed 4.99% to close at 12317.69. U.S. equities sold off while the U.S. 10-year Treasury yield soared past 3%. Bonds also sold off as the global economic outlook grows dimmer by the day. The BoE’s economic guidance issued yesterday spells trouble for dip buyers, globally, and Sterling bulls. The mention of stagflation, by the Bank of England, sent market participants into a frenzy sell-off.

Global central banks have issued warnings of possible strong equity valuation pullbacks as they begin to reverse course from easy money policies. Fed Chair Jerome Powell stated, that “some pain” would be caused as the Central Bank attempts to rein in inflation.
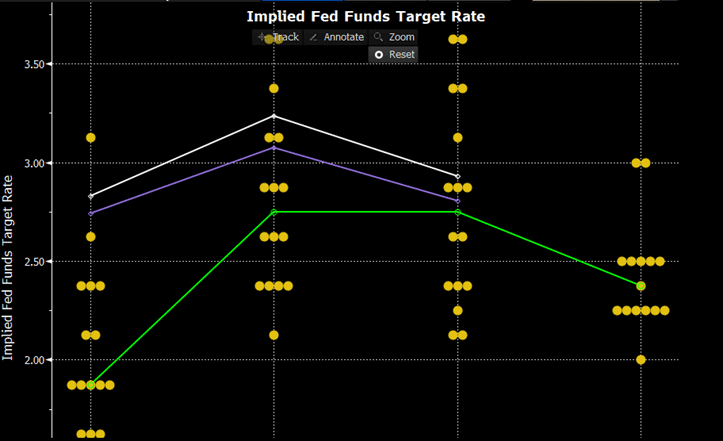
Currently, the FOMC dot plot points to a terminal interest rate of 2.83% by the end of 2022. Interest rates are projected to peak next year at 3.235% and begin to fall thereafter.
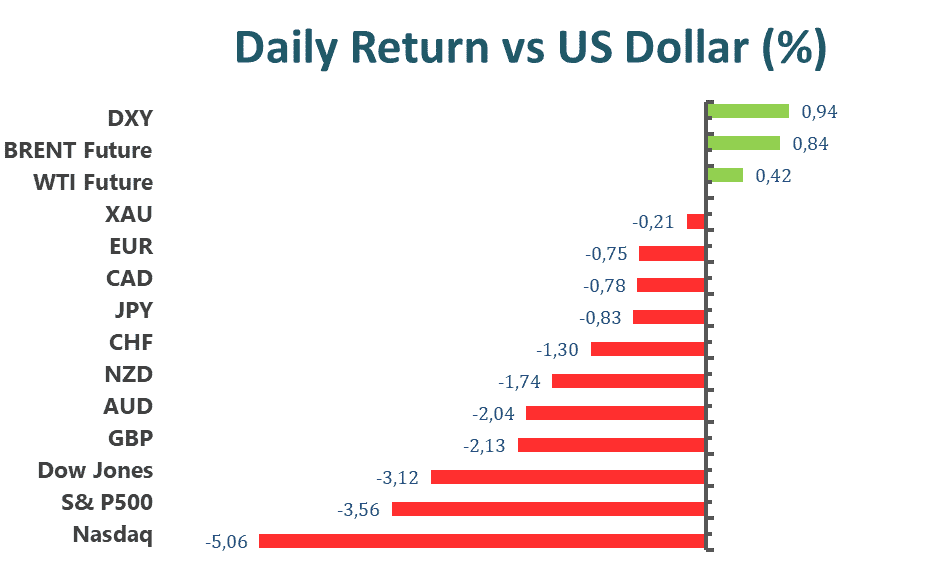
Main Pairs Movement

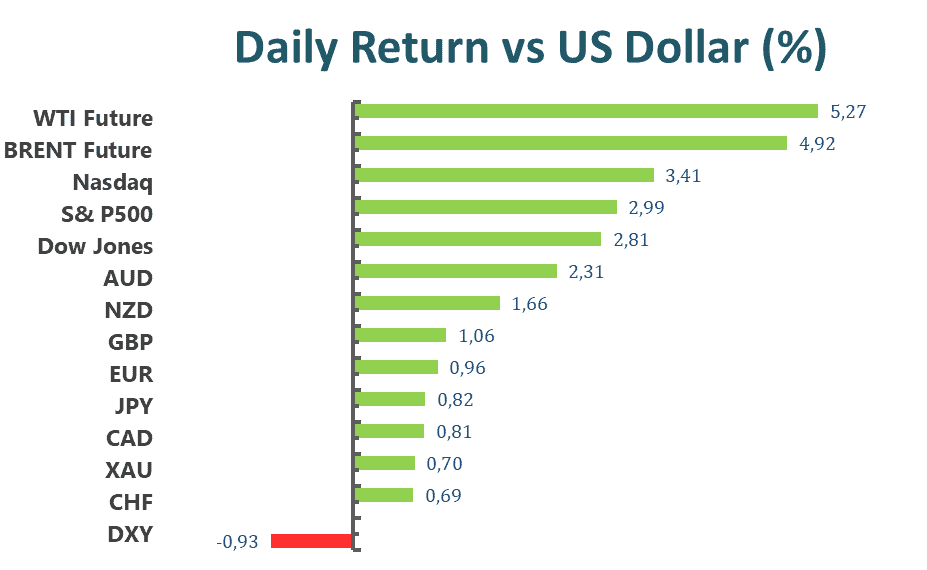
Over the previous trading day, the benchmark U.S. 10-year Treasury yield soared past 3% as bonds sold off sharply amid a broad-based equity market sell-off. The Dollar Index gained 1.01% as other leading currencies faltered.

The Euro fell 0.74% against the Dollar. Dollar demand soared as the global economic outlook grows dim and market participants rotate into safe-haven assets. Despite a commodity price cool down over the past couple of days, the economic pressure exerted by inflated energy and commodity prices has already dampened the economic growth of the EU.

The Pound plummeted 2.09% against the dollar as the Bank of England issued another round of interest rate hikes amid slowing economic growth. The BoE’s attempt to control inflation could exert additional pressure on the gloomy economic outlook of Britain.

The Dollar climbed 0.79% against the Canadian Loonie as the Dollar was buoyed by a broad-based demand. Soaring U.S. treasury yields and interest rate differentials between the two countries continue to favor the Dollar against the Loonie.


Technical Analysis

EURUSD (4-Hour Chart)

The EUR/USD pair declined on Thursday, retreating from a weekly high that was touched yesterday after the US Federal Reserve monetary policy announcement. The pair was trading sideways in the first half of the day, then started to see fresh selling and dropped towards the 1.054 area during the European session. The pair is now trading at 1.0517, posting a 0.96% loss daily. EUR/USD stays in the negative territory amid renewed US dollar strength, as the greenback staged a goodish rebound on expectations that the Fed would hike interest rates by 50 bps at the next four policy meetings. But Fed Chair Powell also said that they were not actively considering 75 bps rate hikes. For the Euro, the fact that the European Union is looking to embargo oil from Russia within six months might also act as a headwind for the EUR/USD pair.

For the technical aspect, the RSI indicator is 42 figures as of writing, suggesting that the downside is more favored as the RSI stays below the mid-line. As for the Bollinger Bands, the price fell from the upper band and then crosses below the moving average, therefore the lower band becomes the loss target. In conclusion, we think the market will be bearish as the pair is heading to re-test the 1.0485 support, a break below that level might open the road for additional losses. The falling RSI also reflects bear signals.

Resistance: 1.0622, 1.0730, 1.0922
Support: 1.0485

GBPUSD (4-Hour Chart)

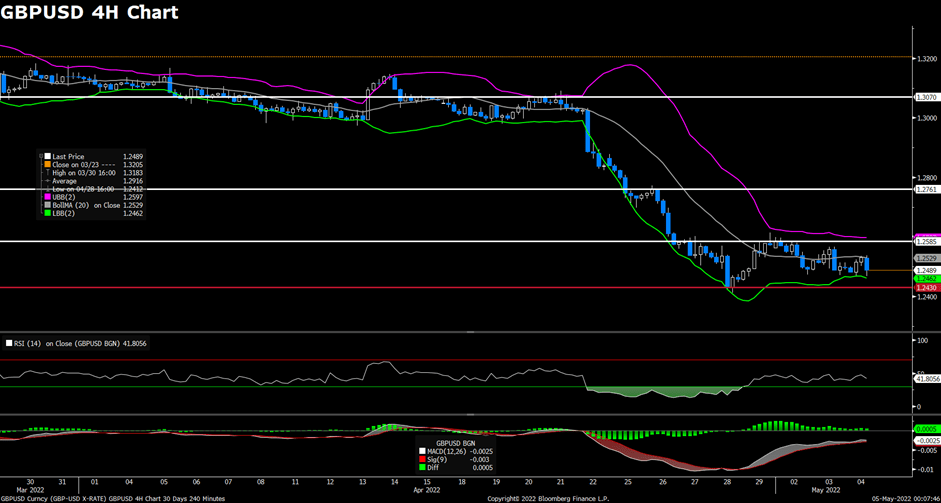
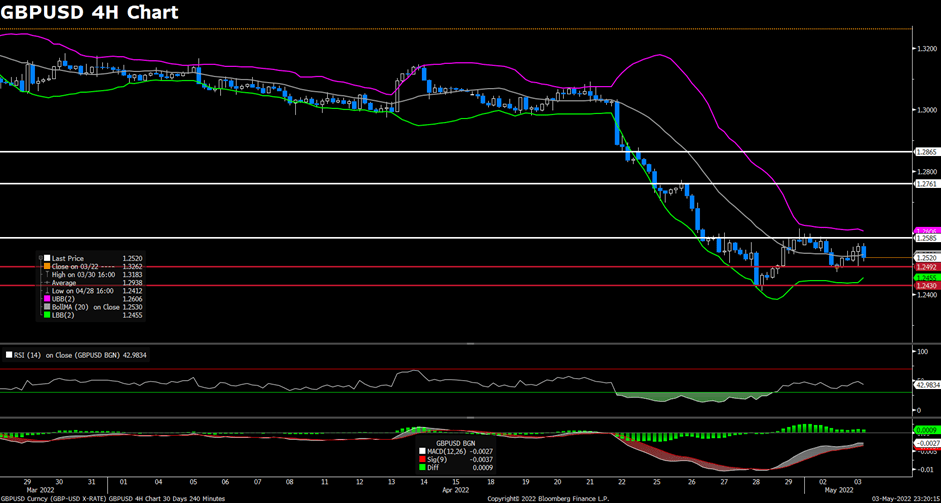
The pair GBP/USD tumbled on Thursday, suffering heavy intraday losses below the 1.238 level amid the Bank of England’s dovish outlook. The pair remained under bearish momentum for most of the day, slumping to its lowest level since July 2020 after BoE’s policy announcements. At the time of writing, the cable keeps refreshing its daily lows and stays in negative territory with a 2.06% loss for the day. The prospects for a further tightening by the Fed revived the demand for the US dollar and exerted downward pressure on the cable, as Fed policymakers were ready to approve 50 bps rate hikes at upcoming meetings. For the British pound, the Bank of England lifted its interest rate for the fourth time in the current tightening cycle as expected. However, the central bank warned about a sharp slowdown and is forecasting the UK economy to contract by 0.25% in 2023, which weighed heavily on the cable.

For the technical aspect, the RSI indicator is 32 figures as of writing, suggesting that the pair remains under heavy bearish momentum as RSI is reaching the oversold zone. For the Bollinger Bands, the price moved out of the lower band so a strong trend continuation can be expected. In conclusion, we think the market will be bearish as the pair already fell below the previous support at 1.2430. Additional near-term losses could be expected for the pair.

Resistance: 1.2585, 1.2761, 1.3070
Support: 1.2430

USDCAD (4-Hour Chart)
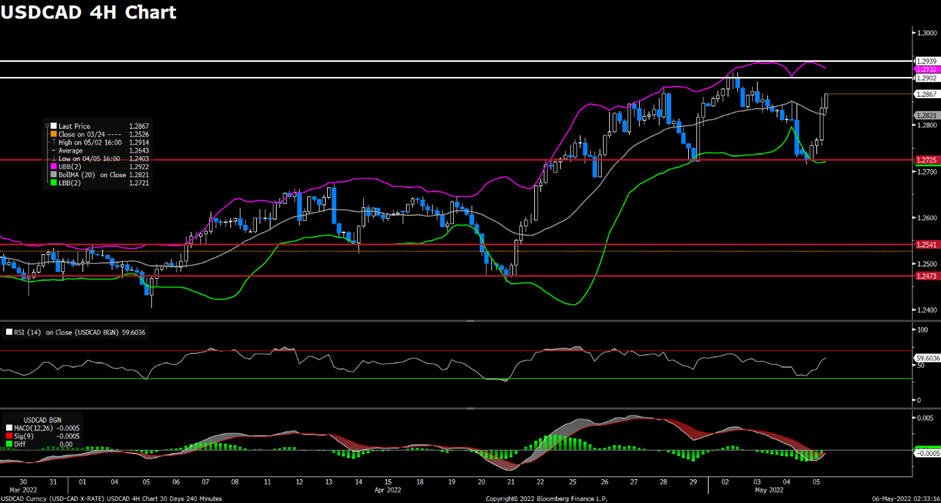
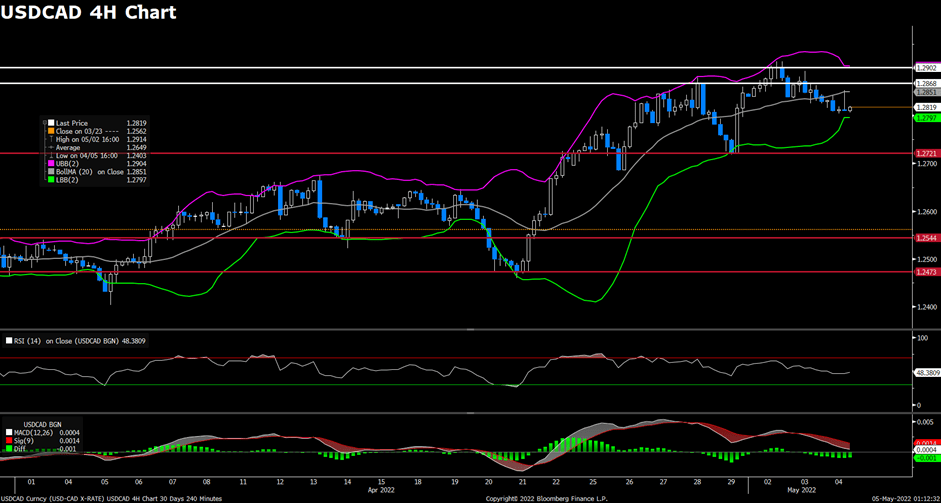
As the US dollar regained upside momentum amid dismal market mood today, the pair USD/CAD trimmed yesterday’s losses and rebounded from weekly lows after the Fed’s interest rates decision. The pair flirted with the 1.272~1.274 area during the Asian session, then started to see heavy buying and refreshed its daily high above the 1.285 level in the US session. USD/CAD is trading at 1.2861 at the time of writing, rising 0.98% daily. The surging US bond yields helped the US dollar to find demand and erased all losses from the Fed meeting. On top of that, concerns about the EU’s Russian oil embargo kept pushing WTI higher, which rose 0.83% for the day. The EU nears an agreement on a plan that would phase out all Russian oil imports within six months.

For the technical aspect, the RSI indicator is 58 figures as of writing, suggesting that the upside is more favored as the RSI stays above the MD-line. As for the Bollinger Bands, the price rebounds from the lower band and then crosses above the moving average, therefore the upper band becomes the profit target. In conclusion, we think the market will be bullish as the pair is heading to test the 1.2902 resistance. A break above that level would expose 1.2939 and the rising RSI also reflects bull signals.

Resistance: 1.2902, 1.2939
Support: 1.2725, 1.2541, 1.2473

Economic Data

CurrencyDataTime (GMT + 8)Forecast
GBPConstruction PMI (Apr)16:3058.0
USDNonfarm Payrolls (Apr)20:30391K
USDUnemployment Rate (Apr)20:303.5%
CADEmployment Change (Apr)20:3055.0K
CADIvey PMI (Apr)22:0060.0

VT Markets The Adjustment Of Weekly Dividend Notification

Dear Client,

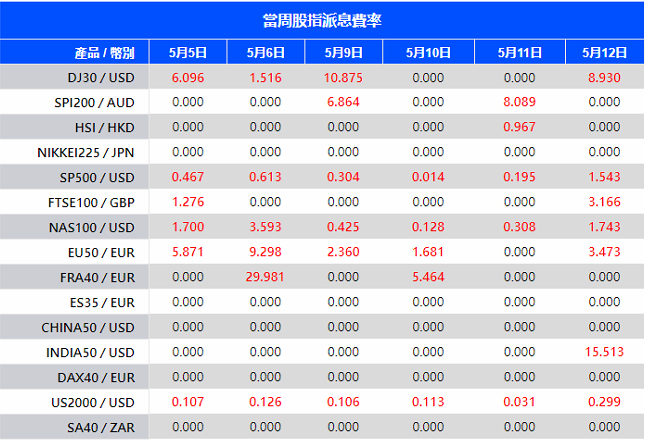
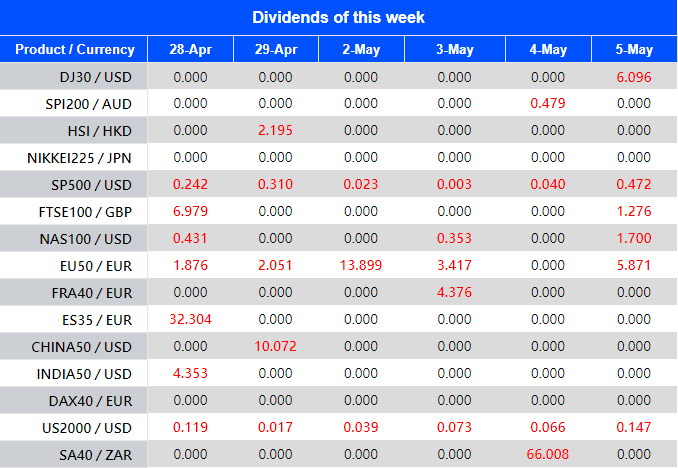
Warmly reminds you that the component stocks in the stock index spot generate dividends. When dividends are distributed, VT Markets will make dividends and deductions for the clients who hold the trading products after the close of the day before the ex-dividend date.

Indices dividends will not be paid/charged as an inclusion along with the swap component. It will be executed separately through a balance statement directly to your trading account, the comment for which will be in the following format “Div & Product Name & Net Volume ”.

Please note the specific adjustments as follows:

Note: The above data is for reference only, the actual execution date may be changed, please refer to the MT4/MT5 software for details.

If you’d like more information, please don’t hesitate to contact [email protected].

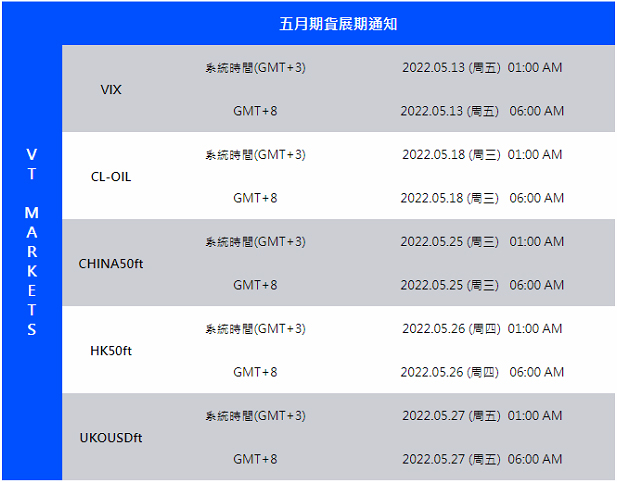
VT Markets May futures rollover announcement

Dear Client,

New contracts will automatically be rolled over as follows:

Please note:

  • • The rollover will be automatic, and any existing open positions will remain open.
  • • Positions that are open on the expiration date will be adjusted via a rollover charge or credit to reflect the price difference between the expiring and new contracts.
  • • To avoid CFD rollovers, clients can choose to close any open CFD positions prior to the expiration date.
  • • Clients should ensure that take profits and stop losses are adjusted before this rollover occurs.

If you’d like more information, please don’t hesitate to contact [email protected].

The Federal Reserve stated that quantitative tightening or the removal of assets from the central bank’s $9 trillion balance sheet will begin on June 1. The Fed will first allow up to $47.5 billion of US Treasuries and mortgage-backed securities to flow off the balance sheet in this situation. That rate would rise to $95 billion three months later.

Investors pondered the Federal Reserve’s monetary policy statement, in which the central bank announced a 50-basis-point rate hike for the first time since 2000. The increase is double what the Fed did in mid-March when it raised rates 25 basis points for the first time since 2018. The federal funds rate now has a target range of 0.75 % to 1.00 %, up from the current range of 0.25% to 0.50%.

The S&P 500, Dow Jones, and Nasdaq all raised and extended their gains Wednesday afternoon as Federal Reserve Chairman Jerome Powell signaled that a future 75 basis point rate hike is not currently being discussed. The yield on the benchmark 10-year Treasury note climbed to 2.25%.

China’s markets will resume trading Thursday after a three-day break to test whether Beijing has convinced investors that the strict Covid lockdown hasn’t hampered efforts to boost economic growth and pledges to go gentle on big technology companies.

Stocks may have come under pressure after falling earlier this week in Hong Kong, with Friday’s rally reversing after China’s leaders vowed to stimulate a faltering economy and hinted at a softer stance on the private sector. Economic pessimism means the yuan is likely to continue to struggle and bonds are likely to be supported, although the outcome of the Fed’s key meeting on Wednesday will also help determine their direction.

In addition to the widely expected rate hike at Wednesday’s meeting, investors are also awaiting a new outlook from the Fed, a key driver of Chinese assets given the widening policy divergence between Beijing and Washington.

Main Pairs Movement

The central bank raised interest rates by 50 basis points and states that it would begin shrinking its balance sheet on June 1. Following the Fed’s monetary policy announcement, the dollar plummeted. On the other hand, U.S. government bond yields eased, with the 10-year Treasury yield closing at 2.93% after peaking at 3.01%.

Meanwhile, European Commission President Ursula von der Leyen proposed the sixth wave of sanctions against Russia, which would phase out Russian crude oil and refined products by the end of the year. The news has the potential to send the European indexes down again.

The AUD/USD rate is currently around 0.7260, while USD/CAD is down to 1.2730. The EUR/USD pair trades at 1.0620, while GBP/USD advanced beyond the 1.2600 figure. Even safe-haven currencies like CHF and JPY posted gains against the greenback. Gold currently trades at $1,883 a troy ounce while crude oil price resumed their advances, with WTI now at around $107.60 a barrel.

Technical Analysis

EURUSD (4-Hour Chart)

The EUR/USD pair advanced on Wednesday, flirting around the 1.050~1.055 level ahead of the US Federal Reserve monetary policy announcement. The pair regained some upside traction and touched a daily high near 1.055 in the late European session, but then failed to preserve the bullish momentum heading into the US session. The pair is now trading at 1.0551, posting a 0.31% gain on a daily basis. EUR/USD stays in the positive territory amid a quiet market mood, as investors stopped taking any potential decisions and wait for the rate hike decision by the Fed. Fed chair Jerome Powell is expected to announce a rate hike by 50 basis points today due to overheating inflation. For the Euro, European Commission President Ursula von der Leyen said earlier today that they will phase out the Russian supply of crude oil and refined products, which is also the sixth round of sanctions against Russia.

For the technical aspect, the RSI indicator is 50 figures as of writing, suggesting that there is no obvious trend for the pair now and the market stays quite ahead of the key rate decision. As for the Bollinger Bands, the price crossed above the moving average and keep heading north, therefore the upside momentum should persist. In conclusion, we think the market will be slightly bullish as the pair is heading to re-test the 1.0570 support, a break above that level might open the road for near-term profits.

Resistance:  1.0570, 1.0728, 1.0810

Support: 1.0485

GBPUSD (4-Hour Chart)

The pair GBP/USD edged higher on Wednesday, rebounding from a weekly low that touched earlier today amid positive risk sentiment and a dismal ADP report. The pair staged a goodish rebound and refreshed its daily tops above the 1.253 level during the European session, then retreated back to surrender most of its daily gains. At the time of writing, the cable witnesses some fresh selling and stays in negative territory with a 0.04% loss for the day. The private sector employment in the US rose by 247,000 in April, which is well below the market’s expectations and dragged the US dollar lower. However, the prospects for a more aggressive policy tightening and a 50 bps rate hike by the Fed today should limit the losses for the greenback. For the British pound, traders are waiting for the Bank of England’s policy announcements on Thursday, but a hawkish Fed today might let the cable face renewed bearish pressure in the second half of the day.

For the technical aspect, the RSI indicator is 41 figures as of writing, suggesting that the downside is more favored as the RSI stays below the mid-line. For the Bollinger Bands, the price failed to cross the moving average and dropped towards the lower band, indicating that a downside trend could be expected. In conclusion, we think the market will be bearish as the pair is heading to re-test the 1.2430 support, which is the 2022 low for the cable. The falling RSI also reflects bear signals.

Resistance: 1.2585, 1.2761, 1.3070

Support: 1.2430

USDCAD (4-Hour Chart)

As the US dollar remain under bearish pressure ahead of the Federal Reserve monetary policy decision later in the session, the pair USD/CAD extended its slide that started yesterday in a choppy trading session. The pair touched a daily high above 1.285 level in the early US session, then lost its positive traction and suffered daily losses. USD/CAD is trading at 1.2817 at the time of writing, losing 0.18% on a daily basis. The pair is trading in a narrow range as investors get ready for the Fed monetary policy decision, which is expected to raise rates by 50 bps and begin its balance sheet reduction. On top of that, surging crude oil prices also provided strong support to the commodity-linked loonie and weighed on USD/CAD, as the latest news showed that European Commission is ready to phase out all imports of Russian oil within six months.

For the technical aspect, the RSI indicator is 46 figures as of writing, suggesting that the market is relatively quiet as the RSI stays flat without any directions. As for the Bollinger Bands, the price fell from the upper band and then crosses below the moving average, therefore the lower band becomes the loss target. In conclusion, we think the market will be slightly bearish as long as the 1.2868 resistance line holds. On the upside, the Fed’s policy announcement later in the session might push the pair higher above that resistance.

Resistance: 1.2868, 1.2902

Support: 1.2721, 1.2544, 1.2473

Economic Data

CurrencyDataTime (GMT + 8)Forecast
NZDEmployment Change (QoQ) (Q1)06:45 
GBPComposite PMI (Apr)16:3057.6
GBPServices PMI (Apr)16:3058.3
GBPBoE Inflation Report19:00 
GBPBoE Interest Rate Decision (May)19:001.00%
GBPBoE MPC Meeting Minutes19:00 
USDInitial Jobless Claims20:30182K
GBPBoE Gov Bailey Speaks21:15 

US stock advanced on Tuesday amid a better market mood, facing another volatile session as investors await the key Fed policy announcements later this week. The Fed is expected to raise rates by 50 basis points on Wednesday and traders will be closely watching for any clues on whether a 75 bps hike is possible in June. Meanwhile, the concerns about the rising inflation pressures and China’s Covid-19 spread still remained. Beijing will likely go into a strict city-wide lockdown like Shanghai if China authorities fail to contain the Covid-19 outbreak. On the economic data side, the Factory Orders and JOLTS Job Openings data from the US were better-than-expected, providing some support to the US dollar yesterday.

The benchmarks, S&P 500, Nasdaq 100, and the Dow Jones Industrial Average both rose on Tuesday amid uncertainty over the Fed’s policy announcement and slightly upbeat sentiment. S&P 500 was up 0.5% on a daily basis and the Dow Jones Industrial Average also advanced with a 0.2% gain for the day. Nine out of eleven sectors stayed in positive territory as the energy and financial sectors are the best performing among all groups, rising 2.87% and 1.26%, respectively. The Nasdaq 100 stayed in positive territory with a 0.2% gain on Tuesday and the MSCI World index climbed 0.4%.

Main Pairs Movement

The Reserve Bank of Australia raised its cash rate by 25 basis points. The Fed and the Bank of England will announce their decisions in the upcoming days, both could pull the trigger by 50 basis points. The 10-year U.S. Treasury yield peaked at 3% on Monday, while the German bund yield exceeded 1% for the first time since 2015.

EUR/USD hovered around 1.0510 in early Asian trade, while GBP/USD could not hold above the 1.2500 level. Commodity-linked currencies have edged higher against their US counterparts, with AUD/USD currently trading around 0.7090 and USD/CAD around 1.2840.

Gold is slightly higher, currently trading at around $1,866 per troy ounce. Crude oil prices are down, with WTI changing hands to $102.75 per barrel.

Technical Analysis

EURUSD (4-Hour Chart)

The EUR/USD pair advanced on Tuesday, recovering from new 2022 lows below the 1.050 mark that touched last week. The pair were flirting with the 1.050~ 1.052 area during the Asian session, then started to see heavy buying and rebounded towards the 1.058 level heading into the US session. The pair is now trading at 1.0536, posting a 0.33% gain on a daily basis. EUR/USD stays in the positive territory amid a weaker US dollar across the board, as the profit-taking in the US dollar and the better market mood both weighed on the greenback. However, the better-than-expected Factory Orders data should limit the losses for the dollar. For the Euro, the dovish expectations that the ECB will not tighten its monetary policy as much as the Fed in 2022 might keep capping the upside for the EUR/USD pair.

For the technical aspect, the RSI indicator is 46 figures as of writing, suggesting that the downside is more favored as the RSI stays below the mid-line. As for the Bollinger Bands, the price fell from the upper band after touching it, which showed that the downside momentum should persist. In conclusion, we think the market will be slightly bearish as the pair is heading to re-test the 1.048 support, which is the 5-year low for EUR/USD pair. The falling RSI also signals a bear trend for the pair, so the rebound today seems corrective.

Resistance: 1.0649, 1.0810, 1.0921
Support: 1.0485

GBPUSD (4-Hour Chart)

The pair GBP/USD edged higher on Tuesday, regaining some positive momentum, and ended its slide that started last Friday amid the return of UK market participants from a bank holiday. The pair was trading higher after the market opening and touched a daily high around 1.256 level, then retreated back to surrender some of its daily gains. At the time of writing, the cable stays in positive territory with a 0.23% gain for the day. The renewed US dollar strength is mainly due to the upbeat Factory Orders and JOLTS Job Openings data from the US. The market focus now shifts to the key Fed and BoE policy announcements this week. For the British pound, the Fed/BoE policy divergence might acts as a headwind for the cable, as the nation’s central bank is worried about UK economic weakness. Investors now expect a 25 bps rate hike by the BoE.

For the technical aspect, RSI indicator 43 figures as of writing, suggesting that downside is more favored as the RSI stays below the mid-line. For the Bollinger Bands, the price failed to climb higher and crossed below the moving average, indicating a continuation of the downside trend. In conclusion, we think the market will be slightly bearish as the falling RSI suggests near-term losses for the pair. A break below the 1.2492 support should lead the cable to test its 2022 lows at 1.2430.

Resistance: 1.2585, 1.2761, 1.2865
Support: 1.2492, 1.2430

USDCAD (4-Hour Chart)

As the DXY index retreated to a daily low near the 130.05 mark amid the profit-taking in the US dollar today, the pair USD/CAD stayed under bearish momentum and extended its intraday losses. The pair saw fresh selling in early trades today but witnessed a goodish rebound to daily tops in the European session, now sliding back and refreshing its daily low below the 1.283 level. USD/CAD is trading at 1.2840 at the time of writing, losing 0.30% on a daily basis. The weaker US dollar across the board is dragging the pair lower, as US dollar bulls took profits ahead of the Federal Reserve meeting. On top of that, falling crude oil prices failed to push USD/CAD higher, despite WTI now hovering around the $103.50 per barrel area due to concerns about China’s Covid-19 spread. The latest news showed that China authorities are struggling to get the Covid-19 outbreak in Beijing under control.

For the technical aspect, the RSI indicator is 52 figures as of writing, suggesting that the downside is preserving strength as the RSI keeps heading south. As for the Bollinger Bands, the price failed to touch the upper band and fell towards the moving average, therefore the downside traction should persist. In conclusion, we think the market will be bearish as long as the 1.2902 resistance line holds. The falling RSI also reflects bear signals.

Resistance: 1.2882, 1.2940
Support: 1.2721, 1.2665, 1.2541

Economic Data

CurrencyDataTime (GMT + 8)Forecast
NZDEmployment Change (QoQ) (Q1)066:450.1%
NZDRBNZ Gov Orr Speaks07:00 
NZDRBNZ Press Conference07:00 
AUDRetail Sales (MoM) (Mar)09:300.6%
USDADP Nonfarm Employment Change (Apr)20:15395K
USDISM Non-Manufacturing PMI (Apr)22:0058.5
USDCrude Oil Inventories22:30-1.167M

Markets experienced a mild rally on the first trading day of May. The Dow Jones Industrial Average increased 0.26 percent to 33061.5, the S&P 500 increased 0.57 percent to 4155.38, and the Nasdaq Composite increased 1.63 percent to 12536.02. The technology and telecoms sectors were instrumental in Nasdaq’s recovery. With the Federal Reserve’s interest rate decision planned for Thursday, market players should anticipate further downside in the near term as markets continue to price in a more than probable 50 basis point rate hike.

This week’s earnings season continues with Pfizer Inc, Advanced Micro Devices Inc, BP PLC, and Airbnb Inc all expected to report on the 3rd. Thus far, the FAANG companies have failed to meet analyst earnings projections, with Netflix and Amazon both falling short. Global growth concerns have discouraged market players from “buying the dip,” resulting in a prolonged period of declines in the major indices.

Main Pairs Movement

The yield on the benchmark US ten-year treasury note reached 3% during yesterday’s trading. At the moment, the benchmark yield is hovering at 2.987 percent. Market investors have gradually priced in the Fed’s 50 basis point interest rate hike, as reflected by the Dollar index’s ongoing rise.

EURUSD declined 0.36 percent in yesterday’s trading session to settle at 1.05036. Fears over the ongoing conflict between Ukraine and Russia, as well as concerns about the European Union’s economic prospects, continue to surround the shared currency.

Sterling fell 0.62 percent versus the dollar during yesterday’s trading. GBPUSD finished at 1.24901, retaining some of last Friday’s gains. In the immediate term, increased demand for the Dollar will continue to put Cable under selling pressure.

USDCAD increased 0.14 percent in yesterday’s trading. Commodity-linked currencies, such as the Canadian Dollar, suffered as global commodities prices fell; however, strong US dollar demand helped the USDCAD pair’s recovery.

Technical Analysis

EURUSD (4-Hour Chart)

The EUR/USD pair edged lower on Monday, remaining under bearish pressure below the 1.056 level despite the disappointing US data. The pair witnessed a goodish rebound to touch a daily high in the early European session, but then failed to preserve the upside momentum and dropped towards the 1.050 area. The pair is now trading at 1.0521, posting a 0.19% loss daily. EUR/USD stays in the negative territory amid slightly US dollar strength, as the rising US bond yields and expectations for a 50 bps rate hike by the Fed both lend some support to the greenback. However, the US ISM Manufacturing PMI in April falls to 55.4, which is weaker than the market’s expectations. For the Euro, the European Central Bank vice-president said that a rate hike in July is possible but unlikely, but the comment failed to push the pair higher.

For the technical aspect, the RSI indicator is 40 figures as of writing, suggesting that the downside is more favored as the RSI stays below the mid-line. As for the Bollinger Bands, the price failed to cross above the moving average, which showed that downside momentum should persist. In conclusion, we think the market will be bearish as the pair is heading to test the 1.048 support, which is the 5-year low for EUR/USD pair. A break below that support might open the road for additional losses.

Resistance:  1.0730, 1.0925, 1.1174

Support: 1.0485

GBPUSD (4-Hour Chart)

The pair GBP/USD declined on Monday, extending its slide towards the 1.250 area that started last Friday amid growing concerns about the UK economy. The pair were surrounded by bearish pressure for most of the day despite trying to rebound in the early European session, then started to see heavy selling heading into the American session. At the time of writing, the cable stays in negative territory with a 0.50% loss for the day. The rising US bond yields continued to help the US dollar to find demand, meanwhile, the weaker-than-expected ISM Manufacturing PMI failed to act as a tailwind for the cable. For the British pound, the less hawkish BoE compared to Fed has undermined the cable, as markets expect BoE to only hike interest rates by 25 bps. The growing concerns about the UK economy might also be made the BoE to further soften its tone on the need for further rate hikes.

For the technical aspect, the RSI indicator is 38 figures as of writing, suggesting that the downside is more favored as the RSI stays below the mid-line. For the Bollinger Bands, the price fell from the upper band and crossed below the moving average, indicating a continuation of the downside trend. In conclusion, we think the market will be bearish as long as the 1.2585 resistance line holds. The falling RSI also reflects bear signals, market focus now shifts to the key policy announcements from the Fed and BoE on Wednesday and Thursday.

Resistance: 1.2585, 1.2761, 1.3071

Support: 1.2430

USDCAD (4-Hour Chart)

As the risk-off mood lends some support to the safe-haven US dollar today, the pair USD/CAD gained upside tractions and extended its rally to a 2022 top. The pair were flirting around the 1.284~1.288 area most of the day, then touched a daily high above the 1.2900 mark in the early American session. USD/CAD is trading at 1.2892 at the time of writing, rising 0.27% daily. The concerns about China’s Covid-19 spread have weighed on market sentiment and pushed the greenback higher, as Shanghai reported 58 new cases, and restrictions are threatened to be imposed once again. On top of that, retreating crude oil prices also undermined the commodity-linked loonie and acted as a tailwind for the USD/CAD pair. WTI now hovers around the $104.00 per barrel area, meanwhile, the oil demand in China is expected to decrease after the weak data.

For the technical aspect, RSI indicator 62 figures as of writing, suggesting that upside is more favored as the RSI stays above the mid-line. As for the Bollinger Bands, the price rose from the lower band and crossed above the MA line, therefore the upper band becomes the profit target. In conclusion, we think the market will be bullish as the pair is testing the 1.2882 resistance, a sustained strength above that level should favor the bulls.

Resistance: 1.2882, 1.2940

Support: 1.2721, 1.2665, 1.2541

Economic Data

CurrencyDataTime (GMT + 8)Forecast
AUDRBA Interest Rate Decision (May)12:300.25%
AUDRBA Rate Statement12:30 
EURGerman Unemployment Change (Apr)15:55-15K
GBPManufacturing PMI (Apr)16:3055.3
EURECB President Lagarde Speaks21:00 
USDJOLTs Job Openings (Mar)22:0011.000M

U.S. equities continue to lose ground on the last trading day of the week. The Dow Jones Industrial Average dropped 2.77% to close at 32977.21, the S&P 500 slipped 3.63% to close at 4131.93, and the Nasdaq Composite dived 4.17% to close at 12334.64. The Nasdaq’s sharp drop marked the index’s worst month since 2008. Amazon’s big sell-off dragged down the overall composite and the broader equities market. Ahead of the FOMC’s May meeting, market participants are pricing in interest rate uncertainty and a possible 50 basis point interest rate hike. The broader technology sector selloff also highlights the impact of China’s covid-related lockdowns and its impact on global supply chains.

On this week’s economic docket,  the Royal Bank of Australia is due to announce interest rate decisions on Tuesday, and the Federal Reserve’s interest rate decision is set on Wednesday. Bank of England’s PMI and inflation report is due on Thursday, and the BOE would also issue interest rate decisions on the same day.

Main Pairs Movement

The Dollar showed weakness across the board on the last trading day of the week. The Dollar index closed 0.44% lower, while the benchmark U.S. 10-year Treasury yield rose to 2.937%. The sell-off of U.S. equities spilled over to the retreat of the Greenback. However, the FOMC meeting scheduled for May 4th will bring tremendous volatility to the Dollar index and the broader currency market.

USDJPY has risen to historical levels, but the broad weakness of the Dollar on Friday saw a slight retreat of the pair. Technical indicators continue to suggest a bullish outlook on the pair; furthermore, while the Bank of Japan has yet to announce any sort of monetary tightening, the Federal Reserve is set to begin its second round of tightening of the year.

Gold prices rebounded 0.13% on Friday, but could not close above the $1900 per ounce price level. As global central banks begin to ramp up interest rates, XAUUSD has begun to retrace and consolidate below the $1900 price level.

Cable rebounded 0.92% on Friday. The broad-based weakness of the Dollar helped boost the Sterling against the Greenback. With the BoE and the Fed both announcing interest rate decisions in the upcoming week, market participants can expect volatility for the pair.

Technical Analysis

USDJPY (4-Hour Chart)

USDJPY corrects from the highest level, 131, in two decades amid an aggressive USD long-unwinding trade. Technically speaking, the four-hour outlook of USDJPY remains strongly bullish though the intraday downtick stalls near the 129.80 region. The pair continues to stay above the ascending trend line, suggesting that the trend is yet to confirm a bearish bias. The bears need to wait till the breakout of the support level at 129.12 to claim tractions. On the flip side, the rebound might happen once the downtick contests the support at 129.12, where the ascending trend-line is located. Succeed to defend the support is expected to give USDJPY another upside momentum toward the next immediate resistance at 131.24

Resistance:  131.24

Support:  129.12, 127.81, 126.75

XAUUSD (4-Hour Chart)

The precious metal, gold, edges higher on Friday following the benchmark 10- year Treasury bond yield is up more than 2% after the US PCE inflation data. From the technical point of view, the near-term outlook of gold seems to turn upside following the outbreak of descending trend line. The upside momentum from these two days has pushed gold above the $1,900 level, the psychological resistance on the four-hour chart. However, the current resistance at $1,916 is set to become the first obstacle that gold needs to overcome if bulls want to extend further north. From the RSI indicator, the reading is currently hovering around the positive territory and has not yet reached the overbought condition, suggesting that bulls still have rooms to head further. On the flip side, failure to defend the support of $1,889 will bear an opportunity to attract some follow-through selling.

Resistance: 1,916, 1,940, 1,950

Support: 1,889, 1,878

GBPUSD (4-Hour Chart)

GBPUSD witnessed a rebound after hitting the 1.2400 region. The intraday uptick seems to be boosted by the US PCE inflation data. From the technical perspective, GBPUSD displays a minor pause from the 1.2400 regions after a sheer downside move since the 22nd of April; yet, the outlook remains bearish as the pair continues to fall well below the triangular wedge, suggesting that the context is extremely bearish. On the flip side, to raise the odds of a reversal, GBPUSD needs to at least climb above the 1.3002 level, where the outbreak of the descending wedge is located. At the moment, though the MACD indicator shows some positive move for the pair, the RSI remains at the negative level on the four-hour chart. That being said, the near-term momentum might lend some support to bulls, but the bears are still in control in the longer- timeframe.

Resistance: 1.2700, 1.3002, 1.3077

Support: 1.2424

Economic Data

CurrencyDataTime (GMT + 8)Forecast
EURGerman Manufacturing PMI (Apr)15:5554.1
USDISM Manufacturing PMI (Apr)22:0057.8

U.S. equities closed sharply higher Thursday, led by technology shares as markets continued recovery from steep losses earlier this week. S&P 500 climbed 2.5%, and Dow Jones surged by more than 600 points or 1.8%. The tech-heavy Nasdaq Composite jumped 3.1% to cap trading, marking its best rise since March on the heels of stronger-than-expected earnings from Facebook parent company Meta (FB) that boosted shares up nearly 18%.

Apple Inc. predicted that supply constraints would cost $4 billion to $8 billion in revenue during the current quarter, a warning that sent the shares tumbling and cast a pall on record-setting results that the company just reported.

Covid restrictions, which have swept China in recent weeks, will take a toll on the June quarter, Apple said during a conference call Thursday. The fiscal second quarter’s sales and profit had topped analysts’ estimates, fueled by strong demand for the iPhone and digital services, and the company announced $90 billion in new stock buybacks.

The outlook renewed fears that supply-chain woes will continue to roil the tech industry following a short-lived recovery from pandemic struggles. Companies ranging from Microsoft Corp. to Texas Instruments Inc. have already said that China’s Covid-19 lockdowns will crimp sales and make it harder to produce products like the Xbox. The Xi Jinping administration has embraced a strict Zero Covid policy to stop the pandemic’s spread, reverberating through the world’s supply lines.

Chip shortages and the Ukraine war also are causing disruptions, Chief Executive Officer Tim Cook said during the call. “We are not immune to these challenges, but we have great confidence in our teams, and our products and services — and in our strategy.”

Main Pairs Movement

Despite a shocking decline in the latest GDP release, the greenback advanced across the board on Thursday. The Dollar Index surpassed its 2017 highs to almost hit 104.00, its highest level since December 2002. This was primarily a result of a steep sell-off in the yen that launched USD/JPY to fresh multi-decade highs of at one point above 131.00.

The catalyst for the latest leg lower in the yen, which saw all major G10/JPY pairs surge, not just USD/JPY, was Thursday’s dovish BoJ policy announcement. As expected, the bank doubled down on its intent to stick with its ultra-dovish policies of negative interest rates and yield curve control for the foreseeable future given continued pessimism about its ability to meet its long-term inflation remit.

Elsewhere, most other major G10 currencies also continued to depreciate versus the rampant US dollar. The Euro pair dropped a further 0.5% and briefly dipped under 1.0500 for the first time since March 2017, GBP/USD dropped a further 0.6% to the mid-1.2400s and AUD/USD fell another 0.4% to probe 0.7100. NZD/USD dropped another 0.8% to fresh lows in July 2020 under 0.6500. Expectations for the BoE and RBA to both lift interest rates by 25 and 15 bps each next week have done little to stem the recent slide as both of these hikes pale in comparison to the 50 bps move expected from the Fed not only next week’s meeting but also the next few.

Technical Analysis

USDJPY (4-Hour Chart)

USDJPY hits 131.00 for the first time in two decades as the Fed- BOJ monetary policy divergence widens. On Thursday, the Bank of Japan continues to keep the key rates unchanged though it doubles down on bond buying. From the technical perspective, USDJPY stays in a strong bid tone on the four-hour chart following the breakout of the resistance level of 128.98. Failure to defend the cap level results in attracting more buying interests. At the time of writing, USDJPY is attempting to break the next obstacle, 131.24, in two decades; however, as the RSI indicator has reached near the 80 mark, the upside momentum might need to cool down a bit before continuing to head upward. To the downside, USDJPY needs to slide below 127.58 in order to become downside.

Resistance:  131.24

Support:  128.98, 127.58, 126.45

XAUUSD (4-Hour Chart)

The bright metal fails to recover, consolidating around $1885, though US GDP figures shock with a contraction. However, weak US economic data seem to unlikely change that fact the Fed is going to hike interest rates by 50 bps in May and remains in an aggressive stance later this year. Technically speaking, gold faces a barricade at nearly $1990. In order to gain some follow-through buying, gold needs to climb above $1990, where the midline of Bollinger Band, suggests a reverse from bearish to bullish in the near- term. At the time of writing, bulls seem to lack interest as the RSI still hovers within the negative level, implying that sellers are still in control.

Resistance: 1890, 1916, 1940, 1950

Support: 1878, 1877, 1828

USDCAD (4-Hour Chart)

USDCAD eases from multi-week high amid dismal US economic data, showing a contraction in US GDP print. Technically speaking, though USDCAD loses traction after hitting near the 1.2900 level, the downside seems limited. At the time of writing, USDCAD heads south toward the support of 1.27. If the level can defend the bearish momentum, then according to the Elliott Wave point of view, it is expected to see one more upside wave. As the RSI indicator eases from the overbought territory, USDCAD looks to rebound once it hits the support of 1.27. Nonetheless, if the support of 1.27 fails to defend, then it will favor the sellers, attracting some follow-through selling interests.

Resistance: 1.2900

Support: 1.2793, 1.2694, 1.2542

Economic Data

CurrencyDataTime (GMT + 8)Forecast
CNYCaixin Manufacturing PMI(Apr)09:4550
EURGerman GDP(QoQ)(Q1)16:000.1%
EURCPI(YoY)(Apr)17:007.5%
RUBInterest Rate Decision (Apr)18:3015%
CADGDP(MoM)(Apr)20:300.8%

VT Markets Notification of Server Upgrade

Dear Client,

As part of our commitment to provide the best reliability and service to our clients, the trading hours of certain products will be adjusted as follows due to the maintenance.

Available trading hours:

2022/04/30 18:00 – 24:00 (Server time)
2022/05/01 00:00 – 24:00 (Server time)

Please be reminded that the following aspects might be affected during this maintenance period:

1. The functions of client portal operations might be disabled during this period.

2. There might be a gap between the original price and the price after maintenance. Pending orders, Stop Loss, and Take Profit settings within the gap will be filled at the market price after maintenance activity ends.

3. The quotations of products will be paused. Clients may not be able to open new positions or close the held positions.

No action is required by our client. Your service will be back online after the maintenance is completed.

Thank you for your patience and understanding about this important initiative.

If you’d like more information, please don’t hesitate to contact [email protected]

VT Markets The Adjustment Of Weekly Dividend Notification

Dear Client,

Warmly reminds you that the component stocks in the stock index spot generate dividends. When dividends are distributed, VT Markets will make dividends and deductions for the clients who hold the trading products after the close of the day before the ex-dividend date.

Indices dividends will not be paid/charged as an inclusion along with the swap component. It will be executed separately through a balance statement directly to your trading account, the comment for which will be in the following format “Div & Product Name & Net Volume ”.

Please note the specific adjustments as follows:

Note: The above data is for reference only, the actual execution date may be changed, please refer to the MT4/MT5 software for details.

If you’d like more information, please don’t hesitate to contact [email protected].

Back To Top
server

Hello there 👋

How can I help you?

Chat with our team instantly

Live Chat

Start a live conversation through...

  • Telegram
    hold On hold
  • Coming Soon...

Hello there 👋

How can I help you?

telegram

Scan the QR code with your smartphone to start a chat with us, or click here.

Don’t have the Telegram App or Desktop installed? Use Web Telegram instead.

QR code