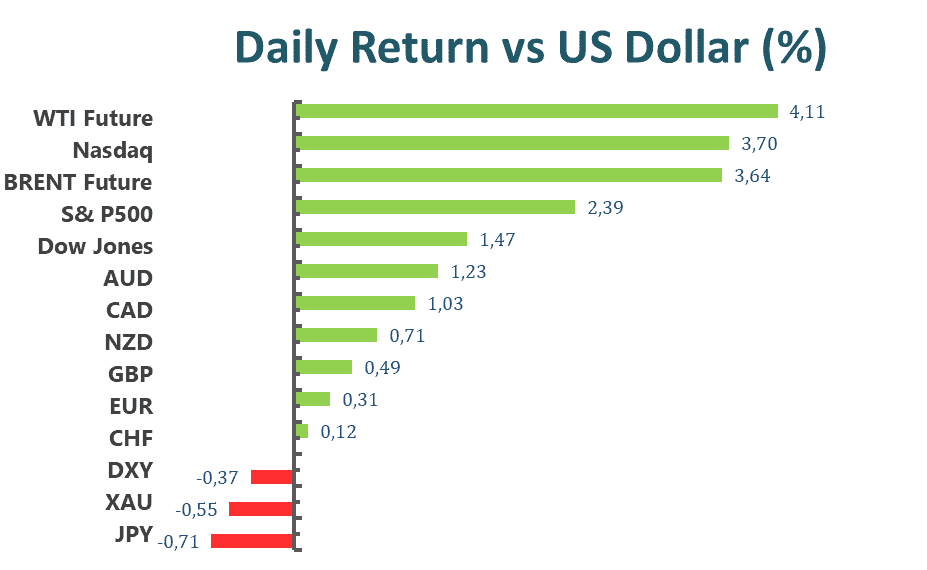
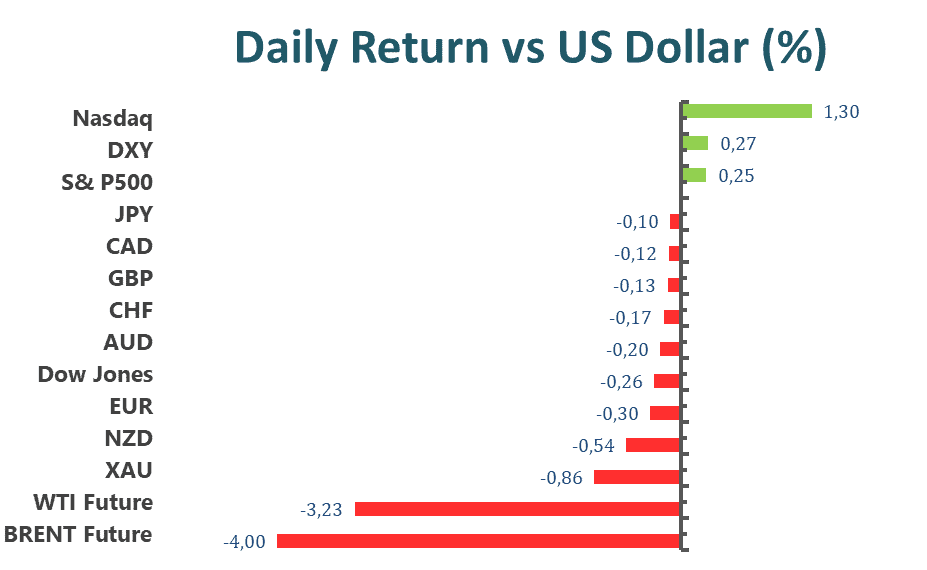
U.S. stocks rose on Tuesday, helped by a rebound in technology firms, as all three indexes recovered from last week’s heavy selling amid fears about rising inflation and a slowing economy.

The S&P 500 gained 2 %, while the Dow Jones Industrial Average gained 400 points. The tech-heavy Nasdaq Composite Index surged 2.8 % as technology stocks rebounded from Monday’s decline. The S&P 500 had lost six weeks in a row, its longest losing streak in over a decade, and the Dow Jones Industrial Average had lost seven weeks in a row, its greatest one-week drop since 2001.

Walmart Inc. fell to its lowest level in nearly 35 years after lowering its full-year profit forecast owing to inflationary pressures, particularly in food and fuel.

Wall Street’s confidence in Walmart’s capacity to absorb increasing expenses for merchandise, transportation, and labor was shaken by the deteriorating forecast. As a result of growing prices, consumer morale has fallen to its lowest level in a decade, highlighting the pressure on US consumers. Walmart and peers already were facing tough comparisons to early 2021, when federal stimulus payments bolstered household spending during the coronavirus pandemic.

Walmart’s (WMT) stock dropped 11.38 % to $131.39 after the retailer reported a huge loss. During intraday trade, the retailer dropped as much as 11.75%, marking its worst day since 1980. During the 1987 stock market meltdown, Walmart’s shares dropped 11.68 %.

Main Pairs Movement

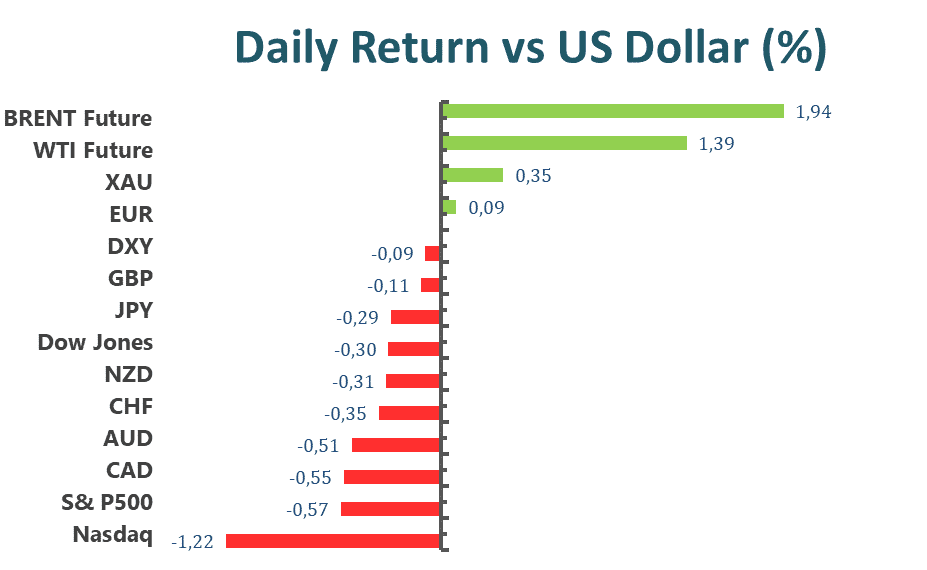
The dollar was slightly lower across the board as it extended the bearish correction that began on Monday. Optimistic U.S. data helped improve market sentiment, with global indices closing higher. Nonetheless, the potential concerns remain the same. Following Russia’s invasion of Ukraine, tensions between Europe and Russia have remained high. Ukraine has withdrawn from the negotiations, according to Russian Deputy Foreign Minister Andrei Rudenko.

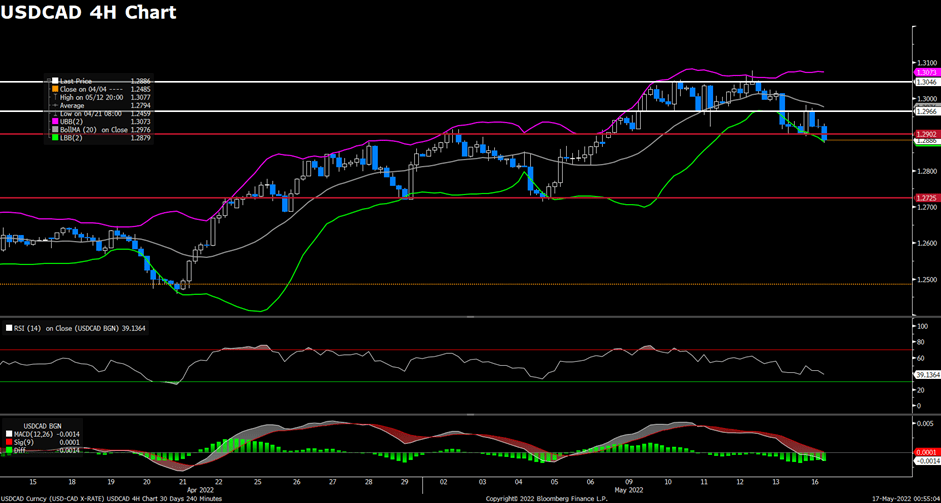
The EUR/USD pair increased to 1.0555. GBP/USD hit 1.2498 and finished the day nearby, with the pound underpinned by a stronger-than-expected UK jobs report. The AUD/USD pair trades above the 0.7000 thresholds, while the USD/CAD extended its slump and trades at 1.2800.
Despite softening gold and oil prices, the stronger performance of equities supported commodity-linked currencies. WTI is now trading at $109 per barrel, while gold has closed at $1,816 per troy ounce.

The USD/JPY pair ended the day little changed at 129.35, while USD/CHF dipped to 0.9938. US Treasury yields increased slightly, with the 10-year note flirting at 3%.

Technical Analysis

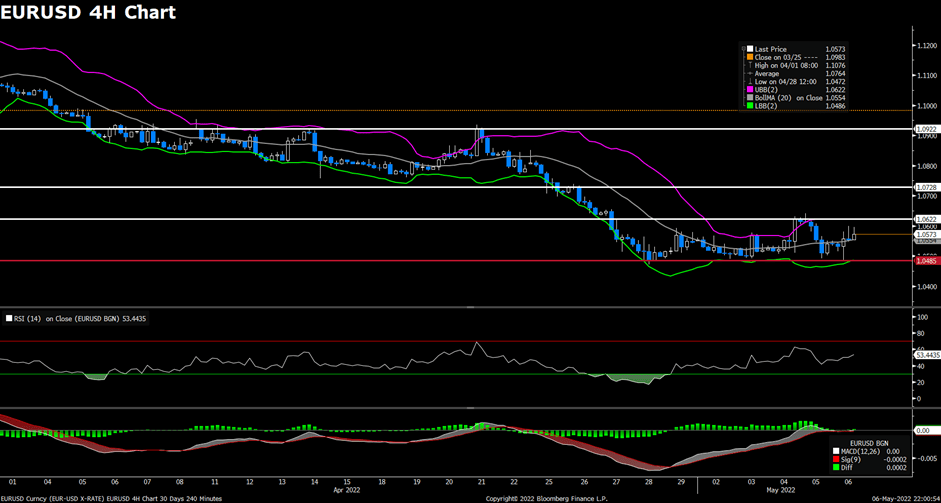
EURUSD (4-Hour Chart)

The EUR/USD pair advanced on Tuesday, regaining upside tractions and extending its rebound towards the 1.055 area amid an improved market mood. The pair were flirting with the 1.043~1.045 area in the Asian session, then started to witness upside momentum and touched a daily high above the 1.055 level during the European session. The pair is now trading at 1.0538, posting a 1.03% gain daily. EUR/USD stays in the positive territory amid a weaker US dollar across the board, as the dollar comes under bearish pressure after the overbought condition is seen in the last couple of sessions. On the economic data side, the US Core Retail Sales rose 0.6% MoM in April, which was higher than the 0.4% expected. Klaas Knot, a member of the Governing Council of the European Central Bank, made hawkish remarks in which he stated that the bank should not rule out a 50 basis point rate hike if the data proves it.

For the technical aspect, the RSI indicator is 64 figures as of writing, suggesting that the upside is more favored as the RSI stays above the mid-line. As for the Bollinger Bands, the price moved out of the upper band so a strong bullish trend can be expected. In conclusion, we think the market will be bullish as the pair is heading to test the 1.0568 resistance. Further gains could be expected if the pair extends its advance beyond the aforementioned resistance in the 1.0570 regions.

Resistance: 1.0568, 1.0622, 1.0730
Support: 1.0359

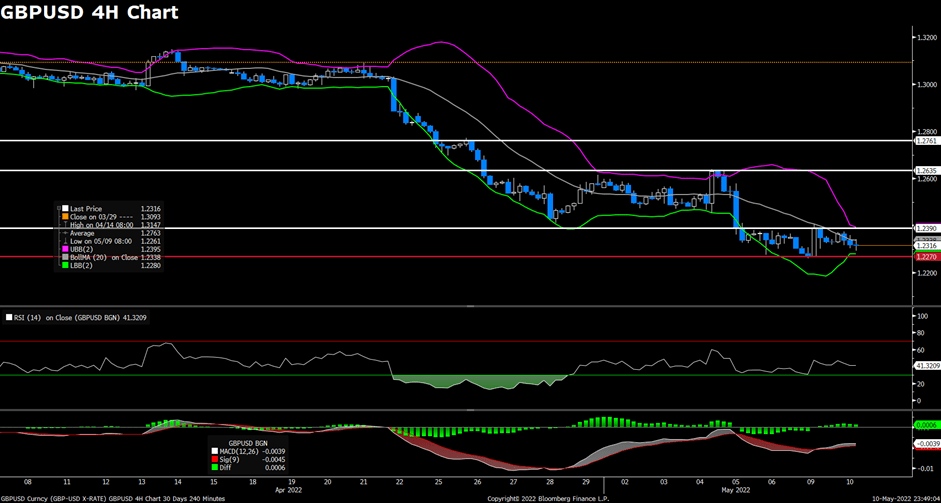
GBPUSD (4-Hour Chart)

The pair GBP/USD surged on Tuesday, witnessing heavy buying, and rose towards the 1.2480 area amid a strong UK labor market report released earlier in the session. The pair stayed quiet in the 1.232~1.235 area during the Asian session, then gathered bullish momentum and climbed to its highest level in more than ten days above 1.249 in the European session. At the time of writing, the cable stays in positive territory with a 1.32% gain for the day. The reports revealing that there are no new coronavirus cases had been reported in Shanghai supported the market sentiment and lifted the cable higher. For the British pound, the data from the UK showed that the Unemployment Rate fell to its lowest since 1974 at 3.7% in the first three months of this year and wages were also up 7.0% YoY in March, which eased some concerns about the vulnerability of consumers.

For the technical aspect, the RSI indicator is 72 figures as of writing, suggesting that the pair is in the overbought zone now, a trend reversal is possible in the near term. For the Bollinger Bands, the price started to fall after touching the upper band, therefore some downside movements could be expected for the pair. In conclusion, we think the market will be slightly bearish as the RSI indicator on the four-hour chart advanced beyond 70, suggesting that the pair might need to make a downward correction before extending its rally.

Resistance: 1.2631, 1.2761

Support: 1.2390, 1.2270, 1.2180

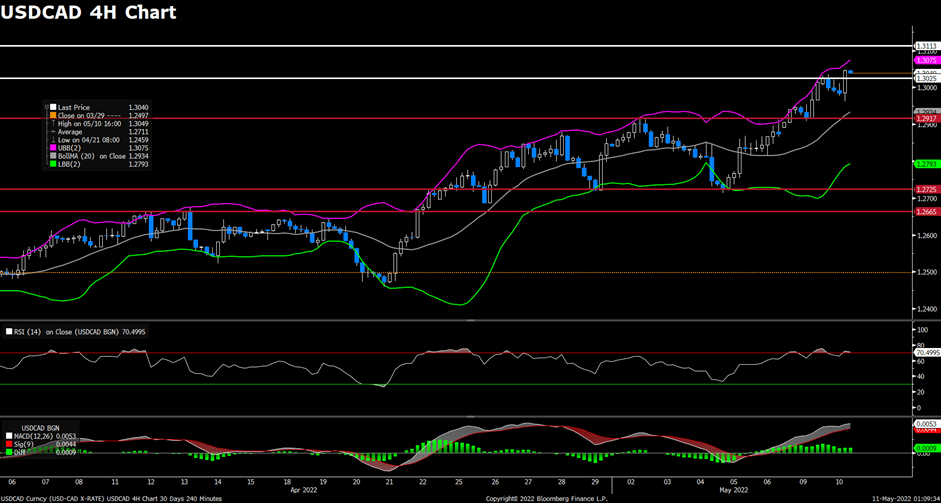
USDCAD (4-Hour Chart)

As the US dollar dropped sharply across the board amid risk appetite on Tuesday, the pair USD/CAD edged lower for the third successive day and remains depressed around the 1.282 area. The pair attracted some selling and touched a daily low below 1.281 level in the European session, then regained upside momentum to recover some of its daily losses. USD/CAD is trading at 1.2827 at the time of writing, losing 0.15% daily. The ongoing US dollar profit-taking exerted bearish pressure on the USD/CAD pair amid a goodish recovery in the equity markets today. On top of that, the rising crude oil prices also underpinned the commodity-linked loonie as WTI rallied into the $115 per barrel area. The easing fears about the lockdown in China and the EU’s embargo on Russian oil imports have both acted as a tailwind for the black gold.

For the technical aspect, the RSI indicator is 35 figures as of writing, suggesting that the pair is facing bearish pressure as the RSI approaches the oversold zone. For the Bollinger Bands, the price failed to stage a rebound and moved alongside the lower band, therefore a continuation of downside traction can be expected. In conclusion, we think the market will be bearish as the pair is heading to re-test the 1.2808 support. A four-hour close below that support could open the door for additional losses toward 1.2750.

Resistance: 1.2902, 1.2966, 1.3046

Support: 1.2808, 1.2725, 1.2687

Economic Data

CurrencyDataTime (GMT + 8)Forecast
JPYGDP (QoQ) (Q1)07:50-0.4%
GBPCPI (YoY) (Apr)14:009.1%
EURCPI (YoY) (Apr)17:007.5%
USDBuilding Permits (Apr)20:301.812M
CADCore CPI (MoM) (Apr)20:300.4%
USDCrude Oil Inventories22:301.383M

Investors were concerned that the Fed’s aggressive stance on inflation could force the economy into recession, so equities finished higher Friday, recouping some of the week’s more dramatic losses. All major indices ended the day in the green.

The Dow Jones Industrial Average (DJI) closed at 32,196.66, up 1.5 percent. The S&P 500 index rose 2.4 percent to 4,023.89, reaching bear market territory. The index, on the other hand, had its highest single-day performance since March 4. The top performers were Non-Essential Consumer Discretionary, Energy, and Technology.

The Nasdaq’s 3.8% increase to 11,805 was the largest one-day increase since November 2020. The VIX fell to 28.87 points. The ratio of stocks increasing to stocks falling on the New York Stock Exchange was 3.73:1. The NASDAQ’s 2.91:1 ratio benefited from rising equities. Friday’s volume of 13,32 billion shares was greater than the 20-day average of 13,17 billion shares.

Elon Musk fueled rumors that he may seek to renegotiate his acquisition of Twitter Inc. by stating that a purchase at a lesser price would not be “impossible.”

At the closing of trading in New York, Twitter shares plunged 8.2 percent. The stock has been declining on rumors that Musk may abandon the $43 billion deal. Musk’s questioning of Twitter’s publicly provided data on the number of spam and fraudulent accounts on its social media service has heightened this issue over the past week.

Musk emphasized this point further on Monday at a Miami tech conference, saying that at least 20 percent of Twitter accounts are phony. This was the low end of his estimate for the number of bots on the network, and he wondered rhetorically if it could reach 90 percent, according to a Twitter user’s live video of his remarks. At a recent conference, Musk stated, “I’ve been told that there is currently no method to determine the number of bots.”

Main Pairs Movement

Early in the week, the dollar strengthened, while most of its competitors closed the day with slight losses. European indices were neutral at the closing, while Wall Street managed to get gain. Because of the ongoing tensions with Russia, the bullish potential is restricted. The European Commission revised its projection for negative growth during the Ukraine crisis, with inflation growing higher this year and continuing above the ECB target until 2023 after EU ministers failed to agree on an embargo on Russian oil imports.

Furthermore, Bank of England Governor Andrew Bailey expressed dissatisfaction with the inflation prognosis, claiming that energy and tradable goods were responsible for more than 80% of the UK’s inflation overshoot. Saunders, a Bank of England member, warned that the UK’s exit from the European Union could aggravate inflation.

Due to the continued tensions with Russia, the EUR/USD closed around 1.0430 with limited upward potential. GBP/USD changed hands around 1.2310. AUD/USD traded near 0.6960 with the help of gold, which traded above $1,820 per troy ounce. With crude oil prices surging, USD/CAD fell to 1.2646 and WTI is now trading at $111.30 per barrel.

Technical Analysis

EURUSD (4-Hour Chart)

The EUR/USD pair edged higher on Monday, continuing to rebound slightly from its weakest level since early 2017 near the 1.0350 mark. The pair witnessed some upside momentum and touched a daily high above 1.043 level during the European session, then started to see fresh selling and erased some of its daily gains in the US session. The pair is now trading at 1.0417, posting a 0.08% gain daily. EUR/USD stays in the positive territory amid renewed US dollar weakness, as the softer risk tone and falling US Treasury bond yields both exerted bearish pressures on the safe-haven greenback. On the economic data side, the Empire State Manufacturing Index plunged to -11.6 in May, which marked the largest miss on expectations since April 2020. For the Euro, hawkish comments from ECB’s Villeroy provided support to the EUR/USD, as he expected a decisive policy meeting in June and will carefully monitor developments in the effective exchange rate.

For the technical aspect, the RSI indicator is 45 figures as of writing, suggesting that the pair is in a consolidation phase as the RSI lacks directions. As for the Bollinger Bands, the price is climbing towards the moving average, showing that some upside traction could be expected. In conclusion, we think the market will be slightly bullish as long as the 1.0359 support line holds. A break below that level will favor the bears.

Resistance:  1.0485, 1.0568, 1.0622

Support: 1.0359

GBPUSD (4-Hour Chart)

The pair GBP/USD edged higher on Monday, stabilizing in the 1.2250 area, and went into a consolidation phase ahead of a busy week of US/UK economic events. The pair was trading flat for most of the day and dropped to a daily low in the early European session, then regained some upside traction to recover most of its daily losses. At the time of writing, the cable stays in positive territory with a 0.07% gain for the day. The unexpected decline in the US Empire Manufacturing Index undermined the US dollar, as the disappointing data has resulted in heightened calls that the US might be going into a recession. For the British pound, the prospects that the UK economy could go into recession this year and worsening UK economic outlook might keep acting as a headwind for the GBP/USD.

For the technical aspect, the RSI indicator is 52 figures as of writing, suggesting that the upside is more favored as the RSI keeps heading north. For the Bollinger Bands, the price crossed above the moving average and rose towards the upper band, therefore the upside momentum should persist. In conclusion, we think the market will be bullish as the pair is heading to test the 1.2290 resistance level. A four-hour close above that resistance could be taken as a bullish development and open the door for additional profits toward 1.2390.

Resistance: 1.2290, 1.2390, 1.2631

Support: 1.2180

USDCAD (4-Hour Chart)

As the sliding US bond yields weighed on the US dollar on Monday, the pair USD/CAD declined towards the 1.287 mark and extended its slide that started last week. The pair was trading higher and touched a daily top above the 1.297 level during the Asian session, then started to see heavy selling to surrender all of its intra-day losses. USD/CAD is trading at 1.2871 at the time of writing, losing 0.31% daily. The US dollar lost its upside traction due to a weaker tone surrounding the US Treasury bond yields, which also exerted bearish pressure on the USD/CAD pair. On top of that, the surging crude oil prices also underpinned the commodity-linked loonie as WTI extended its rally towards the $114.00 per barrel area. The Foreign Ministers from both Germany and Austria said that they expect the EU to agree on a deal on the proposed embargo of Russian oil imports later this week.

For the technical aspect, the RSI indicator is 39 figures as of writing, suggesting that the downside is more favored as the RSI stays below the mid-line. For the Bollinger Bands, the price remained under pressure and dropped to the lower band, therefore a continuation of downside traction can be expected. In conclusion, we think the market will be bearish as the pair is testing the 1.2902 support. The falling RSI also reflects bear signals, but a recovery above 1.2966 should change the outlook to bullish.

Resistance: 1.2966, 1.3046

Support: 1.2902, 1.2725

Economic Data

CurrencyDataTime (GMT + 8)Forecast
AUDRBA Meeting Minutes09:30 
GBPAverage Earnings Index +Bonus (Mar)14:005.4%
GBPClaimant Count Change (Apr)14:00-42.5K
USDCore Retail Sales (MoM) (Apr)20:300.4%
USDRetail Sales (MoM) (Apr)20:300.9%

U.S. equity markets rebounded on the last trading day of the week. The Dow Jones Industrial Average rose 1.47% to close at 32196.66. The S&P 500 climbed 2.39% to close at 4023.89. The Nasdaq composite rallied 3.82% to close at 11805. After a week of sell-off, equities are set to recover in the week ahead as “dip buyers” return to the market. The benchmark U.S. 10 year treasury yield has cooled off and is now trading at 2.928%

Cathie Wood’s ARK Innovation ETF popped 11.82% amid a broad technology sector rally. The technology-focused ETF has dropped more than 50% since the beginning of the year and has wiped out most of its gains since 2020. NU Holdings Inc, the cryptocurrency bank, popped 20.5% after the broader cryptocurrency market recovered from the TerraUSD meltdown.

On this week’s economic docket, the UK is set to announce retail sales figures for the month of April on the 17th and CPI data on the 18th. The ECB will announce monetary policy meeting minutes on the 19th and the U.S. will announce initial jobless claims figures on the same day.

Main Pairs Movement

The Dollar Index retreated 0.27% on the last trading day of the week. As the U.S. 10-year treasury yield cooled off so did the U.S. Greenback. With the FOMC meeting scheduled for June 15th, market participants are cherishing a brief period of ease over interest rate fluctuations.

The EURUSD pair rose 0.3% over the course of Friday’s trading. Broad-based weakness of the U.S. Greenback allowed the EURUSD pair to finally find support around the 1.03767 price region.

Cable bounced 0.51% over the course of Friday’s trading. The weaker U.S. Greenback on Friday helped buoy the Pound against the Dollar, despite the U.K.’s gloomy GDP report.

The U.S. Dollar dropped 1.12% against the Canadian Loonie during last Friday’s trading. Commodity prices are again on the rise, thus helping the commodity-linked Canadian currency.

Technical Analysis

EURUSD (4-Hour Chart)

The EUR/USD pair edged lower on Friday, extending its slide and dropping to its weakest level since early 2017 near the 1.0350 level. The pair rebounded slightly towards the 1.042 area during the first half of the day, then started to see fresh selling and surrendered all of its daily gains in the US session. The pair is now trading at 1.0364, posting a 0.05% loss on a daily basis. EUR/USD stays in the negative territory amid renewed US dollar strength, as the rising US Treasury bond yields and the prospects for a more aggressive policy tightening by the Fed have both provided support to the greenback. On the economic data side, the Michigan Consumer Sentiment in May came at 59.1, which fell short of market expectations. For the Euro, the fact that the European Central Bank officials will likely announce a rate hike in July might limit the losses for EUR/USD.

For the technical aspect, the RSI indicator is 32 figures as of writing, suggesting that the pair is facing heavy bearish pressure and the RSI is reaching the oversold zone. As for the Bollinger Bands, the price failed to preserve upside traction and dropped towards the lower band, showing that the downside trend should persist. In conclusion, we think the market will be bearish as the pair is heading to test the 1.0359 support.

Resistance: 1.0524, 1.0622, 1.0728
Support: 1.0359

GBPUSD (4-Hour Chart)

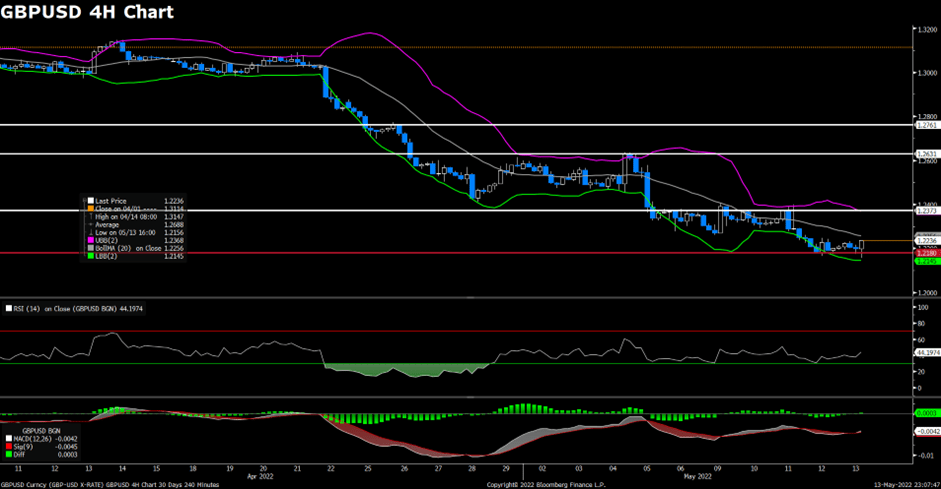
The pair GBP/USD edged higher on Friday, rebounding slightly from fresh two-year lows near the 1.2160 area but still remained under pressure. The pair touched a daily high around 1.2230 level at the start of the European session, then started to witness bearish momentum and dropped towards the 1.2160 mark. At the time of writing, the cable sees some buying and stays in positive territory with a 0.28% gain for the day. The downbeat Consumer Sentiment data exerted some bearish pressure on the US dollar, but the expectations for aggressive policy tightening by the Fed should limit the downside for the greenback. For the British pound, the disappointing UK GDP report released on Thursday and Brexit jitters both acted as a headwind for the GBP/USD, as concerns about UK economic weakness have escalated and resulted in the relatively dovish outlook for BoE’s tightening.

For the technical aspect, the RSI indicator is 35 figures as of writing, suggesting that the downside is more favored as the RSI is reaching the oversold zone. For the Bollinger Bands, the price regained upside traction and rose towards the moving average, therefore some bullish momentum could be expected for the pair. In conclusion, we think the market will be slightly bullish as long as the 1.2180 support line holds. The rising RSI also reflects bull signals. On the downside, a four-hour close below the 1.2180 level could attract sellers and open the door for additional losses.

Resistance: 1.2373, 1.2631, 1.2761
Support: 1.2180

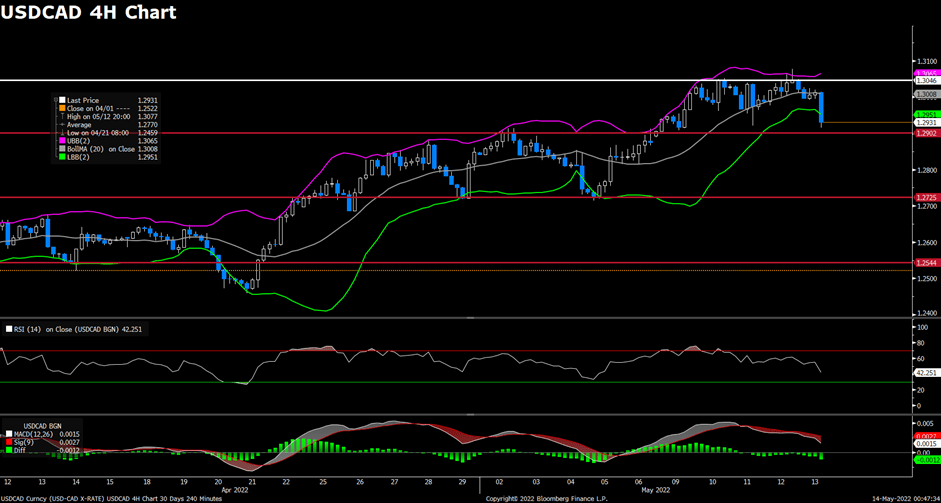
USDCAD (4-Hour Chart)

As the US dollar witnessed fresh selling after the release of the disappointing US Consumer Sentiment data, the pair USD/CAD declined towards the 1.300 mark and extended its daily losses on Thursday. The pair flirted with the 1.300~1.302 area for most of the day, then tumbled to a daily low below the 1.293 level during the US session. USD/CAD is trading at 1.2928 at the time of writing, losing 0.90% on a daily basis. The goodish recovery in the global risk sentiment and the dismal data exerted bearish pressure on the US dollar, which retreated from a two-decade high near 105 level today and dragged the USD/CAD pair lower. On top of that, the surging crude oil prices underpinned the commodity-linked loonie as WTI WTI rallied for the third straight day into the $110.00 per barrel area. The concerns about the EU/Russia gas trade escalated as Gazprom halted flows to some of its European sub-units.

For the technical aspect, the RSI indicator is 42 figures as of writing, suggesting that the downside is more favored as the RSI stays below the mid-line. For the Bollinger Bands, the price moved out of the lower band so a strong trend continuation can be expected. In conclusion, we think the market will be bearish as the pair is heading to test the 1.2902 support. USD/CAD looks bearish in the short term and the falling RSI also reflects bear signals, but a recovery above 1.3046 should change the outlook to bullish.

Resistance: 1.3046, 1.3113
Support: 1.2902, 1.2725, 1.2544

Economic Data

CurrencyDataTime (GMT + 8)Forecast
CNYIndustrial Production (YoY) (Apr)10:000.4%

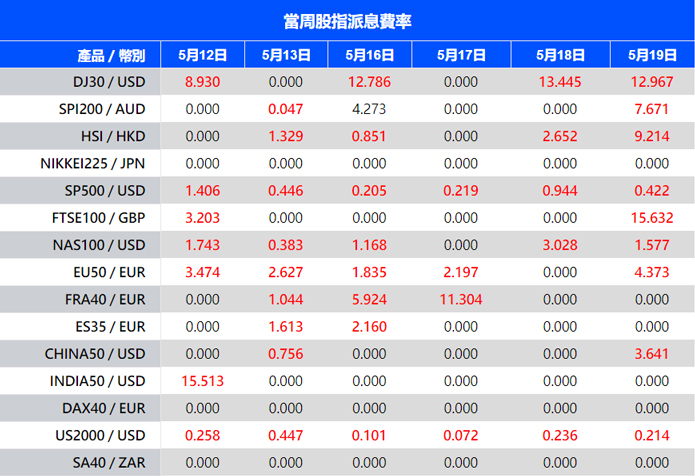
VT Markets The Adjustment Of Weekly Dividend Notification

Dear Client,

Warmly reminds you that the component stocks in the stock index spot generate dividends. When dividends are distributed, VT Markets will make dividends and deductions for the clients who hold the trading products after the close of the day before the ex-dividend date.

Indices dividends will not be paid/charged as an inclusion along with the swap component. It will be executed separately through a balance statement directly to your trading account, the comment for which will be in the following format “Div & Product Name & Net Volume ”.

Please note the specific adjustments as follows:

Note: The above data is for reference only, the actual execution date may be changed, please refer to the MT4/MT5 software for details.

If you’d like more information, please don’t hesitate to contact [email protected].

VT Markets Notification of Server Upgrade

Dear Client,

As part of our commitment to provide the best reliability and service to our clients, we will have a maintenance on this weekend.

Maintenance time:

2022/05/14 13:00 – 18:00 (Server time)

Please be reminded that the following aspects might be affected during this maintenance period:

1. The quotations of products will be paused. Clients might not be able to open new positions or close the held positions.

2. There might be a gap between the original price and the price after maintenance. Pending orders, Stop Loss, and Take Profit settings within the gap will be filled at the market price after maintenance ends.

3. The functions of fund operation will be disabled during this period. No action is required by our client. Your service will be back online after the maintenance is completed.

Thank you for your patience and understanding about this important initiative.

If you’d like more information, please don’t hesitate to contact [email protected].

U.S. equities markets were mixed yesterday. At the beginning of the American trading session, all three major indices rose but only the Nasdaq composite was able to close higher for the day. The Dow Jones Industrial Average lost 0.33% to close at 31730.3. The S&P 500 lost 0.13% to close at 3930.08. The Nasdaq composite gained 0.06% to close at 11370.96. Fed Chair Jerome Powell’s speech yesterday spooked some market participants as he iterated that a “soft landing” was not guaranteed.

The health care sector led gains in the Nasdaq composite. Allena Pharmaceuticals leaped 70.51% and Salarius Pharmaceuticals jumped 38.75%. Meme stocks, made famous by banded retail traders in the summer of 2021, were on the rise again during yesterday’s trading. GameStop and AMC both saw more than an 8% jump in share prices.

The cryptocurrency market experienced a run as the TerraUSD stable coin plummeted below the 30 cents mark. Bitcoin closed more than 6% below Wednesday’s closing price, while Ethereum lost more than 11%. More importantly, as market participants feared a market-wide meltdown, the world’s largest stablecoin, TetherUSD, also lost its peg to the dollar during the European trading session. TetherUSD was soon able to recover, but the same could not be said about TerraUSD. Bitcoin has lost more than 36% of its value since the beginning of the year.

Main Pairs Movement

The Dollar index soared 0.72% higher over the previous trading day. The benchmark U.S. 10-year Treasury yield has cooled off and is currently sitting at 2.859%. Dollar demand remains at an all-time high as global economic growth and geopolitical reasons continue to draw market participants to the Greenback.

The Euro fell sharply against the dollar over the previous trading day. EURUSD lost 1.28% as the Dollar showed its strength across the board. Finland’s request to join NATO has risen geopolitical tensions in the EU to new heights.

GBPUSD lost 0.4% over the previous trading day. Broad market Dollar strength dragged Cable into its sixth straight losing day. The British GDP also confirmed market participants’ fears over slowing economic growth.

USDCAD climbed 0.42% over the previous trading day. The Loonie fared worse against the Dollar as market participants fled to the Greenback for safety.

Technical Analysis

EURUSD (4-Hour Chart)

The EUR/USD pair tumbled on Thursday, dropping to 5-year lows around the 1.040 mark amid the resurgence of geopolitical-led risk aversion. The pair remained under bearish pressure for most of the day and started to see heavy selling at the beginning of the European session, then extended its daily losses in the US session. The pair is now trading at 1.0544, posting a 1.06% loss daily. EUR/USD stays in the negative territory amid renewed US dollar strength, as the safe-haven dollar continued to be underpinned by the panic that took over financial markets as quantitative tightening became the new norm among central banks. For the Euro, the escalating tensions between Russia and the EU might keep acting as a headwind for EUR/USD, as EU member nations Finland and Sweden both decided to end strategic military neutrality to join NATO due to security concerns following Russia’s attack on Ukraine.

For the technical aspect, the RSI indicator is 30 figures as of writing, suggesting that the pair is facing heavy bearish momentum as the RSI reached the oversold zone. As for the Bollinger Bands, the price moved out of the lower band so a strong trend continuation can be expected. In conclusion, we think the market will be bearish as the pair already dropped below the previous support at 1.0485. A break below the next support at 1.0392 should open the door for more losses.

Resistance: 1.0568, 1.0622, 1.0730
Support: 1.0485, 1.0392

GBPUSD (4-Hour Chart)

The pair GBP/USD declined on Thursday, continuing to struggle near its lowest level since May 2020 amid softer UK macro data and a stronger US dollar across the board. The pair extended its slide that started yesterday and dropped to daily lows below the 1.218 level, then rebounded slightly to recover some of its daily losses. At the time of writing, the cable stays in negative territory with a 0.44% loss for the day. The expectations for aggressive policy tightening by the Fed continued to underpin the US dollar and dragged the cable lower, as the concerns about a possible recession due to tight global supply chains have escalated. For the British pound, the UK GDP report showed that the British economy expanded by 0.8% during the first quarter of 2022, which fell short of market expectations and exerted additional bearish pressures on the GBP/USD pair.

For the technical aspect, the RSI indicator is 35 figures as of writing, suggesting that the downside is more favored as the RSI is reaching the oversold zone. For the Bollinger Bands, the price keep moving alongside the lower band, indicating that a continuation of the downtrend could be expected. In conclusion, we think the market will be bearish as the pair is now testing the 1.2180 support. The RSI indicator also highlights the increasing bearish pressure and additional losses could be possible if the support line fails to hold.

Resistance: 1.2373, 1.2631, 1.2761
Support: 1.2280

USDCAD (4-Hour Chart)

As the US dollar continued to be lifted higher by recent hot US inflation data and risk-off market mood, the pair USD/CAD extended its rally towards multi-month highs on Thursday. The pair preserved its upside traction and climbed higher during the European session, then touched a daily top near the 1.306 mark in the US session. USD/CAD is trading at 1.3061 at the time of writing, rising 0.52% daily. The US CPI and PPI data hinted that the Fed will likely press ahead with its current aggressive tightening plans, which weighed heavily on global equities and provided support to the greenback. On top of that, the consolidating crude oil prices failed to revive the commodity-linked loonie as WTI went through a choppy day so far, now sitting near the $105 per barrel area.

For the technical aspect, RSI indicator 62 figures as of writing, suggesting that the upside is more favored as the RSI stays above the mid-line. For the Bollinger Bands, the price regained upside traction and rose towards the upper band, therefore the bullish momentum should persist. In conclusion, we think the market will be bullish as the pair is testing the 1.3046 resistance. A sustained strength above that resistance should open the road for short-term profits.

Resistance: 1.3046, 1.3113
Support: 1.2967, 1.2902, 1.2725

U.S. equity markets experienced another drop as CPI data came in above estimates. The Dow Jones Industrial Average lost 1.02% to close at 31834.11. The S&P 500 slid 1.65% to close at 3935.18. The Nasdaq composite dropped 3.18% to close at 11364.23. April CPI data came in at 8.3%, compared with estimates of 8.1%, and core CPI rose to a record 6.2%. Market participants were expecting a CPI reading that was either similar to or lower than the previous month’s reading, but a higher current month reading indicates that inflation has not peaked and is still on the rise; furthermore, with energy prices declining 2.7% for the month, other factors, such as food prices, still boosted the April CPI reading. The previous FOMC minutes do provide some assurances as the Fed has iterated that it would not hike rates by more than 50 basis points at a time, but the central bank remains that there are still multiple rate increases coming by the end of the year.

The cryptocurrency market experienced a strong pullback as inflation came in red hot. Additionally, the UST issue still weighs heavily on the cryptocurrency market. The stable coin lost its peg to the U.S. Greenback and fell to a low of 0.3 as market participants scramble to exit their positions. Bitcoin is currently trading below $30,000, and Ethereum is trading at $2084, as of writing.

Market participants will be focused on the initial jobless claims report and U.S. PPI report, both scheduled to be released during the American trading session.

Main Pairs Movement

The Dollar Index climbed for the sixth straight trading session and leaped above 104 after the release of the April CPI reading. U.S. Treasury yields jumped above 3% at the initial release of the CPI report, but have gradually simmered below 3% and are currently sitting at 2.906%.

EURUSD lost 0.13% over the previous trading day. The Euro rose for the first part of the day as Euro bulls swooped in to support the currency, but after the U.S. CPI data was released, the Greenback gained back all its losses against the Euro.

GBPUSD dropped 0.52% over the previous trading day. The British Pound gained upward momentum as the U.S. CPI data came in but soon lost all gains as U.S. Treasury yields edged higher.

USDCAD dropped 0.29% over the previous trading day. The Canadian Loonie ended its four-day losing streak as the dollar came under pressure from the heated inflation data. The initial CPI release sparked a 0.78% drop in the USDCAD pair but was able to recover some ground.

Technical Analysis

EURUSD (4-Hour Chart)

The EUR/USD pair advanced on Wednesday, recovering from a daily low below 1.051 level after the release of the US CPI data. The pair was trading higher to touch a daily high above 1.057 level during the European session, then staged a goodish rebound following US CPI-inspired decline in the US session. The pair is now trading at 1.0544, posting a 0.20% gain daily. EUR/USD stays in the positive territory amid renewed US dollar weakness, despite the stronger US CPI report reaffirming bets for a more aggressive policy tightening by the Fed. For the Euro, ECB President Christine Lagarde hinted that rate hikes could happen as soon as July as inflation continues to rise, showing that the European Central Bank has decided to follow with the rest of the major central banks. The hawkish comment provided some support to the EUR/USD pair.

For the technical aspect, RSI indicator 51 figures as of writing, suggesting that the upside is preserving strength as the RSI keeps heading north. As for the Bollinger Bands, the price regained bullish momentum and crossed above the moving average, therefore the upside traction should persist. In conclusion, we think the market will be slightly bullish as long as the 1.0622 support line holds. On the upside, the pair has room to extend its rebound toward 1.0622.

Resistance: 1.0622, 1.0728, 1.0810
Support: 1.0485

GBPUSD (4-Hour Chart)

The pair GBP/USD edged higher on Wednesday, gathering recovery momentum and rebounds from the post-US CPI low. The pair regained upside traction after dropping to a daily low below the 1.229 mark, but then started to see fresh selling again and surrendered most of its daily gains in the US session. At the time of writing, the cable remains under pressure but stays in positive territory with a 0.06% gain for the day. The annual pace of the headline US CPI came in at 8.3% in April, which is higher than the market’s expectations of 8.1%. Inflationary pressures are likely to remain high in the next few months amid tight global supply chains and the war in Ukraine. For the British pound, the Bank of England’s gloomy economic outlook last week and negative Brexit-related headlines should keep acting as a headwind for the cable and capped its upside. The latest news showed that Northern Ireland Protocol talks are in a serious situation.

For the technical aspect, the RSI indicator is 42 figures as of writing, suggesting that the downside is more favored as the RSI stays below the mid-line. For the Bollinger Bands, the price retreated from the upper band, indicating some near-term bearish bias and the downside traction should remain. In conclusion, we think the market will be bearish as the pair is heading to test the 1.2270 support. On the upside, a break above the 1.2390 resistance might lead the pair to the 1.2500 area.

Resistance: 1.2390, 1.2631, 1.2761
Support: 1.2270

USDCAD (4-Hour Chart)

Despite the release of the hotter-than-expected US CPI data, the pair USD/CAD has been choppy in the US session and retreated from the 1.303 level amid US dollar weakness. The pair witnessed heavy selling and tumbled to a daily low near the 1.293 level at the start of the US session, then regained some bullish momentum and recovered some of its daily losses. USD/CAD is trading at 1.2980 at the time of writing, losing 0.36% daily. But the risk-sensitive loonie is under pressure once again on Wednesday as investors are concerned that the Fed will tighten its policy more aggressively this year due to higher inflation. On top of that, surging crude oil prices have provided some support to the commodity-linked loonie and dragged the USD/CAD pair lower. WTI extended its rally towards the $106 per barrel area, as the EU is closer to an agreement on a ban on all Russian oil imports.

For the technical aspect, the RSI indicator is 54 figures as of writing, suggesting that the upside is more favored as the RSI stays above the mid-line. But for the Bollinger Bands, the price failed to rise higher and dropped below the moving average, therefore the downside momentum should persist. In conclusion, we think the market will be bearish as long as the 1.3046 resistance line holds. If USD/CAD dips below the 1.2917 support level, technicians could pull the pair down toward the 1.2850 area.

Resistance: 1.3046, 1.3113
Support: 1.2917, 1.2725, 1.2665

Economic Data

CurrencyDataTime (GMT + 8)Forecast
GBPGDP (YoY) (Q1)14:009.0%
GBPGDP (QoQ) (Q1)14:001.0%
GBPGDP (MoM)14:000.0%
GBPManufacturing Production (MoM) (Mar)14:00-0.5%
GBPMonthly GDP 3M/3M Change14:001.0%
USDInitial Jobless Claims20:30195K
USDPPI (MoM) (Apr)20:300.5%

U.S. equities rebounded slightly throughout yesterday’s trading. The Dow Jones Industrial Average rallied 500 points at the start of trading, but the index could not retain its upward momentum and closed 0.26% lower at 32160.74. The S&P 500 edged 0.25% higher to close at 4001.06. The Nasdaq composite climbed 0.98% to close at 11737.67. The benchmark U.S. 10-year Treasury yield cooled off and is now sitting at 2.99%.

The highly anticipated U.S. April CPI figure will be released later today during the American trading session. Currently, analysts are estimating a lower figure than the March reading of 8.5%. Gasoline, shelter, and food accounted for the largest increased area for the March CPI reading; therefore, cooling commodity and energy prices during April could help the case of a lower CPI reading.

Cryptocurrencies recovered slightly after the panic sell-off by market participants due to worries over UST and its Bitcoin reserves. The broad market selloff was triggered by rumors of a possible Bitcoin “dump” by UST creators to prop up UST’s peg to the U.S. Dollar.

Main Pairs Movement

The Dollar index climbed 0.16% throughout yesterday’s trading, despite falling U.S. Treasury yields. The Greenback continues to be in high demand as market participants attempt to hedge interest rate and exchange rate risks.

EURUSD fell 0.3% throughout yesterday’s trading. The Euro failed to maintain any upward momentum and all gains from the two previous trading days were erased. The ongoing war between Ukraine and Russia still acts as extremely heavy pressure on the Euro.

GBPUSD fell an additional 0.16% during yesterday’s trading. Cable is now on its fourth consecutive losing day, after the large sell-off of the Pound last Thursday. The BoE’s pessimistic economic guidance continues to spook market participants.

USDCAD gained 0.14% throughout yesterday’s trading. Commodity prices continue to fall with the WTI falling below the key 100 Dollar/ Barrel mark. Technical indicators on the four-hour chart, however, do indicate a possible path reversal for the USDCAD pair.

Technical Analysis

EURUSD (4-Hour Chart)

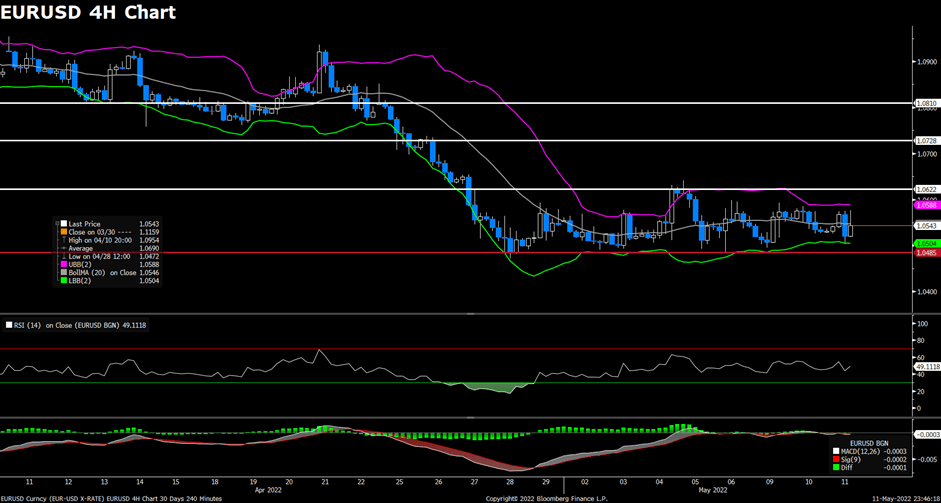
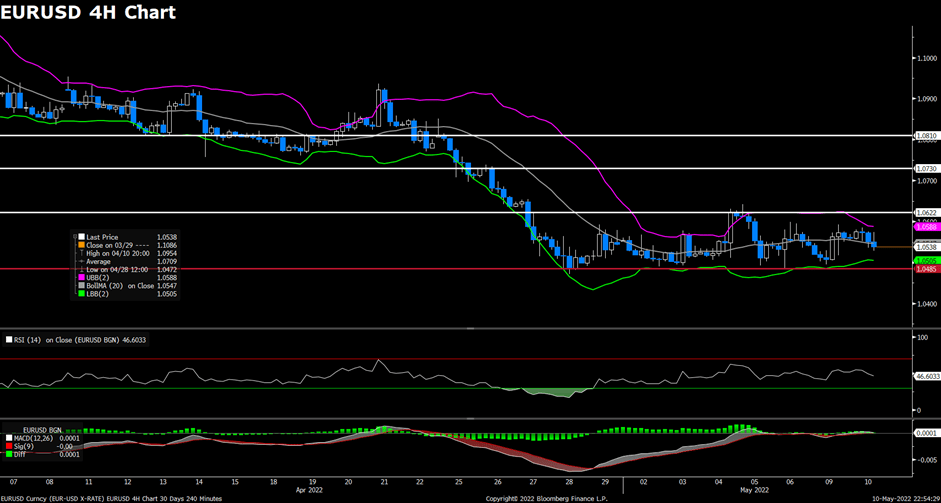
The EUR/USD pair edged lower on Tuesday, losing its recovery momentum in the second half of the day as market participants pay close attention to comments from Fed officials. The pair was trading higher and touched a daily high above the 1.058 level in the Asian session, but then failed to preserve its upside traction heading into the US session. The pair is now trading at 1.0539, posting a 0.18% loss daily. EUR/USD stays in the negative territory despite the generally positive tone around the equity markets, as renewed US dollar strength exerted bearish pressure on the EUR/USD pair. The market focus now shifted to the release of the US CPI report on Wednesday. For the Euro, the concerns about the Russian invasion of Ukraine and the effect it brought on oil and gas supplies might both keep acting as a headwind for the EUR/USD pair, as the European Commission continues to discuss a full oil embargo on Russia.

For the technical aspect, the RSI indicator is 46 figures as of writing, suggesting that the downside is more favored as the RSI stays below the mid-line. As for the Bollinger Bands, the price failed to climb higher and dropped towards the moving average, therefore the downside traction should persist. In conclusion, we think the market will be bearish as long as the 1.0622 resistance line holds. The falling RSI also reflects bear signals.

Resistance: 1.0622, 1.0730, 1.0810
Support: 1.0485

GBPUSD (4-Hour Chart)

The pair GBP/USD declined on Tuesday, failing to preserve its upside momentum amid a negative shift witnessed in market sentiment. The pair started to see fresh selling after reaching a daily top above the 1.237 level, then extended its daily losses and dropped towards the 1.230 mark during the US session. At the time of writing, the cable stays in negative territory with a 0.14% loss for the day. The US dollar continued to be underpinned by the prospects for a more aggressive policy tightening by the Fed, as investors expect that the Fed will take more actions to curb soaring inflation. This helped the greenback to find demand and weighed on the GBP/USD pair. For the British pound, the Bank of England’s gloomy economic outlook and recession fears continued to act as a headwind for the cable. The falling 10-year UK government bond yield is also making it more difficult for the British pound to find demand.

For the technical aspect, the RSI indicator is 41 figures as of writing, suggesting that the pair is facing selling pressure as the RSI stays below the mid-line. For the Bollinger Bands, the price struggled to rise above the moving average and now sitting below it, indicating that the downside traction should remain. In conclusion, we think the market will be bearish as the pair is heading to test the 1.2270 support. The flattened RSI also indicates the lack of buyers’ interest. On the upside, 1.2390 forms the first resistance ahead of 1.2635 and 1.2761.

Resistance: 1.2390, 1.2635, 1.2761
Support: 1.2270

USDCAD (4-Hour Chart)

Despite retreating US bond yields today having limited the upside for the US dollar, the pair USD/CAD witnessed fresh buying and extended its daily gains in the US session. The pair dropped to a daily low below the 1.297 mark at the start of the US session, then regained bullish momentum and erased all of its daily losses. USD/CAD is trading at 1.3038 at the time of writing, rising 0.19% daily. Investors now await the release of US consumer inflation figures on Wednesday, which will play a key role in driving the USD demand. On top of that, sliding crude oil prices also undermined the commodity-linked loonie and provided some support to the USD/CAD pair. WTI extended its daily losses as growing recession risks and lockdowns in China have both dampened the global oil demand, now sitting below $100 per barrel.

For the technical aspect, RSI indicator 71 figures as of writing, suggesting that the pair is facing heavy buying pressure and stays in the overbought zone now, so a trend reversal could be expected. As for the Bollinger Bands, the price started to rise towards the upper band, therefore the upside momentum should persist. In conclusion, we think the market will be bullish as the pair is now testing the 1.3025 resistance. The technical readings will favor the upside if the pair could develop well above that resistance.

Resistance: 1.3025, 1.3113
Support: 1.2917, 1.2725, 1.2665

Economic Data

CurrencyDataTime (GMT + 8)Forecast
EURECB President Lagarde Speaks16:00 
USDCore CPI (MoM) (Apr)20:300.4%
USDCrude Oil Inventories22:30-0.457M

U.S. equities fell sharply on the first trading day of the week. The Dow Jones Industrial Average dropped 1.99% to close at 32245.7, the S&P 500 slid 3.2% to close at 3991.24, and the Nasdaq Composite tumbled 4.29% to close at 11623.25. The benchmark U.S. 10-year Treasury yield, on the other hand, climbed well past the 3% mark during trading. The technology sector continues to bear the brunt of this wave of equity revaluation. FAANG+ has plunged, despite beating earnings estimates. Risks of stagflation have initiated a frenzy sell-off by market participants.

Palantir Technologies, once a heavily weighted stock in Cathie Wood’s Ark Technologies ETF, reported 2 cents per share earnings and 446 million in revenue. Although the company was able to deliver better than expected earnings, the board of the company issued weak guidance than sent the share price of Palantir in a downward spiral, falling more than 21%.

The cryptocurrency market is also experiencing a major revaluation as treasury yields continue to climb. Bitcoin has dropped back to the $30,000 territory and Etherium is now trading at $2250. The drop in cryptocurrency valuation also affected cryptocurrency-linked equities, such as Nu Holdings.

This week’s U.S. CPI data is getting more crucial for market participants as markets get increasingly volatile. This CPI figure could indicate whether inflation has peaked and it could also indicate whether the Fed’s tightening has delivered on its purpose.

Main Pairs Movement

The Dollar Index continued to climb higher on the first trading day of the week. With treasury yields rising, so did the demand for the U.S. Greenback. Currently, on the FOMC dot plot, the consensus terminal interest rate for 2022 sits at around 2.67%.

EURUSD rebounded 0.11% throughout yesterday’s trading. Despite a stronger U.S. Dollar, market participants flocked to the Euro as it is now sitting near 2017 lows. Bearish signals continue to surround the EURUSD pair.

GBPUSD ended the day trading mostly sideways. The pair closed 0.01% lower than its previous close. During the American trading session, Cable was able to recover most of its intraday losses due to the plummeting U.S. equities market.

USDCAD climbed 0.77% over the previous trading day. The Dollar rallied against the Canadian Loonie as global commodity prices continue to correct from recent highs.

Technical Analysis

EURUSD (4-Hour Chart)

Due to safe-haven demand, the EUR/USD pair moved lower on Monday but was unable to sustain its recovery in the afternoon. The pair mounted a decent recovery throughout the European session after striking daily lows, but subsequently lost its bullish momentum and forfeited its daily gains. The pair is currently trading at 1.0529, representing a daily loss of 0.15 percent. EUR/USD remains in a negative territory amidst renewed US dollar gains, as a further steep decline in global equity markets offers support to the safe-haven US dollar. Concerns regarding central bank tightening and declining global growth weighed on the market mood. As the ECB is not anticipated to tighten monetary policy at a faster rate, the Fed/ECB policy divergence may continue to operate as a headwind for the EUR/USD pair.

As of this writing, the RSI indicator is 46, indicating that the downside is more likely as long as the RSI remains below the zero line. As the price is falling relative to the Bollinger Bands’ moving average, a continuation of the downward trend can be anticipated. In conclusion, we believe the market will be bearish as the pair approaches the 1.0485 support; a breach below this level might pave the way for near-term losses. The declining RSI also shows bearish indications.

Resistance:  1.0622, 1.0728, 1.0922

Support: 1.0485

GBPUSD (4-Hour Chart)

In a risk-averse market environment, the GBP/USD pair dropped on Monday, losing its upward momentum and failing to extend its recovery. Despite reaching a daily high above the 1.240 mark during the European session following a slide to daily lows, the pair began to witness heavy selling and fell towards the 1.230 area ahead of the US session. At the time of writing, the cable maintains a daily loss of 0.16 percent. Negative factors such as central bank tightening, weakening global growth, and worries of a recession helped the US dollar regain upward momentum throughout the US session. The dovish Bank of England and its gloomy economic prognosis might continue to exert bearish pressure on the cable since the outlook indicated that the UK economy was at risk of recession.

As of this writing, the RSI indicator has reached 40 digits, indicating that the pair is seeing selling pressure as the RSI continues to decline. For the Bollinger Bands, the price failed to cross above the moving average and declined towards the lower band, indicating that downside momentum should persist. In conclusion, we believe the market will be negative as the pair approaches the 1.2270 support level. A break over the 1.2430 level might be interpreted as positive and would open the door to the 1.2631 level of resistance.

Resistance: 1.2430, 1.2631, 1.2761

Support: 1.2270

USDCAD (4-Hour Chart)

The USD/CAD pair maintained upward momentum and extended its surge that began last week as a result of the pessimistic sentiment surrounding the equity markets. The pair flirted with the 1.2931.295 range for the majority of the day and struck a daily low near 1.291, but fresh buying emerged to wipe out all of its daily losses. At the time of writing, the USD/CAD exchange rate was 1.2964, up 0.43 percent for the day. The anticipation of a more aggressive Fed policy tightening could continue the USD/bullish CAD’s momentum. In addition, declining crude oil prices weakened the commodity-linked Canadian dollar and worked as a tailwind for the USD/CAD pair. China’s authorities continue to struggle with its zero-Covid-19 goal, which is a symptom of weakening oil demand.

Technically speaking, the RSI indicator is 70 at the time of writing, indicating that the pair is facing intense buying pressure and is in the overbought zone, thus a trend reversal could be anticipated. According to the Bollinger Bands, the price continued to move alongside the upper band, hence the upward trend should stay. As the pair is currently challenging the 1.2939 resistance, we believe the market will be bullish. Consistent strength above that level would favor the bulls, and the rising RSI also indicates bullish indications.

Resistance: 1.2939

Support: 1.2902, 1.2725, 1.2665

Economic Data

CurrencyDataTime (GMT + 8)Forecast
EURGerman ZEW Economic Sentiment (May)17:00-42.0
BRLBCB Copom Meeting Minutes19:00 

U.S. equities markets edged lower on the last trading day of the week. The Dow Jones Industrial Average lost 0.3% to close at 32899.37, the S&P 500 shed 0.57% to close at 4123.34, and the Nasdaq Composite dropped 1.4% to close at 12144.66. With the U.S. 10-year treasury yield soaring past 3%, market participants continue to sell off bonds. The energy sector was among the best performing sectors on Friday.

The S&P 500 index has arrived at a key support level near the 4123.33 price level. Analysts are predicting a potential rebound at this level, but it would depend on the key earnings reports in the week ahead. Earnings season continues this week with major companies such as Palantir Technologies, Walt Disney, Toyota, Rivian Automotive, WeWork, and Softbank all scheduled to report.

On this week’s economic docket, U.S. CPI data will be released on the 11th, U.K. GDP data on the 12th, and U.S. initial jobless claims and PPI on the 12th as well.

Main Pairs Movement
The U.S. Greenback continues to be in high demand as global central banks begin to tighten their balance sheets. The Dollar Index climbed a further 0.11% on Friday to end the week up 0.43%.

EURUSD was able to stop its free fall on the last trading day of the week. The pair traded mostly sideways throughout the day and closed 0.04% higher. Growth concerns for the European Union continue to loom over the shared currency.

GBPUSD lost 0.21% throughout Friday’s trading. With the BoE painting a less than optimistic economic outlook, the British Pound failed to attract buyers despite falling to multi-year low levels.

The Greenback surged against the Loonie on the last trading day of the week. USDCAD rose 0.59% to close out the week. The Canadian currency fared worse due to weak employment data and falling commodity prices.

Technical Analysis

EURUSD (4-Hour Chart)

The EUR/USD pair advanced on Friday, rebounding from weekly lows following Thursday’s sharp sell-off. The pair was trading lower and dropped to the 1.049 level heading into the European session, then started to see fresh buying to erase most of its daily losses. The pair is now trading at 1.0574, posting a 0.32% gain daily. EUR/USD stays in the positive territory amid renewed US dollar weakness, as the improving market mood undermined the safe-haven greenback and push EUR/USD higher. Despite the Nonfarm Payrolls data in April comes better-than-expected, it failed to provide strong support to the US dollar due to the slight downward revision of March’s reading. For the Euro, ECB’s Villeroy suggested that the bank’s policy rates could return to positive territory by the end of the year, which acted as a tailwind for the EUR/USD pair.

For the technical aspect, the RSI indicator is 55 figures as of writing, suggesting that the upside is more favored as the RSI stays above the mid-line. As for the Bollinger Bands, the price regained bullish momentum and crossed above the moving average, therefore the upside traction should persist. In conclusion, we think the market will be bullish as the pair is heading to test the 1.0622 resistance, a break above that level would target the next resistance at 1.0728. The rising RSI also reflects bull signals.

Resistance: 1.0622, 1.0728, 1.0922
Support: 1.0485

GBPUSD (4-Hour Chart)

The pair GBP/USD edged lower on Friday, remaining under heavy bearish pressure after the dovish BoE policy announcement on Thursday. Despite trying to stage a rebound during the European session after dropping to a daily low, the pair failed to preserve its upside traction and continued to lick its wounds. At the time of writing, the cable started to see some buying stays in negative territory with a 0.10% loss for the day. The US dollar keeps retreating from its highest level since late-2002 after the US April jobs report, but the prospects for a further tightening by the Fed should limit the losses for the greenback. For the British pound, the Bank of England softened its tone on the need for further tightening and warned about the risk of a recession in 2023. The concerns about the outlook for the UK economy might continue to act as a headwind for the cable.

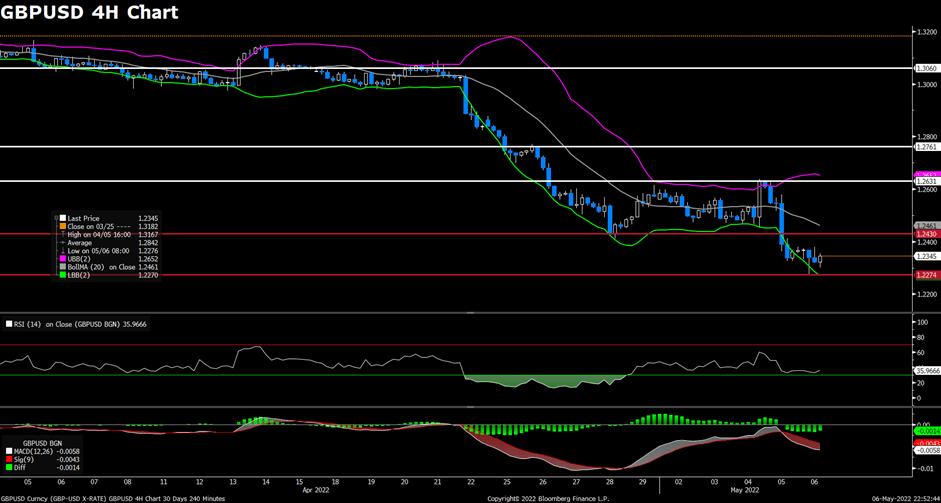
For the technical aspect, the RSI indicator is 33 figures as of writing, suggesting that the pair is facing selling pressure and reaching the oversold zone. For the Bollinger Bands, the price continues to move alongside the lower band so a continuation of the downside momentum can be expected. In conclusion, we think the market will be bearish as the bear had held its ground below the previous support at 1.2430. The GBP/USD pair is at risk of further losses and bears are eyeing the next key support level at 1.2274.

Resistance: 1.2631, 1.2761, 1.3060
Support: 1.2274

USDCAD (4-Hour Chart)

As the mood around the equity markets started to sour and drove some flows towards the US dollar, the pair USD/CAD regained bullish momentum and refreshed its daily tops after the US/Canadian monthly jobs report. The pair flirted with the 1.282~1.285 area during the first half of the day, then attracted some buying and climbed towards the 1.290 mark in the US session. USD/CAD is trading at 1.2887 at the time of writing, rising 0.39% daily. The surging US Treasury bond yields have provided some support to the greenback, as investors expect that the Fed would need further tightening to bring inflation under control in future meetings. On top of that, falling crude oil prices failed to lift the commodity-linked loonie higher amid unimpressive Canadian employment data, which showed that the number of employed people rose only by 15.3K in April.

For the technical aspect, the RSI indicator is 63 figures as of writing, suggesting that the upside is preserving strength and the RSI is heading to the overbought zone. As for the Bollinger Bands, the price rebounds from the lower band and then crosses above the moving average, therefore the upper band becomes the profit target. In conclusion, we think the market will be bullish as the pair is ready to test the 1.2902 resistance. A break above that level would expose 1.2940 and the rising RSI also reflects bull signals.

Resistance: 1.2902, 1.2940
Support: 1.2725, 1.2544, 1.2473

Back To Top
server

Hello there 👋

How can I help you?

Chat with our team instantly

Live Chat

Start a live conversation through...

  • Telegram
    hold On hold
  • Coming Soon...

Hello there 👋

How can I help you?

telegram

Scan the QR code with your smartphone to start a chat with us, or click here.

Don’t have the Telegram App or Desktop installed? Use Web Telegram instead.

QR code