Market Outlook – Interesting week ahead for Australia, New Zealand, and Canada

The economic data from Australia, New Zealand, and Canada will be interesting this week. The markets are looking forward to the release of Australia’s Employment Data on 18 August 2022, which will provide an insight into whether the country’s jobs market is in good shape. 

In addition, the Reserve Bank of New Zealand’s Rate Statement will be released on 17 August 2022, which could give investors a clue about how much rates would rise if inflation remains high.

Image source: forexfactory.com 

Australia’s Monetary Policy Meeting Minutes | 16 August 2022

This month, the Reserve Bank of Australia (RBA) raised the cash rate by 50 basis points (bps) to 1.85% — the third consecutive hike since June 2022. The last time the cash rate was this high was in April 2016.

The bank believes inflation will return to its target level while paying attention to the global outlook, which remains clouded by geopolitical tensions in Ukraine and its potential effect on energy and commodity prices as well as China’s zero-COVID policy.

Canada’s Consumer Price Index | 16 August 2022

The Consumer Price Index (CPI) in Canada increased 0.7% in June of 2022, according to Statistics Canada. The CPI is one of the many indicators that Canadian analysts use to assess the health of the domestic economy and the likelihood that the Bank of Canada might raise interest rates. 

Analysts forecast that Canada’s CPI for July would be slower at 0.1%.

Reserve Bank of New Zealand Rate Statement | 17 August 2022

The Reserve Bank of New Zealand will release its cash rate decision on Wednesday, 17 August 2022. 

The Reserve Bank of New Zealand’s most recent interest rate hike will push up the official cash rate to a level not seen since March 2016. The central bank raised its benchmark rate by 50 bps to 2.5%. According to the bank’s statement, it would continue to tighten policy until it was sure that monetary conditions were sufficient to cool inflation and bring it in line with the target range of 1-3%. Acknowledging medium-term downside risks to economic activity, policymakers said they were aware that the global economic outlook had weakened amid ongoing supply issues, geopolitical tensions, and health curbs in China. 

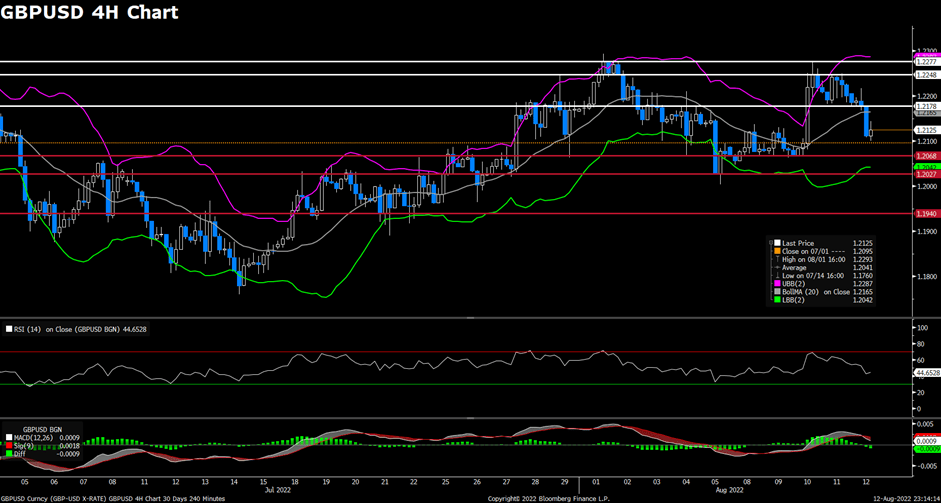
UK’s Consumer Price Index | 17 August 2022

The CPI in the UK increased 0.8% in June over the previous month. The CPI data is a key indicator to measure inflation in that country. 

Analysts forecast that UK CPI for July would be slower at 0.4%.

US Retail Sales | 17 August 2022

Retail sales in the US rose 1% in June of 2022, edging up from a 0.1% decline in May and beating forecasts of 0.8% growth. The jump reflects robust consumer spending but also marks an increase in prices for goods and services.

July forecasts for retail sales will be higher by 0.2%.

FOMC Meeting Minutes | 18 August 2022

In its July 2022 statement, the Federal Reserve raised the target range for the fed funds rate by 75 bps to 2.25%-2.5% and indicated that it would continue to increase rates as long as projected inflation remains in line with or below its target of 2%. 

Fed Chair Jerome Powell said he was unable to predict what the target range for next year’s fed funds rate might be, but that he expected rates to increase moderately over the course of the rest of this year.

Australia’s Employment Data | 18 August 2022

In June 2022, employment in Australia jumped sharply to a fresh record high of 13.6 million while unemployment fell to a fresh record low of 3.5%. Forecasters expect the unemployment rate to fall further, to 3.6%, while employment is expected to grow by another 25,000.

The Australian economy has been going through a rough patch over the past few years, but it looks like things are now turning around with this recent boost from employment data.

With a slowdown in Inflation, will Fed Ease Monetary Policy?

US stock rallied on Friday, with investors assessing whether an inflation slowdown could soon make the Federal Reserve reduce the pace of its most-aggressive tightening campaign in decades and prevent a hard landing. The next few weeks will be crucial in determining the sustainability of the rally. As the earnings season is almost over, economic reports are mixed at best and many Fed speakers are unwilling to sound too dovish. Apart from that, data Friday indicated that US consumer sentiment climbed to a three-month high on firmer expectations about the economy and personal finances. Inflation expectations were mixed, with consumers boosting their long-term views for prices slightly while reducing their year-ahead outlook for costs.

The benchmarks, S&P500 and Dow Jones Industrial Average both advanced on Friday, as S&P500 had a fourth straight week of gains, the longest such run since November. All eleven sectors stayed in positive territory, with Consumer Discretion, Information Technology, and Communication Service performing the best among all groups, rising 2.30%, 2.07%, and 2.02% respectively. Dow Jones Industrial Average rose 1.3%, Nasdaq 100 surged by 2.1% on daily basis, and the MSCI World index increased 1.1%.

Main Pairs Movement

US dollar advanced with a 0.56% gain on daily basis on Friday, as U.S. import prices declined for the first time in seven months on lower costs for both fuel and non-fuel products in the third report this week to hint inflation may have topped out. The DXY index witnessed fresh transactions and touched a daily high level above 105.8 during the US trading session, then lost bullish momentum and closed around the 105.7 level.

GBP/USD declined with a 0.55% loss on daily basis for the day, amid a strong pickup in USD demand. Moreover, the Preliminary GDP report showed that the UK economy contracted by 0.1% in Q2 as compared to the 0.8% rise in the previous quarter. Under such pressures, the cables dropped from 1.220 level to a level around 1.210 ahead of the US trading session. Meanwhile, EURUSD dropped and touched a daily low level below 1.024, and the pair fell 0.59% on Friday.

Gold rallied with a 0.71% gain on daily basis for the day, amid an upbeat market mood due to lower US inflation data. The XAUUSD observed fresh upward tractions and reached a daily -high level above $1802 marks during the US trading session. The WTI and BRENT oil dropped dramatically on Friday, falling 2.38% and 1.62% respectively.

Technical Analysis

EURUSD (4-Hour Chart)

The EUR/USD pair declined on Friday, coming under selling pressure and dropped to a daily low near the 1.027 mark heading into the US session amid the recovery witnessed in the US dollar. The pair is now trading at 1.02762, posting a 0.40% loss daily. EUR/USD stays in the negative territory amid a stronger US dollar across the board, as the mixed market mood helps the safe-haven greenback to find demand and undermined the EUR/USD pair. Moreover, The US Consumer Confidence Index improves to 55.1 in August, providing some support to the US dollar. For the Euro, the Eurozone Industrial Production rises 0.7% MoM in June, which surpassed the market’s expectations but failed to lift the shared currency higher.

For the technical aspect, the RSI indicator is 48 as of writing, suggesting the pair’s bearish outlook in the near term as the RSI falls below the mid-line. As for the Bollinger Bands, the price witnessed fresh selling and dropped below the moving average, therefore the downside momentum should persist. In conclusion, we think the market will be bearish as the pair is heading to test the 1.0246 support line. Additional losses toward 1.0158 could be witnessed if the pair dropped below that support.

Resistance:  1.0347, 1.0438, 1.0484

Support: 1.0246, 1.0158, 1.0111

GBPUSD (4-Hour Chart)

The GBP/USD pair tumbled on Friday, being surrounded by bearish momentum and refreshed its daily low near the 1.210 mark during the US trading session amid renewed US dollar strength. At the time of writing, the cable stays in negative territory with a 0.67% loss for the day. The US dollar makes a solid comeback on the last day of the week and moved higher toward the $106 area, as investors are accessing the Fed’s rate hike move in the September meeting. Currently, the markets are pricing in a 60% probability of a 50 bps rate increase next month. For the British pound, the UK Preliminary GDP report showed that the UK economy contracted by 0.1% in Q2, which reinforce the speculations of a possible recession in Q4 and acted as a headwind for the GBP/USD pair.

For the technical aspect, the RSI indicator is 44 as of writing, suggesting that the downside is more favoured as the RSI stays below the mid-line. For the Bollinger Bands, the price dropped below the moving average and remained under pressure, therefore a continuation of the downside trend can be expected. In conclusion, we think the market will be bearish as long as the 1.2178 resistance line holds. Sellers could take action and trigger an extended downward correction if the pair break below the 1.2068 support.

Resistance: 1.2178, 1.2248, 1.2277

Support: 1.2068, 1.2027, 1.1940

XAUUSD (4-Hour Chart)

Despite the US dollar regaining upside traction amid the mixed market mood and recent hawkish comments by Fed officials on Friday, the pair XAU/USD managed to stay relatively resilient and climbed modestly higher above the $1,795 area during the US trading session. XAU/USD is trading at 1795.01 at the time of writing, rising 0.27% daily. The softer-than-expected US inflation data during the week keeps investors hopeful that the Fed will tighten its policy less aggressively, expecting a 50 bps rate hike by the central bank. However, San Francisco Fed President Mary Daly said that she is open to a bigger rate hike if data warrants it. On top of that, the falling US Treasury bond yields also provided some support to the safe-haven metal.

For the technical aspect, the RSI indicator is 58 as of writing, suggesting that the upside is preserving strength as the RSI keeps heading north. For the Bollinger Bands, the price extended its bullish momentum and climbed above the moving average, therefore the upside traction should persist. In conclusion, we think the market will be bullish as the pair is testing the 1798 resistance line. A break above that level could favour the bull and open the door for additional gains.

Resistance: 1798, 1812, 1822

Support: 1769, 1756, 1738

Economic Data

CurrencyDataTime (GMT + 8)Forecast
JPYGDP (QoQ) (Q2)07:500.6%
CNYIndustrial Production (YoY) (Jul)10:004.6%

VT Markets Notification of Server Upgrade

Dear Client,

As part of our commitment to provide the best reliability and service to our clients, the trading hours of certain products will be adjusted as follows due to maintenance.

Available trading hours:

2022/08/13 16:00 – 24:00 (Server time)
2022/08/14 00:00 – 24:00 (Server time)

Please be reminded that the following aspects might be affected during the maintenance:

1. The functions of client portal operations might be disabled during maintenance.

2. There might be a gap between the original price and the price after maintenance. Pending orders, Stop Loss, and Take Profit settings within the gap will be filled at the market price after maintenance activity ends.

3. The quotations of products will be paused. Clients may not be able to open new positions or close the held positions.

No action is required by our client. Your service will be back online after the maintenance is completed.

Thank you for your patience and understanding about this important initiative.

If you’d like more information, please don’t hesitate to contact [email protected]

US Producer Prices Index fell unexpectedly, Reflecting a Drop in Energy Costs.

US stocks slid on Thursday and erased gains on speculation the rally that followed softer inflation data went too far, with Federal Reserve still setting monetary policy tight. A key measure of US producer prices unexpectedly fell for the first time in more than two years, mainly reflecting a drop in energy costs. A similar result to the consumer prices report on Wednesday, both the overall and core figures were softer than forecast. However, inflation remains stubbornly high and will likely keep the Fed on a hawkish path to curb it. Meanwhile, equities have been bolstered by a better-than-expected earnings season, and those companies that have trailed analysts’ estimates were rewarded with the biggest gains in at least five years.

The benchmarks, S&P500 and Dow Jones Average Industrial were both little changed down on Thursday after the market consumed CPI numbers. Five out of eleven sectors stayed in positive territory, as Energy and Financial sectors performed best among all groups, rising 3.19% and 1.02% respectively. It’s worth noting that big Tech underperformed as Nasdaq 100 more than 20% above its June lows, and the index slid 0.6% on daily basis for the day.

Main Pairs Movement

US dollar was slightly lower on Thursday, following a dramatic 1% loss the previous day when data showed U.S. inflation was not as hot as anticipated in July. The DXY index edged lower since the Asia trading session and touched a daily-low level below 104.6, and then rebounded to a level above 105.2.

The GBP/USD slid with a 0.11 % loss on daily basis, as the market amid a risk-off impulse while the greenback weakened. The cables witnessed fresh upbeat transactions during the Asian trading session and then lost bullish momentum and fell to a level below 1.220. Apart from that, investors needed to keep an eye out for the critical GDP report on Friday, to confirm the slowdown of economic growth across the UK. Meantime, EURUSD has turned sideways around 1.032, and the pairs advanced with a 0.2% gain for the day.

Gold declined with a 0.15% loss on daily basis, as Federal officials keep their hawkish stances. XAUUSD oscillate in a range from $1,783 to $1,799 marks. WTI and Brent oil both surged on Thursday, rising 2.62% and 2.13% respectively.

Technical Analysis

EURUSD (4-Hour Chart)

The EUR/USD pair advanced on Thursday, preserving its upside traction and extending its previous rebound toward the 1.036 mark after the release of softer-than-expected US PPI data. The pair is now trading at 1.03281, posting a 0.28% gain daily. EUR/USD stays in the positive territory amid a weaker US dollar across the board, as the easing US inflation figures lend support to market sentiment and kept the safe-haven greenback to remain on the back foot. The US Producer Price Index (PPI) declined to 9.8% every year in July, which came in lower than the market’s expectations and pushed the EUR/USD pair higher. For the Euro, European indexes struggle to post advances and the EUR/USD pair up for the fifth consecutive day.

For the technical aspect, the RSI indicator is 66 as of writing, suggesting that the upside is more favoured as the RSI stays above the mid-line. As for the Bollinger Bands, the price failed to climb higher but hovered around the upper band, therefore some upside traction can be expected. In conclusion, we think the market will be slightly bullish as the pair is testing the 1.0325 resistance line. A sustained strength above that level might open the road to additional gains.

Resistance: 1.0325, 1.0438, 1.0484

Support: 1.0282, 1.0158, 1.0111

GBPUSD (4-Hour Chart)

The GBP/USD pair edged higher on Thursday, failing to gather bullish momentum and remaining under pressure below the 1.225 mark during the US session amid risk-off market sentiment. At the time of writing, the cable stays in positive territory with a 0.11% gain for the day. The cooler-than-expected US inflation report and the upbeat US Initial Jobless Claims figure both exerted bearish pressure on the safe-haven greenback and underpinned the GBP/USD pair. The economic data showed that supply-chain conditions are improving and inflationary pressures on the wholesale side have also begun to ease. For the British pound, the Bank of England Chief Economist Huw Pill said on Thursday that higher rates in the short term could also mean some slowing in the UK economy.

For the technical aspect, the RSI indicator is 61 as of writing, suggesting that sellers remain on the sidelines as the RSI on the four-hour chart stays near 60. For the Bollinger Bands, the price failed to preserve upside traction and started to retreat, therefore a continuation of the downside trend can be expected. In conclusion, we think the market will be bearish as long as the 1.2248 resistance line holds. On the upside, if the pair climbs above that level and starts using it as support, bulls could show interest and lift the pair higher.

Resistance: 1.2248, 1.2317, 1.2381

Support: 1.2154, 1.2068, 1.2027

XAUUSD (4-Hour Chart)

Despite the renewed weakness witnessed in the US dollar amid the softer-than-expected US PPI report on Thursday, the pair XAU/USD struggled to gather bullish momentum and retreated to the $1,787 area to erase most of its daily gains during the US trading session. XAU/USD is trading at 1,789.87 at the time of writing, losing 0.13% daily. Signs that inflation might have peaked already continue to support speculations for a less aggressive policy tightening by the Fed, as the softer-than-expected US PPI data have also reinforced market expectations. For the time being, a 50 bps rate hike by the Fed seems likely in the September meeting. Moreover, the risk-on market mood might keep a lid on any further gains for the safe-haven metal.

For the technical aspect, the RSI indicator is 52 as of writing, suggesting the pair’s indecisiveness in the near term as the RSI indicator stays near the mid-line. For the Bollinger Bands, the price witnessed fresh selling and dropped below the moving average, therefore the downside traction should persist. In conclusion, we think the market will be bearish as the pair is heading to test the 1785 support line. A break below that level could favour the bear skewed the risk to the downside.

Resistance: $1,811, $1,822, $1,831

Support: $1,785, $1,769, $1,756

Economic Data

CurrencyDataTime (GMT + 8)Forecast
GBPGDP (YoY) (Q2)14:002.8%
GBPGDP (QoQ) (Q2)14:00-0.2%
GBPGDP (MoM)14:00-1.2%
GBPManufacturing Production (MoM) (Jun)14:00-1.8%
GBPMonthly GDP 3M/3M Change14:00-0.3%

VT Markets The Adjustment Of Weekly Dividend Notification

Dear Client,

Warmly reminds you that the component stocks in the stock index spot generate dividends. When dividends are distributed, VT Markets will make dividends and deductions for the clients who hold the trading products after the close of the day before the ex-dividend date.

Indices dividends will not be paid/charged as an inclusion along with the swap component. It will be executed separately through a balance statement directly to your trading account, the comment for which will be in the following format “Div & Product Name & Net Volume ”.

Please note the specific adjustments as follows:

The above data is for reference only, please refer to the MT4/MT5 software for specific data.

If you’d like more information, please don’t hesitate to contact [email protected].

VT Markets New Products Launch

Dear Client,

To provide our clients with a wealth of trading options, VT Markets will launch new products on Aug 15th, 2022.
The specifications of the new products are shown in the table below.

The above data is for reference only, please refer to the MT4/MT5 software for specific data.

If you’d like more information, please don’t hesitate to contact [email protected].

Consumer prices rose 8.5% in July, less than expected as inflation eased.

US stocks surged on Wednesday, as the release of softer-than-expected inflation data bets the Federal Reserve could pivot to a smaller pace of hikes, while some market watchers take a grain of salt on the view and thought officials may still be a long way from their goal, 2% in the price increase.

The July Consumer Price Index (CPI) brought a sigh of relief to those with unstoppable inflation concerns, and swaps are now suggesting a move of 50 basis points as more likely in September than a repeat of the 75 bps increases that officials opted to implement at their past two meetings. In fact, the CPI surprise is just one piece of the intricate puzzle officials are playing with, as food prices in the US soared the most in July since 1979, keeping the cost of living painfully high even as lower gasoline costs offered some relief to consumers.

The benchmarks, S&P 500, Nasdaq 100, and Dow Jones Industrial Average surged on Wednesday as the critical US CPI indicated softer than expected results. All eleven sectors in S&P 500 stayed in positive territory and six out of eleven sectors rose more than 2% for the day, as Materials and Consumer Discretion performed the best among all groups, advancing with 2.88% and 2.87% respectively on Wednesday. The Dow Jones Industrial Average climbed 1.6%, Nasdaq 100 increased 2.8%, and the MSCI world index went up 1.8% on a daily basis for the day.

Main Pairs Movement

US dollar dropped on Wednesday, following a cooler-than-expected inflation report for July that raised expectations of a less hawkish interest rate hike cycle than previously anticipated by the Federal Reserve. The DXY index dropped to a level below 105.2 when critical data was released and fell deeper to a daily-low level below 104.7 during the middle of the US trading session. After the corrective pullback, the greenback oscillated in a range between 105.0 to 105.4.

The GBP/USD advanced with a 1.15% gain on a daily basis for the day. The cables attracted fresh transactions and reached a level above 1.225 as investors’ risk sentiment has improved dramatically following a significant decline in the US inflation rate. However, on the UK front, bulls are waiting for GDP due on Friday, and the economic data is likely to drop to 2.8% from the previous figure of 8.7%. Meanwhile, EUR/USD also surged to a monthly-high level above 1.036 amid a weak safe-haven greenback across the board. The pair rose with a 0.84% gain on a daily basis.

Gold slid on Wednesday, as the improvement in investors’ risk appetite. XAU/USD touched a refreshed monthly-high level to nearly US$1,808 mark while the announcement of US consumer data which the whole world focused on, then pullback and wavered in a range of US$1,788 to US$1,792 marks as a broader risk-on in the global market.

Technical Analysis

EURUSD (4-Hour Chart)

The EUR/USD pair surged on Wednesday, regaining upside momentum and touched a daily top above the 1.036 mark during the US session after the release of upbeat CPI data. The pair is now trading at 1.03522, posting a 1.35% gain on a daily basis. EUR/USD stays in the positive territory amid renewed weakness witnessed in the US dollar, as the greenback collapsed to multi-week lows in the sub-105.00 region and provided strong support to the EUR/USD pair. The US CPI declined to 8.5% on a yearly basis in July, which came in lower than the market’s expectations and acted as a tailwind for riskier assets. For the Euro, the energy crisis and elevated inflation remain a key focus for the growth outlook in the Eurozone, which might limit the upside for the EUR/USD pair.

For the technical aspect, the RSI indicator is 55 as of writing, suggesting that the pair is facing heavy bullish pressure as the RSI stays in the overbought zone. As for the Bollinger Bands, the price moved out of the upper band so a strong trend continuation can be expected. In conclusion, we think the market will be slightly bearish as the RSI is entering overbought levels. The pair might witness some short-term technical corrections before climbing higher toward the next resistance at 1.0438.

Resistance: 1.0438, 1.0484

Support: 1.0158, 1.0082, 0.9991

GBPUSD (4-Hour Chart)

The GBP/USD pair rallied on Wednesday, adding to its intraday gains and touched a daily high above the 1.226 mark in the US session amid a weaker US dollar across the board. At the time of writing, the cable stays in positive territory with a 1.37% gain for the day. The softer US CPI data today seems to have pushed back market expectations for a larger Fed rate hike move at the September policy meeting and exerted heavy bearish pressure on the safe-haven greenback. However, investors still expect more tightening from the Federal Reserve but the doors are open to less aggressive action, which means a rate hike of at least 50 basis points is still on the table. For the British pound, the fears of a possible recession and the BoE’s gloomy outlook could act as a headwind and cap the upside for the cable.

For the technical aspect, the RSI indicator stands at 68 as of writing, suggesting that the pair remains bullish in the short run as the RSI heads north almost vertically. For the Bollinger Bands, the price regained strong upside momentum and moved out of the upper band, therefore a continuation of the upside trend can be expected. In conclusion, we think the market will be bullish as the pair is heading to test the 1.2277 resistance line. The risk will remain skewed to the upside if the pair break above the aforementioned level.

Resistance: 1.2277, 1.2309, 1.2381

Support: 1.2186, 1.2068, 1.1940

XAUUSD (4-Hour Chart)

As the US dollar came under heavy selling pressure amid the softer-than-expected US CPI report on Wednesday, the pair XAU/USD witnessed some buying but then retreated to the US$1,793 area to surrender most of its daily gains during the US trading session. XAU/USD is trading at US$1,797.42 at the time of writing, rising 0.16% on a daily basis. The post-US CPI broad-based US dollar sell-off and diminishing odds for a larger Fed rate hike have both acted as a tailwind for the dollar-denominated gold, as the odds for a 75 bps Fed Rate hike move in September tumble to just 35% now. However, the risk-on market mood and the strong rally in the US equity markets should limit the gains for the safe-haven metal.

For the technical aspect, the RSI indicator stands at 64 as of writing, suggesting that the upside is more favoured as the RSI indicator remains above the mid-line. For the Bollinger Bands, the price continued to rise toward the upper band, therefore the upside traction should persist. In conclusion, we think the market will be bullish as the technical indicators head firmly higher within positive levels. On the upside, a break above the US$1,812 resistance could open the door for additional gains.

Resistance: 1812, 1822, 1831

Support: 1785, 1769, 1756

Economic Data

CurrencyDataTime (GMT + 8)Forecast
USDInitial Jobless Claims20:30263K
USDPPI (MoM) (Jul)20:300.2%

VT Markets Modifications of Contract Size

Dear Client,

To provide a more favorable trading environment to our clients, VT Markets will modify the contract size of the following products:

1. The contract size of HK50ft will be 1.

2. The contract size of EOSUSD, XLMUSD will be 10,000.

The modifications will be put into effect from 2022/08/13:

The above data is for reference only, please refer to the MT4/MT5 software for specific data.

Friendly reminders:
1. All specifications of the above products stay the same except contract size.

2. The lots of each client’s open positions on HK50ft will multiply by 10 after the modification. The lots that exceed the maximal volume will be split into a new position.

3. For the part of the position that is lower than the minimum lot size after the modification, they will be automatically closed at the EOD price on 2022/08/12.

If you’d like more information, please don’t hesitate to contact [email protected].

Markets await Wednesday’s Inflation reading. Still high but anticipated to cool down.

Stocks retreated on Tuesday, as a downbeat outlook from a giant chipmaker, Micron, added to recession fears. Investors were unwilling to make any risky moves before Wednesday’s pivotal inflation reading, which is forecasted to cool a bit while remaining at high levels. The report will come on the heels of recent jobs figures underscoring slid wage growth and US productivity data highlighting another surge in labour costs that could further complicate the Federal Reserve’s decision to tame inflation. Timing the peak of inflation is difficult, especially after June’s CPI print turned out to be hotter than expected. It’s also worth noting that Bitcoin resumed its slump, ending a four-day winning streak as volatility continued to whipsaw the crypto world.

The benchmark, S&P 500 and Dow Jones Industrial Average both slid on Tuesday, amid undermining risk sentiment ahead of the release of a key consumer index. Seven out of eleven sectors stayed in the negative territory, as Consumer Discretion and Information Technology performed worst among all groups, fell with 1.54% and 1.00% losses respectively on Tuesday. However, Energy and Utilities sectors outperformed all the other groups, rising 1.77% and 1.06% respectively for the day. The Dow Jones Industrial Average declined 0.2%, Nasdaq 100 dropped 1.1%, and the MSCI world index fell 0.5%.

Main Pairs Movement

US dollar changed a little bit down on Tuesday, as thin summer trading and risk appetite dwindled ahead of critical inflation figures that could offer clues on how hawkish the Federal Reserve will be in its interest rate hike in September. The DXY index had drifted lower from the start of the trading session, but then rebounded to oscillate in a range of 106.1 to 106.4 level as stock markets slid on profit warnings, inflation concerns and data showed US worker productivity fell sharply in the second quarter.

The GBPUSD remained almost unchanged for the day. The cables edged higher amid some greenback selling in the first half of Tuesday, then faced selling pressure and lost all the gains earlier as pessimism in UK economic data and the hawkish stance of the Fed. Meanwhile, EURUSD attracted fresh transactions and touched a daily high level of nearly 1.025 as a weak US dollar across the board during the Asia trading session, then corrective pullback to 1.021 ahead of the CPI index. The pairs advanced with a 0.16% gain on a daily basis on Tuesday.

Gold surged on Tuesday, as global recession concerns weigh on investors’ sentiment and benefit safe-haven metal. XAU/USD touched a one-month high of US$1800 during the US trading session as bad news was announced from US stock markets and investors remained cautious ahead of the CPI report.

Technical Analysis

EURUSD

The EUR/USD pair advanced on Tuesday, preserving its bullish strength and extending the previous rebound toward the 1.022 area as investors await the key US CPI data. The pair is now trading at 1.02214, posting a 0.29% gain on a daily basis. EUR/USD stays in the positive territory amid a weaker US dollar across the board, as the sour market sentiment failed to lift the safe-haven greenback higher. Investors remain cautious ahead of the release of the US Consumer Price Index on Wednesday, which would set the tone for the Federal Reserve’s September meeting. For the Euro, the latest news showed that Russia has suspended oil flows via the southern leg of the Druzhba pipeline, which acted as a headwind for the shared currency and limit the upside for the EUR/USD pair.

For the technical aspect, the RSI indicator stands at 55 as of writing, suggesting that the upside is losing strength as the RSI keeps moving toward the mid-line. As for the Bollinger Bands, the price failed to touch the upper band and witnessed some selling, therefore the bearish momentum should persist. In conclusion, we think the market will be bearish as long as the 1.0246 resistance line holds. Technical readings in the chart skew the risk to the upside, as the technical indicators retreated toward their midlines.

Resistance: 1.0246, 1.0287, 1.0438

Support: 1.0150, 1.0111, 0.9991

GBPUSD

The GBP/USD pair edged higher on Tuesday, failing to extend its upside movements and dropped toward the 1.208 mark to erase most of its daily gains in the US session amid the rebound witnessed in the US dollar. At the time of writing, the cable stays in positive territory with a 0.09% gain for the day. The negative shift witnessed in risk sentiment is helping the greenback to find demand and exerted bearish pressure on the GBP/USD pair. For the British pound, the Bank of England Deputy Governor Dave Ramsden’s hawkish comments on Tuesday have underpinned the cable, as he said that it’s more likely than not that BoE will have to raise bank rate further even if a recession forces it to start lowering the policy rate.

For the technical aspect, the RSI indicator is at 46 as of writing, suggesting that the downside is more favoured as the RSI stays below the mid-line. For the Bollinger Bands, the price lost its upside traction and dropped below the moving average, therefore a continuation of the downside trend can be expected. In conclusion, we think the market will be bearish as long as the pair failed to break above the 1.2121 resistance line. On the downside, sellers could show interest if the pair falls back below 1.2027 support and additional losses could be expected.

Resistance: 1.2121, 1.2188, 1.2277

Support: 1.2027, 1.1940, 1.1897

XAUUSD

As the US dollar remained on the back foot throughout the day despite the cautious market mood on Tuesday, the pair XAU/USD preserved its upside strength and extended the rebound toward the US$1,800 area during the US trading session. XAU/USD is trading at US$1,797.05 at the time of writing, rising 0.44% on a daily basis. The modest US dollar weakness and sour market sentiment both provided support to the dollar-denominated gold, as the growing fears about a global economic downturn continued to weigh on investors’ mood. However, the Fed rate hike expectations might limit the upside for the precious metal as markets are now pricing in a 70% chance for a 75 bps Fed rate hike move at the September meeting following the upbeat US jobs data last Friday.

For the technical aspect, the RSI indicator is at 64 as of writing, suggesting the pair’s bullish outlook in the near term as the RSI indicator remains above the mid-line. For the Bollinger Bands, the price continued to rise toward the upper band, therefore a continuation of the upside trend could be expected. In conclusion, we think the market will be bullish as the pair is testing the US$1,794 resistance line. The pair could likely break above that level and extend its upside movements toward the US$1,811 mark.

Resistance: 1794, 1811, 1831

Support: 1769, 1756, 1735

Economic Data

CurrencyDataTime (GMT + 8)Forecast
USDCore CPI (MoM) (Jul)20:300.5%
USDCPI (YoY) (Jul)20:308.7%
USDCrude Oil Inventories22:300.073M

Earnings Downgraded due to Rising Interest rate Risks and Slowing Growth

US stock declined on Monday and failed to hold onto gains. S&P500 erased a rally that reached 1% earlier in the day, while the Nasdaq 100 underperformed after an advance that briefly drove the tech 20% above its June low. Nvidia tumbled almost 6.5% with a release of a gloomy forecast. Mounting risks of more aggressive interest rate policy and slowdown economic growth have sparked earnings downgrade.

The latest survey from the Fed Bank of New York showed that consumers’ expectations for US inflation would sharply decline over the coming years, with the dropping price of oil playing a key role in those results and likely contributing to a lower headline rate of inflation for July released on Wednesday. Still, almost all inflation measures are running well above the Fed’s 2% target.

The benchmark, S&P500 slid with a 0.12% loss on daily basis, although it gained 1% growth at the beginning of the trading session. However, six out of eleven still stayed in positive territory, as Real Estate performed best among all groups, rising 0.71% for the day, while Information Technology got the worst performance and fell 0.88% on Monday. The Dow Jones Industrial Average almost remained not changed, Nasdaq 100 declined by 0.4%, and the MSCI World index rose 0.1% for the day.

Main Pairs Movement

US dollar eased on Monday, giving back some gains it made following Friday’s blockbuster U.S. jobs report. Investors stayed aside to look ahead to Wednesday’s inflation data for more clues about Federal Reserve’s next steps. The DXY index dropped sharply in the first half of Monday and touched a daily-low level below 106.1, then regain fresh transactions and rebound to the 106.4 level.

The GBP/USD has little changed up for the day, as investors await US CPI data and the release of UK Gross Domestic Product (GDP) released on Friday. The cables mildly climbed to a daily high level around 1.214 before the US trading session, then confronted huge selling pressure and oscillates in a narrow range of 1.206 to 1.208 from the late New York session.
Meanwhile, EURUSD wavered between 1.018 to 1.020 after strong downside traction during the US trading session. The pairs little advanced with a 0.14% gain on Monday.

The Gold rose with a 0.76% gain on daily basis on Monday, amid a weak US dollar across the board and retreating US bond yields. XAUUSD managed to attract fresh buying and builds on its steady intraday ascent through the early New York session, and touched a daily high above $1786 marks. It’s also worth noting that, WTI and Brent oil surged by 1.97% and 1.82% respectively, which would be a sign of consumer data announced on Wednesday.

Technical Analysis

EURUSD (4-Hour Chart)

The EUR/USD pair edged higher on Monday, regaining upside momentum and rebounded from the 1.015 area that it touched last Friday amid a better market mood. The pair is now trading at 1.02167, posting a 0.36% gain daily. EUR/USD stays in the positive territory amid a weaker US dollar across the board, as the retreating US Treasury bond yields and firmer equities both exerted bearish pressure on the safe-haven greenback. Investors are now accessing the better-than-expected US job data, which increases the speculation of a more aggressive policy tightening by the Fed in the next months. The probability of a 75 bps rate hike next month is now at nearly 68%. For the Euro, the Eurozone Sentix Investor Confidence index came in at -25.2 in August, which failed to ease off recession fears in the Eurozone.

For the technical aspect, the RSI indicator is 54 figures as of writing, suggesting that the upside is more favoured as the RSI stays above the mid-line. As for the Bollinger Bands, the price preserved its upside traction and climbed above the moving average, therefore the bullish momentum should persist. In conclusion, we think the market will be bullish as the pair is heading to test the 1.0246 resistance line. A break above that level would skew the risk to the upside.

Resistance: 1.0246, 1.0287, 1.0438

Support: 1.0150, 1.0111, 0.9988

GBPUSD (4-Hour Chart)

The GBP/USD pair advanced on Monday, extending its recovery and touching a daily top above the 1.213 mark in the early US session amid the risk-positive market atmosphere. At the time of writing, the cable stays in positive territory with a 0.40% gain for the day. The US dollar struggled to capitalize on Friday’s upbeat NFP report as the falling US Treasury bond yields made it difficult to find demand. The market focus now shifts to the US CPI data this Wednesday, which might provide fresh impetus for the GBP/USD pair. For the British pound, the BoE’s gloomy economic outlook continues to act as a headwind for the pair. Meanwhile, the policy gap between the Fed and BoE could continue to widen and undermine the cable amid the hawkish stance of the Fed’s policy tightening outlook.

For the technical aspect, the RSI indicator is 47 figures as of writing, suggesting that the downside is preserving strength as the RSI keeps heading south. For the Bollinger Bands, the price witnessed fresh selling and failed to climb above the moving average, therefore some downside tractions can be expected. In conclusion, we think the market will be slightly bearish as long as the 1.2154 resistance line holds. On the upside, technical recovery could stretch higher toward 1.2198 if the pair starts using that level as support.

Resistance: 1.2154, 1.2198, 1.2277

Support: 1.2027, 1.1940, 1.1830

XAUUSD (4-Hour Chart)

As the US dollar came under bearish pressure amid the retreating US bond yields on Monday, the pair XAU/USD regained upside momentum and refreshed its daily high near the $1,790 level during the US trading session. XAU/USD is trading at 1788.91 at the time of writing, rising 0.74% daily. The risk-on flows have returned at the start of the week after market reaction to the upbeat US jobs data fades. Investors are now waiting for the latest US consumer inflation figures, which would influence Fed rate hike expectations and play a key role in driving the near-term USD demand. Markets are now pricing in a nearly 70% probability of a 75 basis points rate increase in September.

For the technical aspect, the RSI indicator is 59 figures as of writing, suggesting the pair’s bullish outlook in the near term as the RSI indicator keeps rising. For the Bollinger Bands, the price preserved its upside traction and crossed its moving average into positive territory, therefore a continuation of the upside trend could be expected. In conclusion, we think the market will be bullish as the pair is heading to test the 1794 resistance line. A break above that level might favour the bull and open the door for additional gains in the near term.

Resistance: 1794, 1811, 1831

Support: 1769, 1756, 1735

Back To Top
server

Hello there 👋

How can I help you?

Chat with our team instantly

Live Chat

Start a live conversation through...

  • Telegram
    hold On hold
  • Coming Soon...

Hello there 👋

How can I help you?

telegram

Scan the QR code with your smartphone to start a chat with us, or click here.

Don’t have the Telegram App or Desktop installed? Use Web Telegram instead.

QR code