US Fed’s Jackson Hole Symposium, US Data in Focus This Week

The US Federal Reserve’s 2022 Jackson Hole Symposium will be held in Cheyenne, Wyoming, from 25-27 August. Central bankers and economists from across the globe will attend the event. 

The meeting is one of the most anticipated events for economists and investors alike as it offers an opportunity for Fed officials to discuss their outlook for monetary policy. In addition to this highly anticipated event, we have a host of economic data that could impact markets over the next few days. 

Several prominent economic indicators like US Flash Services PMI and Prelim GDP, as well as Core PCE Price Index for July, will be published this week. France, Germany, and the United Kingdom will also release their Flash Services PMI figures on Tuesday, 23 August. Meanwhile, Germany and the United Kingdom will release their Manufacturing PMIs on the same day.

Image source: forexfactory.com  

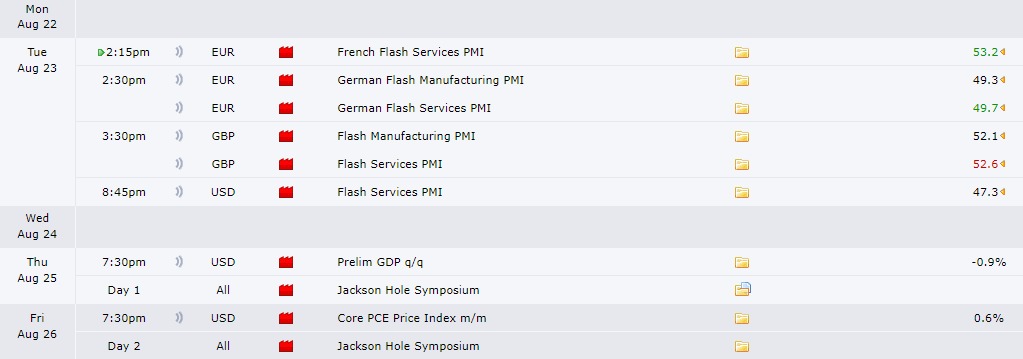
French Flash Services PMI | 23 August 2022

July saw the French Flash Services Purchasing Managers Index fall to 53.2, from 53.9 in June, the third successive decline in the growth rate and the weakest since January this year, amid weaker demand for services. Despite rising inflation, businesses were slightly more optimistic in July.

Germany’s Flash Manufacturing PMI | 23 August 2022

Germany’s Flash Manufacturing PMI declined from 52 to 49.3 in July 2022, showing that manufacturing slowed down. The most significant drop was in input demand, which fell because of a slowdown in the supply chain. Employment levels rose at a slower pace, while business expectations remained low.

United Kingdom’s Manufacturing PMI | 23 August 2022

In July of 2022, the Purchasing Managers’ Index for UK manufacturing fell to 52.1, down from 52.8 in June, with the decline attributed to decreases in consumer and intermediate goods sub-industries.

United Kingdom’s Flash Services PMI | 23 August 2022

The Flash Services PMI dropped to 52.6 in July of 2022 from 54.3 in June, indicating a slowdown in the expansion of services activity. Inflationary pressures and the cost-of-living squeeze led to more significant economic uncertainty, and businesses expected conditions would remain the same for at least another few months.

US Flash Services PMI | 23 August 2022

The US Flash Services PMI took a hit in July, falling to 47.3 in July 2022, from 52.7 in June. Although new orders returned to growth, the expansion rate was historically subdued and much slower than those seen earlier in the year. Inflationary pressures remained traditionally high in July but eased further. Businesses are expected to improve in the next few months.

Jackson Hole Economic Symposium | 25 – 27 August 2022

The Jackson Hole Economic Symposium takes place annually on the last Friday in August. This year’s topic will be “Reassessing Constraints on the Economy and Policy,” with speeches from federal reserve board members and other economists about current economic conditions and policies. The Economic Symposium is organised by the Federal Reserve Bank of Kansas City in conjunction with a group of academic economists and financial industry representatives. It attracts thousands of attendees annually from around the world.

US Prelim GDP | 25 August 2022 

US GDP shrank 0.9% in the second quarter of 2022, after shrinking 1.6% in the first quarter and crossing into recession. US Federal Reserve Chair Jerome Powell recently stated that he did not believe the US was in a recession, causing the markets to expect an increase of 0.5%.

US Core PCE Price Index | 26 August 2022 

In June of 2022, the Core PCE Price Index in the US increased 1% month-on-month—the highest monthly growth since September 2005. Core PCE Price Index data is forecast at 1% for July. Inflation will likely increase further in the coming months, driven by higher energy prices. The US economy is forecast to grow steadily in 2019-2022, putting upward pressure on wages and consumer price inflation.

Markets Cautious with more Fed officials supporting rate hikes ahead of Jackson Hole Symposium

US stocks declined on Friday and snapped the longest weekly rally since November. Investors turned cautious and short-sellers resurfaced after Federal Reserve officials beat the drum on hiking rates. The pullback in equities this week follows a rally that has propelled the S&P500 from its mid-June nadir amid speculation that the Fed may scale back its aggressive path of rate hikes. However, more Fed officials joined the chorus of a hawkish stance in the runup to the annual symposium at Jackson Hole Aug. 25-27. Which makes a force that contributed to the rally now showing signs of fatigue, with hedge funds dialing down purchases of shares.

The benchmarks, S&P 500 and Dow Jones Industrial Average both dropped on Friday, as S&P500 notched its biggest daily decline since June, its first weekly loss in five weeks. Nine out of eleven sectors stayed in negative territory, and six of them fell more than 1% on daily basis. It’s worth noting that, the Consumers Discretion and Financials sectors performed the worst among all groups, sliding with 2.10% and 2.02% loss for the day. The Dow Jones Industrial Average fell 0.9%, the Nasdaq 100 dropped 1.9%, and the MSCI world index decreased 1.3% on Friday.

Main Pairs Movement

The US dollar surged on Friday, which posts the biggest weekly advance since April 2020.  The minutes of the July meeting suggested that the Fed will continue to raise interest rates at the next few meetings, but the pace of the rate hikes will be data-dependent, which supports the greenback. The DXY index witnessed fresh transactions since the UK trading session and edged higher to a level above 108.1.

The GBP/USD dropped with a 0.85% loss on daily basis for the day, as sentiment shifted sour after Fed’s hawkish commentary. The cables were weighted to a daily low level below 1.180 during the middle of the US trading session as the strong US dollar across the board, then oscillate in a range from 1.181 to 1.184. Meantime, EUR/USD slid to a level below 1.004. The pair decreased by 0.50% on Friday.

Gold plunged 0.66% daily for the day, with a fifth-consecutive day as market mood amid a backdrop of fear and volatility.  Although under selling pressure, XAU/USD observed fresh transactions before the US trading session and touched a daily high of $1,758 marks. However, gold then witnessed downside traction and fell to the daily low below $1,746 marks at the beginning of the US trading session.

Technical Analysis

EUR/USD (4-Hour Chart)

The EUR/USD pair declined on Friday, extending its previous slide and held lower ground near the monthly low below the 1.005 mark amid fears of German recession and geopolitical concerns. The pair is now trading at 1.0048, posting a 0.36% loss daily. EUR/USD stays in the negative territory amid a stronger US dollar across the board, as the DXY just prints new multi-week tops above the 108.00 hurdle on Friday and exerted bearish pressure on the EUR/USD pair. The hawkish comments from the Fed policymakers in recent days continued to drive flows toward safety assets like the greenback, as markets seem convinced that the Fed will stick to its policy tightening cycle amid the incoming positive US macro data. For the Euro, Germany’s Producer Price Index (PPI) for July came at 5.3% MoM, which is higher than markets’ expectations.

For the technical aspect, RSI indicator is 24 as of writing, suggesting that the pair might witness some upside correction as the RSI stays in the oversold zone. As for the Bollinger Bands, the price continued to move alongside the lower band, therefore the downside traction should persist. In conclusion, we think the market will be bearish as long as the 1.0082 resistance line holds. But the pair could see some short-term correction before edging lower amid the oversold RSI.

Resistance:  1.0082, 1.0111, 1.0188

Support: 1.0111, 0.9991

GBP/USD (4-Hour Chart)

The GBP/USD pair tumbled on Friday, coming under heavy selling pressure and dropped to a monthly low below 1.1840 level in the US trading session amid renewed US dollar strength. At the time of writing, the cable stays in negative territory with a 0.88% loss for the day. The prospects for further rate increases by the Fed and the prevalent risk-off mood both acted as a headwind for the GBP/USD pair, as the US central bank is expected to stick to its policy tightening path due to recent comments by several Fed officials. For the British pound, the better-than-expected UK Retail Sales rose 0.3% in July but failed to provide bullish strength to the cable, which is being weighed by the Bank of England’s gloomy economic outlook and a possible recession that would start in the fourth quarter.

For the technical aspect, the RSI indicator is 30 as of writing, suggesting that the pair could stage a correction before extending its slide as the RSI dropped below 30. As for the Bollinger Bands, the price preserved its downside traction and move alongside the lower band, therefore a continuation of the downtrend can be expected. In conclusion, we think the market will be bearish as the pair is testing the 1.183 support. A break below that level could drag the pair toward the next support at 1.1780.

Resistance: 1.1922, 1.2050, 1.2119

Support: 1.1830, 1.1780

XAU/USD (4-Hour Chart)

Gold price declined to $1,750 during the European trading hours on Friday. Price continually slumped to below $1,750 in the US session after managing to erase its losses in the late EU session. With the 10-year US Treasury bond yield rising on the trade of the day and a stronger US dollar, the gold price seems hard to gather bullish momentum. Any further advance is taken as a selling opportunity by investors now.

From a technical aspect, the gold price drops below the $1,757 support level, and it turns out to be the pressure level to the upside. RSI indicator is 32 as of writing, suggesting downside momentum.  As for the Bollinger Bands, the price tumbled along with the lower bound, staying right above it rather than dropping into the oversold zone, which means a decline before is acceptable and further decline to the downside could be expected. In conclusion, the gold price has dropped below the previous support zone at $1,757 and failed to regain the losses. The price could head to the next pivotal support zone for gold at the $1,714 level, which is the most possible path for gold price from technical analysis.

Looking ahead, in absence of any top-tier US economic events, the repricing of Fed expectations will play a key role in the gold price action. For more price action, all eyes now turn towards the Fed’s Jackson Hole Symposium this week.

Resistance: $1,757, $1,783, $1,803

Support: $1,714, $1,685

Economic Data

CurrencyDataTime (GMT + 8)Forecast
CNYPBoC Loan Prime Rate21:152.75%

VT Markets TSLA Stock Split Notification

Dear Client,

Please be advised of the upcoming Tesla (TSLA) stock split that is going to take place as per the following schedule:

Ex-Date: August 25th, 2022. Common shares will trade at the new split-adjusted price.

Important implications of the TSLA Stock Split:

1. The quantity of shares of each client’s position will multiply by 3.

2. Post-split, the “open price” and “take profit / stop loss” of each position will be adjusted, which will be the original price divided by 3.

3. The estimated post-split price may be 3/1 of the EOD price on 24th, August.

4. All pending orders at the time of the split (Buy Limit, Sell Limit, Buy Stop, Sell Stop, Buy Stop Limit, Sell Stop Limit) will be cancelled.

5. All TSLA holding positions and pending orders on DEMO account will be closed as a result of the stock split.

The above data is for reference only, please refer to the MT4/MT5 software for specific data.

You might want to know more about stock splits?

For more details on stock splits, please visit the following articles:
https://helpcentre.vtmarkets.com/hc/en-us/articles/8597160316697-What-is-stock-split-

If you’d like more information, please don’t hesitate to contact [email protected]

VT Markets Notification of Server Upgrade

Dear Client,

As part of our commitment to provide the most reliable service to our clients,

there will be a server maintenance this weekend.

Maintenance Hours :

2022/08/20 13:00 – 18:00 (Server time)

Please be reminded that:

During this weekend’s maintenance period, clients can still trade as usual.

However, the stability of quotations and market liquidity will be affected and decreased.

Thank you for your patience and understanding about this important initiative.

If you’d like more information, please don’t hesitate to contact [email protected]

Weekly Jobless Claims Fell, Strength Demand in Labour?

US stocks edged higher on Thursday, as mixed economic and earnings reports failed to spark a broad conviction trade.  The weekly jobless claims data fell for the first time in three weeks, a sign of strength in demand for labour, while a gauge of manufacturing activity in the Philadelphia area unexpectedly expanded in August. Meantime, following the equity rally from June lows, sentiment turned fragile Wednesday after the Fed minutes signalled inflation-busting rate hikes will continue despite a weakening economy. Further clues for policy makers’ views may come at the Fed’s annual symposium in Jackson Hole, Wyoming next week.

The benchmarks, both S& P500 and Nasdaq 100 advanced after swinging between modest gains and losses on Thursday. Seven out of eleven sectors of S& P500 stayed in the positive territory, as Energy got the best performance among all groups, which rose 2.53% on daily basis, while Real Estate underperformed and slid 0.75% for the day as existing-home sales fell for six straight months, indicating housing market’s rapid decline. The Dow Jones Industrial Average was little changed, the Nasdaq 100 rose 0.3%, and the MSCI World index was little changed on Thursday.

Main Pairs Movement

US dollar surged on Thursday, as Federal Reserve officials spoke of the need for further rate hikes, and investors need to reevaluate minutes from the US central bank’s July meeting on Wednesday as being more hawkish. The DXY index gained bullish momentum during the US trading session and broke through to a month-high level above 107.5 amid a cautious market mood.

The GBP/USD dropped 0.98% on Thursday, as the strong US dollar across the board was caused by the hawkish speech from Fed officials. The safe-haven greenback has witnessed strong transactions weighting the cables since the US trading session, and the pair touched nearly a month-low level below 1.193. Meanwhile, EUR/USD holds lower ground after refreshing its monthly bottom the previous day and fell to a level below 1.008 at the end of the day. The pair dropped 0.91% daily on Thursday.

Gold slid with a 0.18% loss for the day, as a four consecutive days decline. With hawkish Fed speech and fears surrounding China’s recession exert downside pressure. XAU/USD observed fresh tractions during the UK session and touched a daily-high level above $1,772 marks, but then lost upward momentum and dropped to a level below $1,760 marks during the US trading session. WTI and Brent oil surged on Thursday, rising 2.71% and 3.09% respectively.

Technical Analysis

EURUSD (4-Hour Chart)

The EUR/USD pair declined on Thursday, being surrounded by bearish pressure and dropped to a daily low below 1.012 level at the start of the US session amid the risk aversion market environment. The pair is now trading at 1.0134, posting a 0.42% loss daily. EUR/USD stays in the negative territory amid renewed US dollar strength, as the better-than-expected US macro data provide some support to the safe-haven greenback and dragged the EUR/USD lower. The US Weekly Initial Jobless Claims declined to 250K and came in lower than the market expectation of 265K, which underpinned the expectations that the Fed would continue to tighten its monetary policy. For the Euro, the Eurozone inflation arrives at 8.9% YoY in July, meeting the market’s estimates. But the energy supply-related concerns keep being a key factor acting as a headwind for the shared currency.

For the technical aspect, the RSI indicator is 31 as of writing, suggesting that the pair is facing heavy selling pressure as the RSI is approaching the oversold zone. As for the Bollinger Bands, the price has moved out of the lower band so a strong downside trend continuation can be expected. In conclusion, we think the market will be bearish as the pair is testing the 1.0111 support. A break below that level could confirm the bearish bias in the near term and drag the pair lower toward 1.0062.

Resistance:  1.0188, 1.0246, 1.0287

Support: 1.0111, 1.0062, 0.9991

GBPUSD (4-Hour Chart)

The GBP/USD pair tumbled on Thursday, extending its previous slide and refreshing its daily low below the 1.200 mark heading into the US trading session amid a souring market mood. At the time of writing, the cable stays in negative territory with a 0.49% loss for the day. The hawkish commentary from Fed’s official helped the safe-haven Dollar to find demand, as San Francisco Fed President Mary Daly reiterated that it was way too early to declare victory on inflation in an interview with CNN on Thursday. She also said that either 50 bps or a 75 bps hike would be appropriate. For the British pound, the currency remained under pressure despite the hotter-than-expected UK CPI data, as investors now speculate that an economic downturn might force the BoE to adopt a gradual approach to raising interest rates.

For the technical aspect, the RSI indicator is 30 as of writing, suggesting the pair’s bearish outlook in the near term as the RSI is reaching the oversold zone. As for the Bollinger Bands, the price witnessed heavy selling pressure and dropped below the lower band, therefore the downside traction should persist. In conclusion, we think the market will be bearish as the pair is heading to test the 1.1940 support. Additional losses toward 1.1897 could be witnessed if the pair break below the aforementioned support.

Resistance: 1.2071, 1.2119, 1.2188

Support: 1.1940, 1.1897, 1.1830

XAUUSD (4-Hour Chart)

Gold gains some positive traction on Thursday, but immediately declined back to the $1,760 level. A stronger US dollar is still weighing on Gold prices.

The dollar surged to a fresh monthly high on firm expectations that the Federal Reserve will continue to tighten monetary policy. Although the FOMC minutes released on Wednesday did not hint at a specific pace of future rate hikes, still show that policy makers remained committed to raising rates to tame inflation, which still supported bullish sentiment around the US dollar.

For the technical aspect, the RSI is 33 as of writing, are still in bearish mode but not reaching the oversold zone. As for the Bollinger Bands, the gold price keeps moving between the moving average and lower bound, forming a clear downward tunnel. The price seems to test support above the $1,757 level. If the price closes with negative price action below the $1,757 level on the 4H chart, it might head to test the next support level at the $1,714 level.

In conclusion, the fundamental background suggests that the most likely path for gold is to the downside. Even from a technical perspective, the recent positive moves are still seen as selling opportunities by investors, gold price, therefore, declined downward on the 4H Chart and hardly gained positive traction. We think the market is still bearish as fundamental background and technical analysis both support downward traction. Now, investors are looking forward to the US economic data, seeking broader risk sentiment which could provide clear direction and fresh momentum for gold prices.

Resistance: $1,783, $1,803, $1,857

Support: $1,757, $1,714, $1,685

Economic Data

CurrencyDataTime (GMT + 8)Forecast
GBPRetail Sales (MoM) (Jul)14:00-0.2%
CADCore Retail Sales (MoM) (Jun)20:300.9%

VT Markets The Adjustment Of Weekly Dividend Notification

Dear Client,

Warmly reminds you that the component stocks in the stock index spot generate dividends. When dividends are distributed, VT Markets will make dividends and deductions for the clients who hold the trading products after the close of the day before the ex-dividend date.

Indices dividends will not be paid/charged as an inclusion along with the swap component. It will be executed separately through a balance statement directly to your trading account, the comment for which will be in the following format “Div & Product Name & Net Volume ”.

Please note the specific adjustments as follows:

The above data is for reference only, please refer to the MT4/MT5 software for specific data.

If you’d like more information, please don’t hesitate to contact [email protected].

The Fed’s Rate hikes to Control Inflation Weighed on the Market Sentiment

US stocks declined for the first time in four days as investors assessed the outlook for the path of interest-rate hikes after a minute of Federal Reserve’s last meeting noted officials saw risks from tightening more than necessary. Moreover, the stock market rallied on signs of peaking inflation and an earnings reporting season that saw four out of five companies meeting or beating estimates. However, prospects of the Fed continuing to raise rates to cool inflation and tip the economy into recession have weighed on market sentiments.

The benchmarks, both S&P 500 and Dow Jones Industrial Average slid on Wednesday, as Fed minutes note it may be appropriate to slow increases. Ten out of eleven sectors of S&P 500 stayed in the negative territory, as Communication Service and Material sectors performed worst among all groups, falling 1.40% and 1.85% on daily basis respectively. Energy is the only section in positive territory, rose with a 0.81% gain for the day. The Dow Jones Industrial Average decreased 0.5%, the Nasdaq 100 dropped 1.2%, and the MSCI World index fell 0.6% on Wednesday.

Main Pairs Movement

The US dollar little advanced on Wednesday, as the minutes from Federal Reserve’s July meeting, showed that Fed officials are concerned the US central bank could raise interest rates too far as part of its commitment to get inflation under control. The DXY index witnessed fresh transactions during the UK trading session and touched a daily high level of nearly 106.9 level, however, paring most gains and reached a daily low level below 106.4 after the FOMC minute.

The GBP/USD dropped with a 0.40% loss on daily basis after a volatile day, as UK’s 40-year high inflation propelled recession woes and the minute of the Federal Reserve. The cables were under heavy selling pressure during the UK trading session amid a pessimistic market mood towards economic growth. However, GBP/USD rebounded after the Fed minute and oscillate around the 1.2045 level. Meanwhile, EUR/USD touched a daily-high level above 1.020 after the minute by Fed. The pair rose 0.09% for the day.

Gold dropped on Wednesday, and remains under pressure around a two-week low, down for the fourth consecutive day. XAU/USD edged lower since the UK trading session as a strong greenback across the board and touched a daily low below $1,760 in the middle of the US trading session.
WTI and Brent oil advanced for the day, rising 1.83% and 0.77% respectively.

Technical Analysis

EURUSD (4-Hour Chart)

The EUR/USD pair edged lower on Wednesday, remaining under pressure and surrendered most of its daily gains after touching a daily high above the 1.019 mark amid a soured market mood. The pair is now trading at 1.0164, posting a 0.08% loss daily. EUR/USD stays in the negative territory amid renewed US dollar strength, as global stocks turned sharply lower ahead of the release of the latest FOMC Meeting Minutes and lend support to the safe-haven greenback. The US Retail Sales stay unchanged in July and came in slightly weaker than the market expectation of +0.1%, which failed to provide impetus to the markets as the focus now shifts to FOMC minutes. For the Euro, the Eurozone GDP expanded by 0.6% QoQ in the second quarter of this year, but the markets react little to the economic data.

For the technical aspect, the RSI indicator is 39 as of writing, suggesting that the downside is more favoured as the RSI stays below the mid-line. As for the Bollinger Bands, the price retreated and failed to cross above the moving average, therefore some downside traction can be expected. In conclusion, we think the market will be bearish as the pair might head to test the 1.0139 support. The risk is also skewed to the downside as the pair is developing below all of its moving averages.

Resistance: 1.0237, 1.0287, 1.0347

Support: 1.0139, 1.0111, 1.0016

GBPUSD (4-Hour Chart)

The GBP/USD pair declined on Wednesday, failing to preserve its upside traction that was witnessed earlier in the Asia session and refreshed its daily low below 1.205 level ahead of FOMC meeting minutes. At the time of writing, the cable stays in negative territory with a 0.53% loss for the day. The speculations that the Fed would stick to its policy tightening path have been fueled by the recent hawkish remarks by several Fed officials. On top of that, the rising US Treasury bond yields also helped the US dollar to find demand and undermined the GBP/USD pair. For the British pound, the UK Consumer Prices Index (CPI) rose to 10.1% YoY in July, which came in hotter-than-expected but failed to provide strong support to the cable as the US economic data have lifted bets for a larger Fed rate hike move at the September meeting.

For the technical aspect, the RSI indicator is 37 as of writing, suggesting the pair’s bearish outlook in the near term as the RSI keeps heading south. As for the Bollinger Bands, the price witnessed fresh selling and dropped toward the lower band, therefore a continuation of the downside trend can be expected. In conclusion, we think the market will be bearish as the pair is testing the 1.2027 support. A break below that level could open the door for additional losses and the falling RSI also reflects bear signals.

Resistance: 1.2119, 1.2186, 1.2248

Support: 1.2027, 1.1940, 1.1897

XAUUSD (4-Hour Chart)

Gold slumps below $1,770 on Wednesday, dropping to its two weeks low. Rising yields and a stronger US dollar are weighing on the gold price. The benchmark 10-year US Treasury bond yield is up nearly 3% on the trade of the day, forcing XAU/USD to come under more bearish pressure.

For the technical aspect, XAU/USD drifts in negative for the third successive day forming a clear downward trend and slumps below the $1,770 level in the European session. The price continued to drop in the early US session. At the time of writing, the price is $1,760 level testing the support level at $1,757. The RSI indicator is 33 as of writing, suggesting that the price is still under downside pressure. For the Bollinger Bands, the price tumbled but still maintained slightly above the lower bound, indicating that the price is not yet dropped below oversell zone. In conclusion, we think the market is still in bearish mode as the RSI indicator keeps in a downtrend and the price keeps edging low.

Markets are now pricing in at least a 50 bps rate hike at the September FOMC meeting. As such, clues about the possibility of a larger 75 bps move will play a key role in influencing the recent USD price and determining the next move for gold. For more price action, eye on the tier 1 US economic data.

Resistance: 1783, 1803, 1857

Support: 1757, 1714, 1685

Economic Data

CurrencyDataTime (GMT + 8)Forecast
AUDEmployment Change (Jul)09:3025.0k
EURCPI (YoY) (Jul)17:008.9%
USDInitial Jobless Claims20:30265k
USDPhiladelphia Fed Manufacturing Index (Aug)20:30-5.0
USDExisting Home Sales (Jul)22:004.89M

VT Markets New Products Launch

Dear Client,

To provide our clients with a wealth of trading options, VT Markets will launch new products on Aug 22nd, 2022, on MT5 server.

The specifications of the new products are shown in the table below.

The above data is for reference only, please refer to the MT4/MT5 software for specific data.

Friendly reminders:
1. The new Shares are only available for trading on MT5.
2. Please refer to the specification on MT5 for other details.
3. Parts of the symbols are available for Buy orders only due to the market risk.

If you’d like more information, please don’t hesitate to contact [email protected].

Sudden Pullback in Tech Shares, US Stocks Move Higher

US stocks advanced on Tuesday, and closed higher following a sudden pullback in tech shares, as investors assessed the latest round of upbeat earnings against a backdrop of growing concerns over slowing growth and rising borrowing costs. Moreover, reports Monday indicating a sharp drop in New York state manufacturing along with the longest streak of declines since 2007 in homebuilder sentiment sparked optimism in equity markets that the Fed may slow interest rates hike. A critical clue on how sensitive the Fed is to unfolding economic data may be known when the minutes of the last meeting of the Federal Open Market Committee on Wednesday.

The benchmarks, S&P 500 and Dow Jones Industrial Average both edged higher on Tuesday. Six out of eleven sectors stayed in the positive territory, as Consumer Staples and Consumer Discretion performed best among all groups, rising with 1.21% and 1.09% gains on daily basis. The Dow Jones Industrial Average kept its leadership role within major benchmarks, rallying 0.7% for the day. The Nasdaq 100 ended lower, sliding 0.2%, and the MSCI World index was little changed on Tuesday.

Main Pairs Movement

The US dollar was little changed down on Tuesday, as investors waited on the US retail sales and minutes from the Federal Reserve’s July meeting on Wednesday. The DXY index witnessed fresh transactions and edged higher as recession fears boost the safe-haven greenback during the UK trading session. However, after touching a daily level above 106.9, DXY lost bullish momentum and pullback to oscillate in a range from 106.3 to 106.6 level.

The GBP/USD advanced with a 0.34% gain on a daily basis for the day, as UK employment figures were better-than-expected, further cementing the case for a 50 bps BOE rate hike. The cables suffered heavy selling pressure during the UK trading session as US dollars strengthen across the board. Then, GBP/USD rebounded and touched a daily high level above 1.211 during the early US trading session. Meanwhile, EUR/USD reached a daily high level above 1.019 in the period of the early US trading session. The pairs rose 0.11% on Tuesday.

Gold slid with a 0.23% loss on a daily basis for the day, holding lower ground near one week after a two-day downtrend. Investors were cautious as fears of the economic slowdown in China and Europe and waited for a clue on Fed’s decision to interest rates hike shown when FOMC meeting happens on Wednesday. Meantime, WTI and Brent oil dropped on Tuesday, falling 2.90% and 3.22% respectively.

Technical Analysis

EURUSD (4-Hour Chart)

The EUR/USD pair edged higher on Tuesday, ending its previous slide and regained upside momentum to touch a daily top near the 1.019 mark despite the prevalent cautious market mood. The pair is now trading at 1.0174, posting a 0.16% gain daily. EUR/USD stays in the positive territory amid a weaker US dollar across the board, as the disappointing Housing Starts data from the US exerted bearish pressure on the safe-haven greenback and lifted the EUR/USD pair higher. The US Housing Starts decline sharply by 9.6% in July and Building Permits also dropped by 1.3% MoM, causing the US dollar to lose some strength. For the Euro, the German ZEW Economic Sentiment Index came in at -55.3 in August, which showed that the economic sentiment continued to deteriorate in the euro area and limit the upside for the shared currency.

For the technical aspect, the RSI indicator is 37 as of writing, suggesting the pair’s bullish outlook in the near term as the RSI keeps rising toward the mid-line. As for the Bollinger Bands, the price regained upside traction and started to climb toward the moving average, therefore the upside momentum should persist. In conclusion, we think the market will be bullish as long as the 1.0111 support line holds. On the upside, a break above 1.0237 could lead to additional gains for the pair.

Resistance:  1.0237, 1.0287, 1.0347

Support: 1.0111, 1.0062, 0.9988

GBPUSD (4-Hour Chart)

The GBP/USD pair advanced on Tuesday, witnessing some upside traction and climbed to a daily top above 1.211 level during the US trading session after the release of downbeat US housing data. At the time of writing, the cable stays in positive territory with a 0.30% gain for the day. Traders might prefer to move on the sidelines ahead of the FOMC meeting minutes on Wednesday, which could provide clues about the possibility of a 75 bps rate hike in September. For the British pound, the mixed UK employment data fail to impress bullish traders as the number of people claiming unemployment-related benefits fell by 10.5K in July and the UK unemployment rate was unchanged at 3.8%. On top of that, the concerns about a global economic downturn and the BoE’s gloomy economic outlook both limit the gains for the GBP/USD pair today.

For the technical aspect, the RSI indicator is 44 as of writing, suggesting that the risk is skewed to the upside as the RSI has climbed further toward the mid-line. For the Bollinger Bands, the price preserved its bullish movement and kept heading toward the moving average, therefore a continuation of the upside trend can be expected. In conclusion, we think the market will be bullish as long as the 1.2027 support line holds. The rising RSI also reflects bull signals.

Resistance: 1.2143, 1.2248, 1.2277

Support: 1.2027, 1.1940, 1.1897

XAUUSD (4-Hour Chart)

Gold price continued the trend of yesterday coming under bearish pressure on the trade of the day and declined toward the $1,770 level. Despite last week’s softer US CPI report, Fed officials warned that it is far too early for the US central bank to declare victory on inflation. Suggesting that the Fed would stick to its policy and have maintained a hawkish tone. The benchmark 10-year US Treasury bond yield is up more than 2% on the day. supporting the US dollar. This, in turn, undermines the dollar-denominated commodity. That said, traders might refrain from placing aggressive bets ahead of the key central bank event ­ — the FOMC minutes on Wednesday. For more price actions, eye on the tier 1 economic data from the US.

For the technical aspect, the RSI indicator is 42 as of writing, suggesting that the downside is more favoured as the RSI keeps in a downtrend and stays below the mid-line. For the Bollinger Bands, the price edged slightly down along with the lower bound, and the downward moving average seems to take pressure from the upside. In conclusion, we think the market will be bearish as the RSI indicator keeps in a downtrend and the price keeps edging lower below the moving average. At the time of writing, the price is slightly above the $1,770 level. If XAU/USD closes with negative price action below $1,770 on the four-hour chart, it might head to test the next support level at $1,757.

Resistance: 1803, 1857, 1876

Support: 1770, 1757, 1714

Economic Data

CurrencyDataTime (GMT + 8)Forecast
NZDRBNZ Interest Rate Decision10:003.00%
NZDRBNZ Press Conference11:00 
GBPCPI (YoY) (Jul)14:009.8%
USDCore Retail Sales (MoM) (Jul)20:30-0.1%
USDRetail Sales (MoM) (Jul)20:300.1%
USDCrude Oil Inventories22:30-0.275M

US Stocks Rallied for the Second Day

The US stocks rallied for the second day in a row, as investors digested weak data on New York manufacturing and the Chinese economy. The market is coming off a fourth straight weekly gain, the longest run this year, with sentiment buoyed by signs of slowing inflation pressures that stirred hopes of a shift by the Fed to less hawkish rate hikes and a gradual slowdown in the economy. Still, the rally has left market breadth looking stretched with stocks vulnerable to a pullback. Meanwhile, data showed China’s July retail sales, investment and industrial output missed economists’ estimates, and in the Eurozone, the risk of recession has reached the highest level since November 2020.

The benchmarks, S&P500 and Dow Jones Industrial Average both advanced on Monday. The S&P500 closed near the highs of the day, reversing losses of as much as 0.5%, with nine out of eleven sectors staying in the positive territory. Moreover, the Consumer Staples sectors got the best performance among all groups, rising with a 1.05% gain on daily basis, while Energy slid with 1.98% losses for the day, performing the worst. The Dow Jones Industrial Average rose 0.4%, Nasdaq 100 increased 0.7% as big tech-led gains, and the MSCI world index moved up 0.2%.

Main Pairs Movement

US dollar edged higher on Monday, benefiting its haven status, while the Chinese yuan dipped after a batch of disappointing data prompted the country’s central bank to cut interest rates. The DXY index surged unstoppably and closed near a daily high above 106.4 for the day.

The GBP/USD slid for the day, as market mood amid undermining risk sentiment and provided a boost to the safe-haven greenback. The cables witnessed heavy selling pressure at the beginning of this week and closed near a daily-low level of 1.205. Meanwhile, EUR/USD was also under bearish momentum and dropped to a level below 1.016. It’s worth noting that investors prefer to pile onto the greenback ahead of Wednesday’s FOMC minute showdown, which may reveal some clues to the next move by Fed officials.

Gold dropped by 1.26% on a daily basis on Monday, as China data triggers risk-aversion and investors resort to selling everything amid a pessimistic market mood. XAU/USD was driven by bearish momentum almost all the day and fell from $1802 to $1780 marks. Moreover, WTI and BRENT oil declined with 2.91% and 4.53% losses on a daily basis respectively.

Technical Analysis

EURUSD (4-Hour Chart)

The EUR/USD pair tumbled on Monday, extending its slide that started last week and dropped to a daily low below the 1.020 mark amid the risk-averse market environment. The pair is now trading at 1.01935, posting a 0.62% loss daily. EUR/USD stays in the negative territory amid a stronger US dollar across the board, as the poor results from the Chinese docket earlier in the session underpinned the safe-haven greenback and dragged the EUR/USD pair lower. The weaker-than-expected Industrial Production in China rose by 3.8% in July, indicating signs of slowing economic activity in the country and escalating concerns about recession. For the Euro, the German energy crisis continued to be the main factor of the fears about the Eurozone recession, which might act as a headwind for the shared currency.

For the technical aspect, the RSI indicator is 33 as of writing, suggesting that the pair is facing heavy bearish pressure as the RSI drops toward 30. As for the Bollinger Bands, the price preserved its downside traction and moved alongside the lower band, therefore the downside momentum should persist. In conclusion, we think the market will be bearish as the pair is heading to test the 1.0150 support line. The near-term outlook stays bearish as the technical indicators have extended their declines to negative levels.

Resistance:  1.0287, 1.0347, 1.0430

Support: 1.0150, 1.0111, 0.9988

GBPUSD (4-Hour Chart)

The GBP/USD pair declined on Monday, coming under selling pressure and refreshed its daily low near the 1.206 mark during the European session as the US dollar continues to capitalize on safe-haven flows at the beginning of the week. At the time of writing, the cable stays in negative territory with a 0.46% loss for the day. The US Dollar Index extended its rally toward the 106.00 area as the escalating geopolitical tensions between the US and China and weak data releases from China both helped the safe-haven greenback to find demand. For the British pound, the latest news on Monday reported that 30 of 51 economists expect the Bank of England to hike the policy rate by 50 bps at its September meeting in a recently conducted survey, but the news failed to lift the GBP/USD pair higher today.

For the technical aspect, the RSI indicator is 39 as of writing, suggesting that the downside is more favoured as the RSI stays below the mid-line. For the Bollinger Bands, the price regained the downside traction and dropped toward the moving average, therefore a continuation of the downside trend can be expected. In conclusion, we think the market will be bearish as the pair might head to test the 1.2027 support. The RSI also reflects bear signals and confirms the lack of buyers’ interest in the British pound.

Resistance: 1.2178, 1.2248, 1.2309

Support: 1.2027, 1.19400, 1.1897

XAUUSD (4-Hour Chart)

The XAU/USD pair fell on Monday amid a risk-aversion mood. The price declined toward the $1,780 level in the European session, having struggled around $1,800 earlier in the Asian session. The risk-off market remains still after China’s activity came in below forecasts. In addition, an unexpected rate cut by PBOC fueled fears over a slowdown of the world’s second-largest economy, therefore making the safe-haven US dollar more attractive. Investors seek safety in the US dollar amid market panic as US-China tension remains. The key event risk this week is Wednesday’s FOMC minutes, which could set a clear direction for gold prices if it tells the Fed’s future policy path.

For the technical aspect, the RSI indicator is 41 as of writing, suggesting that the downside is more favoured as the RSI stays below the mid-line. For the Bollinger Bands, the price dropped below the moving average, the downside traction should persist. In conclusion, we think the market will be bearish as the RSI indicator stands at 41 and the price drops below the moving average. The price might head to test the next support level at 1769. For more price action, eyes on the next support level.

Resistance: 1803, 1857, 1874

Support: 1769, 1757, 1714

Economic Data

CurrencyDataTime (GMT + 8)Forecast
AUDRBA Meeting Minutes09:30 
GBPAverage Earnings Index +Bonus (Jun)14:004.5%
GBPClaimant Count Change (Jul)14:00-32.0K
EURGerman ZEW Economic Sentiment (Aug)17:00-53.8
USDBuilding Permits (Jul)20:301.650M
CADCore CPI (MoM) (Jul)20:30 
Back To Top
server

Hello there 👋

How can I help you?

Chat with our team instantly

Live Chat

Start a live conversation through...

  • Telegram
    hold On hold
  • Coming Soon...

Hello there 👋

How can I help you?

telegram

Scan the QR code with your smartphone to start a chat with us, or click here.

Don’t have the Telegram App or Desktop installed? Use Web Telegram instead.

QR code