US CPI released higher at 8.2%

U.S. equities experienced a volatile trading session with the release of U.S. CPI data. The Dow Jones Industrial Average rose 2.83% to close at 30038.72. The S&P 500 gained 2.6% to close at 3669.91. The tech-heavy Nasdaq Composite climbed 2.23% to close at 10649.15. U.S. equities futures continued to rise after the bell as U.S. treasury yields retreated below their intraday high of above 4%.

U.S. CPI data came in above expectations at 8.2%, year over year; however, core inflation, which strips out food and energy costs, jumped to its highest level since 1982—suggesting a broad-based rise in prices. The risk-off sentiment during the early American trading session quickly reversed as market participants bought in after the initial steep drop.

Looking ahead, as the third-quarter earnings season approaches, market participants should brace themselves and expect lowered earnings and lowered forward guidance. However, the hit to earnings could be mild as the Fed’s tightening has yet to be fully reflected on income statements. The financial sector will kick off the Q3 earnings season with JP Morgan Chase, Wells Fargo, Morgan Stanley, and Citigroup set to release their earnings before today’s American trading session. September’s retail sales will be released at 8:30 (EST).

Main Pairs Movement

The Dollar Index lost 0.71% over the course of yesterday’s trading. The Dollar experienced a turbulent trading session with the U.S. CPI data release and the subsequent equity market rally. The weakened Dollar came after the Dollar index broke above 113. Respite for Dollar bears came after market participants decided to “buy the dip”, despite inflation continuing to run hot.

EURUSD gained 0.76% over the course of yesterday’s trading. The Euro-Dollar pair reversed its downward trajectory, but the Euro is still plagued by slowing economic growth and soaring energy costs.

GBPUSD soared 1.98% over the course of yesterday’s trading. Reports of the British government reversing its course on the mini-budget policy have acted as a tailwind for the Pound’s rise.

Gold lost 0.42% over the course of yesterday’s trading, despite a broadly weaker Dollar. The Dollar denominated metal’s drop came as short-term U.S. treasury yields spike above 4%

Technical Analysis

EURUSD (4-Hour Chart)

The EUR/USD has gathered bullish momentum and climbed toward 0.9800 during the American trading hours on Thursday. The positive shift witnessed in risk sentiment causes the greenback to lose interest as a safe haven despite the hot September inflation report. US core CPI reached a 40-year high at 6.6% YoY, exceeding forecasts, cementing the case for further Fed tightening at November’s meeting. However, as sentiment shifted positively, US equities are trading in the green. In the Eurozone, the Bundesbank and Belgium’s central bank chiefs, Joachim Nagel and Piere Wunsch prompted the ECB for more interest rate hikes due to high inflation levels in the Eurozone. During the EU trading session, German inflation figures rose as expected but persisted at high levels, as shown by HICP at 10.9%, while German CPI remained at 10%.

From the technical perspective, the RSI indicator figures 57 as of writing, suggesting that the EURUSD would continue the upside tractions until RSI reach 70, an overbought level. As for Bollinger Bands, the pair is now priced above the upper band, and the gap between the upper band and the lower band became larger, indicating the bullish momentum could persist until the price fell back below the 20-period moving average.

Resistance:  0.9927, 0.9986, 1.0035, 1.0155

Support: 0.9664, 0.9551

GBPUSD (4-Hour Chart)

The GBP/USD pair gains strong positive traction for the second straight day on Thursday and builds on the previous day’s goodish rebound from a nearly two-week low. The bullish momentum lifts spot prices to a one-week high, though falter near the 1.1300 mark following the release of hotter US consumer inflation figures.  The British pound gets a strong lift amid talks that the new UK government could reverse its vast tax cuts announced in the mini-budget in September. The intraday positive move, however, runs out of steam amid a strong pickup in the US dollar demand, bolstered by a stronger US CPI report and hawkish Fed expectations. Apart from that, the bank of England can still send a message by ratcheting up to a 75 bps hike in November. The pair was priced at the 1.134 level as of writing.

For the technical aspect, the RSI indicator figured 68, suggesting the bullish momentum could persist until the RSI indicator hit 70 and may slow down. As for the Bollinger Bands, the pound price broke through the upper bound, and the gap between the upper band and lower band became larger, implying the upside trend would persist until the price fell back to the Bollinger band area.

Resistance: 1.1485, 1.1715, 1.1853

Support: 1.0968, 1.0632, 1.0392

XAUUSD (4-Hour Chart)

The XAUUSD has dropped on the back of the main event for the week’s outcome in the US Consumer Price Index, gold was priced at the $1658 mark as of writing. Critical US CPI figured 8.2%, higher than the expected 8.1%, and core CPI reads 6.6%, also bigger than the forecast 6.5% level. Once again, hotter-than-expected US inflation numbers for both the core and headline measures are not seen as good news for the Federal Reserve or the US economy. It’s worth noting that inflation’s rising persistence suggests the Fed is unlikely to stop hiking preemptively, which points to a prolonged period of restrictive rates. In the meantime, the US dollar index shot to a high of 113.888 following the consumer data release, then confront heavy selling transactions and fell back to a low level of 112.530 as of writing. Overall, the gold price will likely prevail in a sustained downtrend.

From the technical perspective, on the four-chart scale, the RSI indicator figured 42, implying the yellow metal was sitting at a mild downside trend until the RSI indicator hit above 50, then it will attract some upside tractions. As for Bollinger Bands, the gap between the upper band and lower band became closer and the price is wander in the lower area, suggesting a slow bearish momentum weight on the yellow metal.

Resistance: 1680, 1712, 1726

Support: 1654, 1644, 1620

Economic Data

CurrencyDataTime (GMT + 8)Forecast
USDCore Retail Sales (MoM) (Sep)20:30-0.1%
USDRetail Sales (MoM) (Sep)20:300.2%

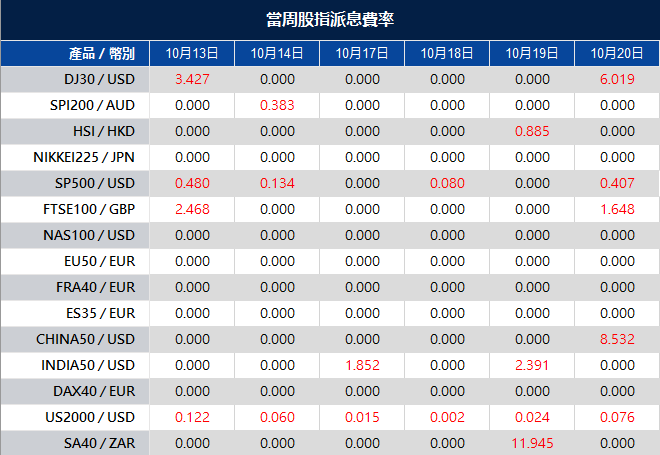
The Adjustment Of Weekly Dividend Notification

Dear Client,

Warmly reminds you that the component stocks in the stock index spot generate dividends. When dividends are distributed, VT Markets will make dividends and deductions for the clients who hold the trading products after the close of the day before the ex-dividend date.

Indices dividends will not be paid/charged as an inclusion along with the swap component. It will be executed separately through a balance statement directly to your trading account, the comment for which will be in the following format “Div & Product Name & Net Volume ”.

Please note the specific adjustments as follows:

The above data is for reference only, please refer to the MT4/MT5 software for specific data.

If you’d like more information, please don’t hesitate to contact [email protected].

Producer Price Index rose, Market awaits Inflation data

US equity fell on Wednesday, with investors bracing for Thursday’s reading on consumer prices. Producer Price Index figures of 0.4% on Wednesday showed prices paid to US producers rose in September by more than expected ahead of a key measure of consumer inflation due Thursday that’s set to return to a four-decade high. It’s also worth noting that on the corporate side, PepsiCo Inc. jumped the most in more than two years after lifting its forecast for the year on the back of better-than-estimated third-quarter profit as drink and snack sales buck inflation. Moderna Inc. surged after Merck & Co. said it would exercise an option to work in partnership with the biotech on a messenger RNA cancer vaccine.

In the Eurozone, a selloff in long-maturity UK debt gathered pace after the Bank of England damped hopes it would extend its bond-buying support into next week. The yield on 30-year gilts surged above 5%, nearing levels that just last month drew the central bank’s invention, before easing again after the BOE snapped up billions in its daily operations. Elsewhere, oil in New York dropped below $88 a barrel on slowdown fears, and OPEC trimmed projections for the amount of crude it will need to pump this quarter.

The benchmarks, the S&P500 slipped into the negative area in the final minutes of trading, capping six days of losses to close at the lowest level since November 2020 and surpassing the previous low on Sep. 30. Seven out of eleven categories stayed in the negative territory, as Utilities got the worst performance among all groups, tumbled with 3.42% losses on daily basis. The Dow Jones Industrial Average and the Nasdaq 100 were little changed on Wednesday. The MSCI world index fell 0.3% for the day.

Main Pairs Movement

The US dollar was little changed on Wednesday, failing to preserve its upside traction and flirted with the 113.00 area following the release of FOMC meeting minutes. Fed officials determined that they needed to adopt and maintain a more restrictive policy stance to fight elevated inflation. But once the policy had reached a sufficiently restrictive level, it would be appropriate to keep it there for a period of time. As for now, investors await US inflation data for fresh clues about future rate hikes.

GBP/USD surged sharply on Wednesday with a 1.20% gain after the cable refreshed its daily top above the 1.112 mark amid the latest emergency program. On the UK front, reports showed that the Bank of England might be willing to extend its purchases beyond Friday and provide a boost to the GBP/USD pair. Meanwhile, EUR/USD remained stable and capped below the 0.9710 level after European Central Bank President Lagarde’s speech. The pair was down almost 0.05% for the day.

Gold advanced with a 0.42% gain for the day after climbing higher to touch the $1,677 mark during the US trading session, as the less hawkish FOMC minutes hint to moderate the hiking pace and underpinned the dollar-denominated gold. Meanwhile, WTI Oil retreated further with a 1.70% loss for the day after dropping to the $86.5 area ahead of the key event of the week in the US CPI report, as higher interest rates and recession fears both acted as a headwind for the oil price.

Technical Analysis

EURUSD (4-Hour Chart)

The EUR/USD pair edged lower on Wednesday, failing to preserve its recovery momentum and remained under pressure below the 0.9700 mark ahead of the key FOMC minutes. The pair is now trading at 0.9692, posting a 0.12% loss on a daily basis. EUR/USD stays in the negative territory amid a stronger US dollar across the board, as the greenback gained momentum after the release of the US Producer Price Index and exerted bearish pressure on the EUR/USD pair. The US Producer Price Index rose 0.4% in September, above the 0.2% of market consensus. Meanwhile, the annual rate fell from 8.7% to 8.5%. Market participants await the FOMC minutes for new clues about the latest US Federal Reserve (Fed) monetary policy decision. For the Euro, the European Central Bank President Christine Lagarde said that the Governing Council has started discussions on quantitative tightening and further noted that the interest rate is the most appropriate tool in current circumstances.

For the technical aspect, RSI indicator 40 as of writing, suggests a neutral-to-bearish stance as the RSI head nowhere but stands below the mid-line. As for the Bollinger Bands, the price came under selling pressure and dropped towards the lower band, therefore the downside traction should persist. In conclusion, we think the market will be slightly bearish as the pair tests the 0.9677 support line. Technical indicators also consolidate within negative levels, reflecting the absence of directional strength.

Resistance:  0.9766, 0.9836, 0.9921

Support: 0.9677, 0.9551

GBPUSD (4-Hour Chart)

The GBP/USD erased two successive day losses and approached the 1.1125 level following the FOMC minute. The Federal Open Market Committee minutes of September’s meeting released that “Several participants noted that it would be important to calibrate the pace of further policy tightening with the aim of mitigating the risk of significant adverse effects on the economic outlook.” Which market regarded it as a relatively dovish comment, driving the cables surge with 50 points to a level above 1.1120.  Apart from that, the Bank of England (BoE) accepted 2.3754 billion sterling of offers in the daily purchase operation of conventional long-dated gilts according to Reuters reported on Wednesday. The news suggested that the British Government could be contemplating a U-turn on the mini-budget that rattled financial markets have eased negative pressure on the sterling. However, in the macro view, the UK economy shrunk by 0.3% in the three months prior to September, according to NIESR GDP Estimate. This is a larger contraction than the 0.1% forecast, also a signal that the UK may confront a more severe recession.

For the technical aspect, RSI indicator 51 as of writing, suggests a bullish tilt in the near-term technical outlook as the RSI fell back below 50. As for Bollinger Bands, the gap between the upper and lower bands became smaller and the cable pricing broke through the 20-period moving average to the upper area. The bullish tractions would persist if the price stands firmly above the upper band level of 1.1146, then the bulls could challenge the 1.1366 resistance. On the contrary, if the price lost upside momentum, then the pound would test the 1.0958 support.

Resistance: 1.1366, 1.1485, 1.1715

Support: 1.0958, 1.0797, 1.0632, 1.0392

XAUUSD (4-Hour Chart)

The XAUUSD  kept trading around the $1,670 mark as has been the case since the beginning of the European session, as it is moving sideways after US PPI and ahead of the FOMC minutes. Following the release of the US Producer Price Index (PPI), gold approached daily lows but it quickly bounced back to the upside. The PPI rose 0.4% in September, above 0.2% of market consensus. The annual rate fell from 8.7% to 8.5%. The US dollar gained some upside tractions after the figures, but just for a few minutes, continuing to wander in a range from 113.2 to 113.6 level. Most market participants were waiting for the FOMC minutes to shed light on the trajectory of US monetary policy. The document will trigger volatility if it contains surprises. The next FOMC meeting is in November and another 75 bps rate hike seems likely according to the current market price.

From the technical perspective, the RSI indicator fell below 50 as of writing, implying a bearish momentum in the near-term technical outlook. As for the Bollinger Bands, the price was hovering around the 20-period moving average, suggesting gold would move sideways ahead of any surprising transactions. The yellow metal was priced at the $1,670 mark as of writing, and bulls needed to challenge the short-term resistance at $1,680 to gain more upside traction. On the contrary, the bears needed to test the $1,665 support to attract more sales.

Resistance: 1680, 1700, 1725

Support: 1665, 1644, 1620

Economic Data

CurrencyDataTime (GMT + 8)Forecast
USDEIA Short-Term Energy Outlook00:00 
USDFOMC Meeting Minutes02:00 
EURGerman CPI (YOY) (Sep)14:0010.0%
USDCore CPI (MoM) (Sep)20:300.5%
USDCPI (YoY) (Sep)20:308.1%
USDCPI (MoM) (Sep)20:300.2%
USDInitial Jobless Claims20:30225K
USDCrude Oil Inventories23:001.750M

BoE to end its support of the Gilt Market

U.S. equities edged lower throughout yesterday’s trading. The Dow Jones Industrial Average, however, was able to edge slightly higher by 0.12% to close at 29239.19. The S&P 500 lost 0.65% to close at 3588.84. The tech-heavy Nasdaq Composite retreated 1.1% to close at 10426.19. The risk-off sentiment was driven by comments from BoE governor Andrew Bailey, who said the central bank would end its special support of the gilt market. Governor Bailey urged market participants to unwind positions they may not have the ability to maintain.

The benchmark U.S. 10-year treasury yield continued to edge higher and was last seen trading at 3.947%.

Russian President Vladimir Putin threatened further missile attacks on Ukraine after hitting Kyiv and other cities in the most intense barrage of strikes since the first days of its invasion. The bombing from Russia was sparked by the attack on the Crimea bridge last week. Escalating tensions between Russia and Ukraine continue to weigh on investing sentiment and global energy supplies.

On the economic docket, Britain is set to release its GDP figures during today’s European trading session, and the U.S. will release PPI figures during the American trading session today. The FOMC meeting minutes will be released during the latter part of the American trading session today as well.

Main Pairs Movement

The Dollar index gained 0.1% throughout yesterday’s trading. The Dollar has continued to gain traction ahead of the key PPI data release and FOMC meeting minutes release. Markets are now pricing in further tightening of 75 basis points by the Fed as inflation continues to run rampant.

EURUSD gained 0.08% throughout yesterday’s trading. The Euro-Dollar pair was able to maintain its intraday gains despite a broadly stronger Dollar. Economic data releases by the U.S., however, can once again send the pair lower.

Cable lost 0.82% throughout yesterday’s trading. The British Pound dropped as BoE governor Bailey’s comment on pulling back the emergency purchasing of Gilts. Today’s British GDP release will be closely observed.

XAUUSD lost 0.12% throughout yesterday’s trading. The precious metal fared worse against a strong Dollar.

Technical Analysis

EURUSD (4-Hour Chart)

The EUR/USD pair edged higher on Tuesday, witnessing some recovery momentum and flirted with the 0.968~ 0.974 area despite the dismal mood that dominated financial markets. The pair is now trading at 0.9762, posting a 0.66% gain daily. EUR/USD stays in the positive territory amid a weaker US dollar across the board, as the retreating US bond yields exerted bearish pressure on the greenback and lifted the EUR/USD pair higher. The Sentiment remains deteriorated amidst fears that global central bank tightening would slash corporate earnings while dampening the economic outlook, but a scarce macroeconomic calendar and US first-tier events scheduled for later in the week limit further volatility. The Euro, the currency is likely to remain under pressure amid the fierce Russia-Ukraine tussles which raise doubts about the economic health of the old continent.

For the technical aspect, RSI indicator 48 as of writing, suggests that the pair is regaining upside strength as the RSI rose sharply towards 50. As for the Bollinger Bands, the price witnessed fresh buying and crossed above the moving average, therefore the upside traction should persist. In conclusion, we think the market will be bullish as long as the 0.9677 support line holds. Additionally, technical indicators recovered from oversold readings and the case for recovery will be firmer if the pair extends gains above 0.9836.

Resistance:  0.9836, 0.9921, 0.9986

Support: 0.9677, 0.9551

GBPUSD (4-Hour Chart)

The GBP/USD pair surged on Tuesday, regaining upside momentum and refreshed its daily high above the 1.1160 mark in the US session following the outcome of the Bank of England’s gilt purchase operations. At the time of writing, the cable stays in positive territory with a 0.94% gain for the day. The US dollar trims a part of its intraday gains and turns out to be a key factor lending some support to the GBP/USD pair. For the British pound, the Bank of England announced earlier in the day that it intends to purchase index-linked gilts and reiterated that it stands ready to purchase up to 10 billion sterling of gilts each day until the end of the week. The announcement is acting as a tailwind for the GBP/USD pair today. Moreover, the latest news reported that the BoE accepted 1.957 billion sterling of offers in the first purchase operation of index-linked gilts.

For the technical aspect, the RSI indicator is 52 as of writing, suggesting the bullish tilt in the near-term technical outlook as the RSI has risen above 50. As for the Bollinger Bands, the price preserved its upside traction and climbed above the moving average, therefore a continuation of the bullish trend can be expected. In conclusion, we think the market will be bullish as the pair is heading to test the 1.1220 resistance. A four-hour close above that level could open the door for additional gains and favour the bulls.

Resistance: 1.1220, 1.1366, 1.1476

Support: 1.1023, 1.0797, 1.0392

XAUUSD (4-Hour Chart)

The XAUUSD price trims earlier losses and reclaims above $1680 as of writing, due to high US T-bond yields, alongside a strong US dollar, ahead of crucial US inflation figures to be released on Thursday, which could provide some clues regarding the need for Fed aggressive hikes. Even though yellow metal rebounded drastically, the market sentiment remains deteriorated amid fears that global central bank tightening would slash corporate earnings while dampening the economic outlook. The US 10-year Treasury bond yield is down by four bps but around year-to-date highs of 3.92%. The International Monetary Fund (IMF) cuts its forecast for the next year to 2.7% from 2.9%in July, almost 1% less than in January. Furthermore, the IMF said that the US would extend at 1% next year, unchanged from its previous forecast, but cut its outlook from 2.3% in July to 1.6%, which adds to fears about global growth.

From the technical perspective, the RSI indicator is from 30 to 45 as of writing, indicating a rebound in the near term could be expected till RSI fell back to below 30. As for Bollinger Bands, yellow metal rebounded back to the lower area of bands and kept bullish momentum to test the 20-period moving average of around $1688. If the four-hour chart closed above that level, the bulls could expect to challenge the month-high around $1723.

Resistance: 1688, 1723, 1761

Support: 1661, 1644, 1620

Economic Data

CurrencyDataTime (GMT + 8)Forecast
GBPBOE Gov Bailey Speaks02:35 
GBPGDP (YoY)14:002.4%
GBPGDP (MoM)14:000.0%
GBPManufacturing Production (MoM) (Aug)14:000.2%
GBPMonthly GDP 3M/3M Change14:00 
USDPPI (MoM) (Sep)20:300.2%
EURECB President Lagarde Speaks21:30 

Washington to restrict China’s access to US technology

U.S. equities fell for the fourth straight day as growth fears and geopolitical risks weigh on market sentiment. The Dow Jones Industrial Average lost 0.32% to close at 29202.88. The S&P 500 shed 0.75% to close at 3612.39. The tech-heavy Nasdaq Composite dropped 1.04% to close at 100542.1.

Washington’s decision to further restrict China’s access to U.S. technology added sins of slowing chip demand worldwide. Market participants remain cautious ahead of the FOMC meeting minutes and CPI data, scheduled, respectively, to be released during the second half of the U.S. trading session on Wednesday and the U.S. trading session on Thursday.

The benchmark U.S. 10-year treasury yield has soared past 3.9% and was last seen trading at 3.955%.

The upcoming earnings season has been tainted by the relentless rate hikes by the Fed. JPMorgan Chase and Citigroup are among the big banks that will unveil earnings later this week. While economic data releases, so far this year, have brought great volatility to markets, the upcoming earnings season could be another bullet that will drag equities even lower.

Main Pairs Movement

The Dollar Index rose 0.38% throughout yesterday’s trading. Dollar demand resumed as bonds sold off and short-term interest rates soared. Trading at 113.17, the Dollar Index still has room above ahead of the key inflation data release on Thursday.

EURUSD retreated 0.43% throughout yesterday’s trading. The higher demand for the Dollar continues to weigh on the shared currency as market participants brace for another round of tightening by the Fed.

Cable lost 0.34% throughout yesterday’s trading. The British Pound fared worse against the Dollar as market sentiment turns risk off. Market participants will now turn their attention to the British average earnings index, scheduled to be released during today’s European trading session.

Gold slumped 1.5% against the Dollar as market participants for the Dollar outpaced Gold demand. As market participants prepare for another round of Fed tightening, Gold continues to stay on the backfoot as yield expectations rise.

Technical Analysis

EURUSD (4-Hour Chart)

The EUR/USD pair declined further on Monday, remaining under pressure and extended its decline for a fourth consecutive day near the 0.9680 level amid a risk-off market mood. The pair is now trading at 0.9701, posting a 0.41% loss daily. EUR/USD stays in the negative territory amid a stronger US dollar across the board, as another solid print from Nonfarm Payrolls last Friday continued to provide further strength for the greenback. The US Federal Reserve (Fed) is likely to maintain the aggressive quantitative tightening as the Nonfarm Payrolls report hinted at healthy job creation, therefore triggering the dismal market mood. For the Euro, the escalation of the geopolitical conflict continued to exert bearish pressure on the EUR/USD pair as Russia launched a massive attack which targeted the energy and communications infrastructure of Ukraine.

For the technical aspect, the RSI indicator is 35 as of writing, suggesting that the downside is more favoured as the RSI stays below the mid-line. As for the Bollinger Bands, the price remained under pressure and moved alongside the lower band, therefore the downside traction should persist. In conclusion, we think the market will be bearish as long as the 0.9735 resistance line holds. Additionally, technical indicators hover near oversold readings and the risk is also skewed to the downside.

Resistance:  0.9735, 0.9836, 0.9921

Support: 0.9664, 0.9551

GBPUSD (4-Hour Chart)

The GBP/USD pair edged lower on Monday, preserving its downside momentum and failing to stage a steady rebound despite the Bank of England announcing new support measures. At the time of writing, the cable stays in negative territory with a 0.44% loss for the day. The reports of Russia launching missile attacks on Kyiv and other cities in response to the Crimea bridge attack over the weekend have weighed on investors’ sentiment, which provided a boost to the US dollar and dragged the GBP/USD pair lower. For the British pound, the Bank of England announced a raft of new measures to smooth market functioning, including raising the limit of its government bond-buying scheme from £5B to £10B per day. But it seems like the additional support measures from BoE failed to lift the cable higher as concerns about the UK government’s fiscal policy and recession fears remained.

For the technical aspect, the RSI indicator is 35 as of writing, suggesting that buyers stay on the sidelines for the time being as the RSI indicator on the four-hour chart stays below 40. As for the Bollinger Bands, the price witnessed consistent selling and continued to drop towards the lower band, therefore a continuation of the bearish trend can be expected. In conclusion, we think the market will be bearish as long as the 1.12200 resistance line holds. On top of that, a steeper decline could be expected if the ongoing slide extends below the 1.0797 support.

Resistance: 1.1220, 1.1366, 1.1476

Support: 1.0797, 1.0649, 1.0392

XAUUSD (4-Hour Chart)

XAUUSD extends last week’s retracement slide from the $1730 mark region and continues losing ground for the fourth successive day on Monday, which tumbled to the $1667 mark as of writing. In the past week, Fed officials reiterated their commitment to bringing inflation to the Fed’s 2% target. On Monday, the Chicago Fed President Charles Evans said that he expected the Federal funds rate (FFR) to end at around 4.5% early in 2023, which FFR now sits at 3.25%, and then to remain around that level for “some time.” He sounds optimistic that the Fed could achieve a soft landing due to Fed projections of the unemployment rate hitting 4.4% by the end of the next year, while the Fed’s inflation measure to fall to 2.8% from August’s 6.2%. In addition, last week’s US Nonfarm Payrolls report figured more than forecast, further justifying Evan’s case for the Fed to continue tightening at a large size. The markets are now pricing in a greater chance of the fourth consecutive supersized 75 bps rate increase at the next FOMC policy meeting in November.

From the technical perspective, the RSI indicator was below 30, indicating the yellow metal was going to get into an oversold area. As for the Bollinger Band, the prices were breaking through the lower band and the gap between the upper and lower band was larger, showing that the gold would continue the bearish momentum, and test the lowest since October $1660 mark. Once the price fell below the $1660 mark, the next support would be a two-year low of $1615.

Resistance: 1700, 1725

Support: 1659, 1641, 1615

Economic Data

CurrencyDataTime (GMT + 8)Forecast
GBPAverage Earnings Index +Bonus(Aug)14:005.9%
GBPClaimant Count Change (Sep)14:004.2K

US Unemployment and Payroll data surprised the Market

U.S. equities ended the week with a sharp drop throughout last Friday’s trading. The Dow Jones Industrial Average dropped 630 points to close at 29296.79. The S&P 500 slid 2.8% to close at 3639.66. The tech-heavy Nasdaq composite lost 3.8% to close at 10652.4. U.S. equities fell as the unemployment rate and payrolls jumped above market expectations. U.S. unemployment rate printed 3.5%, beating market expectations of 3.7% as the labour participation rate edged lower to 62.3%. U.S. nonfarm payrolls increased by 263,000 for the month, beating market expectations of 275,000. The upside surprise on the labour market has damped equities outlook as market participants interpreted Friday’s economic data release as favouring further tightening by the Fed.

Average hourly earnings rose 0.3% over the month, in line with market expectations. Further dissecting the jobs report—leisure and hospitality led to gains in hiring as the sector increased by 83,000 jobs. The healthcare sector generated 60,000 positions, while business services and manufacturing contributed 68,000 jobs. Markets are now widely expecting the Fed to continue the pace of its rate hikes with another 75 basis point increase in November.

Main Pairs Movement

The Dollar index rose 0.43% throughout last Friday’s trading. The upside shock of private sector hiring has decimated any notion that the Fed will ease its pace of tightening. A rise in expectations on short-term interest rates aided the Dollar to close the week in positive territory. Market participants will now turn their attention to the U.S. CPI data, which is scheduled to be released on October 13th.

EURUSD lost 0.52% throughout Friday’s trading. Selling pressure for EURUSD mounted as U.S. job reports were released. A robust U.S. job market has pointed to further interest rate hikes by the Fed.

GBPUSD lost 0.62% throughout Friday’s trading. Cable fell as the U.S. Greenback gained momentum after the release of better-than-expected job reports.

XAUUSD fell 1.04% throughout last Friday’s trading. The precious metal fared worse against the Dollar as bidding for the Greenback returned due to a rise in short-term interest rate expectations.

Technical Analysis

EURUSD (4-Hour Chart)

The EUR/USD pair declined further on Friday, witnessing some fresh selling and dropped to one-week lows near the 0.9750 level following the release of the US official employment report. The pair is now trading at 0.9806, posting a 0.75% loss daily. EUR/USD stays in the negative territory amid a stronger US dollar across the board, as the greenback gained upside momentum and climbed to a fresh weekly high after the release of the Nonfarm Payrolls report. The US Nonfarm Payrolls rise by 263,000 in September, which came in better than the market expectation of 250,000 and reaffirmed Fed rate hike bets. The prevalent risk-off mood is also exerting additional pressure on the EUR/USD pair. For the Euro, the data released earlier in the session showed that Germany’s Retail Sales contracted 4.6% YoY in August and Industrial Production dropped 0.8%.

For the technical aspect, RSI indicator 38 figures as of writing, suggests that the sellers remain on the sidelines for the time being as the RSI has been moving sideways. As for the Bollinger Bands, the price remained under pressure and moved alongside the lower band, therefore the downside traction should persist. In conclusion, we think the market will be bearish as the pair tests the 0.9755 support. Sustained weakness below that support should favour the bears and remain the pair’s bearish view.

Resistance:  0.9836, 0.9921, 0.9986

Support: 0.9755, 0.9664, 0.9551

GBPUSD (4-Hour Chart)

The GBPUSD tumbled on Friday, falling to a level around 1.1100 at the time of writing, as the upbeat US NFP data reaffirms Fed rate hike bets and acts as a tailwind for the bucks. The US dollar reverses an intraday dip and climbs to a fresh weekly high after the headline NFP report showed that the US economy added 263K new jobs in September. The reading marks a notable slowdown from the 315K reported in the previous month, though surpasses consensus estimates for a reading of 250k. Moreover, the US unemployment rate fell to 3.5% during the reported month from 3.7% in August, reaffirming hawkish Fed expectations. This, in turn, remains supportive of elevated US Treasury bond yields and underpins the greenback, which exerts some pressure on the GBP/USD pair. Apart from rising bets for a more aggressive policy tightening by the Fed, the prevalent risk-off mood is seen as another factor benefitting the safe-haven greenback. In the UK zone, the cables are weighed down by concerns about the UK government’s fiscal policy and looming recession risks.

From the technical perspective, the RSI indicator figures 40 as of writing, implying the downside momentum would persist and test the lowest level of 1.1090 since October. As for Bollinger Band, the price broke through the lower band at the moment of NFP data released, then continued wandering in the lower middle area, a signal telling the pounds would probably be bearish for a while.

Resistance: 1.1380, 1.1475, 1.1715

Support: 1.1090, 1.0800, 1.0650, 1.0390

XAUUSD (4-Hour Chart)

The XAUUSD price dropped below the $1,700 figure, in the aftermath of the US jobs report. Before the US Nonfarm Payrolls report was released, the yellow metal meandered around $1710. However, once the headline crossed newswires, gold’s initial reaction slid towards the $1700 region, but the initial move dissipated. As of writing, it rebounded from $1690 to $1702 in a volatile reaction. Data-wise, a report from the US Bureau of Labor Statistics (BLS), showed that the US economy added 263K new jobs, smashing estimations of 250K, while the Unemployment Rate ticked lower to 3.5%, from 3.7% expectations, which would further cement the case for Fed rate hike. US Treasury bond yields pushed to the upside, with the US 10-year Treasury bond yield advancing 3 bps, at 3.865%, while the US Dollar Index, a gauge of the bucks value vs. six currencies, is up 0.28%, at 112.565.

From the technical perspective, the RSI indicator figures 50 as of writing, showing a more stable status, would hover in the range of $1,695 to $1,712. As for Bollinger Band, the price was breaking through the moving average and touching the lower band, indicating that the price might slight rebound and wander in the lower area of Bollinger Band.

Resistance: 1712, 1725, 1740

Support: 1663, 1644, 1620

Week Ahead: US Data to Focus on CPI, PPI, Retail Sales, and Consumer Sentiment

The US will release several key data items this week, including the inflation data reflected in the Consumer Price Index, the producer price index, and retail sales data. The preliminary consumer sentiment data reported by the University of Michigan and the minutes from the Federal Open Market Committee will also be released.

Meanwhile, the UK will publish its GDP data mid-week.

  • UK Gross Domestic Product (12 October)

Gross domestic product in the UK grew 0.2% in July from June, rebounding from a 0.6% fall in the previous month.

Analysts forecast that the economy will grow 0.1% in August.

  • US Producer Price Index (12 October) 

US producer prices fell 0.1% in August, following a 0.4% drop in July. According to economists, prices are forecast to remain steady (0%) for September.

  • FOMC Meeting Minutes (13 October)

In its September meeting, the Federal Open Market Committee increased the federal funds rate by 75bps (3%-3.25% range). The Fed also projected that interest rates will rise to as high as 4.4% by December 2022 and stay at 4.6% in 2023.

  • US Consumer Price Index (13 October)

According to the Bureau of Labour Statistics, the US consumer price index rose 0.1% in August from July. This follows a flat reading in the previous month and is higher than a forecast decline of 0.1%. Analysts expect that September’s CPI will be up by 0.2%.

  • US Retail Sales (14 October)

The US retail sales increased by 0.3% in August from July, following a revised 0.4% fall in the previous month. Markets expect retail sales figures to increase by 0.2% in the current month.

  • Prelim UoM Consumer Sentiment (14 October)

In September, the University of Michigan’s consumer sentiment index was released to be 58.6, revised from 59.5 in a preliminary figure. The index had been above 58.2 in August and at its highest in five months.

Analysts predict a range of figures for the index, with some believing it will surpass 58.5, while others believe it will fall below that level.

US Jobless Claims higher, Market waits for NFP

U.S. equities traded lower throughout yesterday’s trading. The Dow Jones Industrial Average slipped 1.15% to close at 29926.94. The S&P 500 dropped 1.02% to close at 3744.52. The tech-heavy Nasdaq Composite edged 0.68% lower to close at 11073.31.

Learn more about Indices with VT Markets

U.S. initial jobless claims came in at 219K, above market expectations of 190K. The upside surprise of jobless claims sparked a brief rally among equities; however, market participants will now turn their focus on today’s nonfarm payrolls figure and the unemployment rate to better gauge the health of private sector hiring.

In contrast to traditional thinking, worse-than-expected payroll gains and higher-than-expected unemployment rates could be a good signal for equities. A slowdown in private sector hiring could provide proof of the Fed’s tightening efficiency.

The benchmark U.S. 10-year treasury yield rose on Thursday and was last seen trading at 3.821%.

Other key factors that market participants should be aware of are the average hourly earnings figures, which are estimated to increase by 0.3% month over month and 5.1% over the year. A lower figure could indicate the Fed’s tightening showing its effect; conversely, an upside surprise could point to further tightening on the horizon. Recent remarks from Fed officials have reaffirmed the Fed’s stance on its determination on bringing inflation down.

Main Pairs Movement

The Dollar index rose 0.47% throughout yesterday’s trading. The U.S. Greenback extended gains from the 5th as U.S. treasury yields recovered above 3.8%. Market participants will now turn their focus to today’s nonfarm payrolls and unemployment rate figures to gauge the Fed’s next move.

EURUSD dropped 0.91% throughout yesterday’s trading. Recent hawkish comments from Fed officials have added selling pressure on the Euro-Dollar pair. ECB monetary policy meeting minutes indicated possible tightening by the ECB as members believe inflation to still be rampant in Europe.

Cable retreated 1.45% throughout yesterday’s trading. U.K. PMI figures came in at 52.3, above the market consensus of 49.2.

XAUUSD dropped 0.22% throughout yesterday’s trading. The return of strength for the Dollar acted as a headwind for the non-yielding metal.

Technical Analysis

EURUSD (4-Hour Chart)

The EUR/USD pair dropped further on Thursday, preserving its downside momentum and declined to fresh daily lows below the 0.9830 level amid a worsening market mood. The pair is now trading at 0.9806, posting a 0.75% loss daily. EUR/USD stays in the negative territory amid a stronger US dollar across the board, as the downbeat US job data and hawkish comments from Fed’s Kashkari on the policy outlook both provided support to the safe-haven greenback. The US Weekly Initial Jobless Claims rise to 219K in the week ending October 1, which came in worse than the market expectation of 200K and exerted bearish pressure on investors’ mood. For the Euro, the downbeat European data continued to weigh on the shared currency as the German Factory Orders declined by 2.4% MoM in August.

For the technical aspect, RSI indicator 43 as of writing, suggests that the downside is more favoured as the RSI declined sharply below the mid-line. As for the Bollinger Bands, the price preserved its downside traction and dropped below the moving average, therefore a continuation of bearish momentum can be expected. In conclusion, we think the market will be bearish as the pair is heading to test the 0.9765 support. A break below that support might open the door for additional losses.

Resistance:  0.9921, 0.9986, 1.0035

Support: 0.9765, 0.9664, 0.9551

GBPUSD (4-Hour Chart)

The GBPUSD plunged on Thursday, two consecutive day losses erased the gains since October. Early Thursday, the Minnesota Fed President Neil Kashkari crossed newswires. He said that there is still a long way from pausing rates, which weigh on the cables. Data-wise, the US Department of Labor reported that unemployment claims increased, a positive sign for the Federal Reserve. Initial Jobless Claims for the week ending on October 1 rose by 219K, higher than the 203K estimated by analysts. The four-week moving average, which smooths volatile week-to-week results, was almost unchanged. According to a survey from the Bank of England on Thursday, business inflation expectations rose to 9.5% in September, and 8.4% in August. In general, even though BOE is expected to keep rates higher, there might be further weakness in the pound, with the UK still seeing falling into recession and CPI inflation expected to peak lower than previously, indicating probably a more dovish size on the hiking rate than Fed.

From the technical perspective, the RSI indicator below 45, showing the downside pressure would persist. As for Bollinger Band, the pricing was breaking through the lower band as of writing, implying that there might be several continuous drops in the following days and tested the lowest level since October around 1.1069.

Resistance: 1.1379, 1.1507, 1.1714

Support: 1.1069, 1.0797, 1.0632

XAUUSD (4-Hour Chart)

The XAUUSD slightly slip to $1711 as of writing, attracting some intraday selling at a higher level amid a modest USD strength. Gold struggles to gain any meaningful traction on Thursday and seesaws between tepid gains/minor losses through the early US session. The US dollar edges higher for the second straight day and looks to build on the overnight bounce from a two-week low, in turn, acts as a headwind for the dollar-denominated gold. The recent hawkish remarks by several Fed officials reinforced market expectations that another supersized 75 bps Fed rate hike move in November, which remains supportive of elevated US Treasury bond yields and continues to underpin the greenback. Investors need to keep eye on the NFP report released on Friday, which will play a critical role in influencing the near-term USD price. Meantime,  the US bond yields and speeches by influential FOMC members will drive the USD demand. The broader market risk sentiment could provide some impetus to the yellow metal.

From the technical perspective,  the RSI indicator below 60, implying a downside momentum would continue, testing the $1700, a psychological level and weekly low.  As for Bollinger Bands, the price is a breakthrough in the 20-period moving average, a signal telling us that bearish traction could persist for a while.

Resistance:  1726, 1765, 1800

Support: 1614, 1644, 1665, 1700

Economic Data

CurrencyDataTime (GMT + 8)Forecast
CNYCaixin Manufacturing PMI09:30 
CNYManufacturing PMI09:30 
EUREU Leaders Summit18:00 
USDNonfarm Payrolls (Sep)20:30250K
USDUnemployment Rate (Sep)20:303.7%
CADEmployment Change (Sep)20:3020.0K

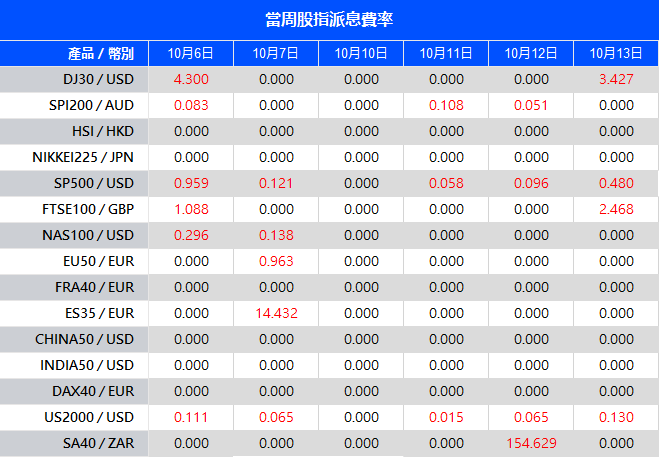
The Adjustment Of Weekly Dividend Notification

Dear Client,

Warmly reminds you that the component stocks in the stock index spot generate dividends. When dividends are distributed, VT Markets will make dividends and deductions for the clients who hold the trading products after the close of the day before the ex-dividend date.

Indices dividends will not be paid/charged as an inclusion along with the swap component. It will be executed separately through a balance statement directly to your trading account, the comment for which will be in the following format “Div & Product Name & Net Volume ”.

Please note the specific adjustments as follows:

The above data is for reference only, please refer to the MT4/MT5 software for specific data.

If you’d like more information, please don’t hesitate to contact [email protected].

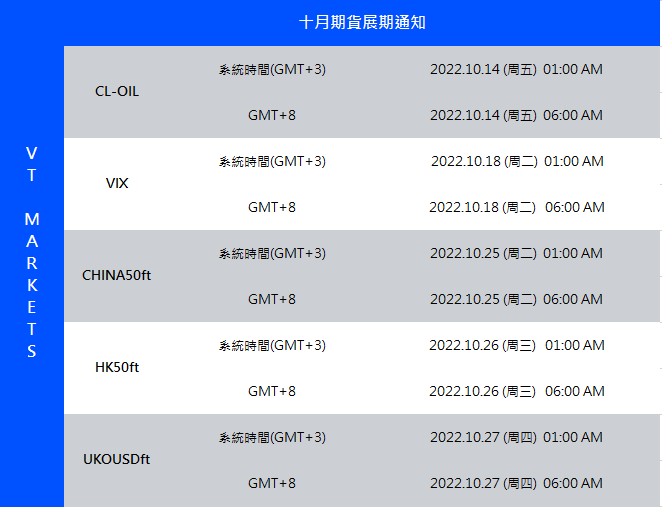
October Futures Rollover Announcement

Dear Client,

New contracts will automatically be rolled over as follows:

Please note:

• The rollover will be automatic, and any existing open positions will remain open.

• Positions that are open on the expiration date will be adjusted via a rollover charge or credit to reflect the price difference between the expiring and new contracts.

• To avoid CFD rollovers, clients can choose to close any open CFD positions prior to the expiration date.

• Clients should ensure that take profits and stop losses are adjusted before this rollover occurs.

If you’d like more information, please don’t hesitate to contact [email protected].

Back To Top
server

Hello there 👋

How can I help you?

Chat with our team instantly

Live Chat

Start a live conversation through...

  • Telegram
    hold On hold
  • Coming Soon...

Hello there 👋

How can I help you?

telegram

Scan the QR code with your smartphone to start a chat with us, or click here.

Don’t have the Telegram App or Desktop installed? Use Web Telegram instead.

QR code