Iran’s Fars news agency reported on Wednesday that Tehran does not view a truce or talks as workable under current conditions. The report came as the United States increased efforts to secure a ceasefire and start direct negotiations.
Following the report, crude oil prices moved slightly higher. West Texas Intermediate was last trading above $88 per barrel and was marginally higher on the day.
Market Reaction And Key Levels
The US Dollar Index remained in positive territory in early American trading. It was above 99.30.
Looking back, the rejection of a truce this time in 2025 was a key event that added a persistent risk premium to energy markets throughout the last year. That headline pushed WTI crude oil from $88 toward a sustained range above $90, a level we now see as the new baseline. This has fundamentally altered how we should view downside risk in the oil sector.
Currently, with WTI holding steady around $92 per barrel, the elevated implied volatility makes selling options an attractive strategy. Recent OPEC+ decisions to maintain production cuts through the second quarter of 2026 provide a solid floor, suggesting that selling out-of-the-money puts below $85 could be a prudent way to collect premium. The market has priced in tension, but not a full-scale disruption, which supports this approach.
The strong US Dollar Index, which moved from 99.30 to its current level near 104.50 over the past twelve months, reflects a flight to safety and a hawkish Federal Reserve. With US inflation data last month coming in at 3.1%, slightly above expectations, the dollar is likely to remain supported. Traders should consider buying call options on dollar-tracking ETFs to position for continued strength.
Volatility And Trading Strategy Implications
We have seen the CBOE Crude Oil Volatility Index (OVX) average near 35 for the past six months, which is roughly 40% higher than the five-year average prior to 2025. This sustained elevation in volatility means option premiums are rich, rewarding strategies that bet on price stability rather than direction. This environment makes complex strategies like iron condors on crude oil futures potentially profitable.
In the immediate weeks ahead, we will be watching weekly EIA inventory reports for any signs of demand destruction from these higher prices. Any renewed diplomatic chatter, however unlikely, would cause a sharp drop in volatility and should be monitored closely. The primary risk remains an unexpected escalation in the Middle East, which would render defensive put-selling strategies ineffective.
Create your live VT Markets account and start trading now.
Start trading now – Click here to create your real VT Markets account
Written on March 25, 2026 at 7:58 pm, by josephine
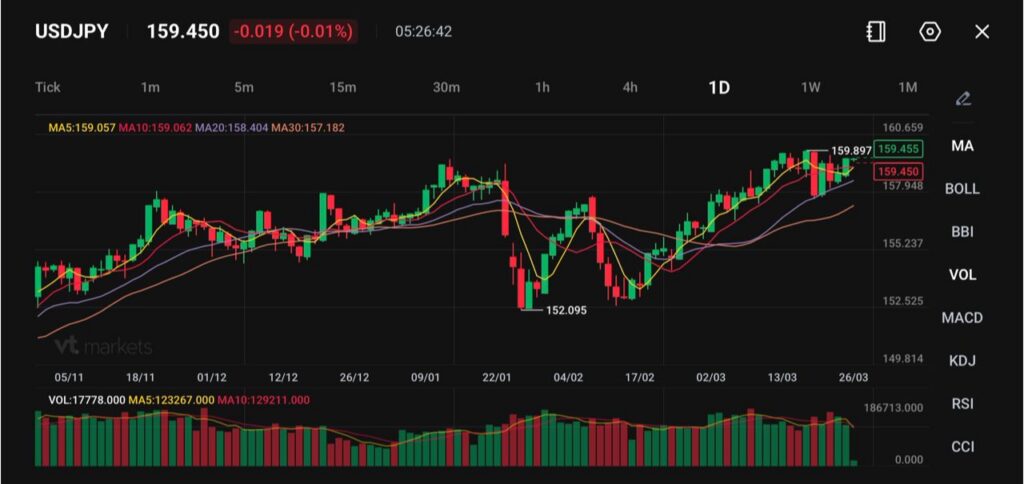
USDJPY trades near 159.45, with the yen weakening for a third straight session.
Rising oil prices are pressuring Japan’s economy and weighing on the currency.
Ongoing Middle East tensions keep safe-haven demand tilted toward the dollar.
The Japanese yen weakened further on Thursday, slipping toward the 159.5 level against the dollar, marking its third consecutive session of losses.
USDJPY is currently trading near 159.45, reflecting renewed demand for the U.S. dollar as geopolitical uncertainty persists.
The move comes as markets react to mixed signals around diplomatic efforts in the Middle East, with little clarity on whether tensions will ease.
Continued uncertainty may keep USDJPY elevated, especially if oil prices remain firm.
Oil Rebound Weighs on Japan’s Economic Outlook
A key driver behind the yen’s weakness is the rebound in oil prices.
Japan’s heavy reliance on imported energy means higher oil prices directly impact its economy, raising costs and increasing inflationary pressure.
Japan’s two-year government bond yield climbed to its highest level since 1996, as expectations build for a near-term Bank of Japan rate hike https://t.co/ly1Gk5gZKc
This dynamic weakens the yen by worsening Japan’s trade balance and reducing growth expectations.
Even as Japan received two oil tankers that bypassed the Strait of Hormuz, offering temporary relief, the broader supply situation remains uncertain.
If oil prices continue to rise, the yen may face further downside pressure.
Geopolitical Tensions Limit Risk Recovery
The geopolitical backdrop remains a central factor in currency markets.
While the U.S. has indicated that negotiations are ongoing, Iran has rejected direct talks and proposed its own terms, including control over the Strait of Hormuz.
This has reduced expectations of a near-term resolution and kept market sentiment cautious.
In this environment, investors continue to favour the U.S. dollar as a safe-haven asset, limiting any meaningful recovery in the yen.
Policy and Security Considerations Add Complexity
Japan is also weighing broader strategic responses to the crisis.
There have been discussions about potentially deploying warships to secure key shipping routes, highlighting the seriousness of the situation for energy-importing nations.
Japan should consider sending warships to help jointly secure the Strait of Hormuz with other nations — even before a ceasefire, a former top national security adviser says https://t.co/glvz2KHufW
Such measures reflect the growing link between geopolitical risk and economic stability.
At the same time, currency markets remain sensitive to any signs of intervention, particularly as USDJPY approaches the 160 level, a zone that has previously triggered official action.
Intervention risks may increase if the pair moves closer to or above 160.
Technical Analysis
USDJPY is trading near 159.45, holding steady just below recent highs as the pair continues to press against the upper end of its range. Price action suggests sustained bullish pressure, with the market testing levels last seen near the 159.90–160.00 zone.
From a technical standpoint, the trend remains firmly bullish. Price is trading above all key moving averages, with the 5-day (159.05) and 10-day (159.06) tightly clustered just below current levels, providing immediate support. The 20-day (158.40) and 30-day (157.18) continue to slope upward, reinforcing the strength of the underlying uptrend.
Key levels to watch:
Support:159.00 → 158.40 → 157.20
Resistance:159.90 → 160.50 → 161.00+
The pair is currently consolidating just below 159.90, a level that has capped recent upside attempts. A clean break above this resistance could trigger a move toward 160.50, with further upside potential if momentum accelerates.
On the downside, 159.00 is acting as immediate support. A break below this level could lead to a deeper pullback toward 158.40, though such a move would likely be corrective unless broader momentum shifts.
Overall, USDJPY remains in a strong uptrend with shallow pullbacks, indicating continued demand for the dollar against the yen. However, with price nearing the 160 level, traders should remain cautious of potential volatility or intervention risks, as this area has historically attracted heightened attention.
What Traders Should Watch Next
USDJPY remains driven by a mix of macro and geopolitical factors. Key drivers include:
Oil price movements and energy supply developments.
Progress or setbacks in Middle East diplomacy.
Potential intervention signals from Japanese authorities.
Broader U.S. dollar strength.
For now, the yen remains under pressure, with energy costs and geopolitical uncertainty continuing to shape its direction.
Canada’s month-on-month change in Employment Insurance beneficiaries fell to -1.9% in January.
This follows a 0.4% change in the previous period.
We are seeing a significant tightening in the Canadian labour market, as the number of people receiving Employment Insurance benefits fell by 1.9% in January. This reversal from the previous month’s increase suggests more Canadians are finding work. This unexpected strength should make us reconsider the timing of any potential Bank of Canada rate cuts.
This strong employment data puts the Bank of Canada in a difficult position, likely pushing any rate cuts further into the year. With the market having priced in cuts for the summer, derivatives tied to the overnight rate, like CORRA futures, could see selling pressure. We should anticipate yields on government bonds to rise in the coming weeks.
Adding to this pressure, recent data for February showed inflation ticked back up to 3.1%, moving away from the central bank’s target. This combination of a hot job market and stubborn inflation reinforces a “higher for longer” interest rate environment. This makes bearish interest rate positions, such as buying puts on bond ETFs, seem more attractive.
From our perspective in 2025, we saw the labor market show signs of cooling, which built the case for eventual monetary easing. However, this new 2026 data sharply contradicts that trend, suggesting the underlying economic momentum is much stronger than anticipated. The market will now have to unwind trades that were based on last year’s assumptions.
Given this, we see potential strength in the Canadian dollar, especially against currencies where the central bank is more dovish. We should look at buying call options on the CAD/USD pair with expirations in the second quarter. Historically, a strong domestic economy combined with a hawkish central bank has been a primary driver for currency appreciation.
This positive economic signal is also supportive of Canadian equities, particularly in consumer-focused sectors. We might consider buying call options on the S&P/TSX 60 index as a broad play on a resilient domestic economy. The data suggests corporate earnings could surprise to the upside in the first half of the year.
Start trading now – Click here to create your real VT Markets account
Written on March 25, 2026 at 7:01 pm, by josephine
The United States Import Price Index rose by 1.3% year on year in February. This was up from -0.1% in the previous reading.
The change shows import prices moved from a year-on-year decline to a year-on-year rise. The figures compare February prices with the same month one year earlier.
The sharp reversal in the year-over-year import price index for February is a significant signal. This move from deflationary to inflationary territory challenges the market’s prevailing view, held through much of 2025, that price pressures were fully contained. We must now seriously consider that a new wave of inflation is building.
This data complicates the Federal Reserve’s path forward, making a summer rate cut less certain. Combined with the latest February CPI report, which showed core inflation holding stubbornly above 3%, this import price spike will likely force a more hawkish tone from policymakers. We should adjust interest rate derivative positions, like those in SOFR futures, to reflect a lower probability of near-term easing.
A more hesitant Fed almost always translates to a stronger U.S. dollar. The Dollar Index (DXY) has already reacted, climbing above 105 for the first time this year as traders re-evaluate global interest rate differentials. We see value in positioning for further dollar strength, perhaps through call options or futures contracts against currencies with more dovish central banks.
For equity derivatives, this environment warrants a more defensive posture. Higher potential rates and persistent inflation can compress company profit margins and weigh on market valuations, which we saw in the market reactions during the 2022-2023 hiking cycle. We should consider buying protective puts on major indices like the S&P 500 or raising exposure to volatility through VIX futures.
Commodity Driven Pressures And Portfolio Positioning
The source of this import price pressure appears linked to commodities, specifically energy and industrial metals. With Brent crude recently breaking the $90 per barrel threshold due to renewed supply discipline from key producers, the input costs for goods are clearly rising again. We should explore call options on commodity-linked ETFs to gain exposure to this underlying trend.
Create your live VT Markets account and start trading now.
Start trading now – Click here to create your real VT Markets account
Written on March 25, 2026 at 7:01 pm, by josephine
The United States export price index rose 3.5% year on year in February. This compares with 2.6% previously.
The higher-than-expected export price index signals that inflation is proving stickier than anticipated. This latest figure, showing a 3.5% year-over-year increase, suggests that inflationary pressures are not just a domestic issue but are also being passed on globally. This reduces the likelihood of an imminent interest rate cut from the Federal Reserve.
Fed Policy Expectations
We must now adjust our expectations for Fed policy in the coming weeks. Current market pricing, according to CME Group data, has now pushed the probability of a June rate cut from over 60% just last week down to around 35% following this report. Therefore, we should anticipate short-term interest rate futures to decline as traders price in a more hawkish Fed for longer.
This environment strongly favors a stronger U.S. dollar. As we saw during parts of last year, 2025, when rate cut hopes were dashed, the Dollar Index (DXY) rallied over 4% in a single quarter. We should consider long positions on the dollar, likely through call options on the DXY or related ETFs, against currencies with more dovish central banks.
For equity markets, this data is a headwind, as higher rates for longer can compress company valuations. The CBOE Volatility Index (VIX), which had been trending near a low of 14, has already seen a notable uptick to 17.5 on this news, reflecting rising uncertainty. Traders should look at buying put options on major indices like the S&P 500 and Nasdaq 100 to hedge against a potential downturn.
Given these interconnected factors, a sensible strategy involves positioning for higher interest rate volatility and a stronger dollar. Consider using call options on the U.S. Dollar Index to hedge or even fund put option strategies on interest-rate-sensitive sectors like technology and real estate. This allows for participation in the currency move while protecting against the likely negative impact on equities.
The United States current account balance for the fourth quarter came in at $-190.7B. This was above expectations of $-211B.
The current account measures the flow of goods, services, income, and transfers between the US and the rest of the world. A less negative figure means the deficit was smaller than forecast.
Current Account Surprise And Dollar Implications
We are seeing the U.S. current account deficit for the fourth quarter come in much smaller than anticipated, at -$190.7 billion against an expected -$211 billion. This news is a direct and positive signal for the U.S. dollar. The smaller deficit suggests stronger underlying economic health than the market had priced in.
This dollar strength should guide our foreign exchange derivative strategies in the coming weeks. We should be looking at long positions on the dollar, perhaps through call options on the UUP exchange-traded fund. Given that the dollar index has already risen over 2% since the start of the year, this data could provide the fuel to test the highs we saw in late 2025.
For equities, this creates a split outlook. A stronger dollar is a headwind for S&P 500 multinationals that rely on foreign sales, which could make put options on the SPY a reasonable hedge. Conversely, domestically-focused companies, like those in the Russell 2000, may benefit from a robust local economy, suggesting call options on IWM could present an opportunity.
In the commodities space, a more muscular dollar typically acts as a weight on prices. We should anticipate downward pressure on assets like gold and oil, which are priced in dollars. Put options on gold ETFs like GLD seem attractive, especially as gold has struggled to maintain momentum after failing to break new highs last month.
Finally, this robust economic data could change the calculus for the Federal Reserve. Any market expectation for near-term interest rate cuts may now be pushed further out, potentially into the second half of the year. We can position for this by considering put options on long-term Treasury bond ETFs like TLT, which fall in price as yields rise.
The United States Export Price Index rose by 1.5% month on month in February. This was above the forecast of 0.5%.
The reported result was 1.0 percentage point higher than expected. The release compares the actual figure with market expectations for the month.
Export Price Surge Signals Persistent Inflation
The February Export Price Index coming in at 1.5% is a significant inflationary signal, tripling expectations. This suggests that price pressures are not fading as quickly as we had anticipated toward the end of 2025. This data point adds to a growing concern that inflation is becoming persistent again.
This report follows the recent February CPI data, which also surprised to the upside at 3.4% year-over-year. We’ve seen Fed officials this month strike a more cautious tone, pulling back from the dovish pivot the market was pricing in during January. Consequently, rate cut expectations have been pushed out, with the probability of a June rate cut now below 20% according to CME FedWatch data.
The bond market is reacting, with the policy-sensitive 2-year Treasury yield climbing back toward 4.95%, a level not seen since November 2025. Traders should consider positions that benefit from higher-for-longer interest rates, such as selling short-term interest rate futures like SOFR. Buying put options on Treasury note futures could also serve as a hedge against further yield increases.
This environment of persistent inflation and a hawkish Fed creates headwinds for equities, especially in technology and other growth-oriented sectors. We are already seeing the VIX rise from its January lows of 13 to the high teens, indicating rising uncertainty. Buying protective put options or establishing bearish put spreads on major indices like the S&P 500 and Nasdaq 100 seems prudent in the coming weeks.
Dollar Strength Builds On Rate Divergence
Stronger economic data is also bolstering the U.S. dollar, which has pushed the DXY index above the key 105 level for the first time this year. This trend is likely to continue as other central banks appear more inclined to cut rates sooner than the Fed. Derivative traders could look at long positions in the dollar through futures or by purchasing call options on USD-centric currency pairs.
Create your live VT Markets account and start trading now.
Start trading now – Click here to create your real VT Markets account
Written on March 25, 2026 at 7:00 pm, by josephine
The United States Import Price Index rose by 1.3% month on month in February. The expected increase was 0.5%.
This result shows import prices increased faster than forecast for the month. It indicates higher costs for goods brought into the United States during February.
Import Prices Signal Persistent Inflation
The surprisingly high 1.3% jump in February’s import prices, reported last week, is a significant inflation signal that we cannot ignore. This figure, more than double the 0.5% expectation, points to persistent price pressures entering the U.S. economy. It confirms that the fight against inflation is far from over, forcing a re-evaluation of the Federal Reserve’s path forward.
This data builds on the recent February Consumer Price Index (CPI) report, which showed core inflation holding firm at a 3.7% annual rate, defying forecasts for a sharper decline. The combined numbers suggest that underlying inflation has momentum, making the Fed’s 2% target look more distant. All eyes will now be on the Personal Consumption Expenditures (PCE) price index data due to be released at the end of this week.
Given this, we see opportunities in derivatives tied to interest rate expectations. The market has already shifted, with fed funds futures now pricing in only a 35% chance of a rate cut by the June meeting, down from over 70% a month ago. We should consider positions that will benefit from a “higher for longer” rate environment, such as buying puts on Treasury bond futures.
For equity traders, this implies increased headwinds and volatility for the broader market, especially for rate-sensitive growth and tech stocks. We should look at purchasing protective puts on the Nasdaq 100 (NDX) or S&P 500 (SPX) to hedge against a potential downturn in the coming weeks. CBOE’s VIX index, a measure of expected volatility, has already climbed to 15.2, up from a low of 12.8 last month, and we expect it to test higher levels.
The U.S. dollar is also poised to benefit from a more hawkish Federal Reserve outlook. A widening interest rate differential should provide support for the dollar against other major currencies. We are positioning for further strength by considering call options on the U.S. Dollar Index (DXY), which has already rallied over 1.5% since this inflationary data began to surface.
Shift From Disinflation To Higher For Longer
Looking back to this time in 2025, the market was fully convinced of a steady disinflationary trend and was pricing in aggressive rate cuts throughout the year. The current data marks a stark reversal of that sentiment, catching many off guard. This fundamental shift from last year’s environment is creating the dislocations we must now trade.
Create your live VT Markets account and start trading now.
Start trading now – Click here to create your real VT Markets account
Written on March 25, 2026 at 6:59 pm, by josephine
EUR/GBP traded near 0.8650 on Wednesday and was slightly lower on the day, as markets weighed Eurozone inflation risks against mixed data from the UK and Germany. The focus was on central bank guidance and recent inflation and activity readings.
In the Eurozone, ECB Chief Economist Philip Lane said inflation could be higher in March and April, linked to rising energy costs tied to the Middle East war. He also pointed to the need to watch inflation expectations and forward-looking measures such as wages.
Eurozone Inflation Watch
ECB President Christine Lagarde said the case for policy action strengthens if misses from the inflation target last longer. She added that energy price pass-through is often limited, but wider knock-on effects need close monitoring.
ECB policymaker Olaf Sleijpen said higher energy prices could spread through the economy faster than in 2022. Separately, Germany’s IFO Business Climate Index fell to 86.4 in March, reflecting weaker sentiment and a drop in expectations.
In the UK, annual inflation was unchanged at 3% in February, matching forecasts. Core inflation rose to 3.2%, with services pressures still present, which supports a cautious approach from the Bank of England.
With both the European Central Bank and the Bank of England signaling vigilance against inflation, we see limited scope for a strong directional move in EUR/GBP. The cross is caught between two hawkish central banks, which suggests a period of consolidation around the current 0.8650 level. This environment makes outright long or short positions risky in the immediate term.
Options Strategy Outlook
Given the competing pressures, we believe implied volatility in EUR/GBP options may be underpriced for the coming weeks. The European Central Bank’s deposit rate is holding at 3.00% while the Bank of England’s rate is at 3.50%, a narrow differential that isn’t driving a clear trend. Any unexpected inflation data from either region could cause sharp, albeit temporary, price swings.
This situation favors strategies that profit from either a range-bound market or a spike in volatility. We are considering selling volatility through strategies like iron condors, with strikes placed above recent highs and below recent lows to collect premium. This view is supported by recent data showing UK retail sales fell by 0.5% in February, capping the Pound’s upside potential and reinforcing the pair’s tendency to trade sideways.
Conversely, the risk of an energy price shock, as mentioned by ECB officials, cannot be ignored. The most recent February data showed Eurozone HICP inflation ticking up to 2.8%, adding credibility to these concerns. Buying cheap, out-of-the-money puts and calls to form a long strangle could be a prudent way to position for a potential breakout if these second-round inflation effects materialize faster than expected.
This dynamic feels familiar, as we recall the cross was confined to a tight range for much of the second half of 2025 due to similar central bank policy alignment. However, the current warnings about energy costs spreading through the economy are reminiscent of the volatility we saw during the 2022 crisis. This historical context suggests that while range-trading strategies are attractive now, we must remain prepared for a sudden shift.
Create your live VT Markets account and start trading now.
Start trading now – Click here to create your real VT Markets account
Written on March 25, 2026 at 6:59 pm, by josephine
Markets currently price about three ECB rate rises by December 2026, and a similar path for the BoE, in response to the Iran war energy shock. Nomura’s baseline forecast keeps policy rates unchanged for both the ECB and BoE through Q4 2027.
The report says the Iran war energy shock differs from the 2022 European energy crisis. It also notes differences between the euro area and the UK.
Euro Area Uk Divergence
Nomura sets a condition for ECB tightening based on oil prices. If Brent stays at USD95–100 per barrel by the ECB’s June meeting, the ECB would raise rates by 25 basis points in June and again in September.
The article states it was produced with help from an AI tool and reviewed by an editor.
Markets are currently pricing in approximately three rate hikes from the European Central Bank by year-end, which is a significant misreading of the current situation. This expectation stems from the recent energy shock caused by the Iran war, but underlying economic conditions are much weaker now than during the 2022 crisis. Derivative traders should view this as an opportunity to position against what appears to be an overly hawkish market sentiment.
The primary difference from the past is that core inflation is behaving; February 2026 data showed it easing to 2.1%, a world away from the accelerating 5% figures we saw in 2022. Recent manufacturing PMI data has also pointed to a contraction at 48.5, indicating a lack of the strong demand that previously fueled price pressures. This contrasts sharply with the post-pandemic recovery period that forced central banks to act aggressively.
Trading Implications For Rates
We are seeing a clear divergence between the Euro area and the UK, where services inflation is proving much stickier. Eurozone negotiated wage growth has also cooled significantly from the highs we observed through most of 2025, lessening the risk of a wage-price spiral. These fundamental differences suggest the ECB has far less reason to hike rates than the Bank of England does.
Therefore, in the coming weeks, traders should consider positioning for ECB rates to remain lower than the forward curve implies. This could involve buying December 2026 Euribor futures, as their price will rise if hike expectations are removed from the market. Receiving fixed on short-term interest rate swaps would also be a direct way to express this view against the current market pricing.
The main risk to this strategy is the oil price itself, with Brent crude recently touching $98 a barrel this month. If oil remains elevated in the $95-$100 range as we approach the ECB’s June meeting, it could force the bank into a reluctant rate hike to manage inflation expectations. The next several weeks of energy market developments will be the critical factor to watch for this trade.
Create your live VT Markets account and start trading now.
Start trading now – Click here to create your real VT Markets account
Written on March 25, 2026 at 6:59 pm, by josephine