Market awaits the US CPI data

US stocks advanced higher on Monday, witnessing upside strength, and ended the previous day with broad gains amid the market’s mildly positive sentiment. The better market mood during European trading hours pushed the US Dollar into the red across the FX board and provided firm support to equity markets.

Investors now waiting for the release of the January United States Consumer Price Index (CPI), which is foreseen raising at an annualized pace of 6.2% and has a high impact on financial markets. On top of that, Fed Governor Michelle Bowman said on Monday that the Federal Reserve will need to continue to raise interest rates to bring inflation back down to the central bank’s target rate. Market sentiment improved as fears surrounding the United States and China eased afterward on comments from the US General, who turned down the fears while rejecting calls to believe that those flying objects were from China. On the Eurozone front, bets for additional jumbo rate hikes from the European Central Bank (ECB) in the coming month lend some support to the Euro.

The benchmarks, S&P 500 and Dow Jones Industrial Average both advanced higher on Monday as the S&P 500 closed higher when traders brace for the Consumer Price Index (CPI) for January amid mixed clues. The S&P 500 was up 1.1% daily and the Dow Jones Industrial Average also climbed higher with a 1.1% gain for the day. Ten out of eleven sectors in the S&P 500 stayed in positive territory as the Information Technology sector and the Consumer Discretionary sector are the best performing among all groups, rising 1.77% and 1.46%, respectively. The Nasdaq 100 meanwhile rose the most with a 1.6% gain on Monday and the MSCI World index was down 0.3% for the day.

Main Pairs Movement

The US dollar retreated lower on Monday, remaining under pressure, and dropped to a daily low below 103.30 level amid the upbeat market mood. The upbeat US equities and a pullback in the US Treasury bond yields after multiple days of run-up both acted as a headwind for the greenback. However, the absence of relevant macroeconomic releases and the upcoming US CPI report limited the intraday US Dollar slide.

GBP/USD advanced higher on Monday with a 0.64% gain after the cable preserved its upside traction and touched a daily high above the 1.2140 mark amid a modest recovery in the global risk sentiment. On the UK front, the country will publish its latest employment figures on Tuesday. Meanwhile, EUR/USD also witnessed buying interest and climbed to a daily high of around the 1.0725 area. The pair was up almost 0.42% for the day.

Gold declined lower with a 0.65% loss for the day after witnessing selling momentum and extended its slide towards the $1850 area during the US trading session, as the hawkish Fed comments keep the market’s fears of tighter monetary policy and weigh on the Gold price. Meanwhile, WTI Oil advanced higher with a 0.53% gain for the day.

Technical Analysis

EURUSD (4-Hour Chart)

The EURUSD regained its recovery momentum near the 1.071 level during the early American trading session, as investors waited for Tuesday’s highly-anticipated inflation data.  The US dollar erased most daily gain in US trading hours amid the upbeat Wallstreet’s major indices opening, the DXY index was trading at 103.35 level as of writing. The market participants put all their focus on US Consumer Price Index (CPI) released on Tuesday and continued to reassess the future Federal Reserve(Fed) decisions, favoring the market move in a volatile path. In Eurozone, the European Commission released the quarterly Economic Growth Forecast report. The report failed to provide a boost for the Euro currency, despite showing upward revisions to economic growth and downward revisions to inflation.

From a technical perspective, the four-hour scale RSI indicator regathered bullish strength, reading 51 as of writing, which suggested that the pair mildly corrected toward the upside. As for the Bollinger Bands, the pair was pricing above the 20-period moving average, showing that the pair currently attracted some positive traction.

Resistance: 1.0930, 1.1022

Support: 1.0662, 1.0508

GBPUSD (4-Hour Chart)

The GBPUSD gathered recovery momentum and extended its daily rebound in the American trading session toward the 1.2150 level. The positive shift witnessed in risk sentiment seems to be causing the haven US Dollar to lose interest and fueling the pair’s upside ahead of Tuesday’s key macroeconomic data releases. Rising bets for further policy by the Federal Reserve (Fed) should help limit the downside for the USD and cap gains for the pair. Apart from this, a dovish assessment of the Bank of England (BoE) decision last week warrants some caution before placing aggressive bullish bets around the pound pairs.

From the technical perspective, the four-hour RSI indicator climbed to 56 as of writing, suggesting that the pair now was surrounded by bullish momentum. As for the Bollinger Bands, the pair was priced above the 20-period moving average and wandered in a range from 1.2000 to 1.2200, showing the pair have no clear path in near future.

Resistance: 1.2264, 1.2391, 1.2492

Support: 1.1927, 1.1859

XAUUSD (4-Hour Chart)

Gold prices were struggling to hold above the $1850 mark after having advanced toward $1870 in the early European trading session. The prospects for further policy tightening by the Federal Reserve (Fed) continue to underpin the US Dollar and act as a headwind for the non-yielding Gold price. A slew of Federal Open Market Committee (FOMC) policymakers, including Fed Chair Jerome Powell, last week stressed the need for additional interest rate hikes to fully gain control of inflation. Now, the market focus remains glued to the crucial CPI inflation report. The data could influence the Fed’s rate-hike path and determine the near-term trajectory for the XAUUSD.

From the technical perspective, the four-hour scale RSI indicator further declined to 37 figures as of writing, suggesting that the pair was confronting heavy selling pressure. As for the Bollinger Bands, the gold continued to price along with the lower band, showing the pair was amid strong bearish traction. We think the yellow is more favorable to the downside path shortly before the CPI inflation report.

Resistance: 1898, 1913, 1956

Support: 1832, 1800

Economic Data

CurrencyDataTime (GMT + 8)Forecast
GBPAverage Earnings Index +Bonus (Dec)15:006.20%
GBPClaimant Count Change (Jan)15:0017.9K
GBPCore CPI (MoM) (Jan)21:300.40%
USDCPI (MoM) (Jan)21:300.50%
USDCPI (YoY) (Jan)21:306.2%

US Treasury yields pointed to higher interest rates, Nasdaq closed lower

The Dow Jones Industrial Average closed 0.5% higher at 33,869.4; the S&P 500 rose 0.22% to 4,090.48; the Nasdaq fell 0.61% to 11,718.12.

The NASDAQ on Friday closed lower as mega-cap growth stocks came under pressure after US Treasury yields pointed to higher interest rates and shares of ride-hailing firm Lyft plummeted 36 percent to US$10.31 as it lowered prices, raising concerns it was falling behind bigger rival Uber Technologies Inc. Uber shares also dropped 4.43 percent to US$34.30.

Yields on the benchmark 10-year Treasury note rose to their highest in more than a month following an auction on Thursday of 30-year bonds that drew weak demand.

Higher bond yields are going to adversely affect higher-growth technology companies.

A rally in energy stocks as oil prices climbed on Russia’s plans to cut crude supplies helped push up the Dow Jones Industrial Average and the S&P 500 Index.

After US equities were rattled over the week by strong jobs data, investors are waiting for last month’s consumer inflation data this week for clarity on the Fed’s rate-hike path.

Main Pairs Movement

The dollar rose on Friday as investors grew increasingly concerned that U.S. inflation data due out next week could be higher than market expectations, with earlier data showing that consumers expect prices to continue to rise next year. DXY reverses Thursday’s decline to weekly lows and regains the area well north of the 103.00 barriers on Friday. At the time of writing, the price is trading at 103.578.

Oil prices rose more than 2% on Friday and more than 8% weekly as Russia announced plans to reduce oil production next month after the West imposed price caps on Russian crude and fuel. The decision to cut production suggests that capping the price of its oil products has had an impact. However, two OPEC+ representatives told Reuters that OPEC+ plans to take no action after Russia announced production cuts. Goldman Sachs lowered its 2023 price forecast for Brent crude futures to $92 from $98 a barrel and its 2024 price forecast to $100 from $105.

Gold rose slightly on Friday as the market awaits next week’s U.S. inflation data, which could affect the Fed’s monetary policy trajectory. Spot gold rose 0.2% to $1,864.10 per ounce. At the time of writing, the price traded at $1,865.30.

Technical Analysis

EURUSD (4-Hour Chart)

The EURUSD dropped dramatically on Friday, as US Dollar regained strength amid investors’ worries about higher interest rates by the Federal Reserve. Currently, the spotlight has entirely shifted to the United States Consumer Price Index (CPI) data, which will release on Tuesday. As per the consensus, the headline inflation could soften to 5.8% on an annual basis vs. the prior release of 6.5%. Moreover, the core inflation that excludes the impact of oil and food prices is seen lower at 5.3% against the former release of 5.8%. In the Eurozone, the Eurozone inflation rate has shown a meaningful decline after easing energy prices and higher interest rates by the European Central Bank (ECB). However, the inflation rate is still hovering at extremely elevated levels, which needs a monetary policy sufficiently restrictive to tame inflation.

From the technical perspective, the four-hour scale RSI indicator slid to 35 figures as of writing, suggesting that the pair are surrounded by negative traction. As for the Bollinger Bands, the pair dropped below the lower band and the size between the upper and lower bands got larger, showing that the pair is more favored to the downside path shortly.

Resistance: 1.0930, 1.1022

Support: 1.0662, 1.0508

GBPUSD (4-Hour Chart)

The GBPUSD dropped below the 1.2100 level during the American trading session, as upbeat US Consumer Confidence data supported the US Dollar. The pair’s upside is limited by the mixed macroeconomic data released from the UK. The UK GDP report concentrated by 0.5% monthly in December and stagnated in the fourth quarter. On a positive note, Industrial Production expanded by 0.3% in December, surpassing the market expectation for a decrease of 0.2%. Nevertheless, investors currently keep their eyes on next week’s key inflation data from the US. Market participants could refrain from committing to large positions ahead of the key figures.

From the technical perspective, the four-hour scale RSI indicator remained at the neutral level, 45 figured as of writing, which shows that the pair now have no clear path to go and any signal might attract critical transactions to the pounds. As for the Bollinger Bands, the pair has just fallen below the 20-period moving average and no clear change in the gap size, suggesting that the market participants are waiting for further signals.

Resistance: 1.2264, 1.2391, 1.2492

Support: 1.1927, 1.1859

XAUUSD (4-Hour Chart)

Gold prices were struggling to hold near the $1860 mark as of writing, as the benchmark 10-year US Treasury bond yield is up more than 1% on the day above 3.7%, undermining the Dollar-denominated gold. Investors from worldwide are putting their focus on the Federal Reserve rate hike path, triggering additional legs to the US Dollar pullback come this Friday. The higher interest rate for longer weighs on the corporate sector, hurting global stocks. Apart from this, the end-of-the-week repositioning could also come into play, exacerbating the pain in the yellow metal price, as market participants gear up for next Tuesday’s key United States event release.

For the technical aspect, the four-hour scale RSI indicator 39 figures as of writing, continuing to hover in the neutral level. As for the Bollinger Bands, the price is trading below the 20-period moving average, showing that the pair is staying on the back foot. In conclusion, the price is capped in a narrow range so far this week, and it needs a decisive breakthrough to confirm the path in the near term. At the moment of writing, the price is currently struggling to hold above support at $1,860, and the pair continued to bear downside traction. If the price drops below the current support, it may trigger some technical selling and drag the price deeper.

Resistance: 1898, 1913, 1956

Support: 1860, 1832, 1800

Week ahead: All eyes on US and UK Consumer Price Index releases

This week, investors and economists will be closely monitoring the latest Consumer Price Index (CPI) data releases from the US and the UK. The CPI is an important economic indicator that measures the changes in the prices of goods and services that households purchase. As it provides insight into the overall inflation trend, the data release has a significant impact on financial markets and central bank policies. 

With inflation being a hot topic in recent months, traders and analysts alike will be eager to see if the numbers will continue to trend upward or if they will show a slowdown.

Here are key market events for the week ahead:

Switzerland’s Consumer Price Index (13 February)

In December 2022, Switzerland’s CPI saw a decline of 0.2% compared to the previous month. This drop showed a decrease in the annual inflation rate, which fell to 2.8% year-on-year in December 2022, marking the lowest inflation rate recorded in Switzerland since April 2022.

Looking ahead to January 2023, analysts are forecasting another decrease in Switzerland’s CPI of 0.1%. This decrease is expected to bring down the annual inflation rate further to 2.7%. 

UK Claimant Count Change (14 February)

The UK saw a rise in the number of people claiming unemployment benefits in December 2022, with a total increase of 19,700 claims compared to the previous month of November 2022, which saw a rise of 16,100 claims.

For January 2023, analysts forecast a drop in claims with an estimated 12,000 new claims expected. While the UK continues to face challenges in the labor market, this expected decrease in claims could indicate a positive shift towards job stability and economic recovery.

US Consumer Price Index (14 February)

US CPI saw a decrease of 0.1% in December 2022 compared to the previous month, marking the first time the CPI has declined since May 2020. This decrease led to a slowdown in the annual inflation rate, which fell to 6.5% in December 2022, and marks the sixth consecutive month of slowing inflation and is the lowest reading since October 2021.

Analysts are forecasting a slight increase in the US CPI for January 2023, with an expected 0.4% month-on-month growth. The annual inflation rate is expected to be slower at 6.3%. 

UK Consumer Price Index (15 February)

UK CPI dropped to 10.5% in December 2022, down from 10.7% in November. This marks the second month of slowing inflation, with a rate of 10.5% being the lowest in three months after reaching a peak of 11.1% in October.

Analysts forecast that the UK annual inflation rate will continue to slow down to 10.3% this month.

US Retail Sales (15 February)

Retail sales in the US decreased by 1.1% in December 2022 compared to the previous month, after an earlier revised decrease of 1% in November.

Analysts predict a modest increase in US retail sales this month, with an estimated growth of 0.6%.

US Empire State Manufacturing Index (15 February)

The New York Empire State Manufacturing Index showed a significant decline, reaching a low of -32.9 in January 2023. This represents the fifth-worst contraction ever in business activity in the state of New York.

Analysts forecast a slight improvement for February 2023, with an expected reading of -19.

US Producer Price Index (16 February)

In December 2022, producer prices in the US decreased 0.5% month-on-month, following a 0.2% increase in November, marking the largest monthly decline since April 2020. This suggests that inflationary pressure in the US is cooling.

Analysts predict another 0.4% drop in US PPI for January 2023.

US stocks fell as investors awaited next week’s inflation report

US stocks declined lower on Thursday, failing to find many reasons to climb higher and extending its previous slide amid higher bond yields, hawkish Fedspeak, and a surge in equity bullishness. The fresh fears surrounding the economic slowdown ahead of the key US data lend support to the greenback’s gauge versus the six major currencies and weighed on the equity markets.

However, the downbeat comments from the Federal Reserve (Fed) officials and softer US data, as well as China-inspired market optimism in the Asia-Pacific zone, might help the stock market to find recovery strength. On top of that, Japan’s Prime Minister Kishida is expected to name BOJ Governor Kuroda’s successor next week. Speculation revolves around whether Kishida will choose a more aggressive leader for the central bank that will end the ultra-loose monetary policy. On the Eurozone front, the odds of a continuation of bumper interest rate hikes by the ECB are still solid despite a decline in German inflation.

The benchmarks, S&P 500 and Dow Jones Industrial Average both declined lower on Thursday as the S&P 500 wiped out a rally of almost 1% amid renewed recession fears and the cautious mood. The S&P 500 was down 0.9% daily and the Dow Jones Industrial Average also dropped slightly with a 0.7% loss for the day. All eleven sectors in S&P 500 stayed in negative territory as the Communication Services sector and the utility sector are the worst performing among all groups, losing 2.80% and 1.41%, respectively. The Nasdaq 100 meanwhile retreated the most with a 0.9% loss on Thursday and the MSCI World index was down 0.4% for the day.

Main Pairs Movement

The US dollar retreated lower on Thursday, dropping to a daily low below 102.70 level but then rebounded back amid the fresh fears surrounding the economic slowdown ahead of the key US data. The higher government bond yields and comments from Richmond Fed President Thomas Barkin help the greenback to find demand, as he said that the effects of the Fed’s policy tightening have been substantial while adding that macroeconomic data put back the risk of a recession.

GBP/USD advanced higher on Thursday with a 0.41% gain after the cable preserved its upside traction and touched a daily high above the 1.2180 mark ahead of UK GDP data. On the UK front, the UK GDP is expected to release on Friday and upbeat data could avoid recession fears and support the Pound Sterling. Meanwhile, EUR/USD also witnessed buying interest and climbed to a daily high of around 1.0790 area. The pair was up almost 0.26% for the day.

Gold declined sharply with a 0.73% loss for the day after retreating from a daily top and extended its slide towards the $1860 area during the US trading session, as the higher US Treasury bond yields renewed recession fears and exerted bearish pressures on the yellow metal. Meanwhile, WTI Oil dropped lower with a 0.52% loss for the day. Oil prices dropped as Asia’s earthquake worries faded.

Technical Analysis

EURUSD (4-Hour Chart)

The EURUSD lost its upside traction after reaching the 1.0800 area at the beginning of the US trading session and struggled to hold above the 1.0750 level as of writing. The US Dollar regains strength and limits the pair’s upside room with Wall Street’s main indexes retreating from opening highs. On Thursday, a better market mood alongside sliding US Treasury yields undermined US dollar demand. Softer-than-expected German inflation figures triggered a short-lived reaction as the Harmonized Index of Consumer Prices (HICP) unexpectedly rose by 9.2% YoY in January, below the 10% expected and easing from the previous 9.6%, which means the ECB can decelerate the pace of tightening. Apart from this, the ECB member and Bank of France head, Francois Villeroy de Galhau, hit the wires and said that he thinks he can exclude a recession in the French as of today. His words provided an extra boost for the Euro currency.

From a technical perspective, the four-hour scale RSI indicator slid to 48 as of writing, suggesting that the pair’s momentum turned neutral and any event may be a decisive move. As for the Bollinger Bands, the EURUSD is trading in the upper area and supported by a 20-period moving average, showing the pair is on the defensive in the near term.

Resistance: 1.0930, 1.1024

Support: 1.0661, 1.0508

GBPUSD (4-Hour Chart)

The GBPUSD has managed to build on earlier gains and touched its highest level in nearly a week above 1.2170 on Thursday before retreating modestly. BOE policymakers’ cautious comments on the inflation outlook and the US Dollar’s uninspiring performance fueled the pair’s rally. Traders might refrain from placing aggressive bullish bets around the British Pound amid a dovish assessment of the Bank of England’s policy decision last week. The UK central bank removed the phrase that they would “respond forcefully, as necessary”. Furthermore, BoE Governor Andrew Bailey said that inflation will fall more rapidly during the second half of 2023. This suggested that the BoE was becoming increasingly unsure as to whether further policy tightening is warranted and that the current rate-hiking cycle might be nearing the end. Hence, investors will look to the BoE’s monetary policy report hearing for clues about future rate hikes, which might influence the Sterling.

From the technical perspective, the four-hour scale RSI indicator slightly slid to 52 at the moment of writing, showing that the pair have no critical traction to dominate the moving direction. As for the Bollinger Bands, the pair has just fallen below the upper band and the gap size had little changed, which is a sign that the bullish momentum tends to slow down.

Resistance: 1.2265, 1.2393, 1.2493

Support: 1.1927, 1.1858

XAUUSD (4-Hour Chart)

Gold prices were volatile in the course of trading on Thursday. Earlier, the price surged to $1,889.73 in the EU trading session. Later in the US trading session, it started to reverse from its daily high, falling towards $1,860. At the time of writing, the Gold price is trading at $1,865.59, posting a 0.56% loss daily. The US dollar index declined 0.23% to 103.229, while the benchmark US 10 Year Treasury Yield rose 1.97% to 3.684, which seems to cap on Gold price. The following trend for Gold prices still depends on the rate hiking path from the Fed. For more price action, eye on the comments from Federal Reserve officials and the US economic reports.

For the technical aspect, RSI indicator 39 figures as of writing, sliding from mid-line as the price staged a downside correction. As for the Bollinger Bands, the price is moving up and down around the moving average. The main traction seems unclear for now. In conclusion, the price is capped in a narrow range so far this week, and it needs a decisive breakthrough to confirm the path in the near term. That said, we think the bearish is more favored as the rally today was rejected. A downtrend should persist. For the downtrend scenario, the price is currently holding above support at  $1,860. If the price drops below the current support, it may trigger some technical selling and drag the price deeper.

Resistance: 1900, 1920, 1957

Support: 1860, 1830, 1800

Economic Data

CurrencyDataTime (GMT + 8)Forecast
GBPGDP (QoQ) (Q4)15:000.0%
GBPGDP (MoM) (Dec)15:00-0.3%
GBPGDP (YoY) (Q4)15:000.4%
GBPManufacturing Production (MoM) (Dec)15:00-0.2%
GBPMonthly GDP 3M/3M Change (Dec)15:00 
EUREU Leaders Summit18:00 
RUBInterest Rate Decision (Feb)18:307.50%
CADEmployment Change (Jan)21:3015.0K

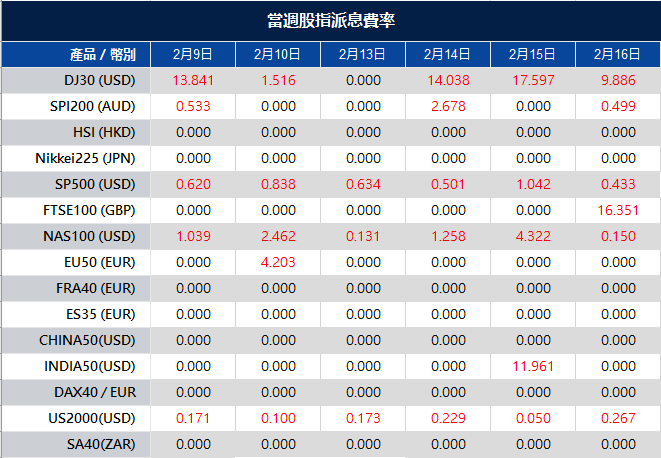
Weekly Dividend Adjustment Notice – February 09, 2023

Dear Client,

Warmly reminds you that the component stocks in the stock index spot generate dividends. When dividends are distributed, VT Markets will make dividends and deductions for the clients who hold the trading products after the close of the day before the ex-dividend date.

Indices dividends will not be paid/charged as an inclusion along with the swap component. It will be executed separately through a balance statement directly to your trading account, the comment for which will be in the following format “Div & Product Name & Net Volume ”.

Please note the specific adjustments as follows:

The above data is for reference only, please refer to the MT4/MT5 software for specific data.

If you’d like more information, please don’t hesitate to contact [email protected]

Fed: Interest rates need to keep higher

US stocks declined sharply on Wednesday, suffering heavy daily losses, and were dragged lower by a selloff in tech stocks as Federal Reserve speakers reinforced the idea that interest rates will need to keep climbing to quash inflation.

Fed Governor Christopher Waller teased a long fight with a 2.0% inflation target by citing expectations of tighter monetary policy for longer than expected. Meanwhile, Governor Lisa Cook also said that the central bank remains focused on restoring price stability, as inflation is still running too high. Therefore, hawkish comments from the US policymakers provided support to the US Dollar and exerted bearish pressure on the equity markets.

On top of that, the mixed concerns surrounding the latest geopolitical tension between the US also acted as a tailwind for the greenback. On the Eurozone front, European Central Bank policymaker Klaas Knot said that headline inflation appears to have peaked but added that keeping the current pace of hikes into May could well be needed if underlying inflation does not materially abate.

The benchmarks, S&P 500 and Dow Jones Industrial Average both declined lower on Wednesday as the S&P 500 almost wiped out its previous session’s rally amid hawkish comments from the US policymakers. The S&P 500 was down 1.1% daily and the Dow Jones Industrial Average also dropped slightly with a 0.6% loss for the day.

All eleven sectors in S&P 500 stayed in negative territory as the Communication Services sector and the utility sector are the worst performing among all groups, losing 4.13% and 1.71%, respectively. The Nasdaq 100 meanwhile retreated the most with a 1.8% loss on Monday and the MSCI World index was down 0.5% for the day.

Main Pairs Movement

The US dollar advanced higher on Wednesday, rebounding from a daily low, and held onto its recovery moves towards the 103.50 level amid hawkish Federal Reserve comments. The Fed officials including Chairman Jerome Powell renewed inflation fears and allowed the US Dollar Index (DXY) to regain upside momentum. However, receding woes of the US-China ties and a light calendar might limit the upside for the US Dollar.

GBP/USD advanced higher on Wednesday with a 0.20% gain after the cable struggled to maintain its feet and gradually dropped to the 1.2060 area amid the souring market mood. On the UK front, the UK GDP is expected to display a flat performance every quarter on Friday. Meanwhile, EUR/USD also remained under pressure around the 1.0710 area amid a modest US Dollar comeback. The pair was down almost 0.13% for the day.

Gold advanced slightly with a 0.13% gain for the day after touching a daily high at $1886 during the European trading session, as the statements highlighting inflation fears from the US diplomats weighed on the yellow metal. Meanwhile, WTI Oil rebounded higher with a 1.74% gain for the day. The solid China recovery is expected to keep the oil price in bullish territory.

Technical Analysis

EURUSD (4-Hour Chart)

The EURUSD erased daily gains and was trading below 1.0730 as of writing. The EUR/USD pair hover around 1.0740 on Wednesday, consolidating after Tuesday’s Federal Reserve (Fed) chief Jerome Powell turmoil in markets. The head of the American central bank participated in a moderated discussion at the Economic Club of Washington, DC, providing some interesting headlines. The macroeconomic calendar has no relevant data scheduled for today. A couple of Federal Reserve officials are scheduled to speak during the American afternoon.

From the technical perspective, the four-hour scale RSI indicator climbed to 42 as of writing, suggesting that the pair’s negative traction has weakened. As for the Bollinger Bands, the pair continued to wander below the 20-period moving average, showing that the EURUSD remained defensive at the moment of writing.

Resistance: 1.0930, 1.1025

Support: 1.0664, 1.0508

GBPUSD (4-Hour Chart)

The GBPUSD has failed to stabilize above 1.2100 and erased a portion of its daily gains. The US Dollar preserves its strength amid the souring market sentiment and makes it difficult for the pair to gather recovery momentum. Late Tuesday, FOMC Chairman Jerome Powell also acknowledged the strong labor market data and reiterated that they will probably need to do further rate hikes. In an optimistic tone, Powell said that he was expecting 2023 to be “a year of the significant decline in inflation.” This comment made it difficult for the US Dollar Index to preserve its bullish momentum and helped GBP/USD erase some of this week’s losses. Currently, the CME Group FedWatch Tool shows that markets are pricing in a 68% probability of the Fed opting for two more 25 basis points rate increases in March and May. The market positioning is unlikely to change significantly ahead of next week’s inflation report.

From the technical perspective, the four-hour scale RSI indicator recovered to 46 at the moment of writing, suggesting that the pair now have no decisive direction. As for the Bollinger Bands, the pair was breaking through the 20-period moving average to the upper area and the size between the upper and lower bands got smaller, signaling that the pair was within the consolidation phase.

Resistance: 1.2264, 1.2391, 1.2492

Support: 1.1924, 1.1859

XAUUSD (4-Hour Chart)

Gold price stays around $1,870, unable to gain traction on Wednesday amid the absence of a fresh catalyst. Market participants lack of consensus so far from US Federal Reserve (Fed) Chair Jerome Powell’s speech on Tuesday. Powell repeated that they were determined to control inflation and would continue tightening the monetary policy by hiking rates. On the other hand, he also stated that the disinflationary process has begun. At the time of writing, the Gold price is trading at $1,877.26, posting a 0.3% gain daily. The US dollar index rose 0.03% to 103.370 and the benchmark US 10 Year Treasury Yield declined 0.65% to 3.653, having no clear traction on Gold price.

For the technical aspect, RSI indicator 43 figures as of writing, signaling no clear traction as the RSI indicator has no significant movement in the near term. As for the Bollinger Bands, the price is holding around the downward moving average. The bearish trend could persist. In conclusion, we think the market is in modest bearish mode though both indicators show no strong bearish potential. The downtrend from last week should persist until further breakthrough. For the downtrend scenario, the price is currently holding above support at  $1,860. If the price drops below the current support, it may trigger some technical selling and drag the price deeper. For the uptrend scenario, the price must hold above $1,860 and break through the resistance at the round-figure mark of $1,900 to confirm the uptrend.

Resistance: 1900, 1920, 1957

Support: 1860, 1830, 1800

Economic Data

CurrencyDataTime (GMT + 8)Forecast
EUR                German CPI (YoY) (Jan)15:008.9%
GBP                BoE MPC Treasury Committee Hearings17:45 
EUR                EU Leaders Summit 18:00 
USD                Initial Jobless Claims21:30190K

Powell: Inflation is in the very early stages of easing

Federal Reserve Chairman Bill Powell said Tuesday that inflation is in the very early stages of easing, which may be a long process, the process may be bumpy, and must keep interest rates at restrictive levels for some time. In the job market, Bauer said that if the strong employment data continues, further interest rate increases will be needed to cool inflation, and borrowing costs may have to reach a peak higher than previously estimated by the Fed.

The Fed’s inflation target is 2%, but several indicators show that the inflation rate is much higher than this target. The U.S. non-farm payrolls report for January released last week showed that 517,000 people were added to the workforce, far exceeding the market’s expectations of 185,000, and the unemployment rate also set a new 53-year low of 3.4%.

Dow ends higher as Powell offers limited new clues on policy. The Dow Jones Industrial Average gained 0.78% or 265 points, the S&P 500 rose 1.3%, and the Nasdaq jumped 1.9%.

On the other hand, the U.S. 10-year bond yield surged to 3.66% and the U.S. Dollar Index rose to 103.53. The U.S. Dollar Index was nearing 104 before Bauer’s remarks, setting a new high for the second day in a row since Jan. 6 and rising more than 0.3% during the day.

Main Pairs Movement

The US dollar retreated lower on Tuesday, extending its February rally throughout the first half of the day but failed to preserve upside traction amid mixed comments from the Federal Reserve (Fed) officials. Fed Chairman Jerome Powell said that he expects 2023 to be a year of significant declines in inflation and added that the central bank would certainly raise rates more if data were to continue to come in stronger than expected. Therefore, the US Dollar fell as Wall Street soared as an immediate reaction.

GBP/USD advanced higher on Tuesday with a 0.24% gain after the cable regained upside strength and rebounded towards the 1.2080 mark amid the fresh optimism surrounding the UK Prime Minister Rishi Sunak’s Cabinet reshuffle. On the UK front, Sunak broke the British Cabinet into two departments to justify his pledge to bolster the economy. Meanwhile, EUR/USD was nothing changed and stabilized above 1.0720 despite hawkish Fed commentary.

Gold advanced slightly with a 0.30% gain for the day after climbing to a daily high above $1880 during the US trading session, as market sentiment stays sluggish amid mixed signals from the Federal Reserve and the geopolitical front. Meanwhile, WTI Oil advanced sharply with a 4.09% gain for the day as the US Dollar weakens on soft US Fed Powell remarks.

Technical Analysis

EURUSD (4-Hour Chart)

The EURUSD has lost its traction and dropped to its lowest level in nearly a month below 1.0700 following a quiet European morning. Ahead of FOMC Chairman Jerome Powell’s speech, the US Dollar preserves its strength on hawkish Fedspeak and weighs on the pair. The EURUSD pair extended its slide to a fresh three-week low at 1.0969, as demand for the US Dollar prevails ahead of the United State Federal Reserve (Fed) President Jerome Powell’s speech. Market participants are still pricing in the latest central bank decisions and the solid employment report published last Friday, both suggesting the Federal Reserve would maintain the tightening course. Chair Powell is due to participate in a moderated discussion at the Economic Club of Washington DC after Wall Street’s opening and may provide a clue about monetary policy.

From a technical perspective, the four-hour scale RSI indicator remained around the 30 levels, suggesting that the pair were surrounded by heavy bearish pressure and investors should be aware of any sign of a dramatic rebound. As for the Bollinger Bands, the pair kept pricing at the lower area, but the size between the upper and lower bands got lower, which indicates that the pair’s downside momentum has been slowdown. We think the pair is more favored for the downside path in the short term, but a critical rebound is not far away.

Resistance: 1.0747, 1.0930, 1.1022

Support: 1.0661, 1.0508

GBPUSD (4-Hour Chart)

The GBPUSD managed to rebound above the 1.2000 level at the moment of writing, erasing its most daily losses. As investors await FOMC Chairman Jerome Powell’s speech, the US Dollar was moving in a volatile path and struggling to preserve its strength as of writing. However, it is too early to say whether Pound Sterling is out of the woods as investors are unlikely to bet on an extended recovery ahead of FOMC Chairman Jerome Powell’s highly-anticipated speech. In the Eurozone, news of EU and UK negotiators have made a breakthrough in the Nothern Ireland Protocol helped Pound Sterling stay resilient against its rivals. Additionally, Bank of England (BoE) Chief Economist Huw Pill noted that they were ready to do more to get inflation back to target, providing a boost for the GBPUSD pair.

From a technical perspective, the four-hour scale RSI indicator rebounded to 33 as of writing, suggesting that the pair was amid strong recovery strength. As for the Bollinger Bands, the pair was pricing below the 20-period moving average and the gap size became smaller, which is a sign that the pair’s negative traction has been softer. The pair now is waiting for a critical move to decide the near-future direction.

Resistance: 1.2265, 1.2397, 1.2492

Support: 1.1927, 1.1854

XAUUSD (4-Hour Chart)

Gold prices were volatile on US Federal Reserve (Fed) Chairman Jerome Powell’s speech. Earlier, the Gold price surged to its highest $1,884.37, and pullback from then as the US dollar regather strength. Federal Reserve Chair Jerome Powell on Tuesday reiterated that continued interest-rate increases will be appropriate and that the “disinflationary process” has begun. The gold prices rose following Powell’s comments that inflation was on the decline. Aftermarket participants reassess the comments and the US dollar regathers strength and Gold price pullback. At the time of writing, the Gold price is trading at $1,872.82, posting a 0.25% gain daily.

For the technical aspect, RSI indicator 39 figures as of writing, slightly holding above the 30 lines as the price established itself above $1,860  from the sharp decline last week. As for the Bollinger Bands, the price is moving between the downward moving average and the lower band. The bearish trend could persist. In conclusion, we think the market is in bearish mode as both indicators show bearish potential. For the downtrend scenario, the price is currently holding above support at  $1,860, which seems unstable for now. If the price drops below the current support, it may trigger some technical selling and drag the price deeper. For the uptrend scenario, the price must hold above $1,860 and break through the resistance at the round-figure mark of $1,900 to confirm the uptrend.

Resistance: 1900, 1920, 1957

Support: 1860, 1830, 1800

Economic Data

CurrencyDataTime (GMT + 8)Forecast
USDCrude Oil Inventories23:302.457M

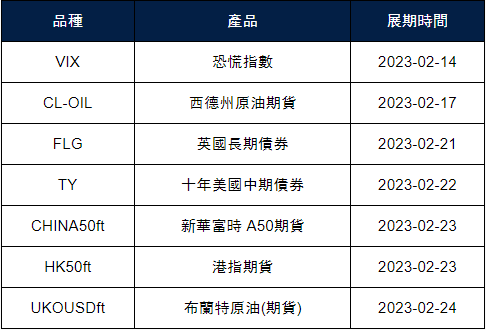
February Futures Rollover Announcement – February 08, 2023

Dear Client,

The new futures rollover dates are listed in the table below.

Please note:

• The rollover will be done automatically. All existing positions will remain open.

• Positions that are open on the expiration date will be adjusted via a rollover charge or credit to reflect the price difference between the expiring and new contracts.

• To avoid CFD rollovers, you can choose to close any open CFD positions prior to the expiration date.

• Please ensure that all take-profit and stop-loss settings are adjusted before the rollover occurs.

• All internal transfers for accounts under the same name will be prohibited during the first and last 30 minutes of the trading hours on the rollover dates.

Please contact our customer service team at [email protected] if you have any questions.

Strong US jobs data boosts economic transition optimism

US stocks declined lower on Monday, extending their previous slide, and continued to give back some of this year’s gains amid a dismal market mood. Hawkish Fed bets underpin the US Treasury bond yields and US Dollar, which exerted bearish pressure on equity markets. Meanwhile, traders are waiting to see if Jerome Powell will dampen the bullish reaction to his recent remarks as the Federal Reserve keeps its firm grip on policy. Policymakers from the US appear optimistic about the economic transition after witnessing strong United States employment and activity data on Friday.

On top of that, the political tensions between US and China weighed on the market mood, further fueling demand for the safe-haven US Dollar. On the Eurozone front, European Central Bank (ECB) ’s Robert Holtzmann said that monetary policy must continue to show its teeth until we see a credible convergence to our inflation target.

The benchmarks, S&P 500 and Dow Jones Industrial Average both declined lower on Monday as the S&P 500 remained under pressure as China-linked fears join fresh hawkish concerns over Fed. The S&P 500 was down 0.6% daily and the Dow Jones Industrial Average also dropped slightly with a 0.1% loss for the day.

Nine out of eleven sectors in the S&P 500 stayed in negative territory as the Communication Services sector and the Information Technology sector are the worst performing among all groups, losing 1.31% and 1.22%, respectively. The Nasdaq 100 meanwhile retreated the most with a 0.9% loss on Monday and the MSCI World index was down 1.1% for the day.

Main Pairs Movement

The US dollar advanced higher on Monday, extending its last Friday rally, and climbed to fresh February highs against most major rivals near the 103.70 level amid a risk-averse environment. The upbeat economic report from the US fueled speculation that the US Federal Reserve (Fed) will keep tightening its monetary policy while chances of a rate cut by year-end decreased sharply. Further fueling the dismal mood were mounting tensions between the United States and China.

GBP/USD declined lower on Monday with a 0.31% loss after the cable preserved downside traction and refreshed its daily low below the 1.2020 mark amid a dismal market mood. On the UK front, the Bank of England Chief Economist Huw Pill said that UK policymakers are prepared to do more to get inflation back to target. Meanwhile, EUR/USD also stumbled to multi-week lows at around the 1.0720 area amid US Dollar strength. The pair was down almost 0.65% for the day.

Gold advanced slightly with a 0.13% gain for the day after rebounding from a one-month low at $1864 during the US trading session, but the recent hawkish bias over the Fed’s next move should keep the Gold sellers hopeful. Meanwhile, WTI Oil rebounded higher with a 1.42% gain for the day. WTI posted a modest intraday advance and settled at $74.30.

Technical Analysis

EURUSD (4-Hour Chart)

The EURUSD came under renewed bearish pressure and declined to its lowest level in nearly a month below 1.0737 as of writing. The risk-averse market environment, as reflected by the sharp decline seen in Wall Street’s main indexes, provides a boost to the US Dollar and weighs on the pair. Risk aversion dominates financial markets at the beginning of the new week, pushing the US Dollar further up across the FX board. The upbeat January Nonfarm Payrolls report showed that the US added 517K new job positions in the month, more than doubling expectations, while the Unemployment Rate contracted to 3.4%, despite an increase in the Labor Force Participation Rate to 62.4%. The mounting speculation that the US Federal Reserve will continue to hike rates in the upcoming months not only diminished the chances of a rate cut by year-end, but pressured the EURUSD pair.

From the technical perspective, the four-hour scale RSI indicator figured 28 as of writing, suggesting that the pair was under heavy selling pressure. As for the Bollinger Bands, the pair is pricing below the 20-period moving average and the gap between upper and lower bands became larger, indicating that the pair would move in a volatile path.

Resistance: 1.0930, 1.1022

Support: 1.0714, 1.0662, 1.0508

GBPUSD (4-Hour Chart)

GBPUSD lost upside traction and turned south on the day and was pricing around 1.2009 as of writing. With major indexes opening deep in the red on Monday, the US Dollar continues to gather strength against its rivals and forces the pair to stay on the back foot. Last Friday, the US Nonfarm Payrolls rose by 517K in January, compared to the market expectation of 185K, and the Unemployment Rate declined to 3.4% from 3.5% in December. The impressive job report forced investors to reassess the probability of one more 25 basis points Federal Reserve rate hike in May and helped the US Dollar outperform its rivals. At the same time, the benchmark 10-year US Treasury bond yield climbed toward 3.6, further boosting the greenback.

From the technical perspective, the four-hour scale indicator RSI indicator figured 25 at the time of writing, suggesting that investors should be aware of a corrective rebound while the market was amid a strong oversold mood.  As for the Bollinger Bands, the pair was pricing along with the lower band and the gap size got wider, indicating that the strong selling pressure would persist for a while.

Resistance: 1.2265, 1.2401, 1.2493

Support: 1.1924, 1.1859

XAUUSD (4-Hour Chart)

Gold price remains under selling pressure on Monday. Earlier in the European trading session, the Gold price peaked at $1,881.30, and the price resumed to decline amid the broad US Dollar demand from then. The US dollar extends its post-NFP advance on the speculation that the Fed will keep hiking rates for some time, while the chances for a year-end rate cut are reduced. The US dollar index is currently placed at 103.68,  while the benchmark 10-year US Treasury bond yield rose 3.06% to 3.634%, weighing on Gold price. At the time of writing, the pair is trading at $1,867.43, posting a 0.09% gain daily.

For the technical aspect, the RSI indicator is 32 figures as of writing, hovering around 30 as the price remains under selling pressure in the near term. As for the Bollinger Bands, the price is moving between the downward moving average and the lower band. The bearish trend could persist. On the other hand, the wide-separated bandwidth shows the huge volatility of Gold price may be. Traders should be aware of the upside correction risk. In conclusion, we think the market is in bearish mode as both indicators show bearish potential. A failure to defend the critical support at $1,900 suggests that the bulls have surrendered. The price is currently holding above support at  $1,860, which seems unstable for now. If the price drops below the current support, it may trigger some technical selling and drag the price deeper.

Resistance: 1900, 1920, 1957

Support: 1860, 1830, 1800

Economic Data

CurrencyDataTime (GMT + 8)Forecast
AUDRBA Interest Rate Decision (Feb)11:303.35%
AUDRBA Rate Statement11:30 

VT Markets partners up with investfox – a leading FX broker rating platform

VT Markets and investfox have formed a strategic partnership with a goal to deliver a better experience for traders and investors in the financial market. VT Markets is committed to providing its clients with a full range of trading products and services that meet their diverse needs, including currencies, stocks, commodities, metals, energies, and indices. The company’s key objective is to constantly strive for improved customer satisfaction through low trading fees, top-notch platforms, and professional customer support.

On the other hand, investfox is an educational platform designed to make it easier for readers to choose the best brokers. The website offers a variety of resources for both beginner and advanced traders, including trading guides, articles on cryptocurrency, financial news, and comparisons of various brokerages. It places a strong emphasis on the safety and security of traders’ capital and offers in-depth reviews of brokers based on several key factors, such as safety and regulations, trading instruments, fees, customer support, and more.

The partnership between VT Markets and investfox aims to create a mutually beneficial relationship that will lead to increased success for both companies. investfox will benefit from increased visibility and a wider audience, while VT Markets will have access to investfox’s highly engaged user base. The two companies are confident that the partnership will bring more traders to VT Markets and create more value for readers of investfox.

The VT Markets review by investfox is expected to be published soon, and traders and investors are advised to stay tuned for updates.

About the Company:

VT Markets is a regulated multi-asset broker with a presence in over 160 countries. The broker has won many international accolades including Best Customer Service and Fastest Growing Broker. Its mission is to make trading an easy, accessible, and seamless experience for everyone. Website: www.vtmarkets.com   

Back To Top
server

Hello there 👋

How can I help you?

Chat with our team instantly

Live Chat

Start a live conversation through...

  • Telegram
    hold On hold
  • Coming Soon...

Hello there 👋

How can I help you?

telegram

Scan the QR code with your smartphone to start a chat with us, or click here.

Don’t have the Telegram App or Desktop installed? Use Web Telegram instead.

QR code