Fed officials considering 50bps interest rate hike

US stocks dropped sharply on Thursday, coming under intense selling pressure, and closed firmly in the red after two Federal Reserve officials said they were considering 50 basis-point interest rate hikes to battle persistently high inflation. The firmer US data that allows the Fed policymakers to remain hawkish lend support to the US dollar and weighed heavily on the equity markets. On Thursday, St. Louis Federal Reserve’s James Bullard and Cleveland Fed President Loretta Mester both embraced more significant hikes as they said that continued policy rate increases can help lock in a disinflationary trend during 2023 and would not rule out supporting a half-percentage-point increase at the Fed’s March meeting. On top of that, the US Producer Price Index (PPI) for January gained major attention as it jumped the most since June with a 0.7% MoM figure, reviving speculation the US Federal Reserve will maintain the pace of tightening for more than anticipated. On the Eurozone front, ECB’s monthly bulletin said that future policy rate decisions will continue to be data-dependent and follow a meeting-by-meeting approach.

The benchmarks, S&P 500 and Dow Jones Industrial Average both declined lower on Thursday as the S&P 500 suffered from daily losses after the US Dollar reached fresh weekly peaks. The S&P 500 was down 1.4% daily and the Dow Jones Industrial Average also retreated lower with a 1.3% loss for the day. All eleven sectors in S&P 500 stayed in negative territory as the Consumer Discretionary sector and the Information Technology sector is the worst performing among all groups, losing 2.16% and 1.75%, respectively. The Nasdaq 100 meanwhile dropped the most with a 1.9% loss on Thursday and the MSCI World index was little changed for the day.

Main Pairs Movement

The US dollar edged higher on Thursday, refreshing its weekly peaks against most major rivals near the 104.20 level but gave back some ground ahead of the Wall Street close amid the downbeat market mood. The US Producer Price Index (PPI) bolsters hawkish Federal Reserve bets and fuels US Treasury bond yields. The latest FEDWATCH read from Reuters also signals that the interest rate futures market shows US rates could peak close to 5.25% by July.

GBP/USD declined lower on Thursday with a 0.31% loss after the cable extended its downside momentum and touched a daily low below the 1.1970 mark amid the higher-than-expected US PPI data. On the UK front, the softer UK CPI reflected that the Bank of England would not need to tighten monetary conditions aggressively. Meanwhile, EUR/USD also witnessed selling interest and dropped to a daily low below the 1.0660 area. The pair was down almost 0.14% for the day.

Gold was little changed with a 0.02% gain for the day after regaining some upside traction and rebounded from the $1828 area during the US trading session, as the higher US PPI and renew hawkish bias for the Federal Reserve continued to exert bearish pressure to the Gold price. Meanwhile, WTI Oil retreated lower with a 0.13% loss for the day.

Technical Analysis

EURUSD (4-Hour Chart)

The EURUSD came under modest bearish pressure and stayed below 1.0700 during the US trading session on Thursday. The pair confronted another selling pressure after US Producer Prices rose more than expected a monthly 0.7% in January and 6.0% from a year earlier. Still, on the strong side, weekly Initial Claims increased by 194K in the week of February 11, showing once again the persistent good health of the labor market. Moreover, Cleveland Fed and well-known hawk L.Mester reiterated that inflation remains too high at the time when she noted that the current Fed’s tightening cycle should slow growth and increase unemployment.

From a technical perspective, the four-hour scale RSI indicator remained neutral at 43 figured as of writing, suggesting that the pair was surrounded by modest negative traction. As for the Bollinger Bands, the pair was supported by the lower band and the pair touched the lower bands three times, showing this is a critical support level for the near term. As a result, we think the bears could put their eyes on the 1.0510 level once the EURUSD fell below the 1.0656 support level.

Resistance: 1.0930, 1.1020

Support: 1.0656, 1.0508

XAUUSD (4-Hour Chart)

The XAUUSD extended its bearish route and dropped to a fresh February low of $1827 marks after the release of US macroeconomic data. Currently, the US Dollar remained its upside tendency and earned modest growth daily. The US labor market remains tight, while there were more signs of inflation easing at a slower-than-anticipated pace. The January Producer Price Index (PPI) rose at an annualized pace of 6%, easing from 6.5% in December but missing the 5.4% anticipated by financial markets. Following the report, Federal Reserve Loretta Mester said that inflation remains too high and with the risks skewed to the upside, hinting the terminal rate could be well above 5%.

From a technical perspective, the four-hour scale RSI indicator figured 44 as of writing, showing the gold pair was surrounded by a modest headwind. As for the Bollinger Bands, the pair continued to trade in the lower area and failed to challenge the 20-period moving average several times. In our view, the downside tendency would persist in the near future unless the pair could stand firmly in the upper area.

Resistance: 1870, 1900, 1920

Support: 1830, 1800

Economic Data

CurrencyDataTime (GMT + 8)Forecast
  GBPRetail Sales (MoM) (Jan)15:00-0.30%

Trade 5 New Currency Pairs With VT Markets – February 17, 2023

Dear Client,

To provide you with more diverse trading options, VT Markets will launch 5 new products on 20th February 2023.

You can now trade the world’s popular products on MetaTrader 4 and 5 with the following specifications:

The above data is for reference only, please refer to the MT4 and MT5 platforms for the updated data.

For more information, please contact [email protected]

Notification of Server Upgrade – February 16, 2023

Dear Client,

As part of our commitment to provide the most reliable service to our clients, there will be server maintenance this weekend.

Maintenance Hours :
2023/02/18 02:00 – 05:00 (Server time)

Please note that the following aspects might be affected during the maintenance:

1. The price quote feature on the Client Portal will be temporarily unavailable. You will not be able to open new positions or close existing positions.

2. There might be a gap between the original price and the price after maintenance. The gaps between Pending Orders, Stop Loss, and Take Profit will be filled at the market price once the maintenance is completed.

3. Please refer to MT4/MT5 for the latest update on the completion and market opening time.

Our services will be back online once the maintenance is completed.

Thank you for your patience and understanding about this important initiative.

If you’d like more information, please don’t hesitate to [email protected]

VT Markets Announces Partnership with Acuity’s Signal Centre

VT Markets, a next-generation multi-asset broker, has announced the integration of Acuity’s Signal Centre into its platform. This new collaboration will enable VT Markets clients to benefit from the advanced artificial intelligence (AI) technology, superior design, and multilingual capabilities that Signal Centre offers.

Acquired by Acuity in 2021, Signal Centre’s Analysis IQ provides users with an experienced trading professionals’ technical view of the markets based on the intraday timeframe. Ideas are delivered by combining traditional and alternative data sets. The platform’s AI-powered approach ensures a holistic analysis of current market conditions to assist with decision-making. This combination of human-led insights with AI technology enables traders to make better-informed decisions more efficiently.

The addition of Acuity’s Signal Centre represents a significant milestone for VT Markets as it continues its mission to provide its clients with the best-in-class services and solutions available in the industry today. With this advanced technology now integrated into the VT Markets platform, clients can leverage unprecedented insights into their financial portfolios and make smarter decisions when it comes to trading any asset class they choose. 

Speaking about this partnership, a representative of VT Markets said, “We are thrilled to be able to bring this advanced technology solution to our clients to help them achieve their investment goals. Acuity’s Signal Centre is an incredibly powerful tool that will enable our clients to access sophisticated trade ideas from experienced professionals that can help them maximise their returns on investments through better decision-making.”

Andrew Lane, CEO Acuity Trading;

“We’re delighted that VT Markets has chosen to partner with Acuity Trading’s FCA authorised and regulated company Signal Centre. By integrating our AnalysisIQ platform into VT Markets’ global multi-asset brokerage, traders will be able to access high quality trading analysis, data and market expertise through powerful and intuitive visualisation tools.”

With this new partnership with Signal Centre, VT Markets has cemented itself as a major player in the trading industry. The fast-growing broker is committed to its mission to make trading easy and more accessible for everyone. 

About VT Markets

VT Markets is a regulated multi-asset broker with a presence in over 160 countries. The broker has won many international accolades including Best Customer Service and Fastest Growing Broker. Its mission is to make trading an easy, accessible, and seamless experience for everyone.

For more information, please visit www.vtmarkets.com or email to [email protected] 

About Acuity Trading

Acuity Trading revolutionised the online trading experience for millions of investors with the introduction of visual news and sentiment tools in 2013. Today, Acuity continues to lead the fintech market with alpha generating alternative data and highly engaging trading tools using the latest in AI research and technology. Acuity’s team of academics, scientists, news and market professionals are dedicated to delivering highly effective data products that bring value to investors of all levels and experience. Flexible delivery options include APIs, MT4/5, plug and play widgets and third party automation services. 

For further information or to request a demo, please visit www.acuitytrading.com or contact:

Meredyth Grant

Email:[email protected] 

Tel: +44 (0) 7496 725286

Follow Acuity Trading on social: 

Twitter: @acuitytrading

LinkedIn: https://www.linkedin.com/company/acuity-trading

Facebook: https://www.facebook.com/acuitytradingltd/

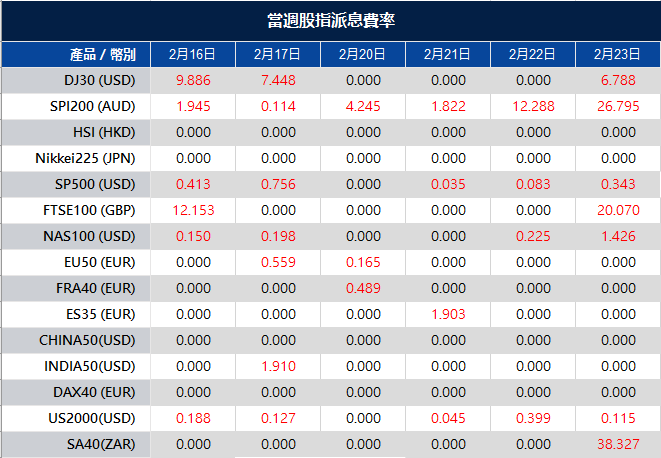
Weekly Dividend Adjustment Notice – February 16, 2023

Dear Client,

Please note that the dividends of the following products will be adjusted accordingly. Index dividends will be executed separately through a balance statement directly to your trading account, and the comment will be in the following format “Div & Product Name & Net Volume ”.

Please refer to the table below for more details:

The above data is for reference only, please refer to the MT4/MT5 software for specific data.

If you’d like more information, please don’t hesitate to contact [email protected]

US Retail Sales jump the most in two years

US stocks closed higher and Treasuries slid as investors picked through another batch of solid economic data to find different takeaways, even as worries mounted that it would force a hawkish response from the Federal Reserve.

The S&P 500 rose 0.3% after earlier dropping more than 0.75%. The Nasdaq 100 climbed 0.8%. Two-year Treasury yields held near 4.60%. The dollar advanced versus major peers.

US retail sales in January jumped by the most in almost two years, suggesting that solid consumer spending will keep prices elevated and increase pressure on the Fed to step up its efforts to tamp down inflation. Homebuilder sentiment rose in February by the most since mid-2020, as easing mortgage rates have boosted the housing market.

The energy was a drag on the broader market, falling 2%, driven by a slump in Devon Energy pressured by a slump in oil prices following a much larger-than-expected build in U.S. weekly crude stockpiles.

U.S. crude stockpiles rose by 16.3 million barrels last week to 471.4M barrels, well above expectations of 1.2M barrels.

Main Pairs Movement

The US Dollar firmed mid-week to a six-week high against a basket of currencies measured by the DXY index. The index has penetrated a key 103.80 level on the charts amid risks of higher inflation for longer and the markets flipping the script of the Federal Reserve pivot narrative. The index maintains erratic activity around 103.00 so far. The monthly high near 104.00 continues to cap the upside. At the time of writing, the price is trading at 103.754.

AUD/USD stands on slippery grounds as sellers rush towards the weekly low of 0.6864, marked the previous day, following a nearly 40 pips slump on the downbeat Australia inflation and employment numbers. At the time of writing, the price is trading at 0.6888.

GBP/USD continued to move lower in the second half of the day, falling below 1.2000 for the first time in a week before recovering slightly. Weak U.K. inflation data and broad-based dollar strength weighed heavily on the pair on Wednesday. At the time of writing, the price traded at 1.20389.

Technical Analysis

EURUSD (4-Hour Chart)

The EURUSD has extended its daily slide and further declined below the 1.067 level as of writing, as the US Retail Sales data rose at a stronger pace than expected in January, boosting the US Dollar and weighing on the pair. The US core retail sales surged to 2.3%, compared to the expected 0.8% and previous -0.9%, showing strong demand in the retail market. The euro price action around the European currency should continue to closely follow dollar dynamics, as well as the potential next moves from the ECB after the bank has already anticipated another 50 bps rate raise at the March event.

From the technical perspective, the four-hour scale RSI indicator further dropped to 38 figures as of writing, suggesting that the pair was surrounded by strong bearish momentum. As for the Bollinger Bands, the pair fell below the 20-period moving average and was trading in the lower area, showing an optimistic market mood. Currently, the pair were struggling to hold above a critical support level, 1.0667. The bears could target on 1.050 level once the pair lose its ground around the key support level.

Resistance: 1.0930, 1.1020

Support: 1.0667, 1.0508

GBPUSD (4-Hour Chart)

The GBPUSD continued to push lower in the American trading session and dropped below 1.2000 for the first time in a week before recovering modestly. Soft UK inflation data and the strong US dollar across the board heavily weighed on the pair. The UK’s Office for National Statistics reported on Wednesday that the Consumer Price Index declined 0.6% every month in January, causing the annual rate to retreat to 10.1% from 10.5%. The Core CPI also edged lower to 5.8% from 6.3% every year coming in lower than the market expectation of 6.2%. Although it’s too early to say how these figures could influence the Bank of England (BoE) policy outlook, the reaction suggests that markets have scaled back hawkish BoE bets.

From the technical perspective, the four-hour scale RSI indicator tumbled to 34 figures as of writing, showing the pair is amid negative traction. As for the Bollinger Bands, the pair was supported by the lower band and the size between the upper and lower bands got larger, indicating there might be a further decline once the pair fell below the lower band.

Resistance: 1.2209, 1.2265, 1.2391

Support: 1.1927, 1.1859

XAUUSD (4-Hour Chart)

Gold price dropped sharply towards $1,830 on Wednesday as the US dollar regather strength and the benchmark 10-year US Treasury bond yield keeps rallying, which exerted heavy pressure on Gold prices. At the time of writing, the pair is trading at $1,837.59, posting a 0.87% loss daily, while the US dollar index rose 0.57% to 103.86 and the benchmark 10-year US Treasury bond yield rose 1.49% to 3.803%, capping any rebound on Gold price.

For the technical aspect, RSI indicator 35 figures as of writing, keeps going South as the price continues on its downward movement in the near term. As for the Bollinger Bands, the price is falling between the downward moving average and the lower band, which is a typical pattern of a downtrend. A continued bearish trend could be expected. In conclusion, we think the market is in bearish mode as both indicators show bearish potential. Besides, the price is edging lower and keeps forming a lower-low technical pattern, which favors the bearish side. For the downtrend scenario, the price is testing the support level at $1,830. If the price is below the level, it may trigger some technical selling and drag the price deeper toward the next critical support at a round-figure mark of $1,800.

Resistance: 1900, 1920, 1957

Support: 1830, 1800

Economic Data

CurrencyDataTime (GMT + 8)Forecast
AUDEmployment Change (Jan)08:3020.0K
USDBuilding Permits (Jan)21:301.350M
USDInitial Jobless Claims21:30200K
USDPhiladelphia Fed Manufacturing Index (Feb)21:30-7.4
USDPPI (MoM) (Jan)21:300.40%

Trade US CFD Shares with 1:33 leverage – February 15, 2023

Dear Client,

To provide you with a better trading condition, VT Markets will increase the leverage for US CFD Shares on 20 February 2023.

The above data is for reference only, please refer to the MT4/MT5 software for specific data.

Please note:

1. Other contract specifications will remain the same as before.

2. Clients can continue to hold their open positions during the optimisation.

3. This optimisation might affect the margin level. Please ensure you have enough funds in your account to cover any additional margin requirements.

If you’d like more information, please don’t hesitate to contact [email protected].

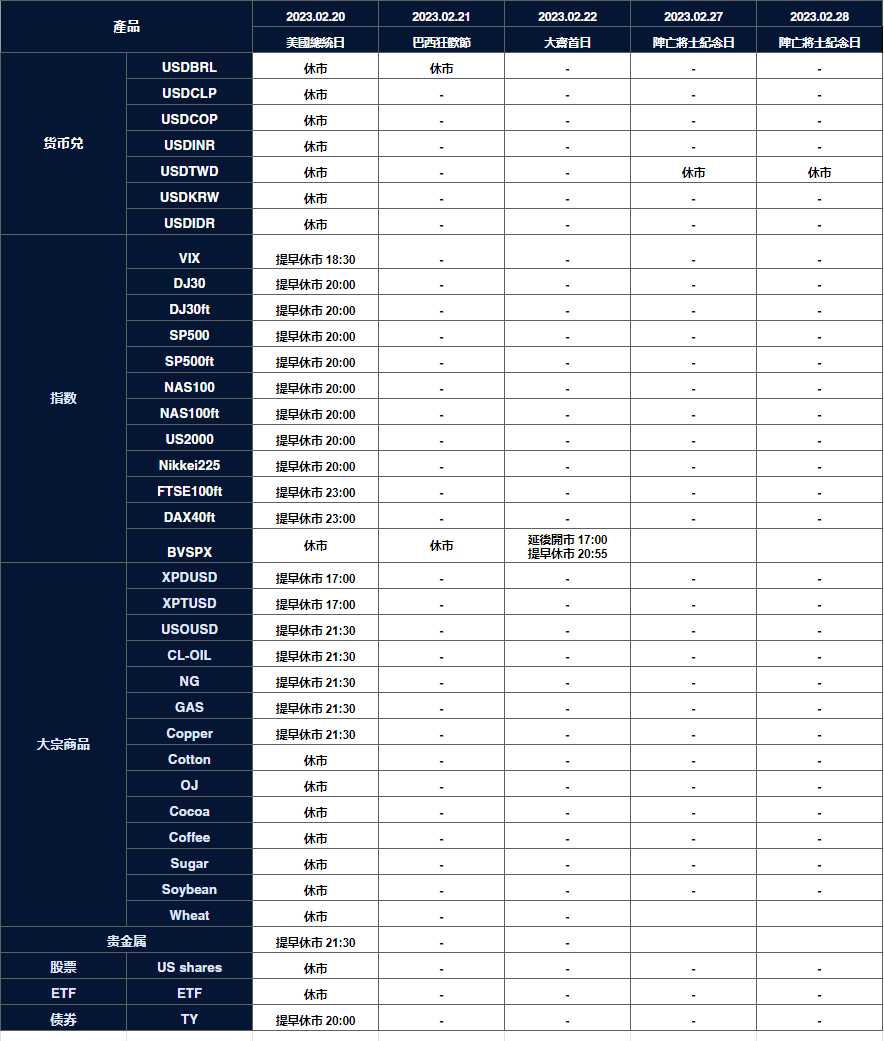
Changes in trading hours for upcoming holidays – February 15, 2023

Dear Client,

Please note that the following instruments’ trading hours will be affected by the upcoming holidays.

Note: The dash sign (-) indicates normal trading hours.

The above data is for reference only, please refer to the MT4/MT5 software for specific data.

If you’d like more information, please don’t hesitate to contact [email protected]

US annual inflation data released at 6.4%

The Dow closed lower Tuesday, as investors digested the latest data showing signs of cooling, but stickier inflation that triggered a jump in Treasury yields on bets for a more aggressive Federal Reserve. The Dow Jones Industrial Average fell 0.46% or 156 points, the Nasdaq was up 0.57%, and the S&P 500 was flat.

The consumer price index rose 0.5% last month, in line with expectations, but for the 12 months through January was 6.4%, above expectations of 6.2%. Core inflation, which strips out energy and food prices, slowed to an annualized pace of 5.6% in January, though that was smaller than the expected decrease of 5.5%.

Stocks in Asia are primed for a cautious open after a choppy day on Wall Street ended flat as investors balanced hot inflation data with Federal Reserve commentary suggesting US interest rates may soon peak.

Shares in Australia fell and equity futures in Japan and Hong Kong inched higher. US futures edged lower in early Asian trading. The S&P 500 ended Tuesday little changed while the tech-heavy Nasdaq 100, which is more sensitive to higher interest rates, rose 0.7%.

Main Pairs Movement

US DXY gauges the greenback versus a basket of its main competitors, try to regain some composure, and leaves behind earlier lows in the lower 103.0 regions on turnaround Tuesday. The dollar was largely unchanged based on the US core CPI (MoM, Jan) figure fits market expectations with a 0.4% rise, CPI (YoY, Jan) 6.4% with 0.2% higher than forecast, and CPI (MoM, Jan) 0.5%.

At the time of writing, the price traded at 103.269, twenty minutes before the trading session closing.

Although the Fed hawks joined the technical breakdown to tease the Gold bears, the metal’s further downside hinges on how well the scheduled United States data can entertain the XAU/USD sellers. Among them, US Retail Sales for January, expected at 1.8% versus -1.1% prior, will be closely watched for clear directions. Should the data management reverse the previous monthly contraction, the odds of witnessing further XAU/USD downside can’t be ruled out. At the time of writing, the price traded at 1853.91.

WTI oil bears seek a break of $79.00 to open the floodgates. US crude prices are adding to earlier declines, falling after the US consumer price index data and during the Wall Street cash open. At the time of writing, the US oil price traded at 78.837.

Technical Analysis

EURUSD (4-Hour Chart)

The EURUSD erased most of its daily gains and began to turn south after reaching a daily high of 1.0800 level, as investors continued to react to the US Consumer Price Index report. The pair lost its upside momentum following US CPI rose at an annualized 6.4% in January and 5.6% when it comes to the Core CPI, higher than the expected 6.2% and 5.5% respectively. Moreover, the Dallas Federal Reserve President Lorie Logan said, “We must remain prepared to continue rate increases for a longer period than previously anticipated, if such a path is necessary to respond to changes in the economic outlook or to offset any undesired easing in conditions,” which managed to provide a boost for US Dollar, in turn, undermining the pair.

From the technical perspective, the four-hour scale RSI indicator slid back to the neutral area, suggesting that the upbeat market mood has faded. As for the Bollinger Bands, the pair was priced in the upper area and supported by a 20-period moving average, showing that the EURUSD currently has no clear direction to move and investors would carefully reassess the future path.

Resistance: 1.0930, 1.1020

Support: 1.0666, 1.0508

GBPUSD (4-Hour Chart)

The GBPUSD dropped dramatically in American trading hours following the release of inflation data in the United States. US CPI cooled on an annual basis but was higher than forecasts US inflation reported by the Department of Labor (DoL) showed that the Consumer Price Index (CPI) for January rose by 6.4% YoY, above estimates of 6.2%, while core CPI jumped to 5.6% YoY, against data estimated at 5.5%. Monthly basis regardings were in line with estimates. After the data release, US Treasury bond yields advanced, with the US 2-year Treasury bond yield edging towards 4.622%, as an initial reaction to the data, which warrants further tightening by the US Federal Reserve (Fed). Domestic, according to Reuters, wages in Britain grew quickly in the last quarter of 2022, keeping the Bank of England (BoE) pressured.

From the technical perspective, the four-hour scale RSI indicator slightly fell to 59 figures as of writing, suggesting that the pair was surrounded by strong positive traction. As for the Bollinger Bands, the pair kept trading in the upper area and the gap size tend to be larger, showing the GBPUSD was more favored to the upside path.

Resistance: 1.2265, 1.2391, 1.2492

Support: 1.1927, 1.1859

XAUUSD (4-Hour Chart)

The gold price tumbled to a fresh monthly low at $1843.36 for the first time since January after Wall Street’s opening and following the US Consumer Price Index (CPI) release. According to the US Bureau of Labor Statistics, the CPI rose by 6.4% every year in January, easing from 6.5% previous but higher than the 6.2% expected. The core CPI rose by 5.6% every year, also easing from the previous but higher than expectations. On the upside, inflationary pressures continue to ease but not enough to take the Fed away from its tightening path. At the time of writing, the pair is trading at $1,855.93, posting a 0.12% gain daily, while the benchmark 10-year US Treasury bond yield rose 1.57% to 3.765%, exerting selling pressure on Gold price.

For the technical aspect, RSI indicator 42 figures as of writing, maintaining around selling region as the price keeps moving under selling pressure in the near term. As for the Bollinger Bands, the price is hovering between the downward moving average and the lower band. The bearish trend should persist. In conclusion, we think the market is in bearish mode as both indicators show bearish potential. Besides, the price is edging lower and keeps forming a lower-low technical pattern, which favors the bearish side. For the downtrend scenario, the next support level is $1,830. If the price close below the level, it may trigger some technical selling and drag the price deeper.

Resistance: 1900, 1920, 1957

Support: 1830, 1800

Economic Data

CurrencyDataTime (GMT + 8)Forecast
GBPCPI (YoY) (Jan)15:0010.3%
USDCore Retail Sales (MoM) (Jan)21:300.8%
USDRetail Sales (MoM) (Jan)21:301.8%
EURECB President Lagarde Speaks22:00 
USDCrude Oil Inventories23:301.166M

VT Markets Appoints Ludovic Moncla as Head of Affiliates

VT Markets, a next-generation multi-asset broker, has announced the appointment of Ludovic Moncla as the Head of Affiliates. Moncla has over 10 years of experience in the international financial services industry and will be tasked with spearheading the affiliate business of VT Markets.

Throughout his career, Moncla served as an Affiliate Manager, Business Development Manager and Head of Sales for different finance companies. With linguistic capabilities spanning French, English, Greek and Spanish, Moncla is adept at driving cross-selling initiatives while recruiting affiliates with ease.

Moncla most recently held the position of Head of Affiliation at JFD Bank. During his tenure, he was responsible for overseeing all affiliate marketing activities of the brokerage. This included developing strategies for new campaigns and managing existing ones, as well as expanding their reach by introducing innovative products and services.

At VT Markets, Moncla will have full responsibility for its thriving affiliate business. He will be looking to create strong partnerships with global affiliates and introduce new products that will help drive customer growth and loyalty. Additionally, Moncla will be responsible for driving innovation in the affiliate space by leveraging data insights from VT Markets’ large client base. The appointment of Moncla is another example of VT Markets’ commitment to putting clients first by bringing on board experienced professionals who can develop world-class solutions to meet their needs.

Commenting on his appointment, Moncla said, “I am thrilled to join VT Markets, a fast-growing company that is leading the industry with its innovative and dynamic approach. With multiple offices and licenses, VT Markets is well-positioned for continued growth and success. As a young company, VT Markets brings a fresh perspective to the industry, and its business model is aligned with my personal goals. I am excited to be a part of this dynamic and forward-thinking team and to contribute to the company’s expansion goals.”

Welcoming Moncla to the company, Managing Director of VT Markets said, “We are proud that Ludovic has joined our team as the Head of Affiliates. With his extensive knowledge and passion for this space, we are sure that he will continue building upon our success and help us reach new heights”.

About the Company:

VT Markets is a regulated multi-asset broker with a presence in over 160 countries. The broker has won many international accolades including Best Customer Service and Fastest Growing Broker. Its mission is to make trading an easy, accessible, and seamless experience for everyone.

Back To Top
server

Hello there 👋

How can I help you?

Chat with our team instantly

Live Chat

Start a live conversation through...

  • Telegram
    hold On hold
  • Coming Soon...

Hello there 👋

How can I help you?

telegram

Scan the QR code with your smartphone to start a chat with us, or click here.

Don’t have the Telegram App or Desktop installed? Use Web Telegram instead.

QR code