South Korea’s Consumer Price Index rose 2.2% year on year in March.
This was below the forecast of 2.4%.
Inflation Near Target Opens Door To Earlier Rate Cut
With inflation coming in at 2.2%, below expectations, the data strengthens the case for the Bank of Korea to consider an earlier interest rate cut. This figure is now remarkably close to the central bank’s 2.0% target, giving them more room to pivot towards a more accommodative policy. We believe this fundamentally changes the outlook for Korean assets in the near term.
This softening inflation print likely puts a definitive end to the BOK’s rate hiking cycle, which has held the base rate at 3.50% for more than a year. The market will now begin to price in a rate cut for the third quarter of this year, a shift from previous expectations of a hold until year-end. We will be closely watching the BOK’s next statement for any dovish language changes.
Given the prospect of lower interest rates, we anticipate weakness in the Korean Won. A widening interest rate differential with the United States makes the currency less attractive for carry trades. We are therefore considering long positions in USD/KRW, targeting a move back towards the 1,380 level.
The expectation of a BOK policy shift should put downward pressure on local bond yields, causing their prices to rise. We see an opportunity in going long on Korean Treasury Bond (KTB) futures, particularly in the 3-year tenor which is most sensitive to monetary policy changes. This trade is a direct play on the market repricing for an earlier-than-expected rate cut.
Lower borrowing costs are a positive catalyst for the South Korean stock market. The KOSPI 200 index, which has seen strong performance from semiconductor and technology companies, could see another boost from this news. We are positioning for this by looking at KOSPI 200 call options or index futures.
Implications For Markets And Policy Path
Looking back, the cautious optimism of 2025 was always tempered by fears of persistent inflation, which kept the BOK on hold. This March 2026 data serves as a clear signal that the disinflationary trend is now firmly in place. This contrasts with the economic uncertainty we saw throughout much of last year and provides a much clearer path for monetary easing.
Create your live VT Markets account and start trading now.
Start trading now – Click here to create your real VT Markets account
South Korea’s Consumer Price Index (CPI) rose 0.3% month on month in March.
This was below the forecast of 0.6% for the same period.
The lower-than-expected March inflation reading of 0.3% month-over-month suggests price pressures are easing faster than anticipated. This significantly reduces the likelihood that the Bank of Korea (BOK) will raise interest rates in the near future. Consequently, market expectations are now shifting towards a more dovish monetary policy stance.
This is not an isolated event, as it follows a broader trend of slowing price growth seen in recent months. For instance, South Korea’s producer price index growth slowed to a 26-month low in February 2026, confirming that inflationary pressures are weakening at the source. This pattern gives the BOK more room to prioritize economic growth over fighting inflation.
For currency traders, this outlook weakens the Korean Won against the US dollar. We should consider buying call options on the USD/KRW pair to profit from a potential rise in the coming weeks. These positions offer an upside if the BOK signals a rate cut in its upcoming meetings, while limiting downside risk.
We see this environment as supportive for South Korean equities, as lower interest rate expectations reduce borrowing costs for companies. A dovish pivot could boost stock valuations, making long positions on KOSPI 200 futures an attractive strategy. This is especially true as the index has gained over 4% in the first quarter of 2026, showing underlying strength.
In the rates market, positioning for lower short-term yields through Korean Treasury Bond futures appears prudent. Looking back, we remember the BOK’s firm, rate-hiking stance throughout much of 2025 when inflation was the primary global concern. The recent data marks a clear shift from that period, suggesting the interest rate cycle has turned.
Start trading now – Click here to create your real VT Markets account
South Korea’s consumer price index (CPI) rose by 0.3% month-on-month in March. This was below the forecast of 0.6%.
The March outcome was 0.3 percentage points under the expected rate. The data shows slower monthly inflation than predicted.
The March inflation data came in much cooler than anyone expected. At 0.3% month-over-month, it’s half the forecast, suggesting price pressures are easing much faster than we thought. This gives the Bank of Korea significant room to pivot from its firm stance and could bring forward discussions of an interest rate cut later this year.
We’re already seeing the impact in the bond market, where the 3-year Korean Treasury Bond yield has dropped 15 basis points to 3.30% in early trading today. This points to a clear opportunity to go long on Korean Treasury Bond (KTB) futures, anticipating that yields will continue to fall on dovish sentiment. Similarly, traders should consider receiving the fixed rate on Korean Won interest rate swaps.
This lower rate outlook for Korea makes the won less attractive, especially as the US Federal Reserve continues to signal it will hold rates steady. This development could be the catalyst that pushes the USD/KRW exchange rate back above the 1,400 level, a key psychological barrier. Therefore, buying call options on USD/KRW is a sensible strategy to position for further won weakness in the coming weeks.
For the stock market, the prospect of lower borrowing costs is a bullish signal. After the BOK prioritized stability and held rates steady through most of 2025, this shift towards potential easing could unlock corporate investment and boost sentiment. Traders should look at buying call options on the KOSPI 200 index, as equities become more attractive than bonds in this environment.
Start trading now – Click here to create your real VT Markets account
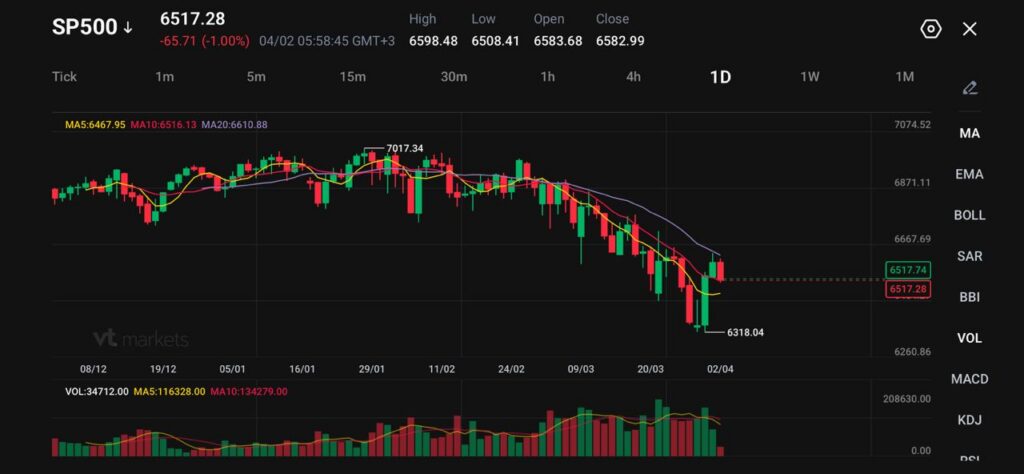
S&P 500 futures fell 1%, while the cash index in your chart trades at 6517.28, down 65.71 (-1.00%).
Brent rose about 5% to $106.16 a barrel after Trump gave no clear signal on when the Strait of Hormuz might reopen.
The US dollar index rose 0.3% to 99.858, while the euro slipped 0.25% to $1.156 as traders moved back into defensive positions.
Markets went back into defence after President Donald Trump said the US would hit Iran “extremely hard” within weeks and did not give traders the timeline they wanted for an end to the conflict.
Stocks fell and the dollar rose as markets stayed jittery after President Donald Trump warned the US would hit Iran “extremely hard” within two to three weeks, disappointing traders who had hoped for clearer signs of an end to the war https://t.co/V4XdV0DXX5
That shift matters for the S&P 500 because the rebound over the prior two sessions had relied on hopes that the war might wind down soon. Trump’s comments removed that support.
Traders started selling equities again because the market is still trying to price two things at once: higher energy costs and weaker growth. That combination is what keeps dragging the discussion back toward stagflation.
Five weeks into a Middle East war that’s sending shockwaves through the global economy, the US stock market has settled into a predictable pattern https://t.co/FkqCOTfglf
The market is no longer asking whether the conflict is serious. It is asking how long the energy disruption lasts and how much economic damage builds while it stays in place.
Oil Above $106 Reopens the Inflation Problem
The sharpest signal came from crude. Reuters reported that the front-month Brent contract rose about 5% to $106.16 per barrel after the speech failed to offer reassurance on the Strait of Hormuz. Our research desk believes the only thing that really matters is whether the Strait reopens soon, and Trump’s remarks did not suggest that would happen quickly.
For equities, that is the problem in one line. Expensive oil lifts inflation, squeezes margins, and cuts into consumer spending power. The S&P 500 can absorb a geopolitical shock for a while if energy stays contained. It struggles much more when crude moves back toward crisis levels and the market cannot see a clear reopening path for a major fuel artery.
That also explains why the earlier optimism faded so fast. A war can continue politically and still leave markets calm if oil routes function. Once supply routes stay impaired, the macro cost rises quickly.
Dollar Strength Tightens Conditions Again
The dollar also turned higher as traders moved back into the usual haven trade. Reuters reported that the dollar index rose 0.3% to 99.858 after falling nearly 1% over the prior two days on ceasefire optimism. The euro weakened 0.25% to $1.156.
Stocks fell and the dollar rose as markets stayed jittery after President Donald Trump warned the US would hit Iran “extremely hard” within two to three weeks, disappointing traders who had hoped for clearer signs of an end to the war https://t.co/V4XdV0DXX5
That adds another layer of pressure to the S&P 500. A firmer dollar tightens financial conditions and weighs on multinational earnings when overseas revenue is translated back into dollars. It also signals that traders are reducing risk rather than preparing to re-enter cyclicals and growth names.
When equities are already under pressure from higher yields and higher energy costs, a stronger dollar usually makes the rebound harder.
Technical Analysis
S&P 500 is trading near 6517, attempting a modest rebound after a sharp decline that pushed price down to the 6318 low. The broader structure remains under pressure following the rejection from the 7017 high, with price still struggling to regain upward momentum. Recent candles show a short-term bounce, but the recovery lacks strength, suggesting the move is more corrective than a true reversal.
From a technical standpoint, the trend remains bearish in the near term. Price is trading below the 10-day (6516) and 20-day (6610) moving averages, which are both sloping downward and acting as overhead resistance. The 5-day (6467) is beginning to turn higher, reflecting the current bounce, but this remains fragile unless price can reclaim higher levels. The broader structure continues to show lower highs and sustained selling pressure.
Key levels to watch:
Support: 6400 → 6318 → 6200
Resistance: 6520 → 6610 → 6700
The index is currently testing the 6515–6520 zone, which aligns closely with the 10-day average and is acting as immediate resistance. A sustained move above this level could open a recovery toward 6610, though stronger resistance is likely to emerge there.
On the downside, 6400 remains the first key support. A break below this level would expose the recent low at 6318, with further downside risk if selling resumes.
Overall, the S&P 500 remains in a short-term downtrend, with the current bounce showing limited conviction. Unless price can reclaim the 6610 area, rallies are likely to face resistance, keeping the bias tilted to the downside while the market works through this corrective phase.
What Traders Should Watch Next
The next move depends on oil, not speeches alone. Brent holding near $106.16, the status of the Strait of Hormuz, and the dollar’s reaction will drive the tone into the next session more than any single earnings or sector story. Both USD and oil should move higher while risk is shed, and that remains the cleanest way to frame the market right now.
A cautious path from here is clear. If crude stays high and the dollar keeps firming, the S&P 500 may struggle to recover more than a short relief bounce.
If oil falls back and the market sees real progress on shipping routes, the index can start rebuilding from the 6517 area toward resistance near 6610.
Why Did the S&P 500 Drop Again After Two Better Sessions?
The market had been hoping for a clearer end to the Iran conflict, but Trump’s speech offered no firm timeline and repeated threats to hit Iran “extremely hard” within weeks. That pushed traders back into defence and sent S&P 500 futures down 1%.
Why Are Oil Prices So Important for the S&P 500 Right Now?
Higher oil prices push up inflation, raise business costs, and squeeze consumer spending. Reuters reported Brent up about 5% to $106.16 a barrel after the speech, which brought the inflation problem back to the centre of equity pricing.
What is Driving Stagflation Fears in Markets?
Traders are now dealing with a weaker growth outlook amid high energy-driven inflation. That is the classic stagflation setup, and Reuters said Trump’s comments revived those concerns after the market had briefly hoped the war might wind down.
Why Did the Dollar Strengthen While Stocks Fell?
Traders moved back into the US dollar because the speech raised the odds of a longer conflict and kept energy supply fears alive. Reuters reported the dollar index up 0.3% to 99.925, showing that traders were rotating back into havens.
How Does the Strait of Hormuz Affect Us Equities?
The Strait of Hormuz is one of the most important fuel shipping routes in the world. If it stays blocked or restricted, energy prices stay high for longer. Reuters said the speech gave no real reassurance about when or how the strait would reopen, leaving markets on edge.
Start trading now – Click here to create your real VT Markets account
GBP/USD rose about 0.6% on Wednesday, regaining 1.3300 after dipping below 1.3200 and rebounding from a March low near 1.3150. It remains below the January high near 1.3850 and under the 50-day and 200-day EMAs near 1.3400 and 1.3350, with the Stochastic RSI near 70.
Bank of England Governor Andrew Bailey said markets were “ahead of themselves” in pricing rate rises. He said earlier guidance had pointed to one or two rate cuts in 2026 before the Iran crisis, but that path is now “off the table”.
Us Data And Policy Signals
US ISM Manufacturing PMI was 52.7, a third month in expansion. ISM Prices Paid jumped to 78.3 from 70.5, the highest since 2022; ADP jobs were 62K versus 40K expected, and retail sales rose 0.6% month-on-month.
President Trump is due to speak at 9 PM Eastern Time (01:00 GMT Thursday) on Iran, during Operation Epic Fury’s 33rd day. He has said the conflict could end in two to three weeks and mentioned a ceasefire if the Strait of Hormuz reopens, alongside comments on NATO.
US jobless claims are expected at 212K versus 210K previously. Nonfarm Payrolls on Friday, April 3 at 12:30 GMT are forecast at 60K after -92K, with earnings at 0.3% month-on-month and 3.8% year-on-year, and unemployment at 4.4%, during Good Friday closures in the UK and US.
Looking back at the situation in late March 2025, the signals for a weaker pound were already clear. We saw Bank of England Governor Bailey actively pushing back against rate hike expectations at the time, which was a significant headwind for Sterling. This dovish stance contrasted sharply with the stagflationary picture in the US, where high price pressures were reinforcing the case for a hawkish Federal Reserve.
The major turning point was the Nonfarm Payrolls report that landed on Good Friday of 2025. As we now know, that report showed a much stronger-than-expected gain of 165,000 jobs, crushing the 60K consensus and causing the Dollar to gap significantly higher when markets reopened. This event shattered support for GBP/USD around 1.3200 and set the bearish tone for the next several months.
Trading And Options Positioning
That fundamental divergence between the two central banks dominated the rest of 2025. True to its word, the Fed held rates steady throughout the year, while the BoE remained on the sidelines, creating a widening interest rate differential that consistently favored the Dollar. This pressure ultimately drove GBP/USD down below the 1.2700 level by the end of last year.
As of today, April 2, 2026, the situation remains challenging for the pound. While recent US CPI has cooled to 2.9%, last month’s NFP still came in at a robust 190,000, keeping the Fed cautious about cutting rates too soon. In contrast, UK inflation remains stickier at 3.4%, but weak growth prevents the BoE from tightening, leaving Sterling vulnerable.
For derivative traders in the coming weeks, this means selling rallies in GBP/USD remains the strategic approach. We should consider buying puts or establishing bearish put spreads on any bounce toward the 1.2650 resistance level, as the underlying fundamentals still favor dollar strength. The market is pricing in Fed cuts later this year, but any delay will punish Sterling further.
Given this context, options traders should also note that implied volatility has settled down from the highs seen during the Iran conflict last year. This makes selling out-of-the-money calls on GBP/USD an attractive strategy to collect premium, betting that the pair will struggle to make any significant, sustained upside break. We must remain positioned for continued pressure on the pair as long as the policy divergence between a cautious Fed and a trapped BoE persists.
Create your live VT Markets account and start trading now.
Start trading now – Click here to create your real VT Markets account
GBP/USD rose about 0.6% on Wednesday, rebounding from the March low near 1.3150 to trade above 1.3300 after dipping below 1.3200. It remains below the 50-day EMA near 1.3410 and the 200-day EMA around 1.3368–1.3350, with the January high near 1.3850 still distant.
BoE Governor Andrew Bailey said markets were “ahead of themselves” in pricing rate rises, while earlier guidance had pointed to one or two rate cuts in 2026. He said that route is now “off the table”, but did not endorse rate hikes.
Usd Data Keeps Pressure On Sterling
US ISM Manufacturing PMI printed 52.7, its third month in expansion, while Prices Paid jumped to 78.3 from 70.5, the highest since 2022. ADP employment rose 62K versus 40K expected, and retail sales were 0.6% month-on-month.
President Trump is scheduled to speak at 9 PM ET (01:00 GMT Thursday) with an update on Iran, as Operation Epic Fury reaches day 33. He has said the conflict could end in two to three weeks and linked a ceasefire to reopening the Strait of Hormuz.
US initial jobless claims are forecast at 212K versus 210K previously, with Challenger job cuts also due. March NFP is released at 12:30 GMT on Friday, 3 April, with 60K expected after -92K, earnings seen at 0.3% m/m and 3.8% y/y, and unemployment at 4.4%, while UK and US markets are closed for Good Friday.
As we look at the market on April 2, 2026, the current struggle in GBP/USD feels very familiar. We are reminded of this exact time in 2025 when the pair also saw a short-term bounce after a period of weakness. The same core issues of central bank policy differences and persistent inflation are driving trading decisions once again.
Key Parallels With Last Year
Last year, Bank of England Governor Bailey was clear about pushing back on rate hike bets, which acted as a ceiling for the Pound. Today, we see a similar dynamic, with UK inflation proving sticky at 3.4% as of the last report, yet the central bank remains reluctant to commit to a path. This divergence weighs on Sterling, especially as the US Federal Reserve also holds a cautious line on policy.
We recall the US ISM Prices Paid data from March 2025, which surged and fueled a pro-dollar stagflation narrative. This week, we received a similar warning sign as the March 2026 ISM Prices Paid index jumped to 55.8, marking its highest reading in more than a year. This suggests that price pressures are building within the supply chain, a factor that will keep the Fed from easing policy.
In 2025, the market was fixated on geopolitical risk from the Iran conflict, which created significant uncertainty for energy prices and risk assets. While that specific event is behind us, we are navigating our own geopolitical landscape with ongoing conflicts that disrupt global trade and energy flows. This backdrop makes holding some downside protection through options a sensible strategy for the coming weeks.
A critical lesson from last year was the volatility created by the Nonfarm Payrolls report being released on a Good Friday when liquidity was thin. In a direct repeat, this year’s March NFP data is scheduled for release tomorrow, April 3rd, which is again the Good Friday holiday. With economists forecasting another healthy gain of around 200,000 jobs, any significant deviation could trigger a sharp price gap when markets reopen on Monday.
Given this environment, we should anticipate a rise in implied volatility leading into the holiday weekend. This setup favors using options to manage risk, such as buying puts or put spreads to protect against a sharp move lower if the NFP data is surprisingly strong. We see significant resistance near the 1.2800 level, and any rallies toward that zone will likely face selling pressure.
Create your live VT Markets account and start trading now.
Start trading now – Click here to create your real VT Markets account
Malaysian financial markets have been steady year to date, with the ringgit up 0.3% and the benchmark equity index up 0.6%. This performance has been linked to resilient macro conditions and capital inflows, despite ongoing global uncertainty and Middle East tensions.
Bank Negara Malaysia updated its outlook on 31 March and projected 2026 GDP growth of 4.0–5.0%. This compares with the government’s 4.0–4.5% projection in Budget 2026, and DBS’s 4.7% forecast.
Inflation And Policy Outlook
BNM projected average headline inflation of 1.5–2.5% in 2026. This compares with 1.3–2.0% in Budget 2026 and DBS’s 2.0% forecast, reflecting expectations of contained price pressures from external and domestic sources.
Policy is expected to remain on hold in 2026, which may help keep bond yields anchored. The update noted Malaysia faces geopolitical uncertainty while maintaining a strong starting position.
The resilient macroeconomic backdrop suggests the Malaysian Ringgit will remain stable against the US dollar in the coming weeks. With GDP growth forecast at 4.0-5.0% and inflation contained, we do not expect major currency shocks. This points towards a low-volatility environment for the USD/MYR pair.
We have seen the USD/MYR pair trade within a narrow band of 4.68 to 4.72 over the past month, reinforcing this outlook. Given this stability, traders should consider strategies that profit from low volatility, such as selling out-of-the-money options on the currency pair to collect premium.
Rates Bonds And Flow Support
Bank Negara Malaysia’s decision to keep the Overnight Policy Rate (OPR) at 3.00% last month, a level held since mid-2025, anchors this view. This policy stance suggests that Malaysian bond yields will also remain relatively stable. Consequently, we see limited price movement in Malaysian Government Securities (MGS) futures for the near term.
The outlook is further supported by consistent capital inflows, with foreign investors adding a net RM 1.2 billion to Malaysian equities in March 2026. This positive sentiment underpins both the FBM KLCI and the Ringgit. This contrasts with the net outflows we experienced during the global risk-off period in late 2025.
While the primary theme is stability, the underlying strength provides a slight appreciation bias for the Ringgit. For those wanting a directional view, using bull call spreads on MYR could be a prudent way to position for modest gains while defining risk. This allows us to participate in any upside without being overly exposed to a sudden shift in global sentiment.
Create your live VT Markets account and start trading now.
Start trading now – Click here to create your real VT Markets account
Malaysian financial markets have risen year to date, with the ringgit up 0.3% and the benchmark equity index up 0.6%. The moves are linked to steady macro conditions and capital inflows, despite global uncertainty and tensions in the Middle East.
Bank Negara Malaysia updated its outlook on 31 March and projected 2026 GDP growth of 4.0–5.0%. This compares with the government’s 4.0–4.5% forecast in Budget 2026 and a DBS forecast of 4.7%.
Inflation Outlook And Policy Implications
BNM also expects headline inflation to average 1.5–2.5% in 2026. This compares with 1.3–2.0% in Budget 2026 and a DBS forecast of 2.0%, based on moderate external and domestic price pressures.
The central bank is expected to keep policy unchanged in 2026. This is expected to help keep bond yields steady, unless the outlook shifts materially.
Given the resilient macroeconomic backdrop, we see the Malaysian Ringgit remaining stable against the US dollar in the near term. With Bank Negara Malaysia (BNM) expected to hold interest rates, implied volatility on USD/MYR options is likely to compress. This presents an opportunity for traders to sell volatility, for instance, by using short strangles to collect premium from a range-bound currency.
This strategy is reinforced by the latest economic data from March 2026, which showed headline inflation holding steady at 1.8%, fitting comfortably within BNM’s forecast. Furthermore, Malaysia’s exports saw a 4.2% year-on-year rise in the first quarter, led by a rebound in the electronics sector, which validates the optimistic growth outlook. These figures give us confidence that the central bank has no immediate reason to alter its policy stance.
Rate Volatility And Curve Stability
For interest rate derivatives, the anchored policy rate suggests Malaysian Government Securities (MGS) yields will see limited movement. We expect the yield curve to remain stable, making this a poor environment for directional bets on rates. Instead, selling swaptions or other forms of interest rate volatility could be a viable strategy to generate income.
We should, however, remain mindful of external risks, recalling the market jitters in 2025 when the US Federal Reserve’s policy signals caused brief capital outflows from emerging markets. While Malaysia’s position is strong, any unexpected hawkishness from major central banks could disrupt the current stability. Therefore, all short-volatility positions must be managed with disciplined risk parameters.
In the equity derivatives market, the steady economic growth provides a solid foundation for corporate earnings. With the benchmark FBM KLCI index showing modest year-to-date gains, we see potential for further upside, albeit limited. Traders could consider buying call spreads on the index to participate in a potential rally while defining their maximum risk.
Create your live VT Markets account and start trading now.
Start trading now – Click here to create your real VT Markets account
USD/JPY ended Wednesday near flat at about 158.70, after two days of declines from around 160.40. It stayed rangebound near 159.00, between a swing high above 160.00 and support near 158.00.
In Japan, the BoJ Tankan large manufacturers index rose to 17 in Q1 2026, the highest since Q4 2021. The manufacturing PMI was revised up to 51.6 in March, and no major Japanese data is due for the rest of the week.
Japan Data And Intervention Risk
Officials also warned about rapid moves after the pair broke 160.00 on Monday, a level that saw intervention in 2024. The comments referred to action against speculative moves.
In the US, ISM Manufacturing Prices Paid rose to 78.3 from 70.5, the highest since 2022, while the headline PMI was 52.7. Retail sales rose 0.6% month-on-month, and ADP employment was 62K versus 40K expected.
The Fed held rates at 3.50% to 3.75% in March, and St. Louis Fed President Musalem said the rate may stay for “some time”. President Trump was set to speak later on the war with Iran, with attention on the Strait of Hormuz and timing.
On the four-hour chart, price was 158.7900 and held above the 200-period EMA near 158.10. Resistance sits near 160.30 then 160.70, while support is near 158.60, 158.10, and 157.70.
Trading Implications And Strategy
The current standoff in USD/JPY near 159.00 presents a classic dilemma for traders. We see strong US economic data suggesting a higher dollar, while the Japanese government is clearly threatening to intervene to strengthen the yen. This tug of war between fundamentals and policy risk means we should prepare for a significant price move in the coming weeks.
The hawkish signals from the US cannot be ignored, with the ISM Prices Paid component jumping to its highest level since 2022 and the Fed indicating rates will stay put for some time. This underlying strength suggests the path of least resistance is still upwards for the currency pair. We should view dips towards the 158.10 level as potential opportunities to position for another test of the highs.
However, the risk of intervention is now extremely high, especially with the pair having already touched the 160.00 level that triggered action in the past. We remember how Japan spent over 9 trillion yen in the spring of 2024 to defend its currency, causing an immediate and violent drop. This makes holding unhedged long positions a very risky proposition right now.
Given these opposing forces, buying volatility seems like a sensible strategy. We can consider using options straddles, which profit from a large move in either direction, to capitalize on a potential breakout from the current range. The upcoming presidential address on the conflict with Iran could easily be the catalyst that forces a sharp move.
For a more directional view, selling out-of-the-money puts with a strike price safely below the 158.10 support level could be an effective strategy. This allows us to collect premium while benefiting from the dollar’s underlying strength, offering a cushion against minor pullbacks. It is a cautiously bullish play that respects the technical support structure.
To directly hedge against the primary risk, we should look at buying cheap, out-of-the-money puts that would profit from a sudden yen strengthening. Looking back at the interventions of 2022 and 2024, the currency pair often dropped by 3-5 yen within hours of the government stepping in. Having this kind of protection in place is a prudent measure against a sudden policy shock.
Create your live VT Markets account and start trading now.
Start trading now – Click here to create your real VT Markets account
USD/JPY ended Wednesday near 158.70 after a quiet session, following two days of falls from the 160.40 area. Trading stayed range-bound near 159.00, between a swing high above 160.00 and support near 158.00.
In Japan, the BoJ Tankan large manufacturers sentiment index rose to 17 in Q1 2026, the highest since Q4 2021. The manufacturing PMI was revised up to 51.6 in March, while Vice Finance Minister Atsushi Mimura said the government would “take decisive action” against speculative moves after the pair moved above 160.00, and no major Japanese data is due later this week.
Us Data And Fed Tone
In the US, ISM Manufacturing Prices Paid rose to 78.3 from 70.5, the highest since 2022, and the headline PMI increased to 52.7. Retail sales rose 0.6% month-on-month, ADP Employment Change was 62K versus a 40K consensus, and the Fed held rates at 3.50% to 3.75% in March, with St. Louis Fed President Musalem saying the rate may stay “for some time”.
On the four-hour chart, price was 158.7900, above the 200-period EMA near 158.10, with the Stochastic RSI turning up from oversold. Resistance is near 160.30 then 160.70, while support is around 158.60, 158.10, and 157.70, with a Trump address on the Iran war due later Wednesday.
The market is in a holding pattern, with USD/JPY caught between strong US economic signals and Japanese warnings. We see a clear battle as hawkish Federal Reserve sentiment pushes the dollar up while the threat of intervention keeps a lid on prices near the 160 level. This indecision creates a tense environment for the coming weeks.
Recent inflation data confirms the hawkish Fed stance, as the core Personal Consumption Expenditures (PCE) price index for February registered 3.1% year-over-year. This figure, well above the central bank’s 2% target, supports the view that US interest rates will remain elevated for some time. Consequently, the interest rate difference between the US and Japan will likely continue to favor holding dollars.
Intervention Risk And Volatility
The verbal warnings from Japan’s Ministry of Finance should not be taken lightly. We remember from our experience in 2024 that when the pair crossed the 160 mark, authorities stepped in with decisive action, causing a sharp and sudden drop. This history makes the 160.00 to 160.40 area a significant psychological and technical barrier.
The President’s upcoming speech on Iran adds another layer of complexity, with any escalation threatening oil supplies through the Strait of Hormuz. A spike in energy prices would fuel US inflation further, reinforcing the Fed’s commitment to tight monetary policy. This dynamic could paradoxically strengthen the dollar even amid a “risk-off” event that would typically help the yen.
For derivative traders, this environment suggests focusing on volatility and risk management. Given the high probability of a sharp move if intervention occurs, buying out-of-the-money JPY call/USD put options could be a prudent hedge against long positions. Alternatively, for those expecting the stalemate to continue, selling option strangles with strikes outside the 158.00-160.40 range might capture premium from the current consolidation.
Create your live VT Markets account and start trading now.
Start trading now – Click here to create your real VT Markets account