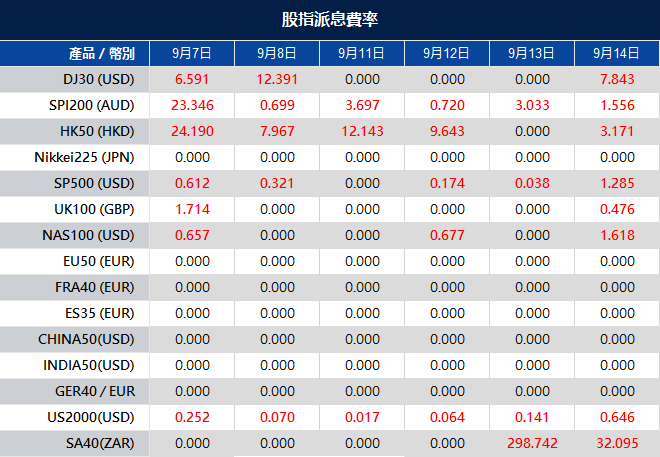
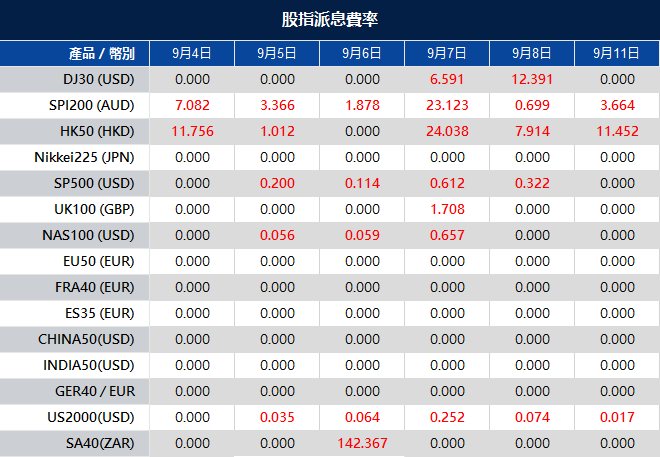
Please note that the dividends of the following products will be adjusted accordingly. Index dividends will be executed separately through a balance statement directly to your trading account, and the comment will be in the following format “Div & Product Name & Net Volume ”.
Please refer to the table below for more details:
The above data is for reference only, please refer to the MT4/MT5 software for specific data.
If you’d like more information, please don’t hesitate to contact [email protected].
On Wednesday, the stock market saw declines, driven by concerns about potential Federal Reserve interest rate hikes, leading to a 0.57% drop in the Dow Jones Industrial Average, a 0.7% dip in the S&P 500, and a 1.06% fall in the Nasdaq Composite. Rising Treasury yields played a role in these losses, particularly affecting technology stocks like Nvidia and Apple. Meanwhile, the US dollar strengthened due to positive ISM data, while the euro (EUR/USD) had a modest gain. GBP/USD declined below 1.25 as Bank of England officials questioned the need for further rate hikes. Precious metals like gold and silver slid due to rising US yields, while cryptocurrencies remained resilient amid discussions about a global cryptocurrency framework within the G20.
Stock Market Updates
On Wednesday, the stock market experienced a notable decline, extending its lackluster performance into September. Investors grew increasingly apprehensive that the Federal Reserve might not have completed its interest rate hikes. The Dow Jones Industrial Average, for instance, dropped by 198.78 points, equivalent to 0.57%, settling at 34,443.19. Similarly, the S&P 500 saw a 0.7% dip, concluding the day at 4,465.48, while the Nasdaq Composite fared even worse, falling by 1.06% and closing at 13,872.47. These declines were largely attributed to rising Treasury yields, particularly the 2-year Treasury note, which surged by approximately 6 basis points and exceeded the 5% threshold.
The upward trajectory in Treasury yields was unsettling for risk assets, with technology stocks, in particular, underperforming. Notably, the Nasdaq experienced its third consecutive day of losses, with leading tech companies like Nvidia and Apple both witnessing declines of over 3%. This negative sentiment also weighed on the Dow, with stocks like Amgen and Boeing declining by around 2% each. The surge in Treasury yields coincided with stronger-than-expected economic data, causing concerns about the possibility of further interest rate hikes. Recent readings on the U.S. economy’s services and manufacturing sectors indicated that prices were moving unfavorably, triggering market uncertainty. Additionally, the probability of a rate hike in November rose, with traders assigning a greater than 40% chance, while a 93% likelihood of the central bank maintaining rates this month was noted, according to the CME Group. In light of this, Boston Fed President Susan Collins suggested cautious progress on rate hikes, although she acknowledged that further tightening might be warranted based on data trends.
On Wednesday, the overall market saw a decline of 0.70%. Among the sectors, Utilities and Energy showed slight gains, with increases of 0.20% and 0.14%, respectively. On the other hand, several sectors experienced losses, with Information Technology being the hardest hit with a substantial drop of 1.37%. Consumer Discretionary also faced a significant decline of 0.97%. Other sectors like Health Care, Communication Services, Industrials, and Materials saw moderate declines ranging from 0.48% to 0.61%. Financials, Consumer Staples, Real Estate, and All Sectors recorded smaller losses, ranging from -0.17% to -0.70%.
Currency Market Updates
On Wednesday, the dollar index strengthened as the ISM non-manufacturing PMI outperformed expectations, leading to a reversal in Treasury yields. Initially, these lower yields had put pressure on the U.S. currency, but the upbeat ISM data boosted expectations of a Federal Reserve interest rate hike in November, pushing the odds above 50%. Meanwhile, EUR/USD saw a modest increase of 0.12%. The European Central Bank (ECB) was mirroring the Fed’s rate hike expectations, with a potential hike in September and roughly a 50% chance of a rate increase on October 26. Traders were looking ahead to euro zone employment data and Q2 GDP figures for insights into the ECB’s near-term policy decisions.
USD/JPY managed to recover from earlier losses, thanks in part to rising Treasury yields and positive ISM data, bringing it closer to its early Asia 2023 high at 147.82. However, earlier remarks from Japan’s top currency diplomat, Masato Kanda, expressing concern about speculative yen selling, had initially weighed on the pair. On the other hand, GBP/USD dipped below 1.25, hitting lows not seen since early June 2023. The downward pressure was exacerbated by comments from BoE Governor Andrew Bailey, Deputy Governor Jon Cunliffe, and Swati Dhingra, who raised questions about the necessity for further rate hikes, adopting a less hawkish stance. Key support at the 200-DMA around 1.2425 was in focus, with a close below potentially signaling a move toward 1.1805, the March 8, 2023 low.
In the commodities market, rising U.S. yields had a negative impact on precious metals, with gold sliding by 0.4% to $1,917 and silver dipping 1.5% to $23.17. Meanwhile, cryptocurrencies defied the weight of high-interest rates, as Bitcoin rose by 0.5% to $25.8k, and Ether gained 0.55% to reach $1,641.30. This resilience was attributed to discussions within the G20 about establishing a global framework for cryptocurrencies.
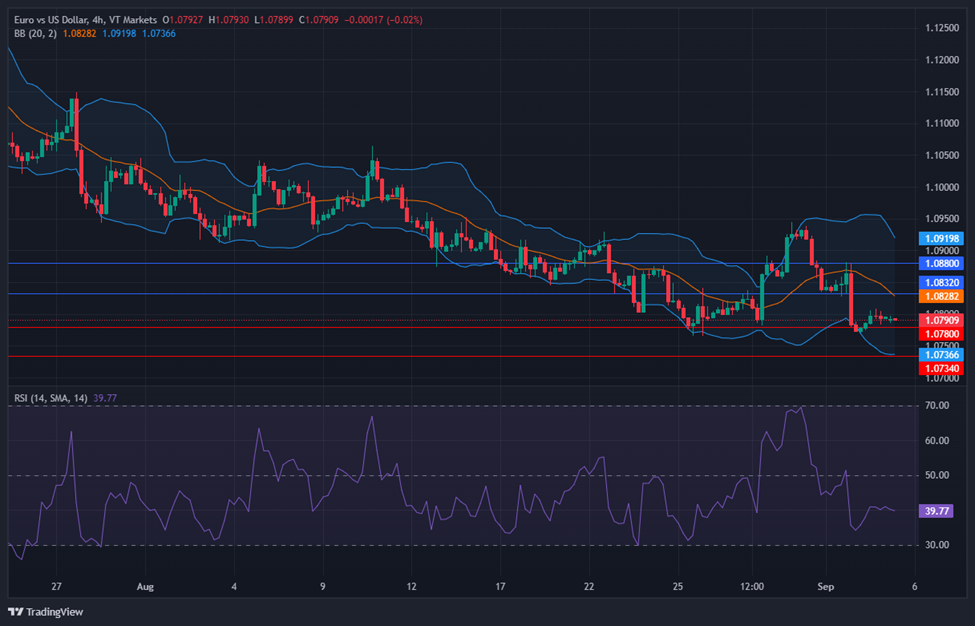
The EUR/USD pair reached a new three-month low, hovering just above 1.0700, primarily due to robust US economic data and a prevailing sense of risk aversion bolstering the US Dollar. In contrast, Eurozone indicators painted a concerning picture, with a substantial 11.7% drop in German Factory Orders and a 0.2% decline in Eurozone Retail Sales for July, casting uncertainty over the European Central Bank’s (ECB) upcoming decisions. Despite these setbacks, the Euro managed to outperform the Pound and Swiss Franc. Upcoming Eurostat releases on Q2 employment and GDP data are not expected to have a significant impact since they involve revisions.
Conversely, in the US, the ISM Manufacturing PMI surpassed expectations, bolstering the Greenback. After briefly touching a low of 1.0702, the EUR/USD pair rebounded to 1.0730. The US Dollar’s strength continues to be driven by robust economic performance and risk aversion. Looking ahead, Jobless Claims and Unit Labor Cost data are anticipated on Thursday, likely to further influence the currency market.
According to technical analysis, the EUR/USD moves flat on Wednesday and is currently trading just above the lower bands of the Bollinger Bands. This movement suggests the possibility of another downward move to create a lower push to the lower band. The Relative Strength Index (RSI) is currently at 34, indicating that the EUR/USD is trending lower and attempting to stay in a bearish trend.
Resistance: 1.0759, 1.0803
Support: 1.0702, 1.0653
XAU/USD (4 Hours)
XAU/USD Extends Decline Amid Dollar’s Ongoing Strength and Mixed Economic Data
On Wednesday, the US Dollar continued its ascent, causing XAU/USD (Gold) to decline for the fourth consecutive day. Gold traded near an intraday low of $1,915.27 per troy ounce, reacting to mixed US macroeconomic data.
S&P Global revised down the August Services PMI, indicating a slowdown in growth, while the ISM Services PMI reported expansion in the services sector. The IBD/TIPP Economic Optimism Index also rose, signaling resilience in the economy. However, inflation-related concerns persisted, leading to increased odds of a 25-basis points rate hike by the Federal Reserve in November, which in turn drove demand for the safe-haven US Dollar. As a result, stock markets turned negative amid these developments.
According to technical analysis, XAU/USD moves lower on Wednesday and created a push to the lower band of the Bollinger Bands. Currently, the price is moving slightly above the lower band, indicating a possibility of a slight increase in Gold’s value, but it’s still in a bearish mode. The Relative Strength Index (RSI) currently stands at 34, suggesting that the XAU/USD pair is now in a bearish mode.
Imagine a novice trader named John, eager to explore the exciting world of Forex trading. Inspired by tales of impressive profits and dreams of financial independence, he leaps into the market without a clear plan, driven by optimism and the promise of quick riches.
Initially, luck smiles upon John, with his first few trades yielding profits that make him feel invincible. However, as the market shifts, so do his emotions. Fear creeps in when a trade takes an unexpected turn, and greed encourages him to hold onto losing positions, hoping for a miraculous turnaround.
Fast forward a few weeks, and John’s trading account has dwindled significantly. What once was excitement has transformed into frustration and disappointment. John’s story is a familiar one in the world of Forex trading, emphasising the critical importance of risk management.
Understanding Forex Market Risk
While the allure of profits is enticing, it’s equally vital to grasp the associated risks. Risk management forms the foundation of a successful Forex trading strategy. Without it, your trading capital is at serious risk.
To navigate the Forex market successfully, it’s crucial to comprehend the underlying risks. Here’s a concise exploration of these risks.
Currency Pairs and Volatility
Currency pairs are the building blocks of Forex trading. They represent the exchange rate between two currencies, such as EUR/USD, GBP/JPY, or AUD/JPY. Each currency pair has its unique characteristics and inherent volatility levels.
Major Pairs: Currency pairs that involve major global currencies, like the EUR/USD (Euro/US Dollar), tend to be less volatile and offer high liquidity. They are often favoured by beginners for their stability and predictable price movements.
Minor and Exotic Pairs: These pairs involve currencies from smaller or emerging economies. They can exhibit higher volatility due to their lower trading volumes and susceptibility to economic and political events. Examples include the GBP/TRY (British Pound/Turkish Lira) or EUR/SGD (Euro/Singapore Dollar).
source: Reddit.com
Market Risk
Market risk, also known as systematic risk, encompasses inherent uncertainties in currency prices. Key factors include:
Economic Events: Releases like GDP reports and employment figures can significantly impact currency values, necessitating attention to economic calendars.
Geopolitical Developments: Political events, trade agreements, and conflicts can create market volatility, impacting currency movements.
Central Bank Policies: Interest rate decisions and monetary policies from central banks influence currency values, demanding vigilance regarding policy changes.
Global Events: Natural disasters, health crises, and major news events can shift market sentiment and trigger currency fluctuations.
Effectively managing market risk involves staying informed, conducting research, and using risk mitigation tools such as stop-loss orders. These tools protect your capital and limit potential losses when navigating market uncertainties.
The Role of Leverage
Leverage is a double-edged sword in Forex trading. Leverage allows traders to control larger positions with a relatively small amount of their own capital. And it multiplies both potential profits and potential losses.
For instance, with leverage, your $1,000 capital might control a position worth $100,000. A 1% price move against your position could result in a $1,000 loss, wiping out your capital. Be cautious not to overextend.
To manage leverage effectively, understand your risk tolerance, use stop-loss orders, and choose appropriate leverage levels that match your strategy. This approach allows you to harness leverage for profit while protecting your capital, a key aspect of responsible and successful Forex trading.
Setting Risk Tolerance
Understanding your risk tolerance is a fundamental aspect of effective risk management in Forex trading. Let’s explore this concept along with the practical application of the 1% rule.
Identifying Your Risk Tolerance
Every trader’s risk tolerance is unique, shaped by their financial situation and personal preferences. Recognising your individual risk tolerance is essential for crafting a trading strategy that aligns with your goals and emotional comfort.
The 1% Rule
A widely respected guideline in Forex trading is the 1% rule. It advises traders to limit the risk on any single trade to no more than 1% of their total trading capital.
Implementing the 1% rule involves calculating the precise amount you’re willing to risk on each trade based on your capital size. This calculation aids in setting accurate stop-loss levels, ensuring that you exit a losing trade before the loss surpasses your predetermined risk threshold.
By integrating your risk tolerance and the 1% rule into your trading strategy, you establish a robust foundation for responsible and sustainable Forex trading. This approach safeguards your capital while allowing you to seize opportunities in the market.
Emotional Discipline
Emotions, such as fear, greed, and the “Fear of Missing Out” (FOMO) effect, play a significant role in Forex trading. These emotions can cloud your judgment and lead to impulsive trading decisions, which can be detrimental to your trading success. Recognising the emotional aspect of trading is essential for successful risk management.
Recognising the FOMO Effect
FOMO often arises when traders see rapid price movements in a currency pair and feel the urge to jump into the market without a well-thought-out plan. It can result in chasing the market and entering trades at unfavourable prices. This fear of missing out on a potentially profitable trade can be a powerful emotion to overcome.
Strategies for Emotional Discipline
To counter the FOMO effect and other emotional pitfalls, it’s crucial to stick to your trading plan and not succumb to impulsive actions. Implementing strategies to maintain emotional discipline, such as setting predefined entry and exit points and using stop-loss and take-profit orders to automate your trades, can help you stay on track and avoid impulsive actions.
By recognising and addressing the FOMO effect and other emotional challenges, you’ll be better equipped to make rational and calculated trading decisions, ultimately contributing to more effective risk management in your Forex trading endeavours.
In conclusion, risk management is fundamental to successful Forex trading. By understanding risks, using leverage wisely, setting risk tolerance, and maintaining discipline, you can trade confidently. While no strategy is foolproof and losses are part of trading, mastering risk management minimises losses and enhances your chances of long-term success in Forex.
Summary:
Forex trading involves inherent risks, and effective risk management is essential for success.
Understanding the Forex market’s volatility, currency pairs, and market risk is crucial for informed trading decisions.
Leverage, while amplifying profits, also magnifies losses. It should be used wisely and aligned with your risk tolerance.
Setting your risk tolerance is critical. The 1% rule advises not risking more than 1% of your capital on a single trade, ensuring capital preservation.
Emotional discipline is vital in Forex trading. Emotions like fear, greed, and FOMO can lead to impulsive decisions. Strategies such as setting predefined entry and exit points help maintain discipline.
With the latest leg of the F1 Grand Prix just days away, fans of motorsport might be forgiven for seeing a touch of the racetrack everywhere they look. When it comes to trading, however, that inclination might not be too far off!
While the fast and furious world of Formula 1 racing might seem completely different from the highly analytical world of trading, some striking similarities show up once you peer under the hood. Aside from the breakneck pace and constant excitement, many of the strategies employed by the Red Bulls and Mercedeses of the world uncannily resemble the strategies used by today’s top traders.
Here are five ways you can leverage the combined wisdom of the racing world and race your way to victory on the trading track:
1) Preparing for the Corners
While sharp twists and turns make F1 incredibly exciting for both fans and drivers, they can often also pose the greatest risk for mishap.
In order to navigate these turns successfully, F1 drivers undergo meticulous preparation: They study maps, practice in virtual simulations, and work closely with their teams to analyse data. This helps them understand which parts of the track have been tricky or problematic in the past, arming them with the knowledge to crush those corners en route to victory.
If that sounds familiar, it’s because trading employs a lot of the same techniques. Just like in F1, it’s the price fluctuations that make trading exciting. If prices never changed, traders would never profit. Unfortunately, these price fluctuations can often also create problems for unprepared traders.
In the same way that F1 drivers study their upcoming circuits, traders hence also need to assess their own equivalent of the racetracks—the charts
Traders should study historical trends and identify the different patterns that lead to success or error. By understanding the basics of support and resistance and trend lines, you can make better-informed decisions and hopefully drive your assets towards a winning position.
2) Knowing When to Pit
There’s a common truth that unites both Formula 1 racing and trading: every second counts. Much like a driver losing a crucial position or even a race by mere milliseconds, the price of a trading asset can change in the blink of an eye.
In the world of Formula 1, the urgency of precise timing is evident when drivers decide on a pit stop. An ill-timed pit stop can throw away a hard-earned advantage, while a well-executed one can turbocharge a car’s performance, maintaining dominance until the final lap.
Traders can draw a parallel between their market entries and exits and the strategic pit stops in F1. Employing technical analysis, traders meticulously assess market movements, mirroring an F1 team manager evaluating track conditions to decide on the perfect pit stop timing. Just as F1 teams factor in unpredictable elements like rain or sunshine when selecting tires, traders rely on real-time market conditions and technical indicators to guide their entry and exit decisions.
3) Finding Balance in High-Pressure Scenarios
Traders and Formula 1 drivers both navigate worlds filled with risk, albeit of different kinds. Yet, it’s a shared truth that they dwell in remarkably volatile environments.
For traders, finding success hinges on striking a delicate equilibrium between their risk appetite and self-discipline. While market volatility can present tantalising opportunities, traders must tread carefully, meticulously assessing whether these prospects align with their risk management strategies.
Much like a Formula 1 driver, traders must master the art of maintaining equilibrium between velocity and control, placing a premium on remaining fully engaged in the game, even when the markets are in flux. In essence, both traders and F1 drivers must navigate risk with grace, even amidst ever-changing landscapes and turbulent market conditions.
4) Understanding the Steering Wheel
People new to Formula 1 might find themselves surprised when they see an F1 car’s steering wheel for the first time. With 21 buttons, each serving a different purpose, Formula 1 drivers utilise a diverse set of tools to optimise their car’s performance, all while receiving guidance from their team through the radio.
The confusion one might experience when faced with the buttons on an F1 steering wheel resembles the confusion one might feel when encountering various technical indicators used by traders. These indicators might initially appear as a random mix of letters and numbers, but they can lead to genuine success in the market once traders become familiar with them.
Elements like moving averages, oscillators, and other indicators can act as signals for potential market trends and reversals. Traders can interpret these signals to determine the right moment to engage in a potentially profitable trade.
Remember that trading isn’t just pure intuition or drive. There is value in “knowing your steering wheel,” and interpreting these signals so you can make a big push for success when the time is right.
5) Adapting to Weather Conditions
It’s worth reiterating that weather conditions can force Formula 1 drivers to change their strategies on the fly. On particularly hot days, F1 teams often opt for slick tyres, which offer improved grip but reduced durability. Conversely, when faced with rainy weather, they switch to wet tyres, designed with deeper grooves to enhance traction on the slippery track.
All this is to say: In choosing tactics to employ in any field, existing conditions are everything. For F1, that means weather; and for trading, that means market sentiment. Aspects such as economic news, geopolitical occurrences, and investor sentiments are tangible factors that demand consideration before making decisions.
Aligning your strategies with the prevailing market mood can substantially bolster your chances of executing profitable trades, akin to the way weather conditions influence the choice of tyres for a car.
Revamp your trading game using these Formula 1-inspired strategies. Open your VT Markets trading account here and take the fast track to trading success.
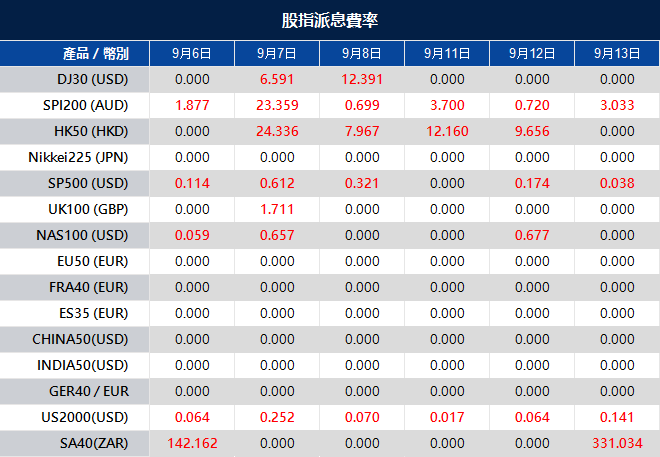
Please note that the dividends of the following products will be adjusted accordingly. Index dividends will be executed separately through a balance statement directly to your trading account, and the comment will be in the following format “Div & Product Name & Net Volume ”.
Please refer to the table below for more details:
The above data is for reference only, please refer to the MT4/MT5 software for specific data.
If you’d like more information, please don’t hesitate to contact [email protected].
On Tuesday, the stock market faced turbulence with notable declines in major indices like the Dow Jones Industrial Average, which dropped 0.56%, and the S&P 500, which fell by 0.42%. This market downturn was primarily triggered by a significant surge in crude oil prices, driven by Saudi Arabia and Russia’s decision to extend supply cuts. Energy stocks benefited from this surge, but airline and cruise stocks took a hit. Additionally, rising oil prices pushed up Treasury yields, adding pressure to risk assets. The dollar gained strength, driven by disappointing economic data, particularly in China and the Eurozone, contributing to a dimmer global growth outlook. This led to a decline in the EUR/USD pair, while USD/JPY reached a new high for 2023. GBP/USD also declined, despite positive UK PMI data. AUD/USD was hit hardest, reflecting concerns about weak Chinese growth. Gold and Bitcoin were sensitive to rising global yields, experiencing price declines. In the upcoming Asian session, attention will turn to Australia’s Q2 Real GDP data for insights into the Reserve Bank of Australia’s policy direction.
Stock Market Updates
On Tuesday, stocks faced a turbulent start to the trading week, primarily due to a significant surge in crude oil prices. The Dow Jones Industrial Average closed with a loss of 195.74 points, representing a 0.56% decline, settling at 34,641.97. Similarly, the S&P 500 experienced a 0.42% drop, concluding the day at 4,496.83, while the Nasdaq Composite edged down 0.08%, settling at 14,020.95. This downward trend in the stock market was triggered by an increase in oil prices, following Saudi Arabia and Russia’s decision to extend voluntary supply cuts. West Texas Intermediate futures saw a substantial gain of over 1%, briefly surpassing $87 per barrel, marking their highest levels since November. This news had a positive impact on energy stocks, with the S&P 500 energy sector gaining 0.5%. Notably, shares of companies like Halliburton, Occidental Petroleum, and EOG Resources saw notable increases. However, the surge in oil prices had adverse effects on airline and cruise stocks, causing significant declines for companies such as American Airlines, United Airlines, Delta Air Lines, and Carnival.
Furthermore, this spike in oil prices also led to a rise in Treasury yields, putting pressure on risk assets. The yield on the 10-year Treasury increased by approximately 9 basis points, reaching around 4.27%. Keith Lerner, co-chief investment officer at Truist Advisory Services, highlighted the potential inflationary impact of rising oil prices, which could complicate the Federal Reserve’s efforts to maintain a delicate balance between achieving a soft economic landing and preventing a slowdown. Consequently, the day witnessed substantial losses in small and midcap stocks, with the S&P Small Cap 600 experiencing its worst day since February with a nearly 3% decline. Additionally, the S&P Midcap 400 slumped approximately 2.3%, and the Russell 2000 fell by 2.1%.
On Tuesday, the overall stock market (All Sectors) experienced a slight decline of 0.42%. However, there were variations in performance among different sectors. The Energy sector stood out with a notable gain of 0.49%, followed by Information Technology, which saw a 0.39% increase. Communication Services showed a modest uptick of 0.04%. In contrast, several sectors faced declines, including Consumer Discretionary (-0.09%), Consumer Staples (-0.83%), Health Care (-0.94%), Real Estate (-0.95%), Financials (-0.96%), Utilities (-1.54%), Industrials (-1.69%), and Materials (-1.81%).
Currency Market Updates
The dollar index saw a notable 0.6% increase as trading resumed after the Labor Day holiday weekend. Traders displayed a preference for safe-haven assets, leading to increased demand for the dollar. This shift was driven by disappointing China Caixin services PMI data and added pressure from euro zone PMI figures, which collectively contributed to a dimmer global growth outlook. Consequently, the EUR/USD pair declined by 0.63%, reflecting concerns about reduced European growth prospects and doubts about the European Central Bank’s potential rate hike at its upcoming Governing Council meeting on September 14. The pair reached a three-month low at 1.0705 before slightly rebounding to 1.0730 in North American afternoon trading. Euro bears now have their sights set on the June 2 weekly low at 1.0635, with late-February lows below 1.0550 as potential targets.
In contrast, USD/JPY reached a new high for 2023 at 147.76 and remained near that level in late trading. The yen continued to face considerable downward pressure due to widening U.S.-Japan yield differentials. The Bank of Japan’s commitment to an ultra-accommodative rate stance contrasted with expectations of the Federal Reserve maintaining higher rates for an extended period, further contributing to the yen’s decline. Traders also appeared to have shifted their expectations for Japanese government intervention to the 150 level, slightly below the 2022 high at 151.94. Additionally, GBP/USD experienced a 0.47% decline, with sterling’s weakness lagging slightly behind. Despite UK PMI data surpassing forecasts, concerns about the impact of rising UK rates on the economy persisted. However, with the Bank of England expected to continue raising rates and maintain a relatively hawkish stance compared to other developed market central banks, GBP/USD may be approaching a bottom. Finally, AUD/USD faced the sharpest decline among major currency pairs, falling to a session low at 0.6358 and closing down 1.32% at 0.6380. This decline was attributed to falling China PMI data, which suggested that weak growth in China could temper Australian economic prospects. Rising U.S. Treasury yields impacted gold, leading to a 0.6% decrease in its price to $1,926. Bitcoin, sensitive to global yield trends, experienced a 0.3% decline to $25.7k after trading in the range of $25.9k-$25.5k. In the upcoming Asia session, the focus will be on Australia’s Q2 Real GDP data, which may provide insights into the Reserve Bank of Australia’s policy direction.
Picks of the Day Analysis
EUR/USD (4 Hours)
EUR/USD Slides to June Lows Amidst Stronger US Dollar and Eurozone Concerns
The EUR/USD pair recently experienced a significant drop, breaking decisively below the 1.0760 level and reaching a low of 1.0706, its lowest point since June. This decline is primarily attributed to the strength of the US Dollar, driven by caution in the markets and higher US yields. The US Dollar Index reached a nine-month high near 105.00. Conversely, the Euro faced downward pressure due to concerns over the Eurozone’s economic outlook, with September PMIs reflecting this sentiment, particularly the Eurozone’s Service PMI falling to 47.9, below the preliminary reading of 48.3. Looking ahead, economic data releases will continue to play a pivotal role in shaping the market’s expectations. Germany will unveil Factory Orders data, and the Eurozone will present Retail Sales figures. In the US, the ISM Services PMI is scheduled. Federal Reserve officials remain open to the possibility of further rate hikes, despite market perceptions of a rate hike pause. This divergence in economic outlook between the US and Eurozone is likely to maintain pressure on the EUR/USD pair.
According to technical analysis, the EUR/USD moves lower on Tuesday and is currently trading just above the lower bands of the Bollinger Bands. This movement suggests the possibility of another downward move to create a lower push to the lower band. The Relative Strength Index (RSI) is currently at 26, indicating that the EUR/USD is trending lower and attempting to stay in a bearish trend.
Resistance: 1.0832, 1.0880
Support: 1.0780, 1.0734
XAU/USD (4 Hours)
XAU/USD Dips as Risk Aversion Grows Amid Economic Concerns
Risk aversion dominated the financial markets on Tuesday, driven by concerns of a global economic setback triggered by disappointing S&P Global Producer Manager Indexes (PMIs). This surge in risk aversion prompted speculative interest to flock to the US Dollar, resulting in XAU/USD, the Gold to US Dollar exchange rate, declining to $1,925.35 per troy ounce. The S&P Global reports revealed a significant economic slowdown in August, with China’s services output dropping to 51.8, down from the previous 54.1, marking the slowest growth rate this year. Similarly, the Euro Zone reported downward revisions, with the EU Composite PMI hitting a nearly three-year low at 46.7. While US figures were set to be released on Wednesday due to a holiday delay, the US Dollar benefited from the risk-averse sentiment, supported by the country’s economic resilience. Wall Street returned cautiously after a long weekend, with slight losses observed among the major indexes, pending macroeconomic indicators later in the week.
According to technical analysis, XAU/USD traded flat on Tuesday and created a push to the lower band of the Bollinger Bands. Currently, the price is moving above the lower band, indicating a possibility of a slight increase in Gold’s value, but it’s still in a bearish mode. The Relative Strength Index (RSI) currently stands at 36, suggesting that the XAU/USD pair is now starting to enter a bearish mode.
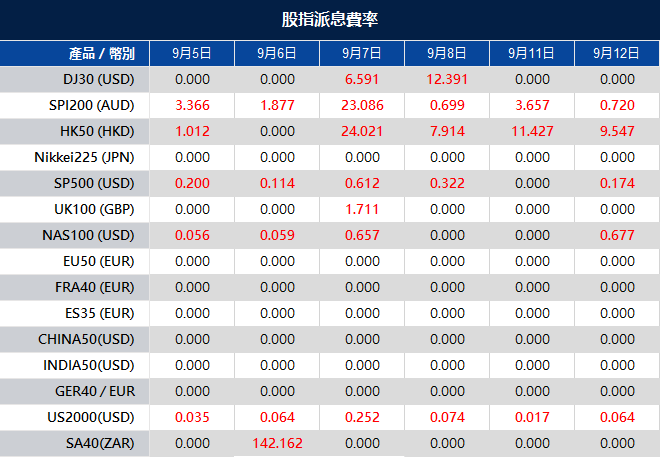
Please note that the dividends of the following products will be adjusted accordingly. Index dividends will be executed separately through a balance statement directly to your trading account, and the comment will be in the following format “Div & Product Name & Net Volume ”.
Please refer to the table below for more details:
The above data is for reference only, please refer to the MT4/MT5 software for specific data.
If you’d like more information, please don’t hesitate to contact [email protected].
VT Markets, a next-generation multi-asset broker, is pleased to announce the appointment of Heena Sharma as HR Manager for the MENA (Middle East and North Africa) region.
Heena Sharma brings a wealth of experience to VT Markets, having previously served as HR Manager at FXPrimus for the past three years, where she played a pivotal role in talent acquisition and the establishment of the broker’s Dubai office. She also brings valuable insights from her prior role as HR Manager at GKFX MENA.
Commenting on her new role at VT Markets, Heena Sharma said, “I specialise in effectively placing top talent in the right roles. VT Markets exemplifies an exceptional team where unique perspectives on employment foster individual and company-wide success. It’s a hub for business professionals and a premier internship destination for newcomers.”
This marks VT Markets’ second recent addition in the MENA region, following the appointment of Accuindex executive Eslam Elshafay to lead MENA Ops in July 2023.
About VT Markets:
VT Markets is a regulated multi-asset broker with a presence in over 160 countries. The broker has won many international accolades including Best Customer Service and Fastest Growing Broker. Its mission is to make trading an easy, accessible, and seamless experience for everyone.
European stock markets, led by the Stoxx 600 index, remained relatively stagnant on Monday as the US market observed Labor Day, preventing any substantial momentum. Despite initial gains, European indices like the FTSE 100, DAX, CAC 40, FTSE MIB, and IBEX 35 saw only minor fluctuations. Travel and leisure stocks inched up by 0.5%, buoyed by optimism following a favorable US jobs report, while the European basic resources sector gained 0.6% due to China’s stimulus measures. In currency markets, the US Dollar Index dipped slightly, while ECB President Christine Lagarde’s speech provided no fresh insights. GBP/USD strengthened, and USD/JPY continued to rise, while AUD/USD held steady near its 20-day Simple Moving Average. The Reserve Bank of Australia (RBA) was expected to maintain its key interest rate at 4.1% in Philip Lowe’s final term as governor, and NZD/USD aimed for a sustained recovery. Meanwhile, USD/CAD faced resistance ahead of the Bank of Canada’s upcoming meeting.
Stock Market Updates
On Monday, the US stock market remained closed due to the Labor Day holiday, while European stock markets experienced minimal change, struggling to sustain momentum after initially brushing off recent negativity. The Stoxx 600 index concluded the session nearly unchanged, retreating from earlier gains that had pushed it to its highest level since August 9. Key European indices, including the FTSE 100, DAX, CAC 40, FTSE MIB, and IBEX 35, recorded mixed movements, with minor fluctuations in either direction.
Travel and leisure stocks exhibited a 0.5% gain, reflecting improved sentiment towards equities following the release of the US jobs report the previous Friday. Investors interpreted signs of a potential economic slowdown as a factor that might temper the Federal Reserve’s hawkish stance on interest rates. Additionally, the European basic resources sector recorded a 0.6% increase, partially attributed to China’s announcement of stimulus measures aimed at bolstering its struggling property sector.
In other economic news, German trade data for July indicated a 0.9% month-on-month decline in exports, while imports increased by 1.4%. This data contradicted economists’ expectations of a 1.5% month-on-month decline in exports for Europe’s largest economy, signaling areas of slowdown. During a seminar in London, Christine Lagarde, President of the European Central Bank, emphasized the significance of central banks anchoring their inflation targets, particularly in the context of energy price fluctuations and geopolitical activity.
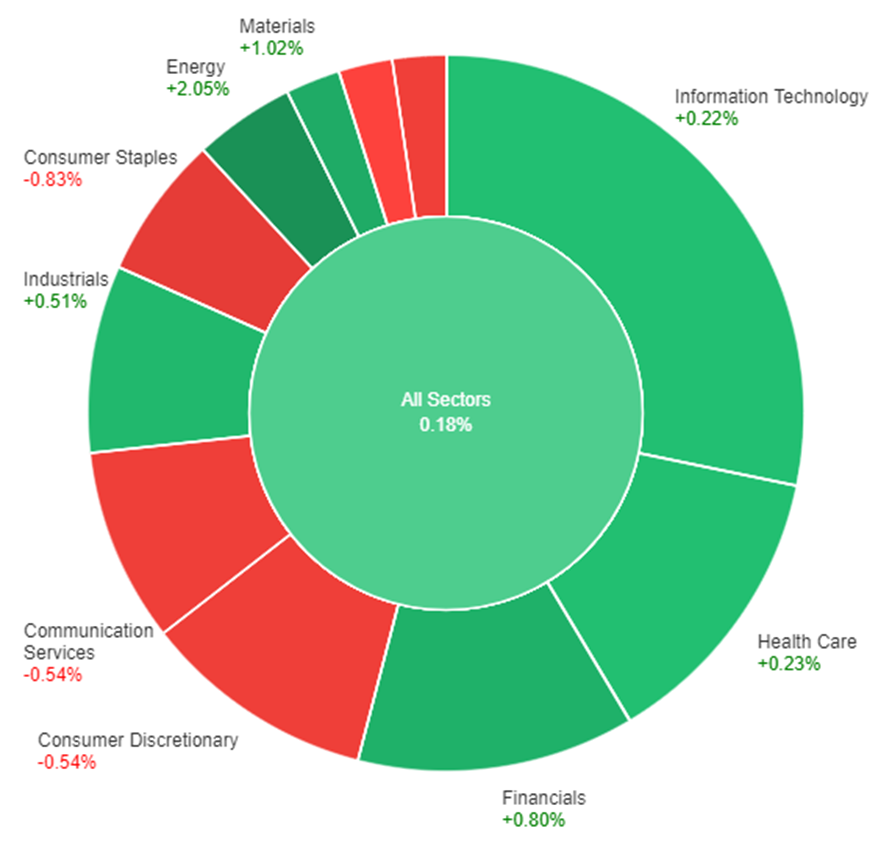
On Friday, the overall market showed a slight gain of 0.18%. The energy sector led the way with a notable increase of 2.05%, followed by materials at 1.02%, and financials at 0.80%. Industrials also saw a modest rise of 0.51%, while health care and information technology sectors had smaller gains of 0.23% and 0.22%, respectively.
In contrast, the real estate sector experienced a slight decline of -0.07%, and utilities and communication services both saw notable decreases of -0.52%. The consumer discretionary and consumer staples sectors both declined by -0.54%, while consumer staples had the largest drop of -0.83%.
Currency Market Updates
In a subdued trading session marked by Wall Street’s closure for Labor Day, the US Dollar Index experienced a slight dip while hovering near 104.00, close to its monthly highs. US stock futures also saw minor declines, and investors awaited the release of July Factory Orders on Tuesday. Meanwhile, European Central Bank (ECB) President Christine Lagarde’s Monday speech offered no new insights, and Eurozone Sentix Investor Confidence continued to deteriorate in September. EUR/USD made a moderate uptick but struggled to hold above 1.0800, maintaining a bearish bias with support at 1.0760. Tuesday’s agenda includes another speech by Lagarde, the release of the August Producer Price Index by Eurostat, and the final Service PMIs.
In currency markets, GBP/USD showed strength, climbing from below 1.2600 to approximately 1.2630, outperforming its peers as EUR/GBP dropped below 0.8550. The UK’s final Service PMI is expected on Tuesday. USD/JPY extended its ascent to around 146.50, potentially reinforcing its bullish outlook if consolidation above that level occurs. AUD/USD closed near the 20-day Simple Moving Average (SMA) around 0.6460, recording modest gains against a weakening US Dollar. The Reserve Bank of Australia (RBA) is set to announce its monetary policy decision on Tuesday, with the consensus anticipating the maintenance of the key interest rate at 4.1%. This meeting marks the last one with Philip Lowe serving as governor of the RBA. NZD/USD remained relatively flat, with critical support at 0.5900 and trading below the 20-day SMA at 0.5970. To establish a more enduring recovery, the Kiwi needs to secure a daily close above 0.6000. Finally, USD/CAD held onto its Friday gains but faced resistance around 1.3600, with the Bank of Canada’s monetary policy meeting scheduled for Wednesday.
Picks of the Day Analysis
EUR/USD (4 Hours)
EUR/USDSees Modest Uptick Amid ECB’s Inaction, Eyes on Eurozone Data and US Factory Orders
The EUR/USD currency pair saw a slight increase in value on Monday, rebounding from a recent two-month low. Although it remained above 1.0770, it struggled to establish firm support above 1.0800. European Central Bank (ECB) President Christine Lagarde’s comments on central banks’ role in managing inflation expectations had little impact on the market. Upcoming events include the final Eurozone Services PMI reading and Eurostat’s Producer Price Index release, while the US Dollar experienced a minor decline ahead of the release of Factory Orders data.
According to technical analysis, the EUR/USD dropped a bit on Monday and is currently trading sideways between the lower and middle bands of the Bollinger Bands. This movement suggests the possibility of another downward move to reach the lower band. The Relative Strength Index (RSI) is currently at 39, indicating that the EUR/USD is trending lower and attempting to stay in a bearish trend.
Resistance: 1.0832, 1.0880
Support: 1.0780, 1.0734
XAU/USD (4 Hours)
XAU/USD Surges to Four-Week High as USD Weakens Amid Fed Uncertainty
The US Dollar continued its decline in the forex market, driving XAU/USD to a four-week high at $1,949.02 per troy ounce. This decline was triggered by disappointing US macroeconomic data, which raised doubts about the Federal Reserve’s tightening policies. The August ADP Survey revealed a slowdown in private job creation, and Q2 GDP figures were downwardly revised. Despite this, July Pending Home Sales exceeded expectations. Stock markets saw modest gains, and government bond yields retreated as the probability of the Fed keeping rates on hold next September increased to 88.5%, according to the CME FedWatch Tool. However, concerns arose about the Fed pressuring regional lenders to bolster their liquidity strategy, causing Wall Street to retract from recent highs. The upcoming focus is on US inflation data, specifically the July Core PCE Price Index, which is expected to show a slight easing in August. Lower inflationary pressures may reinforce the case for no further rate hikes and boost investor sentiment.
According to technical analysis, XAU/USD traded flat on Monday and formed narrow Bollinger Bands. At present, the price is close to the lower band, indicating a possibility of a slight increase in Gold’s value, but it’s still in a consolidation phase. The Relative Strength Index (RSI) currently stands at 50, suggesting that the XAU/USD pair is now in a neutral position.
Please note that the dividends of the following products will be adjusted accordingly. Index dividends will be executed separately through a balance statement directly to your trading account, and the comment will be in the following format “Div & Product Name & Net Volume ”.
Please refer to the table below for more details:
The above data is for reference only, please refer to the MT4/MT5 software for specific data.
If you’d like more information, please don’t hesitate to contact [email protected].