Back

Golden Cross, Death Cross: How to Use Simple Moving Averages in Forex Trading 

Imagine you’re planning a road trip across the country. To make the journey smoother and safer, you rely on your GPS. This trusty device provides you with a simple yet powerful tool – the estimated time of arrival (ETA). 

source: indianauto.com

Now, think of Forex trading as a similar journey filled with twists and turns, where your goal is to reach your profit destination. To navigate this path effectively, you’ll need a reliable tool, and that’s where Simple Moving Average (SMA) crossovers come in. 

Just like your GPS calculates your ETA by smoothing out real-time data, SMAs do something similar in Forex trading. They provide a clear view of market trends, helping you stay on the right route to potential profits. In this comprehensive guide, we’ll not only explore the mechanics of SMAs but also show you how to use them for a successful trading journey. So, fasten your seatbelt, and let’s embark on this exciting Forex adventure together. 

Understanding Simple Moving Averages (SMA) 

Simple Moving Averages (SMAs) are fundamental tools in Forex trading. They provide a smoothed average of an asset’s price over a specified time period, helping you spot trends amidst market noise. SMAs are excellent for beginners because they are easy to calculate and interpret. 

In practical terms, let’s consider a chart displaying daily closing prices of a currency pair. SMAs operate by systematically summing up the closing prices over a defined time frame, such as 10 days, and then dividing this sum by the number of days in that period (in this case, 10). This calculation yields a single data point on the chart that signifies the average price over that specific duration. 

For example, suppose you have daily closing prices for a currency pair over the last 10 days: 

  • Day 1: 1.1000 
  • Day 2: 1.1020 
  • Day 3: 1.1035 
  • Day 4: 1.1050 
  • Day 5: 1.1080 
  • Day 6: 1.1075 
  • Day 7: 1.1070 
  • Day 8: 1.1065 
  • Day 9: 1.1055 
  • Day 10: 1.1075 

To calculate the 10-period SMA, you sum these closing prices (1.1000 + 1.1020 + 1.1035 + 1.1050 + 1.1080 + 1.1075 + 1.1070 + 1.1065 + 1.1055 + 1.1075 = 11.075) and then divide by 10. The resulting value, approximately 1.1075, represents the 10-period SMA for the current day. 

By performing this calculation consistently for each day, you generate a line on your chart. This line effectively smooths out the short-term price fluctuations, making it easier to discern the prevailing market trend. SMAs provide traders with factual data to assess whether the market is trending upward, downward, or trading sideways, offering valuable insights for informed trading decisions. 

Different SMA Periods 

In Forex trading, Simple Moving Averages (SMAs) are not one-size-fits-all. Traders can choose from various SMA periods, including 10-period, 50-period, and 200-period SMAs. The choice of period determines how quickly the SMA responds to price changes and offers a distinct perspective on market trends. 

source: babypips.com
  • 10-Period SMA: This short-term SMA reacts rapidly to price fluctuations, making it well-suited for identifying immediate market shifts. Traders employing this period are more focused on short-term trends and are likely to make quicker trading decisions. 
  • 50-Period SMA: The 50-period SMA strikes a balance between short and long-term trends. It provides a moderately smoothed view of price movements, allowing traders to identify medium-term trends with a bit more stability than the 10-period SMA. 
  • 200-Period SMA: For those with a long-term perspective, the 200-period SMA is the go-to choice. It offers a broader view of the market, filtering out much of the short-term noise. This makes it ideal for capturing long-term trends, helping traders identify significant market shifts over extended periods. 

Different SMAs, Different Trends 

Each SMA period highlights a specific aspect of the market’s behaviour: 

  • Short-term SMAs (e.g., 10-period): These respond swiftly to short-lived price changes. Traders using short-term SMAs aim to capture quick, often smaller, price movements. It’s like having a magnifying glass to spot intricate details in the market’s immediate behaviour. 
  • Long-term SMAs (e.g., 200-period): Long-term SMAs are the patient observers of the market. They provide a more stable and less erratic view of price movements, emphasizing the broader, sustained trends. Using a long-term SMA is akin to stepping back for a panoramic view of the landscape, revealing the grandeur of significant market shifts. 

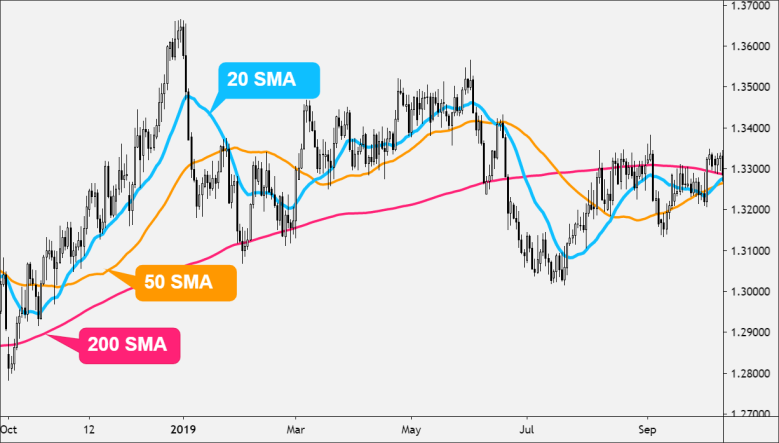
Multiple SMAs on a Chart 

Forex traders frequently employ multiple SMAs simultaneously to gain a comprehensive understanding of the market. By plotting different SMAs on their charts, such as 10, 50, and 200-period SMAs, they can visually compare short-term and long-term trends. This approach enhances decision-making by providing a layered perspective: 

  • Short-term SMAs quickly respond to price changes, offering insights into immediate market shifts. 
  • Medium-term SMAs (e.g., 50-period) offer a balanced view, capturing trends that last several weeks or months. 
  • Long-term SMAs (e.g., 200-period) reveal the overarching, enduring trends that span years. 

Comparing these SMAs helps traders make informed decisions, especially when the signals from multiple periods align, strengthening the conviction behind a particular trade. It’s like having a toolkit with different tools for different tasks, ensuring you’re well-equipped to tackle the complexities of the Forex market. 

The SMA Crossover Strategy 

SMA crossovers are a widely embraced trading strategy, known for their simplicity and effectiveness. They revolve around the interaction of two Simple Moving Averages (SMAs) on a price chart, highlighting potential shifts in market trends. This strategy is a cornerstone for traders aiming to seize opportunities at crucial turning points in the market. 
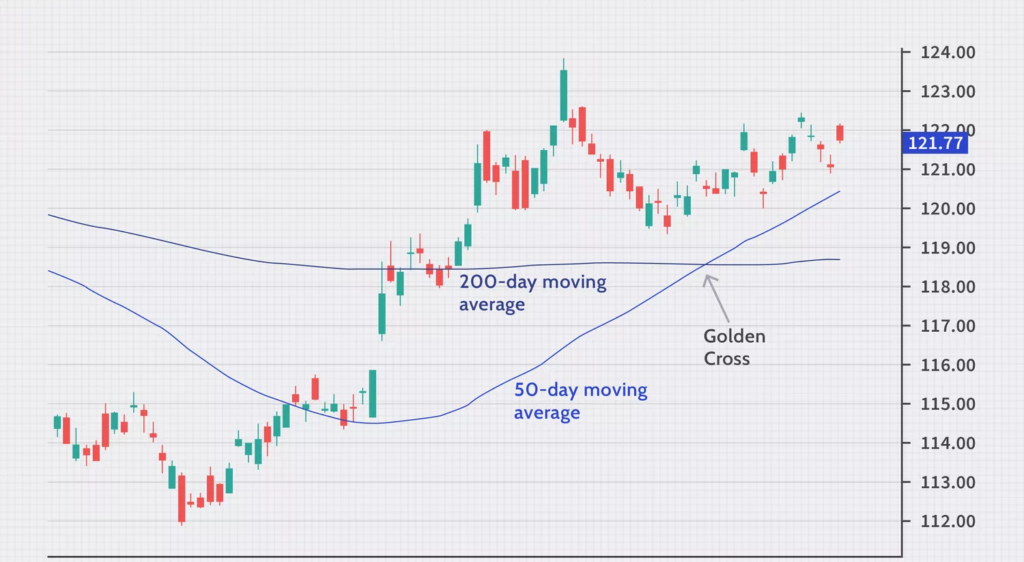
Golden Cross 

A Golden Cross is one of the most recognisable and coveted signals in technical analysis. It unfolds when a short-term SMA (typically a 50-period SMA) gracefully glides above a longer-term SMA (usually a 200-period SMA). This event signifies a bullish trend reversal, indicating that the market sentiment is turning positive. It’s akin to a green light for traders, suggesting a potential buying opportunity is on the horizon. 
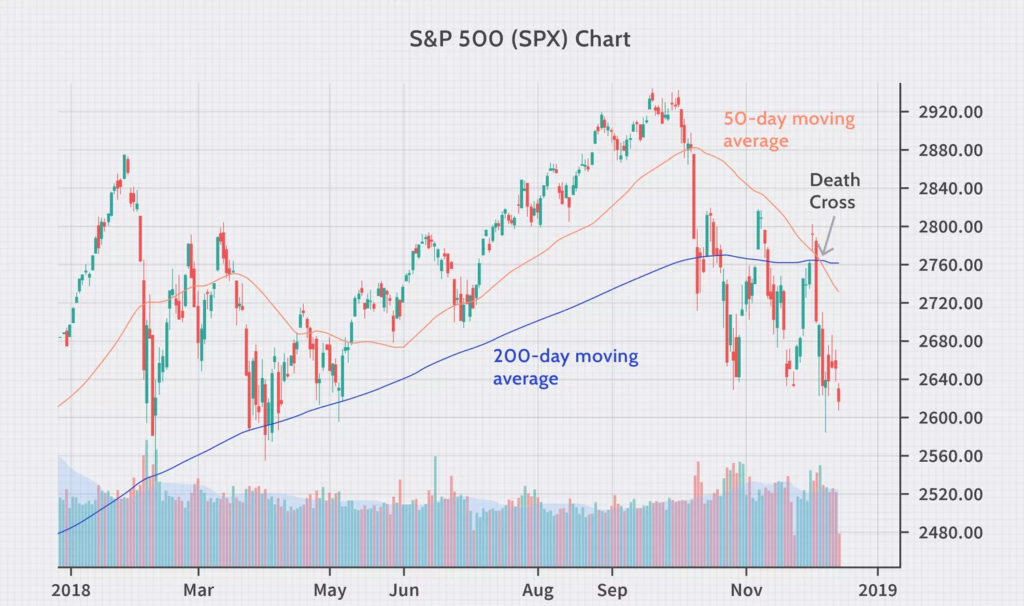
source: Investopedia.com

Death Cross 

Conversely, the Death Cross is a notable signal for traders looking to profit from bearish market movements. This occurs when the short-term SMA, once again usually the 50-period SMA, crosses beneath the long-term SMA, typically the 200-period SMA. The Death Cross serves as a red flag, indicating a bearish trend reversal and suggesting that market sentiment is turning negative. For traders, this can be an alert to consider selling positions or opening short positions. 

source: Investopedia.com

Combining SMAs with Other Indicators 

In Forex trading, relying solely on Simple Moving Averages (SMAs) may not suffice for effective decision-making. To enhance your trading accuracy and confidence, consider using SMAs in conjunction with other technical indicators. These complementary tools offer a more comprehensive perspective on market trends and potential entry points. 

Commonly used indicators for this purpose include: 

  • Relative Strength Index (RSI): RSI assesses trend strength by measuring recent price changes. It identifies whether an asset is overbought or oversold and can help confirm the direction of a trend when used alongside SMAs. 
  • Moving Average Convergence Divergence (MACD): MACD is a versatile indicator that identifies trend changes, strength, and duration. When combined with SMAs, it provides more precise signals, especially for trend reversals. 
  • Stochastic Oscillator: This indicator measures a currency pair’s momentum by comparing its closing price to its trading range over a specific period. Incorporating the Stochastic Oscillator with SMAs assists traders in pinpointing entry and exit points more accurately.

Using SMA Crossovers for Entry 

While SMA crossovers can be powerful signals on their own, it’s crucial to exercise caution and thorough analysis when executing trades. To enter a trade based on a Golden Cross (50-period SMA crossing above the 200-period SMA), consider the following steps

  • Confirmation of the Golden Cross: Ensure that the crossover is valid and not a temporary blip on the chart. Look for a sustained separation between the SMAs to confirm the strength of the signal. 
  • Additional Indicators: As mentioned earlier, incorporate other technical indicators (such as RSI or MACD) to corroborate the upward trend. This multi-indicator approach adds an extra layer of confidence to your decision. 
  • Risk Management: Implement sound risk management practices by setting stop-loss orders to limit potential losses and take-profit orders to secure profits. Calculate your position size based on your risk tolerance and use risk-to-reward ratios to determine whether the trade is worth pursuing. 
  • Market Context: Consider the broader market context, including economic events, news releases, and geopolitical factors that may influence the currency pair you’re trading. These external factors can impact the success of your trade. 
  • Entry Timing: Wait for an opportune moment to enter the trade. It’s advisable to wait for a pullback or a retest of the moving averages to confirm the trend’s stability before entering. 
  • Continuous Monitoring: After entering the trade, keep a watchful eye on it. Adjust your stop-loss and take-profit levels as the trade progresses and stay informed about any developments that may affect your position. 

In conclusion, Simple Moving Average crossovers provide a straightforward and effective strategy for beginners in Forex trading. Their simplicity makes them an ideal starting point for those new to the market. Remember to trade cautiously, continuously learn, and never stop exploring new strategies. 

Summary: 

  • SMAs average an asset’s closing prices over a specific time frame to reveal trends. 
  • Traders can choose from various SMA periods and combining them offers a comprehensive view of trends. 
  • SMA crossovers like the Golden Cross (bullish) and Death Cross (bearish) are popular, providing straightforward signals. 
  • To enhance accuracy, combine SMAs with indicators like RSI, MACD, and the Stochastic Oscillator. 
  • For entry, confirm crossovers, use additional indicators, practice risk management, consider market context, time your entry, and monitor trades closely. 

The Emotional Edge in Forex Trading: Sentiment Analysis Strategies

Imagine standing amidst a sea of people at a grand concert. The electrifying music pulses through the air, and you can feel the excitement building with every beat. 

As the artist hits a high note, the crowd erupts in cheers, and an aura of euphoria envelops the arena. Now, think about what happens if the artist misses a note or two—the collective disappointment is palpable, and the energy takes a temporary dip. 

source: Milwaukee Journal Sentinel:

In this mesmerising scene, you’re witnessing the power of collective emotion. The concertgoers’ reactions mirror their emotional connection to the music, influencing the overall atmosphere. This phenomenon, where emotions converge to shape the experience, is not unique to concert halls. 

Welcome to the world of Forex trading, where traders’ emotions, opinions, and attitudes collectively shape the landscape—the realm of market sentiment. 

Understanding Market Sentiment 

Market sentiment is the overall emotional and psychological outlook of traders and investors in a financial market. It represents the collective mood—positive or negative—shaping trading decisions and influencing asset prices. 

For instance, during periods of economic growth, traders might exhibit optimism, driving up the value of a nation’s currency. Conversely, during times of uncertainty, fear may trigger a rush to safer currencies. This emotional ebb and flow is where sentiment analysis steps in, offering a glimpse into market psychology. 

Sentiment analysis is the process of assessing and interpreting the emotional tone and attitude of text or data, often from sources like news, social media, or surveys. In the context of Forex trading, sentiment analysis helps traders gauge market participants’ feelings and opinions to predict potential price movements. 

When to Use Sentiment Analysis 

Sentiment analysis can be particularly valuable in various situations where market emotions play a significant role in shaping price movements. 

Some of the prime scenarios to leverage sentiment analysis include: 

  • Major Economic Announcements: During key economic releases like GDP figures, employment reports, or central bank decisions, sentiment analysis helps you anticipate how traders are likely to react. For instance, positive sentiment ahead of a favourable jobs report can indicate potential currency strength. 
  • Geopolitical Events: Sentiment analysis shines when unexpected geopolitical events occur. Political tensions, trade negotiations, or international conflicts can trigger rapid shifts in market sentiment. Being prepared with sentiment insights allows you to react swiftly. 
  • Market Exuberance or Fear: In periods of extreme market optimism (exuberance) or fear (risk aversion), sentiment analysis can provide insights into whether these emotions are overblown or justified. This aids in deciding whether to follow the trend or consider a contrarian approach. 
  • Earnings Seasons: In Forex trading, earnings seasons for major global corporations can impact the sentiment toward certain currencies. Positive sentiment around strong corporate performances can influence currency value, especially in economies closely tied to those corporations. 
  • Unforeseen News Events: Unexpected news, such as natural disasters, terror attacks, or health crises, can swiftly alter market sentiment. Sentiment analysis helps gauge traders’ reactions and whether the market overreacts or underreacts to such events. 
  • Central Bank Actions: When central banks change monetary policy unexpectedly or make surprise statements, sentiment analysis helps gauge market participants’ response. For instance, a sudden rate cut can lead to negative sentiment towards a currency. 
  • Technical Analysis Confirmation: Combining sentiment analysis with technical analysis can provide confirmation or divergence signals. If a technical trend aligns with a prevailing sentiment, it adds strength to your trading decision. 
  • Contrarian Opportunities: Sentiment analysis can identify situations where market sentiment diverges from fundamental or technical factors. These situations can present contrarian trading opportunities if you believe sentiment is excessively skewed. 
source: CNN
Federal Reserve Chair Jerome Powell’s press conference

Sources of Sentiment Data 

Much like seeking reviews before choosing a restaurant to dine at, traders in the Forex market turn to various sources of sentiment data to gauge the pulse of market participants. 

These sources serve as sentiment indicators, helping traders decipher the prevailing market mood. Here are some key sources: 

Social Media 

Think of social media platforms as the bustling hub of market chatter. Just as you might read reviews or comments about a restaurant’s ambiance, service, and food quality, social media discussions can provide insights into how traders feel about specific currencies or market events. Platforms like Twitter, Reddit, and trading forums are rich sources of real-time sentiments. 

News Outlets 

Similar to reading news reviews to stay informed about the latest restaurant openings, news outlets provide up-to-date information about economic data releases, geopolitical developments, and other factors impacting the market sentiment. News articles often contain quotes and expert opinions that reflect the current sentiment toward currencies or assets. 

Trader Surveys 

Imagine conducting a survey to understand people’s preferences before selecting a dining spot. In the Forex world, trader surveys collect opinions and expectations from market participants. These surveys can shed light on traders’ sentiment biases, giving you insights into whether they are bullish or bearish on a particular currency pair. 

Sentiment Analysis Tools 

Just as you might use food review aggregators to gather overall restaurant ratings, sentiment analysis tools [internal link: https://www.vtmarkets.com/tools/trading-tools/trading-central-mt4-tools/] consolidate and quantify sentiment data from various sources. These tools process massive amounts of text data from news articles, social media posts, and more to provide sentiment indicators that help traders understand the prevailing mood. 

Economic Data Releases 

Economic indicators such as consumer sentiment indexes can directly impact market sentiment. These indicators measure consumers’ attitudes toward the economy and their spending intentions. Positive or negative sentiment in these indexes can influence traders’ outlook on currency pairs. 

source: CNN

Sentiment Indicators and Tools 

Think of sentiment indicators and tools as your dashboard for navigating the Forex market—a dashboard that provides vital insights into market emotions. 

These tools act like gauges, offering real-time readings of traders’ sentiments and guiding your trading decisions. Here are key ones: 

  • Fear and Greed Index: Like a temperature gauge, this index measures market sentiment—fear indicating caution, and greed signalling risk appetite. 
  • Commitment of Traders (COT) Report: It’s your roadmap, showing positions of large traders, helping you align with market sentiment. 
  • Volatility Index (VIX): Just as a fuel gauge warns of changing fuel levels, VIX signals market uncertainty—high values indicating potential fear. 
  • Put-Call Ratio: Think of it as brakes (put) vs. acceleration (call)—high ratios hint at pessimism, while low ratios suggest optimism. 
  • Moving Averages: Like watching speed trends, they show sentiment shifts. Crossing certain averages can indicate sentiment changes. 
  • Social Media and News Tools: These AI co-pilots analyse social media posts and news stories, revealing sentiment trends. 
  • News Sentiment Tools: They analyse news headlines for positive or negative sentiment, helping gauge news impact on sentiment. 

Contrarian vs. Consensus Trading 

Let’s draw a parallel between trading and dining at a bustling restaurant to understand the concepts of contrarian and consensus trading. 

Contrarian Trading: 

Imagine you’re at a restaurant where a particular dish is causing a stir due to rumours of its taste. Contrarian traders in the financial world would be the equivalent of ordering that dish, believing that the rumours might be exaggerated. They take a contrarian stance, going against the prevailing sentiment, and aim to profit from situations where the market might be overreacting. 

Consensus Trading: 

Now, picture a different scenario where a dish on the menu is in high demand, with every table ordering it. Consensus traders align with this majority sentiment. Just like choosing the popular item, consensus traders follow the crowd and base their trading decisions on prevailing market sentiment. They believe that the wisdom of the crowd guides their choices. 

Choosing Your Approach: 

Deciding between these trading approaches depends on your assessment of the market and your personal strategy. Some traders prefer the contrarian approach, seeing opportunities where others might miss them. Others find comfort in consensus trading, believing that collective market sentiment holds valuable insights. 

Tips for Using Sentiment Analysis in Trading 

Utilise sentiment analysis like a skilled traveller navigating diverse landscapes. Here’s how: 

  • Compass, Not a Map: Use it as a guide, not a rulebook—combine with other tools for a well-rounded strategy. 
  • Balanced Approach: Like a traveller consults multiple sources, balance sentiment analysis with fundamental and technical insights. 
  • Context Matters: Understand context—economic data, news, and events influence sentiment, much like local customs shape travel experiences. 
  • Short and Long-Term: Analyse both short and long-term sentiment trends, like adjusting plans based on immediate weather and long-term forecasts. 
  • Risk Management: Prioritise risk management—define limits and sizes, just as a traveller secures belongings. 
  • Adaptability: Adapt to changing sentiments as travellers adjust to unexpected conditions. 

In conclusion, sentiment analysis offers a valuable tool for unravelling emotional dynamics within the Forex market. Similar to skilfully navigating various scenarios, its integration enhances trading strategies. By embracing its insights while acknowledging its limitations, traders can effectively leverage market sentiment. Adroit incorporation of sentiment analysis empowers informed and prudent trading decisions, enhancing effectiveness within the dynamic domain of Forex trading. 

Summary: 

  • Sentiment analysis in Forex trading focuses on collective trader emotions impacting market dynamics. 
  • Sentiment analysis interprets emotional tone from sources like social media and news, aiding price movement predictions. 
  • It’s valuable during economic announcements, geopolitical events, market emotions, earnings seasons, unexpected news, and central bank actions. 
  • Sentiment indicators/tools like Fear and Greed Index, COT Report, and sentiment analysis tools offer real-time sentiment readings. 
  • Contrarian traders profit from potential overreactions, while consensus traders align with majority sentiment. 

Week Ahead: Markets to Focus on RBA Rate Statement and BOC Rate Statement

The financial world is keeping a close watch on some important economic news this week. Two major central banks, the Reserve Bank of Australia (RBA) and the Bank of Canada (BOC), will be releasing their rate statements. Given the potential for increased market volatility, we advise traders to exercise caution and stay mindful of their trading strategies.

Here are some notable highlights for the upcoming week:

Reserve Bank of Australia Rate Statement (5 September 2023) 

The Reserve Bank of Australia held its cash rate steady at 4.1% during its August meeting, continuing the rate pause for the second consecutive month. 

The central bank is set to announce the next interest rate adjustment on 5 September, and analysts anticipate that the RBA will maintain its rate at 4.1%.

Australia Quarterly Gross Domestic Product (6 September 2023) 

The Australian economy saw a 0.2% quarter-on-quarter expansion in Q1 2023, following a 0.6% increase in Q4 2022.

The figures for Q2 2023 are scheduled for release on 6 September, with analysts predicting another 0.2% increase in the GDP. 

Bank of Canada Rate Statement (6 September 2023)

The Bank of Canada (BOC) increased the target for its overnight rate by 25 bps to 5% in July 2023. This move followed a surprising 25 bps rate hike in the previous meeting and extended the bank’s tightening cycle, which had briefly paused in March and April. 

The next rate statement is scheduled for release on 6 September, and analysts expect the BOC to maintain its interest rates at 5%.

US ISM Services PMI (6 September 2023)

The US Institute of Supply Management (ISM) Non-Manufacturing Purchasing Managers’ Index, also known as the US ISM Services PMI, fell to 52.7 in July 2023. This follows a four-month high of 53.9 in June. 

The ISM’s data for August 2023 is scheduled for release on 6 September, with analysts anticipating a slight decrease to 52.6.

Canada Unemployment Rate (8 September 2023)

The Canadian unemployment rate edged higher to 5.5% in July 2023 from 5.4% in the previous month, marking the third consecutive increase to levels last seen in January 2022. This reflects some softening in the Canadian labour market. 

The figures for August are set to be released on 8 September, with analysts anticipating that the unemployment rate will remain at 5.5%.

From fashion to tech: Inside Europe’s top 10 biggest companies 

In the dynamic landscape of global business, Europe stands tall with a lineup of mega-corporations that have secured their positions as leaders in various industries. 

From luxury fashion houses to cutting-edge technology firms and energy giants, Europe’s top companies have made significant contributions to their sectors and the world economy. 

In this article, we delve into the profiles of the ten most valuable EU companies, exploring their market capitalisations, histories, and key contributions. 

1. LVMH, France 

Market cap: $443.70 Billion 

source: https://companiesmarketcap.com/

LVMH Moët Hennessy Louis Vuitton commonly known as LVMH, is a French multinational holding and conglomerate specialising in luxury goods, headquartered in Paris. 

LVMH controls around 60 subsidiaries that manage 75 prestigious brands. These include Tiffany & Co., Christian Dior, Fendi, Givenchy, Marc Jacobs, Stella McCartney, Loewe, Loro Piana, Kenzo, Celine, Sephora, Princess Yachts, TAG Heuer, and Bulgari. 

As of August 2023, LVMH has a market cap of $443.70 Billion. This makes LVMH the world’s 15th most valuable company. 

2. Novo Nordisk, Denmark 

Market cap: $420.87 Billion 

source: https://companiesmarketcap.com/

Novo Nordisk A/S is a Danish multinational pharmaceutical company headquartered in Bagsværd, Denmark, with production facilities in nine countries and affiliates or offices in five countries. 

Novo Nordisk manufactures and markets pharmaceutical products and services, specifically diabetes care medications and devices. Its main product is the drug semaglutide, used to treat diabetes under the brand name Ozempic and obesity under the brand name Wegovy. 

As of August 2023, Novo Nordisk has a market cap of $420.87 Billion. This makes Novo Nordisk the world’s 18th most valuable company. 

3. ASML, Netherlands 

Market cap: $263.40 Billion 

source: https://companiesmarketcap.com/

ASML Holding N.V. (ASML stands for Advanced Semiconductor Materials Lithography) is a Dutch multinational corporation founded in 1984. 

ASML specialises in the development and manufacturing of photolithography machines which are used to produce computer chips. The company is the sole supplier in the world of extreme ultraviolet lithography (EUV) photolithography machines that are required to manufacture the most advanced chips 

As of August 2023, ASML has a market cap of $263.40 Billion. This makes ASML the world’s 31th most valuable company. 

4. L’Oréal, France 

Market cap: $236.22 Billion 

source: https://companiesmarketcap.com/

L’Oréal S.A. is a French personal care company headquartered in Clichy, Hauts-de-Seine, with a registered office in Paris. 

It is the world’s largest cosmetics company and has developed activities in the field, concentrating on hair colour, skin care, sun protection, make-up, perfume, and hair care. 

As of August 2023, L’Oréal has a market cap of $236.22 Billion. This makes L’Oréal the world’s 40th most valuable company. 

5. Hermès, France 

Market cap: $217.36 Billion 

source: https://companiesmarketcap.com/

Hermès International S.A. is a French luxury design house established in 1837. 

It specialises in leather goods, lifestyle accessories, home furnishings, perfumery, jewellery, watches and ready-to-wear. Since the 1950s, its logo has been a depiction of a ducal horse-drawn carriage. 

As of August 2023, Hermès has a market cap of $217.36 Billion. This makes Hermès the world’s 44th most valuable company. 

6. Accenture, Ireland 

Market cap: $204.06 Billion 

source: https://companiesmarketcap.com/

Accenture plc is an Irish-American professional services company based in Dublin, specialising in information technology (IT) services and consulting. 

Accenture’s current clients include 91 of the Fortune Global 100 and more than three-quarters of the Fortune Global 500. As of 2022, Accenture is considered the largest consulting firm in the world by number of employees. 

As of August 2023, Accenture has a market cap of $204.06 Billion. This makes Accenture the world’s 52nd most valuable company. 

7. SAP, Germany 

Market cap: $164.50 Billion 

source: https://companiesmarketcap.com/

SAP SE is a German multinational software company based in Walldorf, Baden-Württemberg. 

It develops enterprise software to manage business operations and customer relations. The company is the world’s leading enterprise resource planning (ERP) software vendor. 

As of August 2023, SAP has a market cap of $164.50 Billion. This makes SAP the world’s 63rd most valuable company. 

8. Dior, France 

Market cap: $154.09 Billion 

source: https://companiesmarketcap.com/

Christian Dior SE is a French multinational luxury fashion house controlled and chaired by French businessman Bernard Arnault, who also heads LVMH. 

The company was founded in 1946 by French fashion designer Christian Dior. This brand sells only shoes and clothing that can only be bought in Dior stores. 

As of August 2023, Dior has a market cap of $154.09 Billion. This makes Dior the world’s 69th most valuable company. 

9. TotalEnergies, France 

Market cap: $152.10 Billion

source: https://companiesmarketcap.com/

TotalEnergies SE is a French multinational integrated energy and petroleum company founded in 1924 and is one of the seven supermajor oil companies. 

Its businesses cover the entire oil and gas chain, from crude oil and natural gas exploration and production to power generation, transportation, refining, petroleum product marketing, and international crude oil and product trading. TotalEnergies is also a large-scale chemicals manufacturer. 

As of August 2023, TotalEnergies has a market cap of $152.10 Billion. This makes TotalEnergies the world’s 71st most valuable company. 

10. Prosus, Netherlands 

Market cap: $138.92 Billion 

source: https://companiesmarketcap.com/

Prosus N.V., or Prosus, is a global investment group that invests and operates across sectors and markets with long-term growth potential. It is among the largest technology investors in the world. 

Prosus has invested across multiple verticals, including social/gaming, classifieds, payments and fintech, edtech, food delivery, and ecommerce. Products and services of its businesses and investments are used by more than 1.5 billion people in 89 markets. 

As of August 2023, Prosus has a market cap of $138.92 Billion. This makes Prosus the world’s 85th most valuable company. 

In conclusion, Europe is home to some of the world’s biggest and most successful companies in various fields like luxury goods, healthcare, technology, and energy. This mix of industries shows how strong Europe’s economy is and also offers chances to invest. 

If you’re interested in benefiting from these successful companies, you can think about trading their shares. VT Markets gives you the opportunity to trade Share CFDs for more than 140 top European companies. Share CFDs let you trade on how share prices go up and down without owning the shares directly. This means you can make money whether the prices rise or fall. 

You can start trading by opening a live account with VT Markets today. You’ll be able to trade EU Share CFDs with up to 20:1 leverage and a small commission of 0.1% for each lot you trade. This is your chance to be part of the success stories of Europe’s most important businesses. 

Dividend Adjustment Notice – September 1, 2023

Dear Client,

Please note that the dividends of the following products will be adjusted accordingly. Index dividends will be executed separately through a balance statement directly to your trading account, and the comment will be in the following format “Div & Product Name & Net Volume ”.

Please refer to the table below for more details:

The above data is for reference only, please refer to the MT4/MT5 software for specific data.

If you’d like more information, please don’t hesitate to contact [email protected].

Notification of Server Upgrade – September 1, 2023

Dear Client,

As part of our commitment to provide the most reliable service to our clients, there will be server maintenance this weekend.

Maintenance Hours :
2nd of September 2023 (Saturday) 19:00 – 23:59 (GMT+3)

Please note that the following aspects might be affected during the maintenance:

1. The price quote and trading management will be temporarily disabled during the maintenance. You will not be able to open new positions, close open positions, or make any adjustments to the trades.

2. There might be a gap between the original price and the price after maintenance. The gaps between Pending Orders, Stop Loss and Take Profit will be filled at the market price once the maintenance is completed.

3. Please refer to MT4/MT5 for the latest update on the completion and market opening time. Our services will be back online once the maintenance is completed.

Thank you for your patience and understanding about this important initiative.

If you’d like more information, please don’t hesitate to contact [email protected].

Nasdaq Records Fifth Consecutive Gain Amidst Worst Monthly Performance in 2023

The Nasdaq Composite displayed resilience with its fifth successive day of gains, despite encountering its most substantial monthly decline in 2023. Closing at 14,034.97, the tech-centric index rose by 0.11% on Thursday. In contrast, the Dow Jones Industrial Average stumbled by 0.48%, finishing at 34,721.91, and the S&P 500 experienced a minor setback of 0.16%, concluding at 4,507.66.

Stock Market Updates

Although a series of positive sessions managed to alleviate some of the monthly losses for the S&P 500 and the Dow, the broader market index reported a 1.77% decrease, while the Nasdaq endured a 2.17% loss during August. The Dow, composed of 30 stocks, encountered a significant drop of 2.36%. Traders also diligently examined fresh U.S. inflation data, particularly the core personal consumption expenditures index, which matched economists’ projections by increasing 0.2% month over month in July and 4.2% year over year. This index holds particular importance as a gauge of inflation for the Federal Reserve.

Some analysts highlighted the interplay between equities and bonds, noting that declining U.S. Treasury yields remain pivotal for potential near-term stock market growth. Looking ahead, investors are eyeing the upcoming non-farm payroll data release, hoping for signs of a meaningful economic slowdown that could influence the central bank’s stance on benchmark interest rate hikes.

Data by Bloomberg

On Thursday, most sectors experienced a slight decline, with the overall market showing a decrease of 0.16%. However, there were a few areas of growth, notably Consumer Discretionary, which saw a rise of 0.51%, and Information Technology, which increased by 0.37%. Energy and Communication Services also recorded modest gains of 0.15% and 0.11% respectively. On the other hand, sectors like Health Care, Utilities, and Real Estate faced notable losses, with Health Care declining the most at 1.21%.

Currency Market Updates

The dollar index rose 0.45% on Thursday, supported by better US data and one ECB hawk taking notice of the region’s economic headwinds. US consumer spending surged 8% in July, up from 6% in June, and June was revised higher. Jobless claims remained in their recent range, and the August Chicago PMI rebounded to 48.7.

The euro fell 0.7% against the dollar after Wednesday and Thursday’s recovery highs were rejected by the 30-day moving average (DMA) and other resistance levels. Sterling also fell 0.4% after it ran into sellers at its 30-DMA and cloud base. USD/JPY fell 0.57%, putting EUR/JPY down a whopping 1.26%, as relatively static Japanese government bond (JGB) yields contrasted with the 7.8 basis point (bp) drop in German bund yields.

The main event on Friday is the US employment report. Non-farm payrolls are forecast to be 170,000, down from 187,000 in July. Average hourly earnings are forecast to rise 0.3% from July, and the jobless rate is forecast to remain near 50-year lows at 3.5%. August ISM manufacturing is forecast at 47.0, down from July’s 46.4. More important will be ISM services due out on September 6.

Picks of the Day Analysis
EUR/USD (4 Hours)

EUR/USD Declines as Euro Underperforms and US Dollar Posts Mixed Results

The EUR/USD currency pair declined on Thursday as the Euro underperformed against the US Dollar. The failure of the EUR/USD to hold above the 1.0900 level indicates a loss of bullish momentum for the pair. The next direction of the move is likely to depend on the outcome of the US Nonfarm Payrolls (NFP) report, which is due to be released on Friday.

The Euro weakened on Thursday after ECB policymaker Robert Holzmann said that interest rates are not yet at their highest level and that another one or two rate hikes are possible. However, market expectations regarding tightening from the ECB weakened, contributing to the Euro’s slide. Eurozone inflation data did not offer any surprises, but German retail sales showed an unexpected decline in July.

The US Dollar rose against its main European rivals, but the Dollar Index (DXY) lost ground. US consumer inflation figures did not have a significant impact on the US Dollar. Now, the focus turns to Friday’s NFP report, which is expected to show strong job growth. The ISM Manufacturing PMI is also due to be released on Friday.

Chart EURUSD by TradingView

Based on technical analysis, the EUR/USD moves lower on Thursday, reaching below the middle band of the Bollinger Bands. Currently, the price is moving just below the middle band, showing that there’s potential for another lower movement to reach the lower band. The Relative Strength Index (RSI) is currently at 45, signaling that the EUR/USD is moving lower and trying to start the bearish trend.

Resistance: 1.0865, 1.0935

Support: 1.0833, 1.0780

XAU/USD (4 Hours)

XAU/USD Ends August Lower as US Dollar Rebounds

Gold price ended August lower, as the US Dollar staged an impressive rebound, despite the persistent weakness in the US Treasury bond yields. Risk sentiment turned tepid in American trading, as traders resorted to the end-of-the-month settlement while repositioning ahead of Friday’s high-impact US labor market report.

Earlier in the day, the US Dollar maintained its corrective downside, as the mixed set of economic data from the United States bolstered expectations that the Fed could likely end its tightening cycle. However, the US Dollar rebounded in the afternoon, as traders turned risk-off ahead of the US jobs report.

Gold price initially jumped to challenge the monthly high of $1,949, but failed to sustain at higher levels on the US Dollar comeback. The next major support for gold is seen at $1,880, followed by $1,850.

The main event risk of the week is the US Nonfarm Payrolls and the Average Hourly Earnings data, which will likely hint at the Fed’s policy path for the rest of this year. The US economy is expected to add 170K jobs in August, compared with the 187K previous job gain. Average Hourly Earnings are seen steady at 4.4% YoY in August.

Chart XAUUSD by TradingView

Based on technical analysis, the XAU/USD moves lower on Thursday and able to reach the middle band of the Bollinger Bands. Currently, the price is moving near the middle band showing there’s potential for Gold to move in consolidating mode. The Relative Strength Index (RSI) is at 58 currently, showing that the XAU/USD pair is still in a positive mode but might have some correction lower.

Resistance: $1,954, $1,965

Support: $1,936, $1,926

Economic Data
CurrencyDataTime (GMT + 8)Forecast
CHFConsumer Price Index m/m14:300.2%
CADGross Domestic Product m/m20:30-0.2%
USDAverage Hourly Earnings m/m20:300.3%
USDNon-Farm Employment Change20:30169K
USDUnemployment Rate20:303.5%
USDISM Manufacturing PMI22:0046.9

Dividend Adjustment Notice – August 31, 2023

Dear Client,

Please note that the dividends of the following products will be adjusted accordingly. Index dividends will be executed separately through a balance statement directly to your trading account, and the comment will be in the following format “Div & Product Name & Net Volume ”.

Please refer to the table below for more details:

The above data is for reference only, please refer to the MT4/MT5 software for specific data.

If you’d like more information, please don’t hesitate to contact [email protected].

5 Fortnite Tactics That Can Help You Trade Gold Successfully

In online gaming, few titles have garnered as much global attention and devotion as Fortnite. Since its debut almost a decade ago, this game has become a cultural phenomenon, boasting a daily player base of over 30 million. And it’s no wonder why: Fortnite combines exhilarating action with clever strategies that keep players hooked as they battle against 99 opponents on a deserted island.

But here’s the thing: there’s a hidden side to Fortnite that goes beyond what meets the eye. Imagine taking the clever strategies used in Fortnite and using them in a completely different world: gold trading. It might sound unusual to connect the two, but the tactics that make Fortnite players successful can be the same ones that help you succeed in trading gold.

Keep reading to uncover just how your Fortnite skills might help you conquer the gold market in the near future!

1) Optimising Resource Management

Resource management is a skill in Fortnite that separates the best from the rest. Take Bugha, Veno, and Queasy, for example. Their success isn’t just about their incredible aim; it’s also about their ability to allocate resources like wood, metal, and bricks effectively.

Interestingly, resource management is equally important in gold trading. Unlike many other financial instruments, gold is known for being a relatively stable asset. While this means it tends to retain its price when markets are dipping, it also means that upside is limited when markets are booming.

This being the case, traders should be mindful of how much of their capital they allocate to gold. If done prudently, exposure to the gold markets could hedge against inflation, mitigate downswings in times of turbulence, and ensure healthy capital management for sustained trading success.

2) Formulating Strategic Plans

The best Fortnite players possess the talent to construct defensive structures in accordance with a defined game plan. Whether it’s fortifying defences in the endgame or gradually developing structures throughout the game, everything they do is timed, precise, and carried out with a specific purpose in mind.
Similarly, gold trading requires the same sort of strategic thinking, given the number of factors that can impact its price. Given its reputation for stability, the demand for gold tends to surge in uncertain economic conditions Additionally, as gold is priced based on the dollar, any price movements for the dollar can typically also result in an inverse movement for gold.

Much like Fortnite players have to plan their approach to the map from the moment they drop, traders must hence also develop a long-term plan for their gold investments. Doing the necessary research and pre-planning to spot volatile market conditions or likely dollar movements can often pay off handsomely.

3) Adapting to Change

From the moment a Fortnite player steps foot on a map, they are thrust into a world of infinite possibilities. With randomly spawning supply drops, frequent map and weapon system updates, and a multitude of strategies from fellow players, the game always presents new challenges and surprises. As a result, Fortnite players must not only enter the game with preconceived strategies but also cultivate adaptability to navigate ever-changing environments and opponents.

Similarly, gold traders face analogous experiences in their trading endeavours. Aside from broader macroeconomic factors, the price of gold can also be heavily influenced by short-term trends and day-to-day news. As a result, traders must always remain vigilant and be prepared to adjust their strategies accordingly.

For anyone entering gold trading, staying abreast of market news is imperative. By ensuring comprehensive coverage of potential entry and exit points, traders can stay ahead of the game even in the face of changing conditions.

4) Teaming Up for Victory

Fortnite is not limited to solo gameplay. For those who enjoy the complexity of teamwork, there are various game modes available. Modes like 50v50 or Beach Assault allow teams of players to compete against each other, fostering coordination and cooperation. Meanwhile, duos—where pairs of players battle it out—offer a classic Fortnite experience.

These cooperative modes provide a refreshing break from the often toxic and individualistic nature of ambitious solo players and the ranking system they live and die by.
Similarly, while gold trading might be perceived as a cutthroat activity, it can also be a rewarding collaborative experience. By connecting with industry experts and gaining valuable insights and skills, traders can often expand their horizons and become more successful in the markets.

Additionally, participating in networking events and engaging with trading communities can lead to the creation of new friendships and an invaluable support network for dealing with the stresses of trading.

5) Perfecting Your Timing

While Fortnite games can go on seemingly forever—to the chagrin of mums and spouses across the globe—being able to manage your time is still an indispensable aspect of getting good at Fortnite.

Anticipating supply drops is often the deciding factor for many players, especially as they reach the end game when resources have been exhausted. The precise timing of weapon usage is also crucial, as a single misfire can be fatal and shatter battle royale dreams within seconds.

With gold being one of the oldest and most traded assets globally, there is an abundance of historical charts and data available for developing trading strategies. Traders who are willing to utilise technical analysis and historical data might find a potential edge on the rest of the market when deciding when to enter and exit a position.


Ready to put these tactics to the test and trade gold like a Fortnite champion? Open your VT Markets trading account here and secure your victory royale.

S&P 500 Gains on Four-Day Streak Amid Economic Data Evaluation

The S&P 500 extended its winning streak to four days, rising 0.38% and surpassing 4,500 points to close at 4,514.87. The Dow Jones Industrial Average added 0.11%, while the tech-oriented Nasdaq Composite advanced 0.54% to 14,019.31. The S&P’s recent gains helped trim month-to-date losses to approximately 1.6%. The tech sector saw an upswing with chipmaker Nvidia contributing to the rise, and Apple’s shares climbing nearly 2% as anticipation for the iPhone 15 unveiling event on September 12 grew.

Investors have reacted positively to underwhelming economic data for the second consecutive day. Disappointing payrolls data showed that private employers added only 177,000 jobs in August, well below expectations and the previous month’s figure. Additionally, the annual gross domestic product growth forecast was revised downward from 2.4% to 2.1%. This market behavior indicates a hopeful perspective that weaker economic data might lead to adjustments in the Federal Reserve’s policy stance.

Data by Bloomberg

On Wednesday, the S&P 500 showed a 0.38% overall increase. The Information Technology sector led the gains with a significant rise of 0.83%, followed by Energy at 0.51% and Industrials at 0.44%. Communication Services and Real Estate both recorded a 0.35% uptick, while Consumer Discretionary saw a 0.33% increase. Meanwhile, Consumer Staples and Materials experienced more modest growth with gains of 0.17% and 0.15%, respectively. Financials and Health Care registered smaller gains, rising by 0.12% and declining by 0.03%, respectively. Utilities were the only sector to show a notable decrease, falling by 0.42%.

Major Pair Movement

The dollar index decreased by 0.37% due to underwhelming revisions and significant drops in JOLTS and consumer confidence data. The impact of this setback hinges on the forthcoming core PCE on Thursday and the employment report on Friday, which will provide clearer insights into the dollar’s trajectory. While mid-week U.S. data hold less significance for the Fed’s primary inflation and employment assessments, the misses prompted EUR/USD to reach a two-week high, rising 0.4% on Wednesday and 1.63% from August’s lows.

EUR/USD’s advance surpassed multiple technical indicators, such as the downtrend line across July and August highs, the 21- and 100-day moving averages, and last week’s 1.0930 high. The upward momentum paused near the 30-day moving average at 1.0948, favored by trend followers, and the 61.8% retracement level of August’s drop. The British pound increased by 0.6%, encountering resistance near its 30-day moving average at 1.2747. The Bank of England (BoE) is projected to initiate two more 25bp rate hikes to address UK inflation, which stands at 5.3% compared to 3.2% in the U.S.

The Japanese yen gained 0.2%, but its appeal remains limited due to the BoJ’s negative rates and doubts about a near-to-medium-term shift from ultra-easy policies. Treasury-JGB yield spreads declined from recent highs, and market participants are waiting for U.S. inflation, employment, and ISM manufacturing reports to ascertain the direction of the trend. The Australian dollar remained steady, while USD/CNH rose 0.24% following weaker-than-forecast data and attempts to stimulate the sector. Upcoming events include euro zone CPI, U.S. core PCE, jobless claims, and Chicago PMI.

Picks of the Day Analysis
EUR/USD (4 Hours)

EUR/USD ‘s Upside Momentum Pauses Amidst Greenback Correction

The EUR/USD pair reached two-week highs at 1.0947 but retraced slightly, maintaining its position above 1.0900. The prevailing upward bias is fueled by US Dollar corrections due to recent disappointing US data, while Eurozone inflation rates suggest potential European Central Bank tightening. Despite the data undershooting expectations, upcoming US economic figures remain pivotal, including the Core Personal Consumption Expenditure Price Index and Jobless Claims on Thursday, followed by Friday’s Nonfarm Payrolls report. The US fundamentals’ relative strength compared to the Eurozone may cap further upside potential in the EUR/USD pair.

Chart EURUSD by TradingView

Based on technical analysis, the EUR/USD moves higher on Wednesday, reaching the upper band of the Bollinger Bands. Currently, the price is moving just below the upper band, showing that there’s potential for another higher movement. The Relative Strength Index (RSI) is currently at 65, signaling that the EUR/USD is in a bullish trend.

Resistance: 1.0935, 1.1003

Support: 1.0893, 1.0833

XAU/USD (4 Hours)

XAU/USD Hits Four-Week High as US Dollar Weakens Amid Fed Speculation

The US Dollar’s decline continued on Wednesday, driving XAU/USD to a four-week high of $1,949.02 per troy ounce, prompted by weak macroeconomic data fueling speculation of an impending end to the Federal Reserve’s tightening cycle. The USD’s descent was exacerbated by discouraging figures, including a decrease in private job creation in August and a downward revision of Q2 Gross Domestic Product to 2.1% QoQ. While stock markets gained modestly and government bond yields retreated, expectations for the Fed to remain on hold in September rose to 88.5%. However, discussions of the Fed pressuring regional banks to bolster liquidity strategies led to Wall Street pulling back from recent highs. Attention now shifts to US inflation data, with the July Core Personal Consumption Expenditures (PCE) Price Index expected to show a 5.3% YoY increase in August, potentially impacting rate hike expectations.

Chart XAUUSD by TradingView

Based on technical analysis, the XAU/USD moves higher on Wednesday and creating a push to the upper band of the Bollinger Bands. Currently, the price is moving below the upper band higher showing there’s potential for Gold to move even higher. The Relative Strength Index (RSI) is at 70 currently, showing that the XAU/USD pair is still in a positive mode but might have some correction lower.

Resistance: $1,954, $1,965

Support: $1,936, $1,926

Economic Data
CurrencyDataTime (GMT + 8)Forecast
USDCore PCE Price Index m/m20:300.9%
USDUnemployment Claims20:30236K
Back To Top
server

Hello there 👋

How can I help you?

Chat with our team instantly

Live Chat

Start a live conversation through...

  • Telegram
    hold On hold
  • Coming Soon...

Hello there 👋

How can I help you?

telegram

Scan the QR code with your smartphone to start a chat with us, or click here.

Don’t have the Telegram App or Desktop installed? Use Web Telegram instead.

QR code