New contracts will automatically be rolled over as follows:
Please note:
• The rollover will be automatic, and any existing open positions will remain open.
• Positions that are open on the expiration date will be adjusted via a rollover charge or credit to reflect the price difference between the expiring and new contracts.
• To avoid CFD rollovers, clients can choose to close any open CFD positions prior to the expiration date.
• Please ensure that all take-profit and stop-loss settings are adjusted before the rollover occurs.
• All internal transfers for accounts under the same name will be prohibited during the first and last 30 minutes of the trading hours on the rollover dates.
If you’d like more information, please don’t hesitate to contact [email protected].
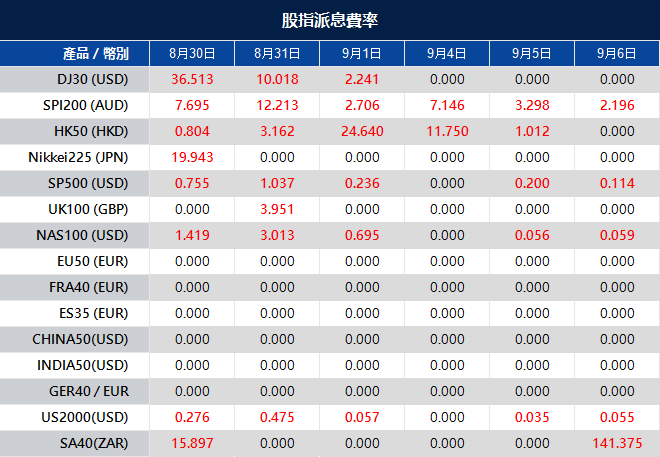
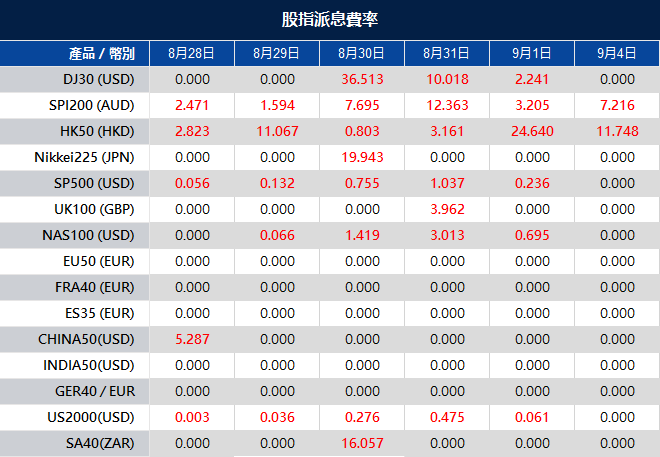
Please note that the dividends of the following products will be adjusted accordingly. Index dividends will be executed separately through a balance statement directly to your trading account, and the comment will be in the following format “Div & Product Name & Net Volume ”.
Please refer to the table below for more details:
The above data is for reference only, please refer to the MT4/MT5 software for specific data.
If you’d like more information, please don’t hesitate to contact [email protected].
Investors rallied around tech stocks, propelling the Nasdaq Composite up by more than 1% on Tuesday, seeking respite in the closing stages of a challenging August for the market. The tech-centric index surged 1.74% to reach a closing figure of 13,943.76. Similarly, the S&P 500 marked its most robust performance since June 2, surging 1.45% to conclude at 4,497.63, while the Dow Jones Industrial Average managed a 0.85% rise, accumulating 292.69 points to cap off the session at 34,852.67.
Leading the ascent among tech stocks was chipmaker Nvidia, boasting a gain of over 4%, with Meta Platforms, Tesla, Apple, and Microsoft also closing the day in positive territory. The sector found support in declining bond yields prompted by the release of fresh U.S. economic data. Moreover, AT&T’s shares climbed 3.9% on the back of a Citi upgrade, while Best Buy saw a 3.8% increase after reporting better-than-anticipated earnings. As the month of August concludes, the Dow is projected to record a 1.9% dip, with the S&P 500 and Nasdaq anticipated to incur losses of 1.9% and 2.8%, respectively.
On Tuesday, all sectors of the market showed positive movement, with an average increase of 1.45%. Communication Services experienced the highest gain, rising by 2.46%, followed closely by Consumer Discretionary at 2.35% and Information Technology at 2.11%. Other notable sector increases included Materials at 1.68%, Real Estate at 1.15%, Financials at 0.88%, Health Care at 0.83%, Industrials at 0.78%, Consumer Staples at 0.41%, Energy at 0.30%, and Utilities at 0.28%.
Major Pair Movement
The dollar index started with gains but ended with a 0.55% loss due to disappointing JOLTS and consumer confidence data, causing Treasury yields to drop significantly. This shift, along with recent remarks from central bank leaders, suggests the Fed might prioritize rate cuts over hikes in 2024. Further U.S. data this week will likely influence this view. Despite initially strong levels, the dollar index’s momentum waned after speeches by Fed Chair Jerome Powell, ECB President Christine Lagarde, and BoJ Governor Kazuo Kuroda. EUR/USD stayed above key supports while USD/JPY reached new 2023 highs. However, Tuesday’s U.S. data led to a 0.64% gain for EUR/USD, raising it from crucial supports.
The ECB is leaning toward a rate hike by October, while the likelihood of a September hike is uncertain. Sterling rose 0.44%, hindered slightly by EUR/GBP clearing resistance, yet still reclaiming its 100-day moving average. The Australian dollar surged by 0.86% as falling Treasury yields boosted higher-risk assets. It also benefited from increased commodity prices and positive economic prospects after Chinese state banks lowered mortgage rates. Australian CPI data and the RBA’s stance on potential rate hikes will be closely watched. USD/CNH declined 0.15%, remaining within its recent range due to skepticism surrounding the resolution of structural issues impacting the Chinese economy. The upcoming release of German CPI, ADP data, and U.S. pending home sales on Wednesday, followed by more crucial U.S. data on Thursday and Friday, will further shape market trends.
Picks of the Day Analysis
EUR/USD (4 Hours)
EUR/USDSurges Amidst Dollar Weakness Triggered by Economic Data
The EUR/USD saw its most substantial daily gain in a month on Tuesday, surging from below 1.0800 to near 1.0900, driven by a notable correction in the weakening US Dollar, which stemmed from disappointing US economic indicators and a decline in Treasury bonds. US data unveiled employment setbacks, particularly in the JOLTS report and CB Consumer Confidence index, which led to a decline in US Treasury yields, applying downward pressure on the US Dollar. The DXY index dropped below 103.50 after being at 104.40. Upcoming economic data releases, including the ADP private employment report and US consumer inflation data, may continue to impact the US Dollar’s trajectory.
Based on technical analysis, the EUR/USD moves higher on Tuesday, reaching the upper band of the Bollinger Bands. Currently, the price is moving around the upper band, showing that there’s potential for another higher movement. The Relative Strength Index (RSI) is currently at 59, signaling that the EUR/USD is trying to move higher into a bullish trend.
Resistance: 1.0874, 1.0935
Support: 1.0833, 1.0789
XAU/USD (4 Hours)
XAU/USD Surges as US Economic Data Points to Easing Monetary Measures
On Tuesday, the XAU/USD shifted its trajectory, surging to $1,938.08 per troy ounce, driven by US macroeconomic indicators that suggested a potential conclusion to the monetary tightening cycle. The US Dollar faced a sharp decline after the US Bureau of Labor Statistics reported fewer job openings than expected, indicating a loosening labor market trend. The number of job openings stood at 8.82 million in July, down from the anticipated 9.46 million.
Adding to this, Consumer Confidence dwindled to 106.1 in August from 114.0 in July, reflecting a decrease in household demand. As a result, financial markets are increasingly predicting the Federal Reserve will maintain rates in the upcoming September meeting, with the likelihood of a 25 basis points hike in November dropping from 50.9% to 44.5%. This news spurred Wall Street to reach new weekly highs, and Treasury bond yields experienced a downturn, with the 10-year note yielding 4.12% (down 8 bps) and the 2-year note offering 4.88% (down 12 bps).
Based on technical analysis, the XAU/USD moves higher on Tuesday and trying to widen the bands for the Bollinger Bands. Currently, the price is trying to push the upper band higher showing there’s potential for Gold to move even higher. The Relative Strength Index (RSI) is at 73 currently, showing that the XAU/USD pair is still in a positive mode.
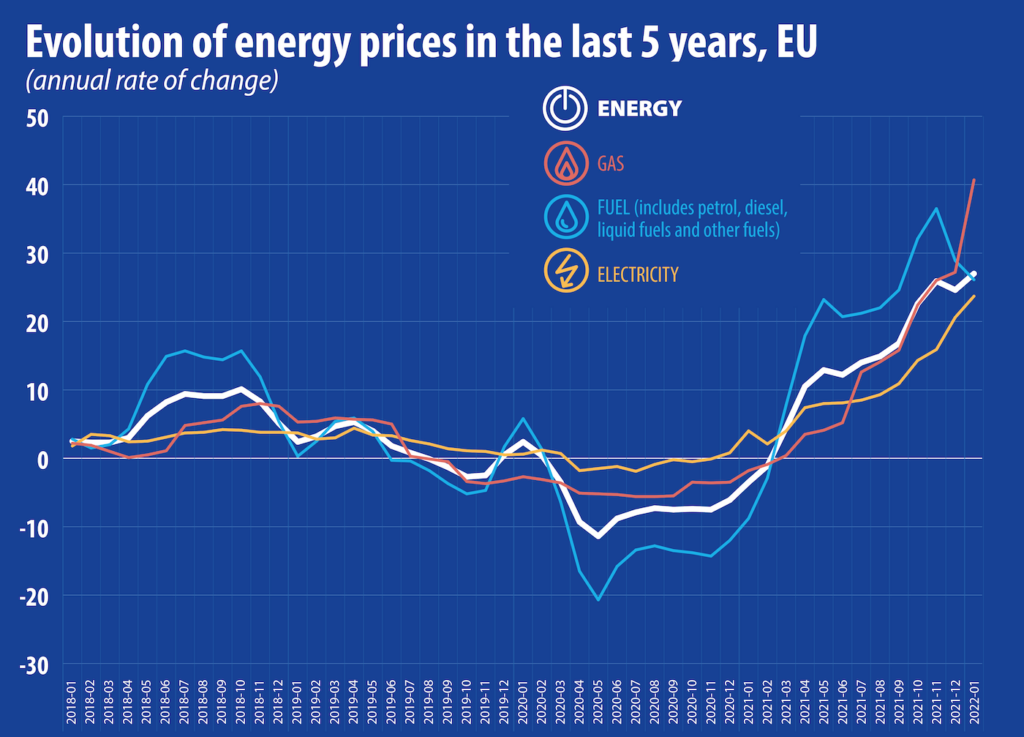
Energy commodities are like the unsung heroes behind our everyday routines, quietly driving the world forward.
Imagine this: the energy in a single gallon of gasoline can power a bicycle for two weeks straight. Now, let’s think big—when you flip a light switch, charge your phone, or start your car, you’re tapping into the huge energy sources that keep our modern lives running.
Now, here’s the eye-opening part: every day, a massive 100 million barrels of oil are used around the world. Wrap your head around that number—it fuels millions of homes, keeps countless vehicles on the move, and supports industries making everything from clothes to gadgets. This unending demand is what makes energy trading so captivating.
In this guide, we’ll dive into the nitty-gritty of energy trading, making the confusing stuff simple and highlighting the tactics used by smart investors to navigate this ever-changing market. Whether you’re trying to improve your trading skills or expand your investments, this guide is here to give you the knowledge you need to make good choices. Join us as we explore the energy trading world, breaking down its complexity to uncover the amazing potential hidden in energy resources—one barrel at a time.
Energy Commodities
Think of commodities as the building blocks of the global economy—the things that make everything tick. We can split them into two main groups: hard commodities and soft commodities. And each of these groups has its own little subdivisions:
Energies: This is where we find stuff like crude oil, heating oil, gasoline, and natural gas.
Precious Metals: This includes valuable things like gold, silver, and palladium, dug up from deep within the Earth.
Agriculture: This is all about the crops we grow for food, like sugar and wheat, as well as stuff like timber for building.
Livestock and Meat: This is about raising animals like cattle, sheep, and hogs. They can end up as food or be used for things like gelatine and leather.
Among these, energy is the real star. It’s super popular to trade because it’s what keeps our world spinning. Imagine if there was no energy—we’d be stuck without transportation, phones, computers, and all sorts of machines. That’s why energy trading is a big deal for investors like you.
On the global stage, we have both renewable and non-renewable energy sources. These are things we can trade all over the world:
Renewable Energy: This is stuff like solar power, wind power, hydropower (that’s power from water), and geothermal power (from the Earth’s heat).
Non-renewable Energy: This covers things like crude oil, petroleum products, natural gas, coal, and nuclear energy.
source: europa.eu
Understanding the Energy Trading Market
The world of energy trading is a dynamic space where the exchange, buying, selling, and predictions about energy commodities unfold across the global financial stage.
Through these interactions, benchmarks for the value of different commodities are set, influenced by a dance of factors that tug at the balance between supply and demand. Traders, guided by their predictions of energy price shifts, jump into or wrap up trading positions accordingly.
When we dig into the factors driving the rollercoaster of energy prices, a few key points come to light:
Growth in emerging markets: While developed countries tend to have steady energy demands, emerging markets paint a different story. These up-and-coming regions are on a fast track of growth, and their energy needs are shooting up. This surge in demand is set to have a big say in how energy commodities are priced, especially for resources favoured by rapidly growing economies.
Population growth: The path of global population growth has a hefty impact on energy prices. With Earth’s population expected to keep climbing, the race for available energy resources heats up. While this affects all countries, it’s a particularly big deal for giants like China and India. These places are dealing with booming populations and people flocking to cities, which cranks up their energy usage.
Energy penetration: Despite energy having a wide reach, large chunks of the developing world still lack access to electricity. As these regions take steps forward economically and industrialise, energy access spreads like wildfire, and you guessed it—demand shoots up.
Industrialisation and developing economies: The rise of new global players marks an era of supercharged industrialisation and the matching hunger for energy. The energy choices these rising powers make are pivotal, adding to the buzz around certain energy sources. For traders looking ahead, understanding the energy paths countries like China and India take to meet their energy needs is a must.
Energy efficiency: On the horizon, energy trading faces the challenge of the developed world’s relentless quest for more energy-efficient ways. This involves swapping out old-school energy sources for clean, renewable options. The ripple effects include a possible slowdown in demand for non-renewable resources in developed countries, contrasted with a growing appetite for sources like solar and wind power.
source: forgedcomponents.com
How Energy Trading Works
Navigating the energy trading market offers a multitude of paths for investors to explore, each with its distinct advantages and intricacies. Let’s embark on a journey to uncover these diverse approaches:
Physical Commodities Trading
One route involves direct engagement with tangible energy commodities such as oil, natural gas, or heating oil. This entails buying and selling the actual materials. However, this path is often less chosen by individual traders due to the challenges associated with logistics and storage.
Energy Stocks
Another avenue is investing in the stocks of energy companies. For instance, purchasing shares in major oil corporations lets you indirectly partake in the shifts of the energy market itself.
Derivatives Trading
Derivatives like energy CFDs (contracts for difference) and spread betting provide a way to speculate on energy price movements without having to own the underlying assets. These tools offer flexibility and the potential for gains in both upward and downward markets.
Energy ETFs
Exchange-traded funds (ETFs) are like investment bundles that group together energy-related stocks. This strategy grants you diversification by allowing you to invest in a broader slice of the energy market without needing to handpick individual stocks.
How to Trade Energies with VT Markets?
Energy commodity markets are known for their high volatility, offering opportunities for short-term gains and often serving as a safe haven for investors in uncertain times.
To begin trading energy stocks, commodities, or ETFs, consider practicing in a risk-free environment. VT Markets provides an obligation-free demo account, allowing you to simulate opening and closing positions. With 90 days to explore, you can learn about energy trading dynamics and understand how factors affect prices, including oil CFDs and energy company stocks.
In addition to monitoring price charts and trends, a robust energy trading strategy includes staying informed about breaking energy commodity news. Keeping up with the latest developments impacting the energy sector and reading expert analyses is crucial.
Remember, trading energy stocks may require in-depth analysis, as stock movements don’t always directly mirror commodity prices. VT Markets offers daily market analysis to help you gauge the impact of breaking news on your portfolio.
Ready to trade energies in a user-friendly live trading environment? VT Markets can have you up and running, opening your first position in just minutes. Create your live trading account today and explore the potential opportunities the energy market holds to elevate your portfolio.
Summary:
Energy trading offers potential rewards due to constant demand and volatility.
Energy commodities encompass hard and soft commodities, with energies like oil, natural gas, and renewables being prominent.
Energy prices are influenced by factors like emerging markets, population growth, energy penetration, and industrialisation.
Strategies for trading energy include physical commodities trading, energy stocks, derivatives trading (CFDs), and energy ETFs.
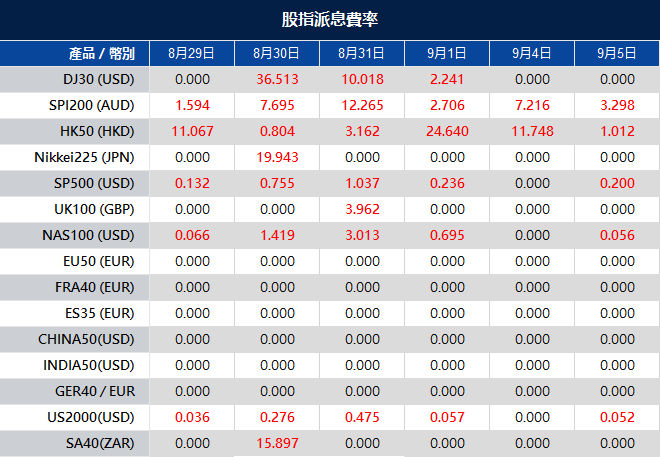
Please note that the dividends of the following products will be adjusted accordingly. Index dividends will be executed separately through a balance statement directly to your trading account, and the comment will be in the following format “Div & Product Name & Net Volume ”.
Please refer to the table below for more details:
The above data is for reference only, please refer to the MT4/MT5 software for specific data.
If you’d like more information, please don’t hesitate to contact [email protected].
Stocks started the final trading week of August on a positive note, with Wall Street striving to recover from a month of losses. The Dow Jones Industrial Average surged by 0.62%, gaining 213.08 points to close at 34,559.98. The S&P 500 climbed 0.63% to reach 4,433.31, and the Nasdaq Composite advanced by 0.84% to finish at 13,705.13. August has witnessed losses across all three indexes, with the S&P 500 declining by 3.4%, and the Nasdaq and Dow slipping by about 4.5% and 2.8% respectively. The tech sector, which suffered a 4.6% drop this month, made efforts to recover as certain tech giants like Meta, Apple, and Nvidia showed slight gains. Meanwhile, other sectors, such as 3M, made notable moves driven by company news.
The rally on Monday was characterized by a broader market participation, with 10 of the 11 sectors in the S&P 500 showing positive momentum. Notably, the rally appeared to favor cyclical stocks over tech, as investors responded to stronger-than-expected growth beyond the U.S. borders. The positive sentiment followed Federal Reserve Chair Jerome Powell’s recent remarks, in which he indicated cautiousness in proceeding with further interest rate hikes despite signs of ongoing economic growth and robust consumer spending. Traders were assigning over a 20% probability of another rate hike during the upcoming September meeting. The week ahead holds significance with the release of the Fed’s preferred inflation gauge, the personal consumption expenditures index, and fresh non-farm payroll data.
On Monday, the overall market saw a positive movement of 0.63%. The Communication Services sector led the gains with a notable increase of 1.05%, followed by Information Technology at 0.81% and Industrials at 0.78%. Real Estate, Materials, and Energy sectors also displayed positive growth, each rising by 0.77%, 0.74%, and 0.73% respectively. Financials experienced a moderate gain of 0.59%, while Consumer Staples and Consumer Discretionary sectors showed more modest increases of 0.46% and 0.37%. Health Care saw a slight uptick of 0.23%, while the Utilities sector had a minor decrease of -0.04%.
Major Pair Movement
The dollar index showed a slight decline on Monday as London observed a bank holiday. Investors grappled with mixed messages from central bankers following the Jackson Hole symposium. While the Bank of Japan (BoJ) Governor leaned dovish, other central banks left their stance ambiguous. The market eagerly awaited upcoming key data releases for clearer guidance.
A rebound in risk appetite, partially triggered by China’s efforts to bolster its slowing growth and curb investment outflows, had a minor impact on safe-haven currencies like the dollar and yen. Meanwhile, risk-sensitive currencies such as the Australian dollar and sterling received support, rising by 0.27% and 0.19% respectively. EUR/USD gained 0.12%, and USD/JPY remained relatively stable.
Following the Jackson Hole event, the Federal Reserve is likely to raise rates by 25 basis points at its November meeting if U.S. data remains robust. The European Central Bank (ECB), facing weaker euro zone data and inflation concerns, may raise rates by 25 basis points as early as September. Fed Chair Jerome Powell emphasized the need for more data before considering rate hikes, while ECB President Christine Lagarde highlighted potential inflation risks. With the focus on upcoming euro zone and U.S. data, market attention is on economic indicators, including CPI, core PCE, employment data, and ISM manufacturing reports for August. The dollar’s trajectory against the yen depends on U.S. data and Treasury yields, while sterling remained relatively unaffected by hawkish comments from the Bank of England Deputy Governor, already priced in due to inflation concerns.
Picks of the Day Analysis
EUR/USD (4 Hours)
EUR/USDRises Amid Weaker US Dollar, Markets Anticipate Key Economic Data
The EUR/USD currency pair experienced a modest increase on Monday, benefitting from a softened US Dollar after recording its lowest close since mid-June following Jerome Powell’s Jackson Hole speech. As crucial economic reports loom, there’s potential for increased market volatility.
The US Dollar started the week on a weaker note, driven by an improved market sentiment supported by China’s additional measures. This led to gains in US and European stocks and a decline in government bond yields. This environment weighed on the US Dollar, causing the US Dollar Index to retreat towards 104.00.
In terms of economic data, the Dallas Fed Manufacturing Index exhibited improvement, albeit not overwhelmingly positive. Attention is now focused on forthcoming employment and inflation data. The week’s agenda includes the release of the JOLTS Job Openings report. Similarly, European markets are keenly awaiting inflation reports, with preliminary August Consumer Price Index (CPI) data set to be unveiled across Eurozone countries. Additionally, the German Gfk Consumer Confidence survey is due for release. The convergence of these data points suggests the potential for market-moving shifts.
In line with technical analysis, the EUR/USD moves slightly higher on Monday, reaching the middle band of the Bollinger Bands. Currently, the price is moving slightly above the middle band, showing that there’s potential for another higher movement to target the upper band. The Relative Strength Index (RSI) is currently at 49, signaling that EUR/USD is trying to move back to the neutral stance.
Resistance: 1.0874, 1.0935
Support: 1.0789, 1.0740
XAU/USD (4 Hours)
XAU/USD Surges to Three-Week High as China Initiates Measures, Market Eyes Economic Data
Spot Gold experienced a surge against the US Dollar, propelling the XAU/USD pair to a three-week high at $1,926.04 per troy ounce. The week commenced with financial markets closely observing China’s moves to bolster the Yuan. China’s economy, grappling with challenges since abandoning the zero-covid policy in December 2022, has struggled to regain pre-pandemic growth levels.
China’s reduction of the stamp duty on stock trading by 50% over the weekend, coupled with a higher-than-expected fixed rate for USD/CNY set by the People’s Bank of China (PBoC), exerted downward pressure on the USD, leading to minor losses against major counterparts. Despite this, the USD maintained its position near recent highs across currency markets. Gold experienced an uptick during the American session, partly influenced by rising government bond yields and a retreat in US indexes from their intraday highs.
However, Gold’s intraday gains were mostly reined in as market participants await key news for clearer market direction. The upcoming macroeconomic calendar features significant data releases, including Germany and the Euro Zone’s preliminary estimates of the Harmonized Index of Consumer Prices (HICP) for August. Likewise, the United States is set to publish the July Core Personal Consumption Expenditures (PCE) Price Index, a preferred inflation gauge by the Federal Reserve, along with multiple employment indicators leading up to the eagerly anticipated August Nonfarm Payrolls report on Friday.
Using technical analysis, the XAU/USD moves slightly higher on Monday and trying to widen the bands for the Bollinger Bands. Currently, the price is trying to push the upper band higher showing there’s potential for Gold to move even higher. The Relative Strength Index (RSI) is at 65 currently, showing that the XAU/USD pair is still in a positive mode.
Please note that the dividends of the following products will be adjusted accordingly. Index dividends will be executed separately through a balance statement directly to your trading account, and the comment will be in the following format “Div & Product Name & Net Volume ”.
Please refer to the table below for more details:
The above data is for reference only, please refer to the MT4/MT5 software for specific data.
If you’d like more information, please don’t hesitate to contact [email protected].
This week, keep a close watch on Australia’s Consumer Price Index (CPI), the US Core Personal Consumption Expenditure (PCE) Price Index, and the US Jobs Report. These indicators could substantially impact market sentiment, amplifying the need for traders to exercise caution and stay well-informed to optimise their trading efforts throughout the week.
Here are some market highlights for the upcoming week:
US JOLTS Job Openings (29 August 2023)
Figures from the US Job Openings and Labour Turnover Survey (JOLTS) indicate that the number of job openings in the US fell by 34,000 to 9.58 million in June 2023, the lowest level since April 2021.
The figures for July 2023 will be released on 29 August, with analysts expecting a slight drop to 9.57 million.
Australia’s CPI (30 August 2023)
Australia’s Consumer Price Index was up by 5.4% in June 2023, easing from the 5.5% rise observed in May 2023.
Analysts predict a slower growth rate of 5.2% in the figures for July 2023, set to be released on 30 August.
US Core PCE Price Index (31 August 2023)
Core PCE prices in the US, excluding food and energy, experienced a 0.2% increase in June 2023, easing from the 0.3% rise seen in May 2023.
The data for July 2023 is set to be released on 31 August, with analysts expecting a 0.2% growth.
US Jobs Report (1 September 2023)
The US economy created 187,000 jobs in July 2023, while the unemployment rate decreased to 3.5%.
The figures for August 2023 will be released on 1 September, with analysts forecasting the addition of 180,000 more jobs. The unemployment rate is expected to maintain its level at 3.5%.
ISM Manufacturing PMI (1 September 2023 )
The ISM Manufacturing Purchasing Managers’ Index (PMI) for the US rose to 46.4 in July 2023 from 46 in June 2023.
Analysts predict a reading of 46.6 in the index for August 2023, scheduled for release on 1 September.
Please note that the dividends of the following products will be adjusted accordingly. Index dividends will be executed separately through a balance statement directly to your trading account, and the comment will be in the following format “Div & Product Name & Net Volume ”.
Please refer to the table below for more details:
The above data is for reference only, please refer to the MT4/MT5 software for specific data.
If you’d like more information, please don’t hesitate to contact [email protected].