Dow Jones Surges to One-Month High Amid IPO Enthusiasm and Positive Indicators

The Dow Jones Industrial Average saw a robust rally, achieving its strongest performance in over a month, propelled by renewed excitement in Wall Street’s IPO sector and positive economic signals. The Dow surged by 331.58 points, or 0.96%, closing at 34,907.11, marking its first close above the 50-day moving average since September 1st. This substantial gain, the best since August 7th, was mirrored in the S&P 500, which rose by 0.84%, reaching 4,505.10, and the Nasdaq Composite, which saw a 0.81% increase, reaching 13,926.05. Arm, the chip design firm, also made headlines with a 24.7% surge following its successful IPO, injecting confidence into a previously dormant IPO market. Additionally, encouraging economic reports, including moderate core inflation and robust retail sales, suggested a balanced approach between inflation control and economic stability, aligning with the Federal Reserve’s goals. The US dollar strengthened due to the euro and pound weakening against it, influenced by the European Central Bank’s rate hike. Traders are closely monitoring the EUR/USD pair, considering its potential to fall below May lows, impacting speculative positions and Treasury-bond yield spreads after the Federal Reserve meeting. The rise in oil prices added to the risk-on sentiment, but concerns about its effects on inflation and discretionary spending complicated the Fed’s rate hike decisions. Amid global economic uncertainties, traders are closely watching various indicators to determine the future of the US dollar and its implications for financial markets.

Stock Market Updates

The Dow Jones Industrial Average experienced a significant rally, marking its strongest performance in over a month, driven by renewed enthusiasm in Wall Street’s IPO market and positive economic indicators. The Dow surged by 331.58 points, or 0.96%, reaching 34,907.11, with this being the first time it closed above its 50-day moving average since September 1st. This substantial gain was also the best day for the blue-chip average since August 7th. Similarly, the S&P 500 gained approximately 0.84%, reaching 4,505.10, while the Nasdaq Composite saw a 0.81% increase, reaching 13,926.05. Notably, chip design company Arm made headlines as its shares surged by 24.7% following its initial public offering (IPO), which was priced at $51 a share and closed at $63.59 a share on its first day of trading. This successful IPO has injected confidence into the market, suggesting the possibility of a revitalized IPO market after a relatively dormant 18-month period.

Additionally, investors received encouraging economic reports, with indications of moderate core inflation and a resilient consumer. The August producer price index showed that core PPI, excluding food and energy, rose by 0.2%, in line with economists’ expectations. However, the headline number increased by 0.7%, surpassing the expected 0.4% rise. August retail sales also outperformed expectations, surging by 0.6%, compared to the forecasted 0.1% increase, with a similar increase of 0.6% when excluding auto sales. These reports suggest a favorable balance between inflation control and economic stability, potentially aligning with the Federal Reserve’s efforts to achieve a soft landing. While the Fed is expected to maintain its current policies in its September meeting, the European Central Bank raised rates by a quarter of a percentage point but indicated that inflation was easing, hinting at a potential end to its rate-hiking campaign. Meanwhile, Adobe was anticipated to release quarterly results after the market closed on Thursday.

Data by Bloomberg

On Thursday, across all sectors, the market showed a positive performance, with a gain of 0.84%. The Real Estate sector performed exceptionally well, with an increase of 1.71%, followed closely by Utilities at 1.47% and Materials at 1.40%. Other sectors also saw gains, with Energy rising by 1.26%, Communication Services by 1.18%, Industrials by 0.99%, Consumer Discretionary by 0.88%, Financials by 0.87%, Consumer Staples by 0.82%, Information Technology by 0.70%, and Health Care lagging behind with a modest increase of 0.25%.

Currency Market Updates

The US dollar saw a notable rise in value, with the dollar index increasing by 0.6%. This increase was primarily driven by the weakening of the euro (EUR) and the British pound (GBP) against the dollar (USD), resulting in a 0.85% decline in the EUR/USD pair. This drop in the EUR/USD pair was influenced by the European Central Bank (ECB) raising rates, indicating that it might be their last hike before a rate cut in the following year. Despite higher inflation in the eurozone, the market perceived minimal risk of further rate hikes by the ECB. This shift in currency dynamics was further reinforced by positive US economic data, including above-forecast retail sales and Producer Price Index (PPI) reports, which were attributed to rising prices. As a result, traders and investors are closely monitoring the EUR/USD pair, expecting it to potentially fall below its May lows, with broader implications on speculative positions and Treasury-bund yield spreads, especially after the upcoming Federal Reserve meeting.

The US dollar also faced pressure from the Australian and Canadian dollars due to increased risk-on sentiment, driven in part by perceptions that the ECB and the Federal Reserve have concluded their tightening cycles. The rise in oil prices, with WTI prices up 7.8% in the current month, raised concerns about the impact on discretionary spending, tightening credit conditions, and rising inflation, potentially complicating the Federal Reserve’s decision-making regarding rate hikes. As the global economic landscape remains uncertain, traders are closely monitoring various economic indicators, including Chinese data and US industrial production and Michigan sentiment figures, to gauge the future direction of the US dollar and its implications for financial markets.

Picks of the Day Analysis
EUR/USD (4 Hours)

EUR/USD Downtrend Continues After ECB’s Final Rate Hike

The Euro faced a significant decline following the European Central Bank’s unexpected 25 basis point rate hike, which the market interpreted as the final move in this direction. Despite some analysts and Governing Council members hoping for a pause, ECB President Lagarde’s decision spurred the Euro’s fall. The US Dollar, on the other hand, gained strength during the American session thanks to better-than-expected US economic data, including a notable increase in the Producer Price Index and positive retail sales figures. With the Euro’s vulnerability persisting due to the combination of robust US data and the dovish ECB rate hike, further losses may occur in response to changing market sentiment.

Chart EURUSD by TradingView

According to technical analysis, EUR/USD moved flat on Wednesday and is currently trading just around the middle band of the Bollinger Bands. This movement suggests the possibility of further consolidation. The Relative Strength Index (RSI) is currently at 50, indicating that EUR/USD is in a neutral stance.

Resistance: 1.0759, 1.0803

Support: 1.0702, 1.0653

XAU/USD (4 Hours)

XAU/USD React to ECB Rate Hike and Mixed US Data

Gold prices initially declined following the European Central Bank’s (ECB) unexpected 25 basis point rate hike and dovish statement. However, they later rebounded due to optimistic stock market performance, hovering around the $1,910 mark. Meanwhile, the US Dollar experienced mixed results from local data, with strong retail sales offset by higher-than-expected wholesale prices. Despite inflation concerns, investors remained skeptical about the Federal Reserve’s potential for another rate hike, leading to a shift in risk appetite. The market’s sentiment for the upcoming trading day hinges on China’s release of August Industrial Production and Retail Sales data during the Asian session.

Chart XAUUSD by TradingView

According to technical analysis, XAU/USD moved flat on Wednesday and moving between the lower and middle band of the Bollinger Bands. Currently, the price is trading slightly above the lower band with the potential for further downward movement. The Relative Strength Index (RSI) is currently at 39, indicating that the XAU/USD pair is still biased towards the bearish side.

Resistance: $1,916, $1,925

Support: $1,903, $1,893

Economic Data
CurrencyDataTime (GMT + 8)Forecast
USDEmpire State Manufacturing Index20:30-9.9
USDPrelim UoM Consumer Sentiment22:0069.0

4 Ways One Piece Reminds Us of VTrade

Netflix’s live-action adaptation of One Piece is generating quite a buzz. The show tells the story of Monkey D. Luffy and the Straw Hat Crew travelling the globe in search of Pirate King Roger’s famed treasure, the One Piece. It’s a wild tale of twists and turns—one that coincidentally mirrors many aspects of our copy trading platform, VTrade. 

Designed for beginners, VTrade allows users (known as Followers) to copy the strategies of experienced traders (known as Providers) in a few clicks. Experts leading a group of followers to treasure (albeit in the markets)—sound familiar?

Read on to find 4 more ways that One Piece and its charismatic pirate captain remind us of VTrade:

1) The Value of Competition

Both One Piece and VTrade remind us that competition isn’t all bad; it can be a thrilling adventure that brings out the best in everyone.

In One Piece, the Straw Hat Crew’s growth was fuelled by facing formidable foes like Buggy the Clown and the Arlong Crew. Similarly, Providers on VTrade can frequently find an added boost of motivation when they have to fend off competition from other Providers stepping up their game.

Just like the pirates in One Piece compete to recruit crew members for their treasure-hunting journey, VTrade Providers compete to win the trust of potential Followers. This competition can not just lead to more earnings for the Providers but also a better level of service for Followers.

2) Excitement in Exploration

One of the things that has attracted so many people to One Piece throughout the decades is its ability to convey the excitement of exploration. Fans will no doubt recognise names like the Whole Cake Island in Totto Land, with buildings covered in delectable frosting, or the city of Zou, which sits on the back of an elephant.

With all the diverse landscapes and characters on the show, One Piece seemingly has something for everyone, precisely like the copy trading experience on VTrade. 

No matter the goal, capital, or appetite for risk, Followers on VTrade will find boundless assets to trade in and endless Providers they can copy from. Whether it’s forex, stocks, gold, or anything else that catches your fancy, the thrills of each new market are just a few clicks away.

3) Different Skills for Different Straw Hats 

The Straw Hat Crew is a unique bunch of misfits, each with their own special skills and abilities. Luffy, for example, has a rubbery body thanks to eating the Gomu Gomu no Mi fruit, which lets him stretch and change his shape. Then there’s Zoro, a skilled swordsman; Nami, a clever navigator; and Usopp, a charming storyteller and sharpshooter.

This diversity in abilities and personalities in the crew is similar to what you can find in the VTrade community. Different Providers trade various assets using their own distinct strategies, which means there are almost endless possibilities on offer. Looking for high-risk strategies with big potential payoffs? VTrade has you covered. Prefer to err on the side of caution and adopt a low-risk approach? There’s a laundry list of Providers who can help you do that too.

4) Real Treasure Awaits

One Piece would not exist without its central treasure, the titular One Piece itself. This legendary treasure, once found, bestows the title of Pirate King and holds immeasurable value. In the manga version of the show, the pirate Whitebeard even claimed that its discovery would shake the world to its core, igniting a global war.

While the One Piece might only exist in fiction, this doesn’t mean there aren’t equally tantalising rewards available in the real world. By leveraging the expertise of the world’s best traders, VTrade’s Followers can set themselves up for trading success, even without any trading knowledge or experience whatsoever.

Ready to set sail on your own copy trading adventure? Open an account now to get started.

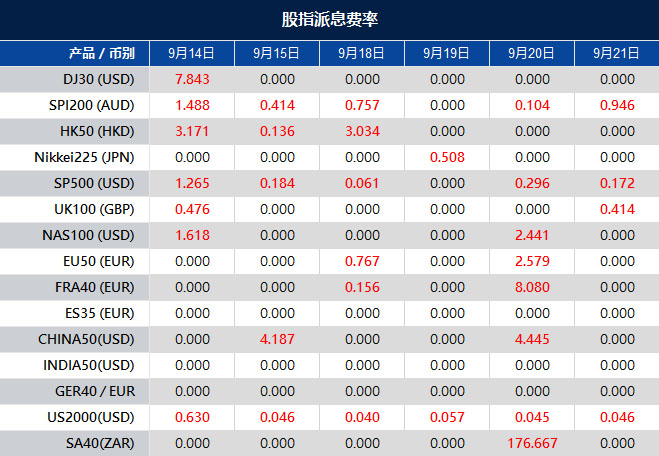
Dividend Adjustment Notice – September 14, 2023

Dear Client,

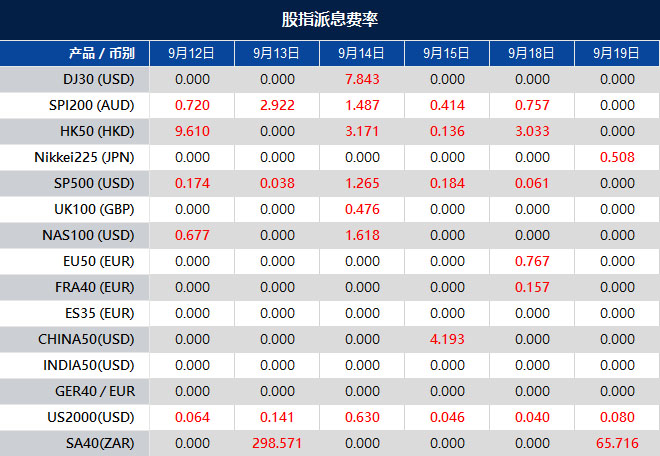
Please note that the dividends of the following products will be adjusted accordingly. Index dividends will be executed separately through a balance statement directly to your trading account, and the comment will be in the following format “Div & Product Name & Net Volume ”.

Please refer to the table below for more details:

The above data is for reference only, please refer to the MT4/MT5 software for specific data.

If you’d like more information, please don’t hesitate to contact [email protected].

Stock Market Reacts to Inflation Data, Dollar Index Fluctuates

On Wednesday, the U.S. stock market saw mixed performances, with the Dow Jones Industrial Average declining by 0.20% to 34,575.53, while the S&P 500 managed a slight uptick of 0.12%, and the Nasdaq Composite rose by 0.29%. These moves were in response to a surprising increase in August’s core inflation, which exceeded expectations, prompting concerns. In the currency market, the U.S. dollar initially gained strength due to the inflation data but later reversed course as core CPI figures aligned with forecasts. This led to a perception of disinflationary pressure and eliminated the possibility of an immediate Fed interest rate hike. Treasury yields attracted buying interest but fell short of this year’s peaks. Notably, EUR/USD declined, and the ECB meeting is closely watched with a 64% probability of an ECB rate hike priced in. USD/JPY showed resilience, and the Australian dollar remained flat, while the offshore yuan gained amid hopes of stabilizing financial and economic conditions in China.

Stock Market Updates

On Wednesday, the Dow Jones Industrial Average experienced a decline of 70.46 points, equivalent to a 0.20% drop, settling at 34,575.53, marking its second consecutive day of losses. In contrast, the S&P 500 managed a slight uptick of 0.12%, reaching 4,467.44, while the Nasdaq Composite saw a more significant gain, rising by 0.29% to conclude the day at 13,813.59. Within the Dow, CNBC and 3M bore the brunt of losses, with a sharp drop of over 5.7%, followed by Caterpillar, which saw its shares dip by 2%. Meanwhile, Apple shares declined for a second consecutive day, falling by more than 1%. Conversely, the tech sector bolstered the S&P 500 and Nasdaq, with Tesla shares gaining 1.4% as billionaire investor Ron Baron expressed optimism about the electric vehicle maker. Amazon shares also surged, reaching their highest level since August 2022, with an increase of over 2.5%.

The market reaction came in response to a surprising increase in August’s core inflation print within the consumer price index. The core inflation, which excludes volatile food and energy prices, rose by 0.3%, surpassing expectations for a 0.2% increase, and stood at 4.3% year-on-year, meeting forecasts. Federal Reserve officials typically focus on the core inflation number as it offers a more reliable indication of long-term inflation trends. In contrast, the headline numbers, including all components, increased by 0.6% in the past month and were up 3.7% compared to the same period last year. Economists surveyed had anticipated smaller increases of 0.6% and 3.6%, respectively. Although the unsettling inflation report raised concerns, experts believe the Federal Reserve is unlikely to take immediate action, with market participants not expecting any moves until November. Currently, Wall Street appears to have factored in a pause in interest rate hikes, with a 97% probability of rates remaining unchanged at the Fed’s upcoming meeting, according to CME FedWatch Tool data.

Data by Bloomberg

On Wednesday, the overall market saw a modest gain of 0.12%. Among the sectors, Utilities performed the best with a significant increase of 1.21%, followed by Consumer Discretionary, which rose by 0.90%. Communication Services and Information Technology also showed positive momentum, with gains of 0.40% and 0.31%, respectively. Consumer Staples and Health Care had smaller increases of 0.26% and 0.02%. However, Financials experienced a slight decline of -0.10%. The Materials sector saw a more notable decrease of -0.59%, while Industrials and Energy had more substantial losses of -0.67% and -0.76%, respectively. Real Estate was the weakest performing sector, declining by -1.03% on Wednesday.

Currency Market Updates

The currency market reacted to the U.S. CPI data with a cautious stance, as traders had entered the session with an excessively short position in Treasuries and a strong long position in the U.S. dollar. The dollar index initially saw gains following a higher-than-expected increase in core CPI and an above-forecast overall rise compared to the previous year. However, the core CPI figure fell to 4.3% from the August reading, aligning with forecasts, which led to a perception of disinflationary pressure, eliminating the possibility of a Fed interest rate hike in the near term. Two- and 10-year Treasury yields, which had approached their highest levels of the year, attracted significant buying interest but failed to surpass those peaks.

Meanwhile, in the currency pairs, EUR/USD experienced a 0.14% decline but remained above its Wednesday low. This was partly supported by higher bund-Treasury yield spreads. The market is closely watching the ECB meeting, with a 64% probability of an ECB rate hike priced in after being below 50% just a day earlier. Sterling remained relatively stable, recovering from an initial dip due to disappointing data and a subsequent drop following the U.S. CPI release. USD/JPY saw a 0.18% rise, showing resilience to the drop in Treasury yields, as concerns about a potential BoJ rate hike or FX intervention by the Ministry of Finance (MoF) receded. However, the path to higher prices in this pair depends on a resumption of the uptrend in Treasury yields. The Australian dollar remained flat, while the offshore yuan gained 0.4% on hopes of China’s FX actions and housing stimulus efforts stabilizing the financial and economic landscape amid growth concerns.

Picks of the Day Analysis
EUR/USD (4 Hours)

EUR/USD Holds Steady Ahead of ECB Meeting Amid Uncertainty

The EUR/USD maintained its position unaffected by the release of US consumer inflation data, trading within a familiar range with support around 1.0700. All eyes are now on the upcoming European Central Bank (ECB) meeting, which holds the potential to spark significant market movements due to the lack of consensus on policy actions. Reports suggest the ECB may raise its inflation forecast, fueling speculation about a rate hike. The ECB faces a dilemma between a rate hike and a pause, given economic conditions and persistent inflation. The outcome will be crucial, with potential implications for the Euro’s performance, while important US data releases could add to volatility in the days ahead.

Chart EURUSD by TradingView

According to technical analysis, EUR/USD moved flat on Wednesday and is currently trading just around the middle band of the Bollinger Bands. This movement suggests the possibility of further consolidation. The Relative Strength Index (RSI) is currently at 50, indicating that EUR/USD is in a neutral stance.

Resistance: 1.0759, 1.0803

Support: 1.0702, 1.0653

XAU/USD (4 Hours)

XAU/USD Slips as US Inflation Data Fails to Spark Dollar Rally

Gold traded around $1,910 in the American afternoon, marking its second consecutive day of losses. Earlier in the day, major assets remained within familiar ranges as investors awaited the release of US inflation figures. The Consumer Price Index (CPI) report for August showed a 0.6% MoM increase and a 3.7% YoY rise, surpassing market expectations, leading to an initial rally in the US Dollar. However, the Dollar’s gains were short-lived as the CPI readings were not strong enough to trigger a hawkish response from the Federal Reserve. Meanwhile, US indexes held modest gains, and US Treasury yields saw some uptick. Attention now turns to the European Central Bank (ECB) meeting, where expectations for a rate hike collide with economic challenges in the Euro Zone, leaving financial markets in a cautious state.

Chart XAUUSD by TradingView

According to technical analysis, XAU/USD moved flat on Wednesday and moving between the lower and middle band of the Bollinger Bands. Currently, the price is trading slightly above the lower band with the potential for further downward movement. The Relative Strength Index (RSI) is currently at 39, indicating that the XAU/USD pair is still biased towards the bearish side.

Resistance: $1,916, $1,925

Support: $1,903, $1,893

Economic Data
CurrencyDataTime (GMT + 8)Forecast
AUDEmployment Change09:3064.9K (Actual)
AUDUnemployment Rate09:303.7% (Actual)
EURMain Refinancing Rate20:154.25%
EURMonetary Policy Statement20:15 
USDCore PPI m/m20:300.2%
USDCore Retail Sales m/m20:300.4%
USDPPI m/m20:300.4%
USDRetail Sales m/m20:300.1%
USDUnemployment Claims20:30226K
EURECB Press Conference20:45 

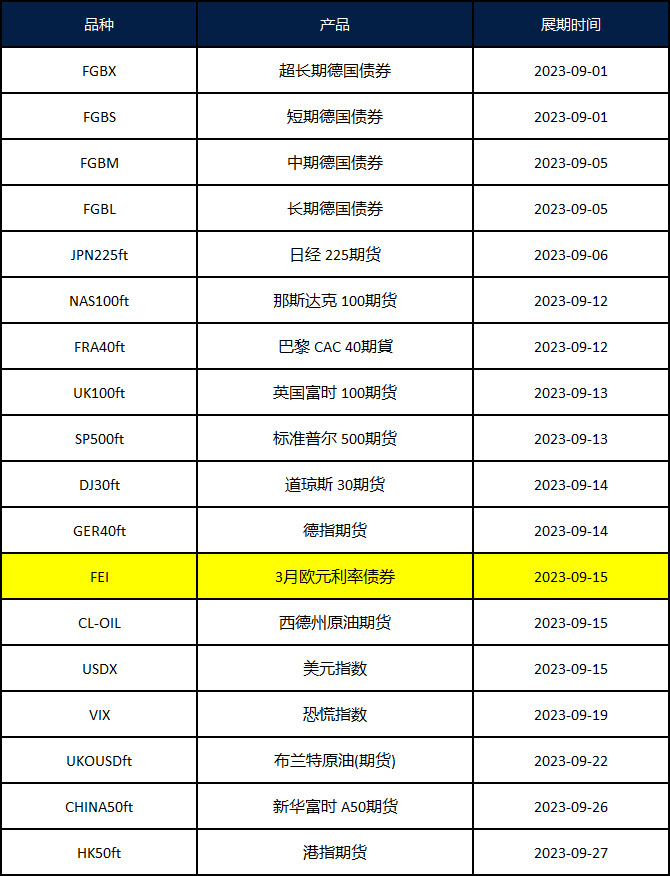
September Futures Rollover Announcement (Update) – September 14, 2023

Dear Client,

New contracts will automatically be rolled over as follows:

Please note:

• The rollover will be automatic, and any existing open positions will remain open.

• Positions that are open on the expiration date will be adjusted via a rollover charge or credit to reflect the price difference between the expiring and new contracts.

• To avoid CFD rollovers, clients can choose to close any open CFD positions prior to the expiration date.

• Please ensure that all take-profit and stop-loss settings are adjusted before the rollover occurs.

• All internal transfers for accounts under the same name will be prohibited during the first and last 30 minutes of the trading hours on the rollover dates.

If you’d like more information, please don’t hesitate to contact [email protected].

Indices Trading Time Adjustment Notice – September 13, 2023

Dear Client,

To provide a better trading environment in accordance to the market condition, VT Markets will adjust the trading time of CHINA50 on September 18th, 2023.

Please find the table below for more information:

The above data is for reference only, please refer to the MT4/MT5 software for specific data.

Kind Reminder:

The rest of the specifications remain original except for the trading time.

If you’d like more information, please don’t hesitate to contact [email protected].

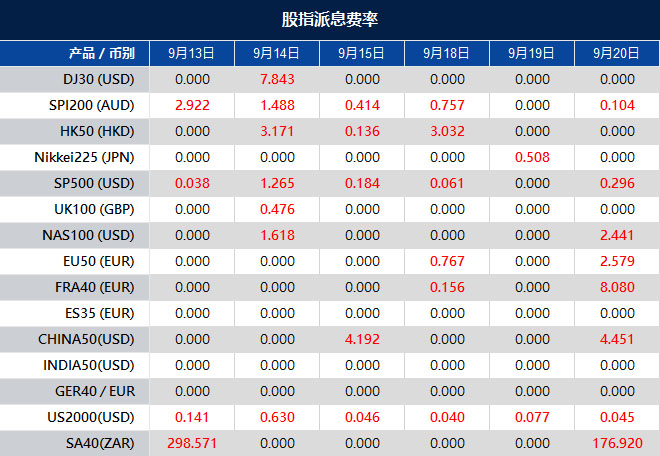
Dividend Adjustment Notice – September 13, 2023

Dear Client,

Please note that the dividends of the following products will be adjusted accordingly. Index dividends will be executed separately through a balance statement directly to your trading account, and the comment will be in the following format “Div & Product Name & Net Volume ”.

Please refer to the table below for more details:

The above data is for reference only, please refer to the MT4/MT5 software for specific data.

If you’d like more information, please don’t hesitate to contact [email protected].

Nasdaq Slips as Oracle’s Plunge Ripples Through Tech Stocks, US Dollar Index Gears Up for Key Inflation Data

In a mixed day for the financial markets, the Nasdaq Composite faced a 1.04% decline on Tuesday, spurred by Oracle’s sharp 13.5% drop following disappointing results. This decline, though not a massive stock, reflects broader business spending trends and impacted both the Nasdaq and the S&P 500. Meanwhile, tech giants like Apple and Adobe also saw their share prices decline. On the energy front, U.S. crude oil prices hit their highest level since last November, boosting energy stocks. In the currency market, the US Dollar Index showed a modest increase as investors awaited the release of the August US Consumer Price Index (CPI), which is expected to influence Federal Reserve monetary policy expectations. The week also holds key inflation data with the Producer Price Index (PPI) scheduled for Thursday. In the UK, mixed labor market data pointed to economic challenges, while in currency trading, the Pound weakened amid uncertainties. The EUR/USD pair faces upcoming Eurozone Industrial Production data and the European Central Bank’s meeting.

Stock Market Updates

On Tuesday, the Nasdaq Composite experienced a 1.04% decline, marking its first day of losses in three days. This drop was primarily driven by the sharp decline in Oracle shares, which tumbled 13.5% following disappointing quarterly results and a lackluster revenue forecast. This setback in Oracle, while not a massive stock, is indicative of larger business spending trends, impacting both the Nasdaq and the S&P 500. Additionally, other tech giants like Amazon, Alphabet (Google’s parent company), and Microsoft also saw their stock prices slide.

Meanwhile, Apple’s shares fell by 1.7% after the announcement of a new iPhone model, and Adobe’s shares dropped approximately 4% ahead of its upcoming earnings report. On a different note, U.S. crude oil prices reached their highest level since November of the previous year, driven by OPEC’s optimistic demand growth forecast. This surge in oil prices provided a boost to energy stocks, with Chevron and Exxon Mobil both seeing gains of about 1.9% and 2.9%, respectively. Investors are now closely watching key inflation data set to be released later this week, along with the European Central Bank’s interest rate decision on Thursday.

Investors eagerly await the release of key inflation data later this week, especially following a series of stronger-than-expected economic indicators from the previous week, which raised concerns about the possibility of the Federal Reserve increasing rates more than previously anticipated.

Data by Bloomberg

On Tuesday, the overall market slipped by 0.57%, with notable sector performance variations. Energy surged by 2.31%, and financials gained 0.85%, while utilities and real estate had slight gains of 0.13% and -0.03%, respectively. In contrast, information technology saw a substantial 1.75% drop, and communication services declined by 1.06%. Consumer discretionary, industrials, materials, and health care sectors faced moderate declines ranging from -0.17% to -0.89%, while consumer staples decreased by 0.71%. These sector-specific movements contributed to the market’s overall decline.

Currency Market Updates

The US Dollar Index saw a modest uptick on Tuesday, nearing 105.00 before retracing, with markets relatively calm as they awaited crucial US data. The highlight of the week, the August US Consumer Price Index (CPI), is scheduled for release on Wednesday. It’s expected to show an annual rate rebound from 3.2% to 3.6%, while the Core rate may slow down from 4.7% to 4.3%. These figures are poised to influence expectations about the Federal Reserve’s monetary policy, likely leading to increased volatility. Thursday will bring more inflation data with the Producer Price Index (PPI).

In the UK, mixed labor market data signaled a deteriorating economic situation, as the unemployment rate rose to 4.3% – the highest since September 2021 – accompanied by a decline in employment by 207K. Despite average hourly weekly earnings exceeding expectations at 8.5%, the Pound weakened. The GBP/USD pair approached its monthly low before rebounding toward 1.2500. Meanwhile, the EUR/USD pair reached a weekly high at 1.0769 and has Eurozone Industrial Production data scheduled for Wednesday, along with the European Central Bank’s Governing Council meeting on Thursday.

Picks of the Day Analysis
EUR/USD (4 Hours)

EUR/USD Sees Modest Pullback Ahead of Key Economic Data and ECB Meeting

The EUR/USD pair experienced a moderate pullback on Tuesday, initially spiking to 1.0769 during the Asian session, its highest level in a week, before retracing while still holding above the 1.0700 mark. Investors are eagerly awaiting the release of US consumer inflation data and the European Central Bank (ECB) meeting.

The market received mixed signals from Germany, with the current condition index dropping to -79.4, its lowest point since August 2020, and the expected index coming in at -11.4, surpassing the forecast of -15.0. These indicators contribute to concerns about a potential recession in Germany and the Eurozone, impacting expectations regarding an ECB rate hike. Market pricing suggests a nearly 50% probability of a rate hike on Thursday, but most analysts anticipate at least one 25 basis points rate hike by year-end. The economic outlook of the Eurozone, in contrast to the more resilient US economy, remains a critical factor influencing the direction of the EUR/USD pair, with the US Consumer Price Index (CPI) report on Wednesday poised to play a pivotal role in shaping market sentiment.

Chart EURUSD by TradingView

According to technical analysis, EUR/USD moved higher on Tuesday and is currently trading just below the upper band of the Bollinger Bands. This movement suggests the possibility of further continuation to the upside, potentially pushing towards the upper band. The Relative Strength Index (RSI) is currently at 57, indicating that EUR/USD is in a neutral stance with a slight bullish bias.

Resistance: 1.0759, 1.0803

Support: 1.0702, 1.0653

XAU/USD (4 Hours)

XAU/USD Dips Amid Dollar Demand but Recovers Slightly as Markets Await US CPI Data

Gold prices saw a decline on Tuesday, influenced by renewed demand for the US Dollar, as XAU/USD dropped to $1,907.53 per troy ounce. The decline in the precious metal was most pronounced during European trading hours, as weak local data raised concerns about economic setbacks in the United Kingdom and the Euro Zone.

However, the mood improved as Wall Street opened, with local indexes outperforming their international counterparts. The Dow Jones Industrial Average was in positive territory, while the S&P500 and the Nasdaq Composite posted minor losses. XAU/USD managed to recover some of its earlier losses, trading at approximately $1,912 per troy ounce.

Speculative traders are exercising caution in anticipation of significant events scheduled for the latter part of the week, refraining from making strong commitments. Nevertheless, Gold has been among the weakest performers against the US Dollar this week. Attention now turns to the United States (US) Consumer Price Index (CPI), which is expected to rise by 0.6% MoM and 3.6% YoY, surpassing July’s figures. Higher-than-expected CPI numbers could fuel speculation about an impending Federal Reserve (Fed) rate hike, benefiting the USD in a risk-averse environment. Conversely, if CPI figures fall short of market expectations, markets may turn notably optimistic.

Chart XAUUSD by TradingView

According to technical analysis, XAU/USD moved lower on Tuesday and reached the lower band of the Bollinger Bands. Currently, the price is trading slightly above the lower band with the potential for further downward movement. The Relative Strength Index (RSI) is currently at 35, indicating that the XAU/USD pair is still biased towards the bearish side.

Resistance: $1,919, $1,925

Support: $1,910, $1,903

Economic Data
CurrencyDataTime (GMT + 8)Forecast
GBPGDP m/m14:00-0.2%
USDCore CPI m/m20:300.2%
USDCPI m/m20:300.6%
USDCPI y/y20:303.6%

Unlocking Forex Chart Secrets: Your Trading Education, Part 2

Read Part 1 of this article to learn about the purpose of charts in Forex trading, different chart types, and how to use line charts.

Bar Charts (OHLC) 

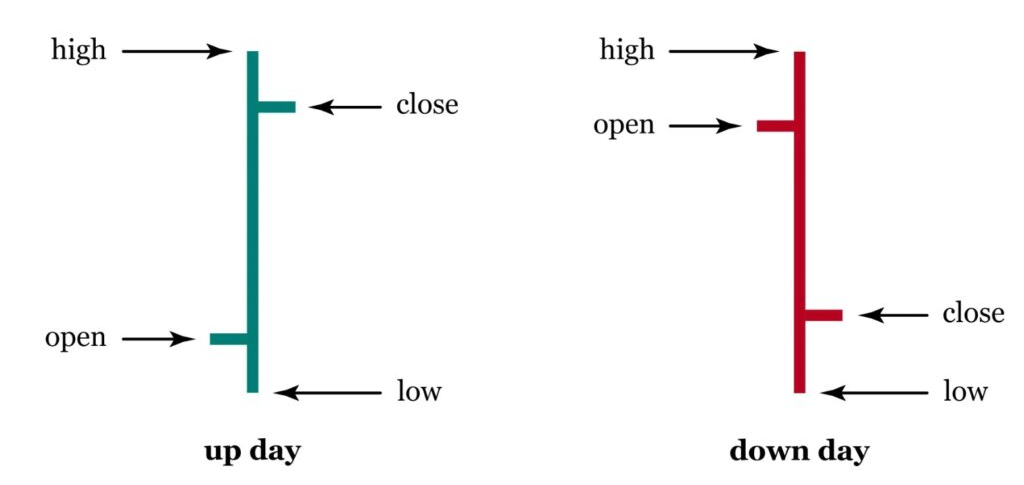
OHLC stands for Open, High, Low, and Close. Bar charts are a widely used type of Forex chart that display these four key price points for each time period. They are represented as vertical bars, and each bar provides a comprehensive view of price movements within that specific timeframe. 

Here’s a breakdown of the components of a bar on a bar chart: 

  • Open Price: The top of the vertical bar represents the opening price of the currency pair at the beginning of the chosen time period. 
  • High Price: The top point or “spike” of the vertical bar indicates the highest price reached during that time period. 
  • Low Price: The lowest point or “dip” of the vertical bar represents the lowest price reached during that time period. 
  • Close Price: The bottom of the vertical bar represents the closing price of the currency pair at the end of the chosen time period. 

Bar charts are valuable for traders who want a more detailed understanding of price movements. They provide a holistic picture of what happened within a given timeframe. 

source: Britannica

How to Read and Interpret Bar Charts 

Reading and interpreting a bar chart involves analysing each bar to understand the dynamics of the market during that specific time period. Here’s how you can read and interpret a bar chart: 

  • Open to Close: The vertical length of the bar represents the price range between the opening and closing prices for that period. A longer bar indicates a larger price range. 
  • High and Low: The “spike” at the top and the “dip” at the bottom of the bar show the highest and lowest prices reached during the period. 
  • Market Sentiment: Analysing the relationship between the opening and closing prices can help you gauge market sentiment. If the closing price is higher than the opening price, it suggests bullish sentiment (buying pressure). Conversely, if the closing price is lower than the opening price, it indicates bearish sentiment (selling pressure). 
  • Patterns and Trends: By observing patterns in multiple bars, traders can identify trends, reversals, and potential trading opportunities. 

In summary, bar charts are a powerful tool for traders seeking detailed insights into price movements. While they may seem complex at first, they are worth exploring as you gain experience in Forex trading. 

Candlestick Charts 

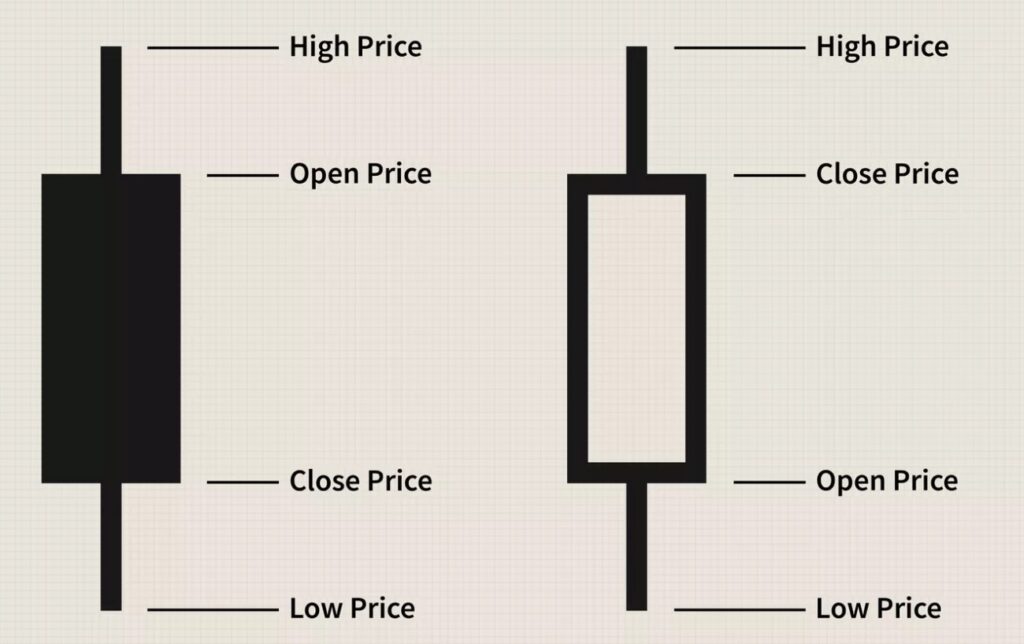
Candlestick charts are a highly visual and popular way to represent price movements in Forex trading. They use “candles” to provide a comprehensive view of the opening, high, low, and closing prices within a specific timeframe. 

Here’s a breakdown of the key elements of a candlestick: 

  • Body: The central and thicker part of the candlestick is known as the “body.” The body represents the price range between the opening and closing prices for the given time period. 
  • Wicks or Shadows: Thin lines extending above and below the body are called “wicks” or “shadows.” These wicks represent the highest and lowest prices reached during the same time period. 
  • Colour: Candlestick charts use colour to convey valuable information about price movement during the timeframe. Typically, candles are coloured green or red, but this can vary depending on your chart settings and platform. 
source: investopedia.com

How to Read and Interpret Candlestick Charts 

Reading and interpreting candlestick charts involve understanding the relationship between the body, wicks, and their colours. Here’s how you can read and interpret a candlestick: 

  • Body and Wick Length: The length of the body and the wicks provides insights into price volatility. A longer body or wick signifies greater price movement during the timeframe. 
  • Green (Bullish) and Red (Bearish): In most cases, a green (or white) candle represents a bullish candlestick, indicating that the closing price is higher than the opening price. Conversely, a red (or black) candle represents a bearish candlestick, signifying that the closing price is lower than the opening price. 
  • Upper and Lower Shadows: The upper shadow extends from the top of the body to the high price, while the lower shadow extends from the bottom of the body to the low price. These shadows illustrate the price range’s extremes during the timeframe. 
  • Patterns: Candlestick charts are renowned for their ability to reveal specific patterns, such as doji, hammer, and engulfing patterns. Traders often use these patterns to predict market reversals or continuations. 

In summary, candlestick charts are a powerful tool for traders seeking a visually engaging way to analyse price movements. Their ability to reveal patterns and market sentiment makes them a favourite among traders, but mastering their interpretation may require some practice and education. 

Timeframes and Charting Periods 

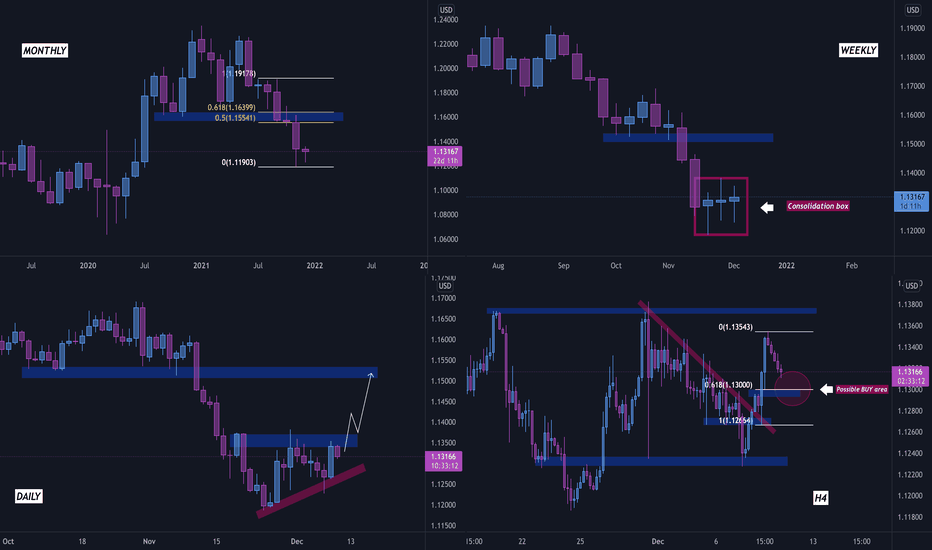
Forex charts can be customised to display price data at various timeframes. The timeframe you choose determines how much data each candlestick or bar represents. Here are some common timeframes: 

  • 1-Minute: Each candlestick or bar represents one minute of trading data. This timeframe is popular among day traders for making quick decisions. 
  • 5-Minute: Each candlestick or bar represents five minutes of trading data. It provides a slightly broader view than the 1-minute timeframe while still catering to short-term traders. 
  • 1-Hour: Each candlestick or bar represents one hour of trading data. This timeframe is suitable for traders who want to capture short- to medium-term price movements. 
  • 4-Hour: Each candlestick or bar represents four hours of trading data. It’s commonly used by swing traders and provides a more extended perspective of the market. 
  • Daily: Each candlestick or bar represents one full trading day. Daily charts are favoured by long-term traders and investors who want to identify significant trends and potential entry points over several days or weeks. 
  • Weekly: Each candlestick or bar represents one trading week, making it ideal for traders with long-term investment horizons who aim to capture trends over months or even years. 
Multi time frame analysis
source: tradingview.com

Choosing the Right Timeframe 

Selecting the appropriate timeframe is a crucial decision that depends on your trading style, goals, and preferences. It impacts the type of price movements you observe and the duration of your trades. By aligning your timeframe with your trading style and objectives, you can make more informed decisions and enhance your overall trading success. 

Here are some considerations: 

  • Short-Term Traders: If you’re a day trader or scalper looking for quick profits from short-term price fluctuations, lower timeframes like 1-minute or 5-minute charts may be more suitable. 
  • Medium-Term Traders: Traders with a medium-term horizon, such as swing traders, often use 1-hour or 4-hour charts to capture price movements that span a few days to a few weeks. 
  • Long-Term Investors: If you’re an investor or trader focused on long-term trends, daily or weekly charts provide a broader view of the market and are better suited for identifying significant trends and potential entry points over a more extended period. 
  • Combination: Some traders use a combination of timeframes to gain different perspectives on the same currency pair. For example, they might use a daily chart for trend analysis and a 1-hour chart for precise entry and exit points. 

In conclusion, Forex charts are indispensable tools in the currency trading world, offering clarity amid market complexity. Whether you choose line, bar, or candlestick charts, your chart type significantly impacts your trading strategy. Understanding various timeframes is key for aligning your trading style with your goals. As you dive into trading, remember that chart analysis is a skill to refine, guiding you to profitable decisions and financial growth. Happy trading! 

Summary: 

  • Forex charts are vital for traders, providing visual insights into currency pair price movements. 
  • They are essential for price analysis, timing trades, risk management, decision-making, strategy development, and psychological support. 
  • Three main types of Forex charts are available: line charts, bar charts (OHLC), and candlestick charts, each offering a unique perspective on the market. The choice of chart type depends on your trading style and goals. 
  • Timeframes, such as 1-minute, 1-hour, and daily, determine the data granularity, aligning with your trading style. 

Dividend Adjustment Notice – September 12, 2023

Dear Client,

Please note that the dividends of the following products will be adjusted accordingly. Index dividends will be executed separately through a balance statement directly to your trading account, and the comment will be in the following format “Div & Product Name & Net Volume ”.

Please refer to the table below for more details:

The above data is for reference only, please refer to the MT4/MT5 software for specific data.

If you’d like more information, please don’t hesitate to contact [email protected].

Back To Top
server

Hello there 👋

How can I help you?

Chat with our team instantly

Live Chat

Start a live conversation through...

  • Telegram
    hold On hold
  • Coming Soon...

Hello there 👋

How can I help you?

telegram

Scan the QR code with your smartphone to start a chat with us, or click here.

Don’t have the Telegram App or Desktop installed? Use Web Telegram instead.

QR code