Donald Trump posted on Truth Social that he would suspend US bombing and attacks on Iran for two weeks. He said the pause followed talks with Pakistan’s Prime Minister Shehbaz Sharif and Field Marshal Asim Munir, and was subject to Iran agreeing to the COMPLETE, IMMEDIATE, and SAFE OPENING of the Strait of Hormuz.
He described the plan as a double sided CEASEFIRE and said US Military objectives had been met and exceeded. He said the US had received a 10 point proposal from Iran, and that a two week period would allow an agreement to be finalised.
Market Reaction And Key Price Moves
After the post, US equities rose, with the S&P 500 up over 1.50% and the Nasdaq 100 up more than 1.70%. Gold also rose over 1.50%, trading at around $4,770.
WTI fell more than 7.50%, dropping from around $108 to $101 per barrel. The US Dollar Index (DXY) extended losses, down 0.47% at 99.51 at the time of writing.
The article also explains market terms “risk-on” and “risk-off”, and lists assets and currencies that often move in each environment. It notes that safe-haven moves often involve bonds, Gold, the US Dollar, the Japanese Yen, and the Swiss Franc, while AUD, CAD, NZD, RUB, and ZAR tend to rise in risk-on periods.
The announcement of a two-week ceasefire has injected a strong “risk-on” sentiment into the market, but this is built on a very fragile foundation. The immediate sharp drop in WTI crude oil and the rally in equities reflect relief, yet the situation hinges entirely on negotiations over the next fourteen days. Derivative traders must position for the binary outcome of this period, where volatility is almost a certainty.
Given the immediate 7.50% drop in WTI crude, the implied volatility in oil options has likely surged. We should consider strategies like long straddles or strangles on oil futures, which profit from a large price move in either direction without betting on the outcome of the talks. The Strait of Hormuz, a chokepoint for nearly 20% of global petroleum liquids consumption, remains the key variable, meaning a deal failure would send prices soaring well above their previous levels.
Equities Volatility And Options Positioning
For equity indices like the S&P 500, the recent spike has likely crushed the CBOE Volatility Index (VIX), making options premiums cheaper. We saw a similar pattern after the initial Russia-Ukraine de-escalation talks back in 2022, where the VIX fell over 15% in a single week. Traders who believe the ceasefire will hold could sell put spreads on the SPX, collecting premium as fear continues to recede from the market.
The US Dollar Index’s decline signals a flight from safety, which benefits commodity currencies. We should look at proxy trades for risk appetite, such as going long the Australian Dollar against the Japanese Yen (AUD/JPY). Historically, this pair shows a strong positive correlation with the S&P 500, making it an effective way to trade the broader risk-on sentiment in the FX market.
The unusual rally in gold alongside equities, pushing it toward $4,800, suggests the market is pricing in a weaker US dollar and persistent inflation rather than seeking a traditional safe haven. US CPI data from last month showed core inflation remains stubbornly above 3.5%, a trend that a peace-driven economic boom could worsen. We can use options on gold futures (GC) to bet that this inflation hedge demand will continue, even if the geopolitical risk premium fades.
South Korea’s current account balance rose to 23.19B in February. This was up from 13.26B in the previous period.
The sharp rise in South Korea’s current account surplus is a strong bullish signal for the South Korean Won. This massive inflow of foreign currency puts direct upward pressure on the KRW against the US dollar. We should therefore consider positioning for a lower USD/KRW exchange rate in the coming weeks by buying Won call options or selling USD call options.
Trade Surplus Supports Equity Upside
This surplus is not an anomaly, as March’s preliminary trade data showed semiconductor exports surged by over 40% year-over-year, their eighth consecutive month of growth. A robust export sector directly boosts the earnings of major companies listed on the KOSPI index. This makes buying KOSPI 200 index futures an attractive trade to capture the broad market upside.
Such a strong external position gives the Bank of Korea more flexibility to keep interest rates firm to combat inflation, which is still hovering just above their 2% target. We remember how the BOK’s hawkish stance in late 2025 stabilized the currency during a period of global uncertainty. Therefore, the risk of a sudden dovish pivot that could weaken the Won appears low for now.
From an equity derivative standpoint, implied volatility on the iShares MSCI South Korea ETF (EWY) has been steadily declining. This makes buying call options on the ETF a cost-effective strategy to gain exposure to the strengthening Korean market. We see this as a better risk-reward than last year, when concerns over global supply chains in mid-2025 kept volatility elevated.
Donald Trump posted on Truth Social that the United States would suspend bombing and attacks on Iran for two weeks. He said the pause followed talks with Pakistan’s Prime Minister Shehbaz Sharif and Field Marshal Asim Munir, and was conditional on Iran agreeing to the “COMPLETE, IMMEDIATE, and SAFE OPENING” of the Strait of Hormuz.
Trump described the pause as a “double sided CEASEFIRE” and said US military objectives had been met. He also wrote that the US had received a 10 point proposal from Iran, and that many past disputes between the two countries had been agreed, with the two-week period intended to finalise an agreement.
Markets React To Ceasefire Headlines
After the post, risk appetite improved and US equities rose. The S&P 500 gained over 1.50% and the Nasdaq 100 rose more than 1.70%.
Gold climbed over 1.50% to around $4,770. WTI fell more than 7.50%, dropping from about $108 to $101 per barrel.
The US Dollar Index (DXY) extended losses by 0.47% to 99.51 at the time of writing.
We are seeing a significant drop in WTI crude oil because the potential reopening of the Strait of Hormuz eases major supply fears. This strait is a critical chokepoint; as recently as 2024, data showed it handled about 21 million barrels per day, or roughly 20% of global petroleum consumption. Given the fragile two-week nature of this ceasefire, we should look at options that profit from high volatility, as a snap-back is very possible if talks fail.
The sharp rally in the S&P 500 has likely crushed the Volatility Index (VIX), making protective options cheaper. We remember from the trade disputes back in 2019 how quickly positive sentiment could be reversed by a single message, causing volatility to spike from below 15 to above 20 in a matter of days. Buying VIX call options or puts on the SPY ETF now could serve as inexpensive insurance against this deal collapsing before the deadline.
Positioning For A Binary Two Week Outcome
We noticed that gold rallied alongside equities, which is explained by the dollar’s sharp decline, with the DXY falling below 100. Historically, a weaker dollar provides a strong tailwind for gold prices, a relationship we saw play out repeatedly during the high inflation years of 2021-2022. Any sign of the ceasefire failing would likely reverse this, strengthening the dollar as a safe haven and putting pressure on gold.
The central theme for the next two weeks is the temporary nature of this social media-announced ceasefire. The market is reacting as if peace is secured, but we should position for the binary outcome of the deadline. This suggests strategies like buying straddles or strangles on the most affected assets, like oil ETFs, to play the expected explosion in volatility rather than picking a definitive direction.
TD Securities’ Global Strategy Team expects the Reserve Bank of New Zealand to keep the Official Cash Rate unchanged at its next meeting, in line with market expectations.
The team expects the RBNZ to communicate a patient approach to supply shocks while the economy is operating below capacity.
Market Pricing And Policy Signals
It reports that markets are pricing in more than 75 basis points of interest-rate rises in 2026, and says it will review that pricing against what the RBNZ communicates.
The team plans to read the meeting Minutes for any indication that the RBNZ could shift towards bringing forward rate rises.
The article states it was produced with the assistance of an artificial intelligence tool and reviewed by an editor.
We believe the market is misinterpreting the Reserve Bank of New Zealand’s intentions. Current market pricing is factoring in more than 75 basis points of hikes for 2026, which seems excessive. We expect the RBNZ to hold the Official Cash Rate and communicate a need for patience.
Implications For Traders And Nzd
This view is supported by the latest economic data. Inflation has been steadily cooling from the stickier levels we saw through 2025, with the latest Q1 2026 figures showing CPI at 3.1%. Furthermore, recent GDP data showed the economy expanded by only 0.2%, confirming that it is operating below its potential and is sensitive to further tightening.
For derivatives traders, this suggests a strategy of positioning against the market’s aggressive rate hike expectations. This could involve using overnight index swaps or options to bet that the OCR path will be much lower than currently priced in. The core of the trade is that the central bank will use its statement to push back against current market assumptions.
This dovish stance should also weigh on the New Zealand dollar. We saw a similar pattern in 2025 when the RBNZ signaled a pause, causing the NZD/USD to weaken considerably over the following weeks. Options strategies that would profit from a falling Kiwi dollar could therefore be advantageous.
The primary risk is a surprise hawkish tone in the upcoming meeting Minutes. We will be looking for any signs that the Bank’s concern over persistent domestic inflation is starting to override its worries about weak economic growth. Such a change would indicate that earlier rate hikes are, in fact, back on the table.
NZD/USD traded near 0.5720 on Wednesday, with the US Dollar supported by safe-haven demand ahead of the Reserve Bank of New Zealand (RBNZ) policy decision. Markets have broadly priced in a rate hold, so attention is on the RBNZ’s guidance.
Geopolitical tension lifted risk aversion after US President Donald Trump set a deadline on Iran, while Tehran reportedly cut diplomatic channels with the US. Concerns around the Strait of Hormuz added to market caution and kept energy prices elevated, which supported the USD.
RBNZ Guidance In Focus
Traders are watching whether the RBNZ signals a more hawkish or more cautious path. A hawkish tone could support the New Zealand Dollar, while a patient stance could leave it open to further falls against a firm USD.
On the 4-hour chart, NZD/USD traded at 0.5735, above the 20-period moving average at 0.5710 but below the falling 100-period moving average at 0.5780. The Relative Strength Index was 56.
Resistance was listed at 0.5736, then 0.5780 and 0.5907. Support was given at 0.5724, with 0.5704 and 0.5702 below.
We recall the neutral sentiment for NZD/USD around this time in 2025, when the pair struggled near 0.5720 ahead of a key Reserve Bank of New Zealand decision. That period of market hesitation gave way to a clearer trend after the central bank held rates through 2025 before signaling a more dovish stance. Now, with the pair trading significantly higher, the context for derivative plays has completely changed.
Volatility And Strategy Considerations
The focus in 2025 was on whether the RBNZ would look through what was then 3.1% inflation. As we now know, those price pressures proved transitory, with New Zealand’s latest quarterly CPI figure for Q1 2026 coming in at a more manageable 2.1%. This slowdown was a primary driver behind the central bank’s recent policy pivot, a stark contrast to the hawkish signals some had anticipated last year.
While the specific geopolitical drivers have shifted from the US-Iran standoff that supported the dollar in 2025, overall market uncertainty remains. Current trade negotiations between the US and China are keeping markets on edge, which suggests implied volatility in NZD/USD could see short-term spikes. This environment makes strategies like purchasing straddles or strangles potentially useful for traders positioning for a breakout from the current range.
The technical picture has evolved from the struggle below the 0.5780 moving average we observed last year. With NZD/USD now finding support near 0.5910, traders might consider positioning for a continued, but measured, recovery toward the 0.6050 level seen in late 2025. A bull call spread, buying a 0.5950 strike call and selling a 0.6050 strike call, could offer a cost-effective way to capitalize on potential upside over the next few weeks.
TD Securities’ Global Strategy Team expects the Reserve Bank of New Zealand (RBNZ) to keep the Official Cash Rate unchanged, matching market consensus. It expects RBNZ communication to focus on patience in responding to supply shocks while the economy is operating below capacity.
The team says markets are pricing in more than 75 bps of rate rises in 2026. It describes this level of pricing as excessive and plans to review the meeting Minutes for any indication of earlier tightening.
Reserve Bank Of New Zealand Outlook
The article states it was produced with help from an artificial intelligence tool and reviewed by an editor.
We are not expecting any change to the cash rate from the Reserve Bank of New Zealand. The bank will likely emphasize patience because the economy is running below its full potential. This view challenges the market’s current pricing of more than three rate hikes before the year is out.
The bank’s cautious stance is understandable given recent data showing the economy is weak. We saw GDP growth turn slightly negative at -0.1% at the end of 2025, and the unemployment rate has climbed to 4.8%. While Q1 inflation is still sticky at 3.1%, the RBNZ will likely prioritize growth over fighting this last bit of inflation for now.
For derivative traders, this suggests positioning for interest rates to be lower than the market currently implies. We saw a similar pattern throughout 2025, where the market got ahead of the central bank’s actual pace, rewarding those who bet against aggressive tightening. Therefore, positions that benefit from the RBNZ holding rates steady, such as receiving fixed in interest rate swaps, could be favorable.
What To Watch In The Minutes
The key is to watch the language in the upcoming meeting minutes very closely. Any wording that hints the Bank is losing patience with inflation or sees growth picking up would be a sign to exit these positions. This communication will be the primary catalyst for the market in the coming weeks.
NZD/USD traded near 0.5720 on Wednesday, keeping a neutral tone as the US Dollar stayed firm on safe-haven demand ahead of the Reserve Bank of New Zealand (RBNZ) policy decision. Markets are focused on RBNZ guidance, as a rate hold is already priced in.
Geopolitical tensions supported the USD after US President Donald Trump set a deadline on Iran a few hours away, while Iran reportedly reduced diplomatic communication with the US. Concerns around the Strait of Hormuz lifted risk aversion and energy prices.
RBNZ Guidance In Focus
Traders are watching whether the RBNZ signals a hawkish or cautious policy path, with inflation near 3.1% seen as partly temporary and linked to energy. A hawkish tone could support the NZD, while a patient stance may leave it open to further weakness.
On the 4-hour chart, NZD/USD was at 0.5735, above the 20-period moving average at 0.5710 but below the falling 100-period moving average at 0.5780. The RSI was 56, above the midline.
Resistance levels were 0.5736, 0.5780, and 0.5907, while support sat at 0.5724, 0.5704, and 0.5702. A break below 0.5702 could reopen the wider downtrend.
We are seeing a familiar pattern as we approach the April 10 RBNZ decision, reminiscent of the situation in mid-2025. Just like then, a rate hold is almost entirely priced into the market, so our focus shifts entirely to the central bank’s forward guidance. The key question is whether they will maintain a hawkish stance or signal a more cautious outlook.
How Inflation Shapes The Decision
Last year, the concern was an inflation rate around 3.1% that policymakers viewed as temporary. Today, with the latest quarterly CPI data showing inflation stubbornly at 3.8%, well above the RBNZ’s target band, the challenge is even greater. They must decide if this persistence warrants delaying any hints of future rate cuts, which could surprise the market.
While the specific geopolitical risks have shifted from the US-Iran tensions of 2025, the outcome is the same. Heightened trade friction and European instability are fueling safe-haven demand for the US dollar, with the Dollar Index (DXY) holding firm above 105.50. This creates a significant headwind for the NZD/USD pair, regardless of the RBNZ’s domestic focus.
Given the binary nature of the RBNZ’s potential tone, traders could consider using options to position for a potential spike in volatility. A long straddle strategy, buying both a call and a put option, would profit from a significant move in either direction without betting on the outcome. This approach protects against being on the wrong side of a hawkish surprise or a dovish disappointment.
For those holding existing NZD positions, purchasing out-of-the-money put options offers a cost-effective way to hedge against a dovish RBNZ that could send the kiwi lower. We saw how a cautious stance in 2025 preceded a slide in the pair, and puts can act as insurance against a repeat scenario. This allows for participation in any upside surprise while capping potential losses.
Escalating US–Iran tensions, including threats linked to the Strait of Hormuz (SoH), have increased uncertainty around any move towards peace. Ongoing risks to oil supply are weighing on Asian foreign exchange and regional risk assets.
Oil markets show two developments: marginal improvement in tanker flows through the SoH and the possibility of Iraqi exports moving through the strait. Despite this, future conditions remain uncertain.
Supply Recovery Timeline
Even if the SoH fully reopened immediately, it could take 3–6 months for supply to return and feed through markets. Petrochemicals are described as the most affected.
The conflict is framed as potentially ending due to three constraints: munitions, markets, and the US mid-terms. Any outcome may also depend on the level oil prices can rise before triggering further pressure.
Given that the path towards peace is narrow and unlikely, we see persistent risks to oil supply. These tensions centered on the Strait of Hormuz will keep markets on edge in the coming weeks. For traders, this means volatility is the baseline expectation, not a temporary shock.
To capitalize on this, we believe buying call options on Brent crude futures is a prudent move, as prices are already testing the $105 per barrel mark for June delivery. Implied volatility on these options has climbed above 45%, reflecting deep market anxiety over potential supply disruptions. This strategy offers upside exposure while clearly defining the maximum risk.
Asian Fx Hedging
We remain cautious on Asian currencies, which are vulnerable to higher energy costs. Derivative traders should consider buying put options on currencies like the Korean Won, which has already weakened past 1,450 per dollar. South Korea’s heavy reliance on imported oil makes its currency a direct proxy for regional energy security risk.
Even if the Strait were to fully reopen today, the supply chain impact would linger for months. This suggests looking at derivatives with expirations three to six months out to capture the full effect of the disruption. We are watching tanker flows carefully, but marginal improvements are not enough to change our cautious stance.
We only need to look back to the flare-up in late 2025, which caused a brief but sharp 15% spike in oil prices and a corresponding dip in regional assets. That event served as a reminder of how quickly these geopolitical tensions can translate into market pain. The current situation feels more sustained than that brief standoff.
This sustained pressure on energy prices will likely weigh on Asian risk assets as a whole. Persistently high oil acts as a tax on these economies, squeezing corporate profit margins. Hedging long equity portfolios by purchasing puts on major indices, like the MSCI Asia ex-Japan index, is a strategy to mitigate this downside risk.
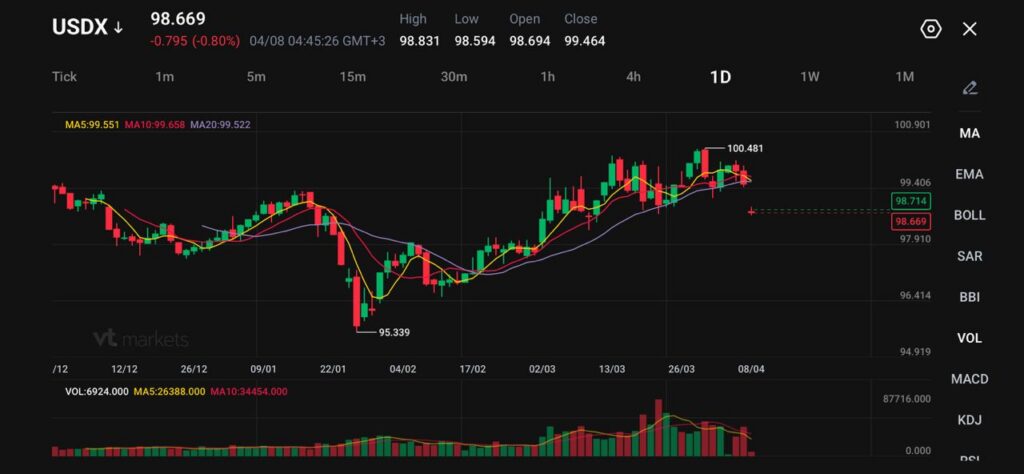
USDX trades at 98.669, down 0.795 (-0.80%), after slipping toward a four-week low around the 99 area.
The market reacted after Trump delayed his threat to strike Iranian civilian infrastructure by two weeks and described the move as a “double-sided ceasefire” tied to reopening the Strait of Hormuz.
Inflation risk has not disappeared. One-year US inflation expectations rose to 3.4% in March from 3.0% in February, while expected gasoline-price growth jumped to 9.4%.
The dollar lost ground after the market got the one thing it had been missing for weeks: a delay in escalation. The move toward a two-week ceasefire reduced the urgency of defensive positioning and pushed the dollar lower against major peers.
Donald Trump’s announcement of a two-week ceasefire between the US and Iran brings welcome relief to Asian markets, according to strategists. Equities should see strong rallies across the region in the near term, they say. https://t.co/QHkyLu87kG
The US Dollar Index (USDX) fell toward 99, and the decline made sense because the previous rally had been built on war risk, oil disruption, and higher-for-long Fed pricing. Once the market paused, part of that premium came out.
The shift has improved risk sentiment, but it has not removed uncertainty. Missile threats, shipping risks, and doubts over whether the truce can hold are still sitting underneath the market. That leaves the dollar weaker than it was, but not decisively broken.
Hormuz Relief Helps the Dollar Fall, but Only to a Point
The market is reacting less to rhetoric and more to flow risk. The Strait of Hormuz carries roughly 20% of global oil supply, so any sign that passage could normalise quickly changes the inflation and growth outlook at once.
Oil prices dived, bonds rallied and stocks surged after a two-week ceasefire in the Middle East spurred a relief rally as investors cheered the possible resumption of oil and gas flowing through the Strait of Hormuz https://t.co/yKdGZJtNVhpic.twitter.com/Op3DxWK89L
Oil fell sharply after the ceasefire announcement, with Brent dropping to $94.43 and WTI to $96.82 in one major move. That immediately reduced some of the pressure that had been supporting the dollar.
That said, the market has learned not to trust promises alone. A temporary reopening reduces panic, but it does not fully remove the risk premium unless traders see stable flows and a broader peace framework take shape. That is why the dollar is softer, but not collapsing.
Inflation Risk Still Limits How Far the Dollar Can Fall
The softer dollar is running into a second force: inflation expectations are still too high to rebuild an easy Fed-cut story.
March survey data showed one-year inflation expectations rose to 3.4% from 3.0%, and expected gasoline-price inflation surged to 9.4%, the highest since the 2022 energy shock. Those numbers show that the oil shock has already filtered into household expectations, even as crude has pulled back from the panic highs.
That keeps the rate backdrop from turning fully dovish. A lower dollar usually needs either cleaner disinflation or softer growth data. Right now, the market only has partial relief on oil and a CPI report still ahead. Until that print lands, traders are unlikely to price an aggressive slide in the dollar.
CPI is the Next Real Test
The next step for USDX depends on whether US inflation data confirms that the energy shock is already feeding through. Business surveys are pointing in that direction.
US services growth slowed in March, while input prices rose at the fastest pace in more than 13 years. That combination matters because it points to a more difficult mix for the Fed: slower activity with hotter costs.
March ISM Services PMI falls to 54 from 56.1, coming in worse than estimated. pic.twitter.com/b62OHoQQFj
If CPI comes in firm, the dollar may stabilise quickly because the market will go back to higher-for-longer thinking. If CPI is softer than feared, the latest drop in USDX may extend because traders will start removing more of the inflation premium that built up through March.
Stay up-to-date on news around President Donald Trump and market impacts here.
Technical Analysis
The US Dollar Index (USDX) is trading near 98.67, pulling back from recent highs around 100.48 as momentum begins to fade. Price action shows a clear rejection from the 100 handle, with the latest candles reflecting increasing selling pressure and a shift into short-term consolidation.
The move lower suggests the recent bullish leg is losing strength, with the market now testing whether support can hold below the 99 level.
From a technical standpoint, the trend is transitioning from bullish to neutral. Price is slipping below the 5-day (99.55) and 10-day (99.65) moving averages, both of which are beginning to roll over and act as immediate resistance.
The 20-day (99.52) is flattening, signalling that upside momentum has stalled. This alignment points to weakening structure, with the recent rejection from 100 acting as a key turning point in the short term.
Key levels to watch:
Support: 98.70 → 97.90 → 96.40
Resistance: 99.40 → 100.00 → 100.50
The immediate focus is on the 98.70 support zone, which price is currently testing. A break below this level could open the path toward 97.90, where stronger support is likely to emerge.
On the upside, 99.40 is now acting as near-term resistance. A move back above this level would suggest a stabilisation in price and could lead to another attempt toward the 100.00 handle.
Overall, USDX is showing signs of short-term exhaustion after its recent rally. The rejection from the 100 level shifts the bias toward consolidation or a deeper pullback, unless buyers can quickly reclaim control above the 99.40–100.00 region.
What Traders Should Watch Next
The dollar now sits between easing war risk and persistent inflation risk. The truce has weakened the haven bid, but CPI can still rebuild support if price pressure stays sticky. The market will also keep watching whether the Hormuz reopening proves durable or starts to fray.
A stable ceasefire and softer inflation would likely pressure USDX further. A breakdown in either would likely pull buyers back into the dollar.
USDX fell because the market pulled out part of the safe-haven premium after Trump delayed threatened strikes on Iranian civilian infrastructure by two weeks and described the move as a “double-sided ceasefire.” That reduced immediate demand for the dollar as a defensive asset.
Why Did Safe-Haven Demand Fade So Quickly?
The market had been holding dollars because of war risk, Hormuz disruption, and higher-for-longer Fed pricing. A temporary pause in escalation gave traders a reason to unwind some of that positioning, even though the broader conflict risk has not disappeared.
Does a Two-week Ceasefire Mean the Dollar Will Keep Falling?
Not necessarily. A temporary truce can weaken the dollar in the short term, but the move may stall if shipping risks return, if the ceasefire breaks down, or if inflation data keeps the Fed cautious. The market still needs proof that energy flows are stabilising.
Why Does the Strait of Hormuz Matter So Much for the Dollar Index?
Hormuz matters because it carries roughly 20% of global oil supply. When traders think the route may reopen, oil prices ease, inflation fears soften, and some of the dollar’s support fades. When the route looks threatened, the dollar usually regains ground.
Why Hasn’t the Dollar Fallen More Sharply?
Inflation risk is still limiting the downside. One-year US inflation expectations rose to 3.4% in March from 3.0% in February, and expected gasoline-price inflation jumped to 9.4%. That keeps the market from fully rebuilding a dovish Fed story.
Start trading now – Click here to create your real VT Markets account
USD/JPY briefly moved above 160.00 on Tuesday for the first time since July 2024, before dropping back to about 159.60 and ending roughly flat. The 160.00 area previously led to direct intervention by Japan’s Ministry of Finance, prompting fresh market talk about possible action.
In Japan, household spending fell 1.8% year-on-year in February, compared with a 0.7% fall expected by economists and a 1.0% drop previously. Labour cash earnings rose 2.7% year-on-year, matching forecasts but slowing from 3.0% in January, while the Leading Economic Index rose to 112.4.
BoJ Rate Expectations And Key Data
Markets are pricing about a 70% chance of a Bank of Japan rate rise later this month, ahead of the April 28 meeting. Japan’s Producer Price Index is due on Thursday.
US attention is on Wednesday, with President Trump setting an 8 pm ET deadline for Iran to agree to a ceasefire and reopen the Strait of Hormuz, while Pakistan’s prime minister asked for a two-week extension. Iran rejected temporary ceasefire proposals and oil traded above $100 after US strikes on Iran’s Kharg Island, with oil infrastructure reportedly spared.
The FOMC Minutes are due Wednesday evening, alongside speeches from Fed officials Daly and Waller, after the Fed held rates at 3.50% to 3.75% in March. On the 15-minute chart, USD/JPY was at 159.57, with support at 159.50, 159.30 and 159.00, and resistance near the 200-period EMA at 159.70, then 159.90 and 160.20.
Given the extreme tension around the 160.00 level in USD/JPY, we see a market primed for a significant move. The conflict between potential Japanese intervention and safe-haven buying of the US dollar due to the Iran deadline creates immense uncertainty. This suggests that betting on a specific direction is risky, but betting on a spike in volatility is a more prudent strategy.
Options Positioning For Volatility
Derivative traders should consider buying volatility through options, such as a long straddle, which profits from a large price swing in either direction. The premium for these options is likely elevated, with implied volatility for one-month USD/JPY options probably pushing above 12% from the 9.5% we’ve seen recently. However, the cost may be justified by the sheer scale of the potential market reaction to either a military escalation or a surprise currency intervention.
When we look back at the interventions in late 2022, we saw the Ministry of Finance trigger moves of over five yen in a single session. A similar action now could easily send the pair back toward 155.00 almost instantly. This historical precedent makes holding unhedged long positions above 159.50 exceptionally dangerous.
The weak Japanese household spending data, which fell 1.8%, complicates the Bank of Japan’s position. This poor domestic outlook argues against the aggressive rate hikes that would be needed to truly strengthen the yen. While markets are pricing in a 70% chance of a hike this month, it may not be enough to counter the larger forces at play.
The geopolitical situation with Iran is the dominant driver for the US dollar right now, with West Texas Intermediate crude oil already trading above $100 a barrel. President Trump’s deadline is a critical catalyst that could push the dollar higher on a flight to safety if tensions escalate further. We saw a similar dynamic in late 2025 during the South China Sea naval exercises, which briefly pushed the dollar index up by 2%.
For those already long USD/JPY, hedging this position with out-of-the-money put options is essential. Buying puts with a strike price around 158.00 offers a relatively cheap insurance policy against a sudden drop caused by intervention. The upcoming FOMC minutes and Japanese Producer Price Index data will only add more fuel to the fire in the coming days.