Japan’s trade balance on a balance of payments basis fell to ¥2,709bn in February. It was ¥3,145bn in the previous period.
The change was a decrease of ¥436bn from the prior figure. The data point refers to the trade balance measured under balance of payments accounting.
Trade Surplus Declines And Yen Outlook
The drop in Japan’s trade surplus from ¥3.145 trillion to ¥2.709 trillion in February points to a potential weakening of the Yen. This decrease means less foreign currency is flowing into Japan, reducing demand for the JPY. For us, this flags a bearish outlook on the currency over the coming weeks.
We believe this data reinforces the case for a higher USD/JPY exchange rate, especially as the Bank of Japan maintains its accommodative stance while U.S. interest rates remain elevated. The policy divergence, which saw the USD/JPY rate climb over 8% in 2025, continues to strongly favor the dollar. Consequently, buying call options on USD/JPY could be a sound strategy to profit from expected yen weakness.
Historically, a weaker yen has provided a significant boost to Japanese corporate earnings, particularly for major exporters listed on the Nikkei 225. We saw this pattern throughout late 2024 and 2025, where yen depreciation directly correlated with stock market gains. Therefore, we are considering long positions in Nikkei 225 futures or call options to capitalize on this dynamic.
Recent increases in global crude oil prices, now hovering above $90 per barrel, likely contributed to this shrinking surplus by raising Japan’s import costs. This trend further supports our view of continued pressure on the yen. We must, however, watch for signs that the cause is a slowdown in global demand, which would be negative for Japanese equities despite a weaker currency.
Japan’s balance of payments trade balance fell to ¥2.709B in February. It was ¥3,145B in the previous period.
The latest figure shows a drop of about ¥3,142.291B from the prior level. The release compares February with the immediately preceding data point.
Trade Surplus Weakens
The decline in Japan’s February trade surplus is a signal we need to watch closely. This weakening suggests that either global demand for Japanese goods is cooling off or that domestic import demand is rising faster than exports. For us, this immediately points to potential weakness for the Japanese Yen (JPY).
Given this data, we should anticipate the USD/JPY currency pair to find renewed strength in the coming weeks. The Bank of Japan will likely view this as a reason to remain cautious about raising interest rates, further weakening the Yen’s appeal. We are seeing increased interest in buying USD/JPY call options with strike prices above the 158 level.
This export slowdown could also create headwinds for the Japanese stock market. We are particularly concerned about slowing demand from key partners, as recent data showed China’s imports from Japan fell 9.2% year-over-year in March. Traders should consider buying put options on the Nikkei 225 index as a hedge against a potential downturn in exporter stocks.
This is a notable shift from the dynamic we observed through 2025, where the trade balance was largely dictated by volatile energy import costs. The current weakness appears more linked to a fundamental drop in global demand, which could introduce more volatility. This environment suggests that buying straddles on major JPY pairs could be a viable strategy to trade the uncertainty.
Silver rose to a fresh weekly high in Asian trading on Wednesday, moving above $77.00 as the US Dollar fell broadly. The move supported dollar-priced commodities, including XAG/USD.
On Tuesday, US President Donald Trump said he would pause planned military strikes on Iran for two weeks, if Tehran fully reopens the Strait of Hormuz. Iran said it has accepted a two-week ceasefire, with talks due to start on Friday in Islamabad, Pakistan.
Market Reaction To Hormuz Developments
Iran’s foreign minister said safe passage through the Strait of Hormuz would be available for two weeks, which pushed Crude Oil prices lower. Lower oil prices eased inflation worries and reduced expectations of Federal Reserve rate rises, adding pressure to the Dollar and helping silver.
The report noted a lack of follow-through buying, which may limit further gains in the near term. Silver is a non-yielding asset and often benefits when interest rate expectations fall.
More broadly, silver prices can be influenced by geopolitics, recession fears, US Dollar moves, demand from exchange-traded funds, mining supply and recycling. Industrial use in electronics and solar power can shift demand, and silver often tracks gold, with the gold/silver ratio used to compare relative value.
We remember how the temporary US-Iran ceasefire last year sent Silver surging past $77 as optimism flooded the market. That rally was driven by a plummeting US Dollar as traders quickly priced out potential Federal Reserve rate hikes. The situation today, however, presents a very different landscape for precious metals.
Comparing Current Conditions With Last Year
Unlike last year’s diplomatic relief, we now see a stronger US Dollar, with the DXY index holding firm above 106 amid renewed geopolitical uncertainty in other regions. The Federal Reserve is signaling a “higher for longer” interest rate policy to combat stubborn core inflation, which the latest CPI report showed is still hovering at 3.1%. This hawkish monetary policy provides underlying support for the dollar and typically acts as a headwind for silver.
Despite the challenging interest rate environment, we are watching the robust industrial demand for silver. Global solar panel installations are up 15% year-over-year according to a recent report from the International Energy Agency, and demand from the electric vehicle sector has also exceeded forecasts. This strong underlying consumption provides a solid price floor that did not exist to the same extent last year.
The Gold/Silver ratio is a key indicator for us, and it is currently trading near a two-year high of 88:1. Historically, ratios above 85 have often preceded periods where silver begins to significantly outperform gold. This suggests that silver may be undervalued relative to gold, creating a potential opportunity for pair trades or outright long positions in silver.
Given this dynamic, we are considering strategies that capitalize on silver’s industrial strength while hedging against the strong dollar. Buying long-dated call options could provide upside exposure to a potential rally driven by industrial demand or a sudden geopolitical shift. This allows us to define our risk while positioning for the possibility that the Gold/Silver ratio begins to revert to its historical mean.
Gold (XAU/USD) rose to about $4,815 in early Asian trading on Wednesday after US President Donald Trump agreed to pause bombing Iran for two weeks. The move followed reports of a ceasefire arrangement involving Iran and Israel.
Trump said on Truth Social late Tuesday that the two-week ceasefire depends on Iran agreeing to reopen the Strait of Hormuz. A White House official said Israel has also agreed to the ceasefire.
Ceasefire Conditions And Regional Mediation
Pakistan, described as a mediator between the US and Iran, asked Trump to approve a two-week ceasefire and extend a deadline linked to ending Iran’s blockade of Gulf oil. The request came as tensions in the Iran conflict increased.
An Iranian official said talks with the US will be held in Islamabad to finalise details within a maximum of 15 days. Iran said the meeting will start on Friday and could be extended if both sides agree.
Oil prices have risen since the conflict intensified, raising supply concerns and adding to inflation pressure. Higher inflation can limit central banks’ ability to cut rates, which can affect demand for non-interest-bearing gold.
Markets are also watching the minutes from the Federal Reserve’s March meeting, due on Wednesday.
Volatility Reset And Tactical Positioning
With gold near $4,815, this two-week ceasefire presents a clear opportunity for a pullback from its recent war-premium highs. We believe traders should consider short-term bearish positions on the metal, such as buying puts or establishing bear call spreads. The historic surge, which dwarfed the previous all-time highs seen back in 2024, was driven by a flight to safety that will likely unwind on this news.
The reopening of the Strait of Hormuz, through which over 20% of the world’s total oil supply flows, should cause a sharp drop in crude prices. We saw WTI crude spike dramatically during the blockade, reminiscent of the supply shocks from early 2025. Derivative traders could look to short oil futures or buy puts on major energy ETFs to capitalize on this expected supply relief.
We expect a significant crush in implied volatility across the board, as the market breathes a sigh of relief. The VIX index, which likely soared above the crisis level of 35 during the conflict, should fall sharply. Selling VIX futures or call options is a direct way to trade this normalization of risk perception.
However, the ceasefire is explicitly temporary, with negotiations that could easily collapse within 15 days. This suggests that any drop in oil and gold prices offers a prime opportunity to buy cheaper, longer-dated protection for a potential re-escalation. We are looking at out-of-the-money call options on gold and oil with expirations in about one month to position for a snap-back in tensions.
This de-escalation complicates the Federal Reserve’s next move, and today’s minutes will be viewed through this new lens. We recall how stubbornly high energy prices in 2025 kept headline inflation above 4%, preventing rate cuts. A sustained drop in oil, should peace hold, could soften inflation expectations and be bullish for equity index futures.
GBP/USD rose from the low 1.3200s to a session high near 1.3400 after President Trump announced a two-week pause in military operations against Iran. The pair moved into the upper 1.3300s and traded above the 50 and 200-period hourly moving averages.
Markets shifted towards risk assets as WTI crude fell from above $106 to below $90 per barrel. S&P 500 futures gained over 1%, while the US Dollar Index (DXY) slipped back towards 100.00.
Uk Data And Pmi Weakness
UK data was weaker, with the final March services PMI revised to 50.5 from 51.2 and down from February’s 53.9. The composite PMI fell to 50.3, with new work dropping for the first time since November 2025 and input cost inflation at an eleven-month high.
The Bank of England has held rates at 3.75% since December 2025 and voted unanimously to keep them unchanged in March. Pricing moved from two to three cuts in 2026 to four quarter-point hikes by year-end, before the ceasefire altered rate expectations.
Iran rejected a temporary ceasefire hours before the announcement, and Polymarket put the chance of a lasting ceasefire by end-April at 22.5%. Key releases include FOMC Minutes (18:00 GMT), Core PCE (12:30 GMT), and March CPI at 12:30 GMT, with CPI seen at 3.3% YoY (prior 2.4%) and core at 2.7% (prior 2.5%).
UK indicators due include Halifax House Prices, construction PMI, the BoE Credit Conditions Survey, and RICS Housing Price Balance at -18%. GBP/USD levels cited include the 200-period EMA at 1.3261, resistance near 1.3480, and a range between 1.3160 and 1.3480.
Looking back to this time in 2025, the market was reacting to the temporary ceasefire announcement, which we viewed with heavy skepticism. The surge in GBP/USD was a classic risk-on dollar selling event, but implied volatility in the options market remained high, signaling a disbelief in the truce’s durability. This is similar to the VIX index holding above 30 in early 2022 even on brief market rallies, showing that traders were still pricing in significant tail risk.
Options Volatility And Risk Hedging
The weakness in the UK economy, particularly the dismal services PMI revision to 50.5, was the critical factor for us. This stagflationary signal meant buying GBP/USD was a risky bet on a fragile currency, not just a simple play against the dollar. Therefore, many of us preferred strategies like buying GBP/USD put options to protect against a reversal, or even initiating relative value trades like shorting the pound against a stronger currency.
With major data points like the US CPI and FOMC Minutes due that week in 2025, positioning for central bank divergence was key. Historically, a surprise of just 0.2% in US Core CPI can move GBP/USD by over 40 pips almost instantly, making short-dated options that expired after the release a popular tool. This allowed us to trade the expected burst of volatility around the announcement without carrying the risk over many weeks.
The dramatic fall in WTI crude oil from over $106 to below $90 was the primary driver of the dollar weakness we saw. This tight correlation meant many of us were hedging our currency positions directly in the energy market. A common structure was to pair a long GBP/USD spot position with buying put options on WTI futures, creating a buffer in case the ceasefire collapsed and oil prices reversed sharply higher.
The technical levels mentioned at the time, such as resistance near 1.3480, were perfect for structuring options trades. We saw significant volume in weekly call options with a 1.3500 strike price, which offered a cheap way to bet on a continued rally if the positive sentiment held. At the same time, the 1.3300 level became a popular strike for put options, serving as a floor to hedge long positions against a sudden return of risk aversion.
Japan’s current account (not seasonally adjusted) was below forecasts in February. The forecast was ¥3549B.
The actual figure was ¥3.933B. This compares directly with the stated forecast gap.
Current Account Surprise And Yen Implications
With Japan’s February current account surplus coming in at ¥3.93 trillion, well above the ¥3.55 trillion forecast, we see this as a clear signal of underlying yen strength. This positive surprise suggests robust export performance and strong returns on overseas investments flowing back into the country. Derivative traders should interpret this as a headwind for the USD/JPY pair.
This strong economic data provides more justification for the Bank of Japan to continue its policy normalization path. After we finally saw the end of negative interest rates in late 2025, another small rate hike is now more firmly on the table. This diverges from the outlook for many other central banks, creating a favorable environment for the yen.
Adding to this, we see that core inflation has remained stubbornly above the BoJ’s 2% target, with recent statistics showing it at 2.3%. This is a significant shift from the deflationary environment we experienced for years prior to 2025. This persistent inflation increases the pressure on the central bank to act sooner rather than later.
In the coming weeks, we believe traders should consider positioning for a lower USD/JPY. Buying put options on the pair with expirations in May or June could be an effective strategy to capitalize on a potential downward move. This data could be the catalyst that pushes the pair below key technical support levels.
Given the risk of verbal or actual intervention from the Ministry of Finance to manage the currency’s strength, implied volatility may rise. Therefore, strategies that benefit from increased price swings, such as long straddles, might also be worth considering. This allows traders to profit from a large move in either direction, hedging against unexpected policy announcements.
Policy Divergence And Trading Considerations
The policy divergence between a more hawkish Bank of Japan and a Federal Reserve that is holding rates steady further supports this view. We are looking at a fundamental shift that has been building over the last year. This current account surplus figure is a key piece of evidence supporting a stronger yen going forward.
AUD/USD rose over 1.3% on Tuesday, climbing from about 0.6970 to near 0.7060 by the close. The move followed a two-week pause in military action against Iran, and WTI fell from above $106 to below $90 per barrel.
WTI remains about 55% above its pre-war level near $58 after the late-February Strait of Hormuz disruption. AUD/USD moved back above the 200-period EMA on the four-hour chart near 0.6970, marking its strongest one-day rise in weeks.
Risk Sentiment And Oil Shock
Markets had been pricing an RBA rate move to 4.35% or higher at the May meeting amid higher energy costs. In Australia, the S&P Global Composite PMI for March fell to 46.6 from 47, while the TD-MI Inflation Gauge rose 1.3% month-on-month and the annual rate increased to 4.3% from 3.6%.
The pause was announced ahead of a midnight GMT Wednesday deadline set by President Trump. Pakistan’s Prime Minister brokered the pause, and Tehran delivered a 10-point proposal, after Iran had rejected a 45-day ceasefire earlier.
S&P 500 futures rose 1.1% and Nasdaq futures gained 1.2%, reducing US Dollar demand. February US Durable Goods Orders fell 1.4%, while the ex-transport measure rose 0.8%.
FOMC Minutes are due Wednesday, with speeches from Fed officials Daly and Waller. Traders are watching for shipping to restart through the Strait of Hormuz after four deadline changes since late February.
Technically, the Stochastic Oscillator is nearing overbought. Holding above 0.7000 may target 0.7120, while a drop back below 0.6970 may refocus attention on 0.6900.
Lessons From The April 2025 Rally
Looking back at the sharp AUD/USD rally in early April 2025 reminds us how sensitive the pair is to geopolitical shocks and shifts in risk appetite. The sudden de-escalation between the US and Iran sent oil prices tumbling, which dramatically altered the inflation outlook for the Reserve Bank of Australia. We should remain positioned for similar volatility, as any unexpected peace dividend can trigger an aggressive unwinding of safe-haven US Dollar positions.
That dynamic from last year, where falling energy prices eased pressure on the RBA, contrasts with today’s situation. The RBA has now held its cash rate steady at 4.35% for seven consecutive meetings, as the quarterly Trimmed Mean CPI has only cooled to 3.7%, still stubbornly above target. This sustained restrictive policy means any sudden drop in commodity prices could give the RBA cover to signal a dovish pivot, creating a powerful catalyst for traders using interest rate swaps to bet on rate cuts.
We learned in 2025 that headlines can spark huge rallies, but follow-through requires confirmation, which in that case was the physical resumption of shipping. Today, with the US Dollar supported by a Federal Reserve hesitant to cut rates while core PCE remains at 3.0%, we should be wary of chasing headline-driven rallies. Instead, we can use options to define our risk, such as buying short-dated AUD/USD call spreads to cheaply position for a potential upside surprise without being fully exposed if it proves to be another false dawn.
The collapse in WTI crude from over $106 to below $90 a barrel was the core driver of the 2025 move, directly impacting Australia’s terms of trade and inflation expectations. With WTI currently trading near $92 on the back of tight supply and steady global demand, the memory of last year’s 15% drop in just a few sessions is a crucial lesson. Traders holding long energy positions should consider using puts on oil futures as a portfolio hedge against a sudden geopolitical breakthrough that could once again flood the market.
Technically, the 2025 rally saw AUD/USD slice through its 200-period moving average on the four-hour chart, a key level that had been resistance. That event shows how quickly sentiment can invalidate technical patterns, turning former ceilings into new floors for price. We can apply this by setting alerts around major long-term moving averages, and if a risk-on event pushes the price through one, we can use it as a signal to initiate positions with a stop-loss just below that same average.
EUR/USD rose to about 1.1670 in early Asian trading on Wednesday, moving above 1.1650. The Euro strengthened against the US Dollar after US President Donald Trump agreed to a two-week ceasefire with Iran.
A White House official said Trump agreed to the two-week ceasefire on Tuesday, on the condition that Iran reopen the Strait of Hormuz. CNN reported that Israel also agreed to the ceasefire.
Ceasefire Developments And Market Focus
The announcement followed a proposal from Pakistan’s Prime Minister Shehbaz Sharif for a ceasefire to allow diplomatic talks between the US and Iran. Markets are watching developments around the ceasefire and wider Middle East tensions.
Later on Wednesday, attention turns to the minutes of the Federal Open Market Committee meeting. The minutes may provide detail on how officials assess the recent energy shock linked to Middle East conflicts.
Looking back at the events of 2025, we saw the EUR/USD spike above 1.1650 on the temporary US-Iran ceasefire news. That rally was a classic risk-on reaction, driven by the immediate relief of tensions in the Strait of Hormuz. The effect was short-lived, as the underlying disagreements were never resolved.
As of today in April 2026, the market has completely priced out that optimism, with EUR/USD having fallen back to a range around 1.0900. We’ve seen Brent crude prices creep back up, averaging over $92 per barrel in the first quarter of 2026, reflecting the renewed geopolitical risk premium. This sustained pressure on energy contrasts sharply with the brief dip we saw following the 2025 ceasefire announcement.
Positioning And Volatility Implications
The lesson from last year is that any diplomatic progress can cause sharp, but temporary, drops in volatility. We are seeing one-month implied volatility for EUR/USD options trading near 8.2%, up significantly from the lows of around 5.5% seen during that brief de-escalation period. Traders should consider buying options, such as straddles or strangles, to position for sharp moves in either direction as headlines continue to create uncertainty.
Last year, we noted the Federal Reserve was monitoring the energy shock, but their focus has since returned to domestic inflation and labor data. Recent inflation figures in the US for February 2026 came in at 2.8%, still stubbornly above the Fed’s target, limiting their ability to ease policy. In contrast, the European Central Bank remains more exposed to energy price volatility, creating a policy divergence that weighs on the euro.
Given this context, selling rallies in EUR/USD on any new, temporary peace headlines appears to be the prudent strategy. We can use last year’s spike to 1.1670 as a historical reference point for an extreme risk-on reaction. Using call credit spreads on the euro could be an effective way to collect premium while defining risk against another short-lived relief rally.
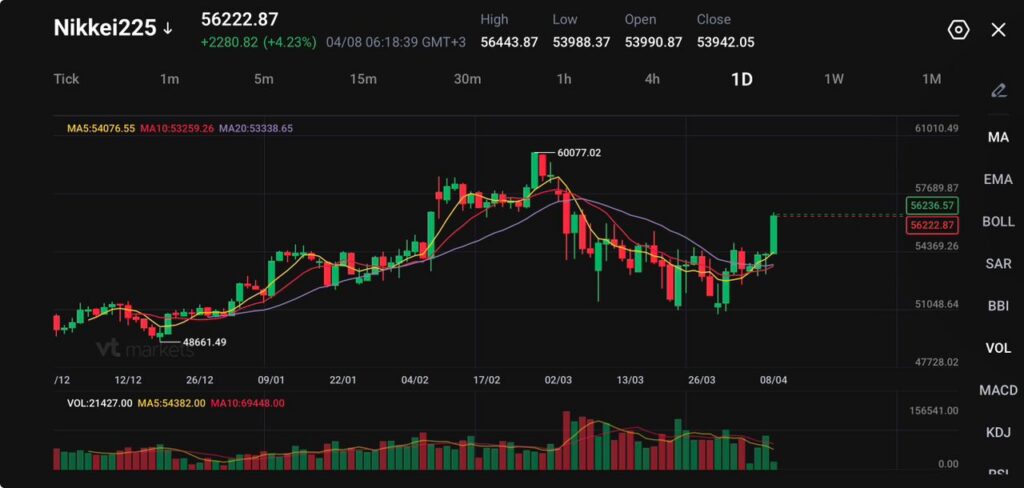
Nikkei 225 rose 4.96% to 56,078.83 in the morning session, while the broader move in the chart shows 56,222.87, up 2,280.82 (+4.23%).
A two-week ceasefire and a temporary reopening of the Strait of Hormuz triggered a relief rally across Asia and knocked back crude prices.
Japan posted a current account surplus of 3.933 trillion yen in February, above the 3.549 trillion yen forecast, with exports up 2.8% and imports up 9.7%.
Japanese equities jumped as traders rushed back into risk after the ceasefire announcement cut the immediate threat to Gulf energy flows. The Nikkei 225 rose 4.96% to 56,078.83 in the morning session, and the broader chart reading at 56,222.87 shows the strength of the rebound.
The move followed a sharp drop in crude after the United States and Iran agreed to a two-week ceasefire tied to safe passage through the Strait of Hormuz.
Lower oil is a direct tailwind for Japan. The country imports most of its energy, so a fall in crude reduces pressure on margins, cools imported inflation, and eases the drag on household spending. That shift supported a broad rally rather than a narrow bounce.
A cautious near-term view still favours follow-through while crude stays off the highs, though the market will keep treating the ceasefire as temporary until shipping flows normalise more clearly.
Exporters, Banks, and Chip Stocks Lead the Charge
The rebound spread across nearly every major cyclical group. Exporters rose as the drop in oil improved the macro backdrop. Financials moved higher as lower energy stress reduced immediate stagflation fears. Chip names and index heavyweights led the sharpest gains as traders rotated back into growth after last week’s risk-off trade.
In the session snapshot, SoftBank Group rose more than 6%, Fast Retailing gained almost 5%, Toyota climbed almost 4%, and Honda added more than 2%.
In technology, Advantest jumped more than 10%, Screen Holdings surged almost 8%, and Tokyo Electron advanced almost 9%. Banks also joined the move, with Sumitomo Mitsui Financial and Mizuho Financial up more than 4%, while Mitsubishi UFJ Financial gained almost 3%.
The laggards made sense too. Energy names slipped because the crude rally broke lower. Inpex fell more than 5%, while shipping stocks such as Mitsui O.S.K. Lines, Kawasaki Kisen Kaisha, and Nippon Yusen moved lower as the oil risk premium started to unwind.
With the Nikkei’s performance increasingly tied to global tech flows, traders may consider tracking key AI and semiconductor stocks available across our CFD Shares offering.
Wall Street Gave the Rally a Solid Base
The overnight lead from the United States also helped. The Nasdaq rose 0.1% to 22,017.85, the S&P 500 edged up 0.1% to 6,616.85, and the Dow slipped 0.2% to 46,584.46. That was not a runaway rally, but it was enough to keep the tone constructive going into the Asian session.
The bigger catalyst still came from the ceasefire and the drop in oil, but the US close removed one more obstacle to aggressive dip-buying.
US stocks ended mixed amid signs of progress in negotiations as the minutes ticked down to President Trump's deadline for Iran to open the Strait of Hormuz https://t.co/fZemHx9vEVpic.twitter.com/GxQ1ObQB2B
Across Asia, the move was broad. South Korea and Taiwan surged, while Hong Kong, China, Australia, and New Zealand all traded higher. That regional strength confirmed that traders were buying the same macro theme everywhere: lower oil, lower inflation pressure, and a temporary break in the war premium.
Nikkei 225 Technical Outlook
The Nikkei 225 is trading near 56,223, staging a sharp rebound after the recent pullback that followed the rejection from the 60,077 high.
Price action shows strong bullish momentum returning, with a wide bullish candle breaking out from the recent consolidation range and pushing back above key moving averages.
This move suggests buyers are stepping back in aggressively after the correction phase seen through March.
From a technical standpoint, the structure is shifting back toward bullish. Price has reclaimed the 5-day (54,076) and 10-day (53,259) moving averages, both of which are now turning higher and providing immediate support.
The 20-day (53,338) is also flattening and beginning to slope upward, indicating that downside pressure is fading and momentum is rebuilding. The recent push higher signals a potential trend continuation if price can sustain above current levels.
Key levels to watch:
Support: 54,300 → 53,300 → 51,000
Resistance: 56,300 → 57,700 → 60,000
The immediate focus is on the 56,300 zone, which price is currently testing as resistance. A sustained break above this level could open the path toward 57,700, with a broader move potentially retesting the 60,000 region if momentum continues to build.
On the downside, 54,300 now acts as first support, aligning with the recent breakout area. A break below this level could signal a loss of short-term momentum and lead to a pullback toward 53,300, though such a move would likely remain corrective within the improving structure.
Overall, the Nikkei is showing strong recovery momentum after its recent dip, with buyers regaining control in the short term. If price can hold above the 54,000–54,300 region, the bias shifts back toward upside continuation, with the market potentially building toward another test of prior highs.
What Traders Should Watch Next
The next move depends on whether the ceasefire turns into stable energy flows rather than another short pause. Lower crude has done most of the heavy lifting so far.
If Hormuz traffic stays open enough to keep oil under control, the Nikkei can keep rebuilding toward the upper 50,000s. If the truce frays and crude reverses higher, the same sectors driving today’s rally could give back ground quickly.
The rally came after a two-week ceasefire and a temporary reopening of the Strait of Hormuz reduced immediate energy-supply fears. Lower oil prices improved the outlook for Japan, which imports most of its energy, and that helped trigger a broad risk-on move across the region.
Why Does Falling Oil Help Japanese Stocks So Much?
Lower crude prices reduce imported energy costs, ease inflation pressure, and improve the outlook for household spending and corporate margins. That tends to support the Nikkei more than many other major indices because Japan is highly exposed to external energy prices.
Why Did Exporters, Chip Stocks, and Banks Lead the Rally?
Exporters benefited from an improving macro backdrop, chip stocks tracked stronger risk appetite and growth expectations, and banks gained as the market moved away from the worst stagflation fears. The move was broad enough to lift most cyclical sectors together rather than just one narrow theme.
Why Did Energy Stocks Lag the Nikkei?
Energy names weakened because the same drop in oil that helped the broader index reduce earnings support for producers and oil-linked shares. That is why stocks such as Inpex moved the other way while the rest of the market rallied.
What Did the Current Account Data Add to the Story?
Japan posted a 3.933 trillion yen current account surplus in February, above the 3.549 trillion yen forecast. Exports rose 2.8%, imports rose 9.7%, and the trade balance showed a 267.6 billion yen surplus. That data added to the sense that Japan’s external position was holding up better than feared.
Start trading now – Click here to create your real VT Markets account
South Korea’s current account balance rose in February. It increased to 23.19B from 13.26B in the previous period.
Given the massive jump in South Korea’s current account surplus, we should anticipate continued strength in the Korean won. This surplus indicates a huge demand for the won from foreign trading partners. For the coming weeks, we will be looking at long positions on the KRW against the USD through futures or options contracts.
This economic strength is largely powered by a global recovery in semiconductor demand, with recent preliminary trade data for March 2026 showing chip exports are already up 18% year-over-year. The USD/KRW exchange rate has already broken below the key 1,280 support level on this news. We see a potential move towards 1,250 in the near term.
This trend also signals a bullish outlook for the Korean stock market, particularly export-heavy giants in the tech and auto sectors. We should consider buying call options or futures on the KOSPI 200 index. These companies are the direct beneficiaries of a strong export cycle and a favorable global economic backdrop.
The size of this surplus was a surprise, which means we can expect increased volatility in currency markets leading up to the release of the March data in early May. We could use straddles on the KRW to play a big move, as the market will be pricing in either a continuation of this powerful trend or a sharp reversion. This is a significant shift from what we saw last year in 2025, when the trade balance was far more unpredictable due to fluctuating global energy prices.
That prior uncertainty in 2025 kept many traders on the sidelines. The current stability and powerful export performance suggest a much clearer directional trend for us to follow. The strength of the economy also reduces the likelihood of an interest rate cut by the Bank of Korea, which provides a fundamental floor for the won’s value.