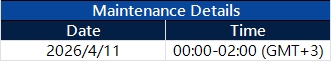
As part of our commitment to provide the most reliable service to our clients, there will be maintenance this weekend.
Maintenance Details:
Please note that the following aspects might be affected during the maintenance:
1. The price quote and trading management will be temporarily disabled during the maintenance. You will not be able to open new positions, close open positions, or make any adjustments to the trades.
2. There might be a gap between the original price and the price after maintenance. The gaps between Pending Orders, Stop Loss, and Take Profit will be filled at the market price once the maintenance is completed. It is suggested that you manage the account properly.
3. During the maintenance period, VT Markets APP will not be available. It is recommended that you avoid using it during the maintenance.
4. During the maintenance hours, the Client portal will be unavailable, including managing trades, Deposit/Withdrawal and all the other functions will be limited.
The above data is for reference only. Please refer to the MT4/MT5 software for the specific maintenance completion and marketing opening time.
Thank you for your patience and understanding about this important initiative.
If you’d like more information, please don’t hesitate to contact [email protected]
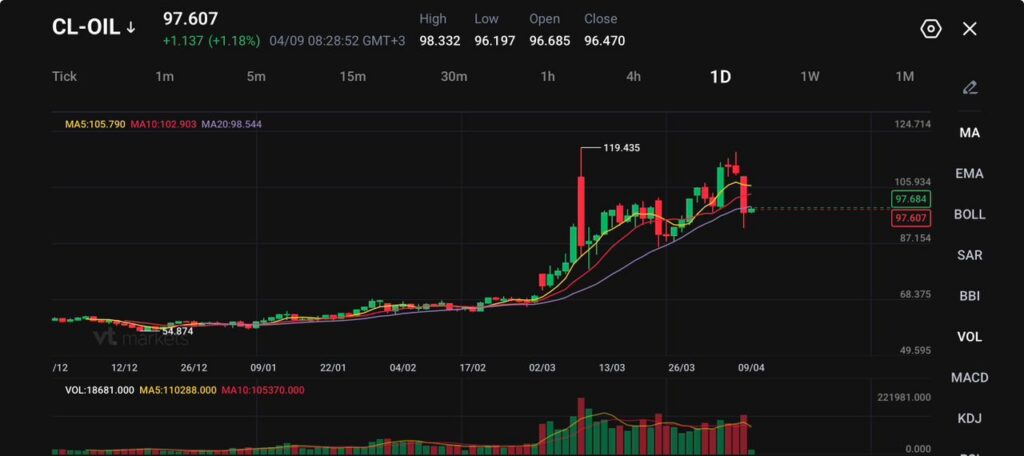
CL-OIL trades at 97.607, up 1.137 (+1.18%), after a high of 98.332 and a low of 96.197.
Forecasts still point to firm prices, with 2Q Brent seen at $98.00 and WTI at $92.50.
Shipping through the Strait of Hormuz remains constrained by security fears, insurance costs, and operational bottlenecks, which limits how much supply can return quickly.
Oil sold off hard on the first ceasefire headlines, but the rebound shows the market no longer believes a truce automatically means smooth energy flows. Prices are now rebuilding because traders are starting to focus on what happens after the headline.
Cargoes still need safe passage, insurers still need to price risk, and shipowners still need confidence that routes will stay open.
That is why the correction may have already gone too far. The market removed a large part of the war premium quickly, but physical conditions in the Gulf still look too strained for a clean return to pre-crisis movement.
A cautious near-term view still favours elevated prices while the ceasefire remains fragile and actual transit conditions lag the political message.
Hormuz is Open in Name More Than in Practice
The main issue is not whether a diplomatic pause exists. The issue is whether enough oil can move through Hormuz without disruption, delay, or extreme cost. The latest reporting shows the strait remains logistically constrained by security threats, mine risks, political control measures, and elevated insurance premiums. That keeps effective supply tighter than a ceasefire headline alone would suggest.
Traffic has improved only marginally from the worst point of the disruption. That matters because crude does not need a full shutdown to stay expensive. A market can stay tight when flows are partial, slow, expensive, or highly selective. The energy system prices reliability, not just theoretical access.
That leaves oil supported even after the steep initial drop.
LNG May Move Faster Than Crude
One exception may be LNG cargoes. The latest shipping read suggests some LNG vessels are already loaded and could move on relatively short notice if passage risk becomes manageable. That creates a split inside the energy complex.
Gas cargoes may recover somewhat faster than crude if operators judge the route passable, while oil stays more heavily affected by insurance, shipowner caution, and wider physical bottlenecks.
Asian LNG prices are set to fall after the US and Iran agreed to a two-week ceasefire that could temporarily reopen the Strait of Hormuz, bringing respite to global energy markets https://t.co/mtJ3oodoKN
That distinction matters because it limits the idea of a full energy normalisation. Some segments may recover sooner, but the oil market is still treating the supply chain as damaged rather than healed.
The Market is Repricing From Panic Into Scarcity
The move now looks less like panic and more like a slower scarcity trade. Forecasts for the second quarter still sit at $98.00 for Brent and $92.50 for WTI, which fits a market where the worst-case supply shock has eased but normal flows have not returned.
The rebound toward the high $90s lines up with that view. Prices no longer need to stay above $110 to signal stress. They only need to remain high enough to reflect limited confidence in the physical restart.
Even with a ceasefire agreement, stranded vessels and rising fuel costs are rippling through global trade, testing American guarantees of safe passage https://t.co/XmufFBaq9A
That also explains why the market is no longer trading in a straight line. The first leg was driven by war premium. The current phase is being driven by how much of that premium should remain embedded while shipping stays constrained.
A cautious forecast still points to a choppy but supported market rather than a clean collapse back toward pre-crisis levels.
CL-OIL Technical Outlook
CL-OIL is trading near 97.61, pulling back sharply after failing to sustain momentum near the recent highs around 119.43. Price action shows a clear rejection from the upper range, with the latest move breaking below short-term structure and signalling a shift from bullish continuation into a corrective phase.
The drop toward the 97–98 zone reflects increasing selling pressure as the market unwinds part of its earlier rally.
From a technical standpoint, the trend is transitioning toward neutral. Price has slipped below the 5-day (105.79) and 10-day (102.90) moving averages, both of which are now turning lower and acting as overhead resistance.
The 20-day (98.54) is being tested, and its ability to hold will be key in determining whether this remains a pullback or develops into a deeper trend reversal.
Key levels to watch:
Support: 97.00 → 93.90 → 87.15
Resistance: 100.00 → 102.90 → 105.90
The immediate focus is on the 97.00 support zone, which price is currently testing. A break below this level could open the path toward 93.90, signalling a deeper correction within the broader move.
On the upside, 100.00 is now acting as near-term resistance. A move back above this level would suggest stabilisation and could lead to a recovery toward 102.90, where stronger resistance is likely to emerge.
Overall, oil is undergoing a corrective pullback after an extended rally. The loss of short-term moving average support suggests momentum has weakened, and unless price can reclaim the 100–103 region, the risk remains tilted toward further downside or consolidation in the near term.
What Traders Should Watch Next
The next move depends on physical flow, not just diplomatic language. Watch whether ship traffic through Hormuz actually improves, whether insurance costs ease, and whether LNG movement starts to recover faster than crude.
If transport remains patchy and expensive, the market can keep oil close to current levels even without a full return to war panic. If flows normalise faster than expected, the correction can extend further.
Learn more about trading Energies on VT Markets here.
Trader Questions
Why Did Oil Prices Rebound Even After The Ceasefire Announcement?
Oil rebounded because the ceasefire reduced panic but did not restore normal supply conditions. Security concerns, high insurance costs, and operational bottlenecks are still limiting how much crude can move through the Strait of Hormuz.
Why Is The Strait Of Hormuz Still So Important For Oil Prices?
The market still treats Hormuz as the key risk point because supply is only useful if it can move safely and reliably. If transit stays partial, slow, or expensive, oil can remain supported even without a full shutdown.
Does A Ceasefire Mean Oil Prices Should Fall Straight Away?
No. A ceasefire can remove part of the war premium, but prices may stay firm if physical flows do not recover quickly. Traders are now watching actual shipping conditions more closely than diplomatic language alone.
Why Could The Initial Selloff In Oil Have Been Too Deep?
The first move lower priced in relief quickly, but the market is now reassessing whether enough supply can really return. Forecasts still point to 2Q Brent averaging $98.00 and WTI averaging $92.50, which suggests prices may not fall back to pre-crisis levels soon.
Why Might LNG Recover Faster Than Crude?
Some LNG cargoes are already loaded and may be able to move on short notice if passage conditions improve. Crude faces a heavier drag from insurance, shipowner caution, and broader operational friction.
Start trading now – Click here to create your real VT Markets account
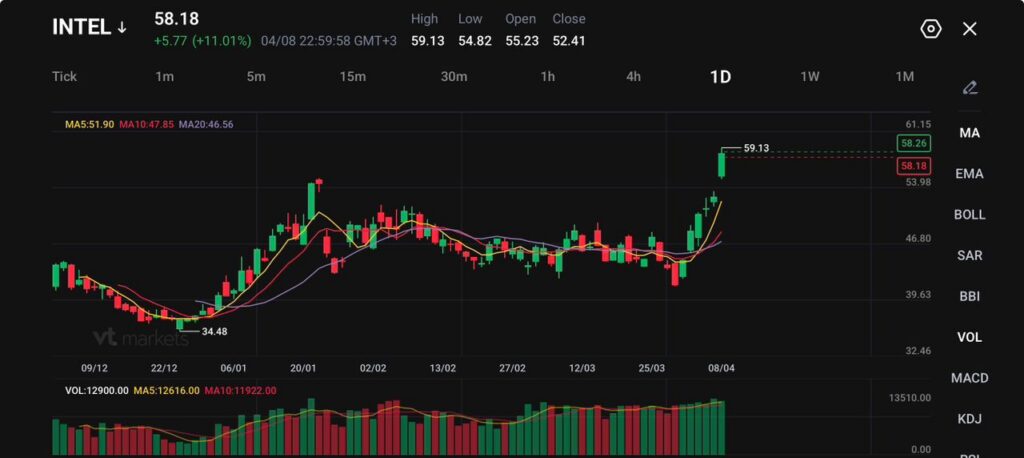
Intel rose 11% to 58.18, while AEHR jumped 26% and MRVL gained 5% as traders piled into semiconductor names.
Intel’s new inference platform with SambaNova Systems is targeted for the second half of 2026.
KeyBanc raised its Intel price target to $70 from $65 and kept an Overweight rating, citing stronger server CPU demand, pricing gains, and improving 18A yields.
Intel shares surged as traders rotated back into semiconductor stocks and looked for names with clearer AI infrastructure exposure. The stock climbed 11% to 58.18, hit an intraday high of 59.13, and closed well above the prior 52.41 close.
Intel shares jump 9% after buying back Ireland chip fab in sign of renewed strength https://t.co/qM5mviVPq4
That move came alongside a wider rally in chip stocks, with Aehr Test Systems up 26% and Marvell Technology up 5%.
The move was not just about sector momentum. Intel had fresh company-specific catalysts tied to AI compute, foundry progress, and silicon partnerships. That gave the rally more substance than a simple sympathy move.
A cautious read still applies here. A double-digit jump can pull in fast money quickly, but the market will now expect execution to match the new optimism.
SambaNova Deal Strengthens Intel’s AI Positioning
One of the key drivers was Intel’s partnership with SambaNova Systems. The companies introduced a heterogeneous inference architecture that combines GPUs, SambaNova’s reconfigurable dataflow units, and Intel’s Xeon 6 processors. The platform is expected to launch in the second half of 2026.
The partnership is key for Intel because the market has been asking where the company fits in the next wave of AI infrastructure. Xeon alone was not enough to win that argument. A broader inference stack gives Intel a more credible role in AI deployments where customers want mixed architectures rather than one-vendor systems.
The market is starting to treat Intel less like a lagging PC and server name and more like a company trying to rebuild relevance across the AI compute chain.
Terafab Adds Another Strategic Layer
Intel also gained support from its involvement with SpaceX, xAI, and Tesla around silicon fabrication technologies tied to Project Terafab. The proposed facility is designed to combine chip design, manufacturing, packaging, and testing into one AI-focused production pipeline.
Intel joins Musk's Terafab project as Tesla, SpaceX, and xAI push to produce their own chips. pic.twitter.com/K0YFrbCMEI
That project is still ambitious and still carries execution risk. Even so, it gives Intel another way to fit into the market’s biggest structural theme. Traders are willing to reward companies that can attach themselves to AI infrastructure early, especially when the story includes foundry capability and advanced packaging.
For Intel, that creates a more expansive narrative than a standard cyclical recovery in CPUs.
Analysts Are Turning More Positive
The rally also picked up speed after KeyBanc raised its Intel price target to $70 from $65 and kept an Overweight rating. The firm pointed to strong server CPU demand, pricing increases, and improving 18A yields as the Panther Lake ramp moves forward.
That combination hits the core areas traders care about most. Demand supports revenue. Pricing supports margins. Yield improvement supports credibility in Intel’s manufacturing recovery.
The market has spent months doubting whether Intel could close the gap in process execution. A better 18A story changes that conversation, even if it does not settle it yet.
Intel Technical Outlook
Intel (INTC) is trading near 58.18, surging sharply higher after a strong breakout from the recent consolidation range. Price action shows aggressive bullish momentum, with a large impulsive move pushing the stock up toward the 59.13 high. This rally marks a clear shift in sentiment, as buyers step in decisively following the period of sideways movement seen through March.
From a technical standpoint, the trend has turned firmly bullish. Price is trading well above all key moving averages, with the 5-day (51.90) leading sharply higher, followed by the 10-day (47.85) and 20-day (46.56), all sloping upward. This strong alignment reflects a powerful trend shift, with momentum accelerating as price breaks out from prior resistance levels.
Key levels to watch:
Support: 54.00 → 51.90 → 47.80
Resistance: 59.10 → 61.15 → 63.00
The immediate focus is on the 59.10 zone, which aligns with the recent high. A clean break above this level could open the path toward 61.15, with further upside potential if bullish momentum continues to build.
On the downside, 54.00 now acts as initial support, marking the breakout area. A pullback toward this level would likely be viewed as a retest, with buyers expected to defend it if the trend remains intact.
Overall, Intel is showing strong breakout momentum with clear bullish structure. As long as price holds above the 54.00 region, the bias remains to the upside, with the current move suggesting the potential for further continuation rather than a short-lived spike.
What Traders Should Watch Next
The next move depends on whether Intel can turn the new narrative into repeatable evidence. Traders will watch three things closely: updates on the SambaNova launch timeline in the second half of 2026, evidence that 18A yields continue to improve as Panther Lake ramps, and deeper detail on how Intel fits into the Terafab supply chain.
The stock has already re-rated on better expectations. The next stage will depend on execution, not just excitement.
Create a live VT Markets account today to access our platform features, including market insights and educational content.
Trader Questions
Why Did Intel Stock Jump More Than 11%?
Intel rose after investors responded to a stronger AI narrative, a new partnership with SambaNova Systems, growing excitement around Project Terafab, and a more bullish analyst target.
What Is Intel’s New AI Partnership With SambaNova?
Intel and SambaNova introduced a heterogeneous inference architecture combining GPUs, SambaNova’s reconfigurable dataflow units, and Intel’s Xeon 6 processors, with launch targeted for the second half of 2026.
Why Does The SambaNova Deal Matter For Intel?
It gives Intel a clearer role in AI inference infrastructure and helps position the company inside mixed-architecture AI deployments rather than just traditional CPU markets.
What Is Project Terafab And Why Is Intel Involved?
Project Terafab is a proposed AI-focused semiconductor facility tied to SpaceX, xAI, and Tesla, designed to combine chip design, manufacturing, packaging, and testing in one production pipeline. Intel’s involvement strengthens its AI and foundry story.
Why Did Analysts Raise Intel’s Price Target?
KeyBanc raised its target to $70 from $65 and kept an Overweight rating, citing strong server CPU demand, pricing increases, and improving 18A yields as Panther Lake ramps.
What Are 18A Yields And Why Do They Matter?
18A yields refer to how efficiently Intel can manufacture chips on its advanced process node. Better yields improve profitability, manufacturing credibility, and confidence in Intel’s foundry recovery.
How Is The Wider Chip Rally Helping Intel?
Strong moves in AEHR and MRVL show investors are buying across the AI semiconductor chain, not just a few leaders. That broader appetite makes it easier for Intel to rally as a second-wave AI infrastructure name.
Start trading now – Click here to create your real VT Markets account
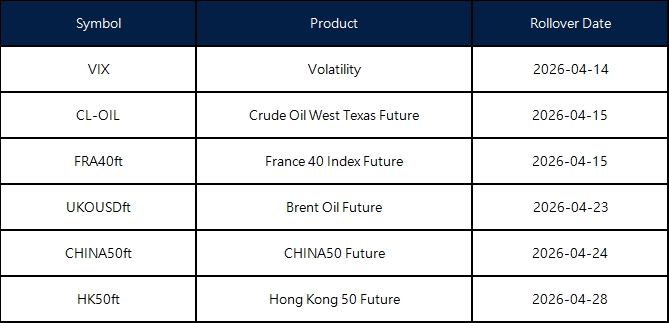
New contracts will automatically be rolled over as follows:
Please note:
• The rollover will be automatic, and any existing open positions will remain open.
• Positions that are open on the expiration date will be adjusted via a rollover charge or credit to reflect the price difference between the expiring and new contracts.
• To avoid CFD rollovers, clients can choose to close any open CFD positions prior to the expiration date.
• Please ensure that all take-profit and stop-loss settings are adjusted before the rollover occurs.
• All internal transfers for accounts under the same name will be prohibited during the first and last 30 minutes of the trading hours on the rollover dates.
The above data is for reference only. The actual rollover date shall be subject to the Liquidity Provider’s determination.
If you’d like more information, please don’t hesitate to contact [email protected].
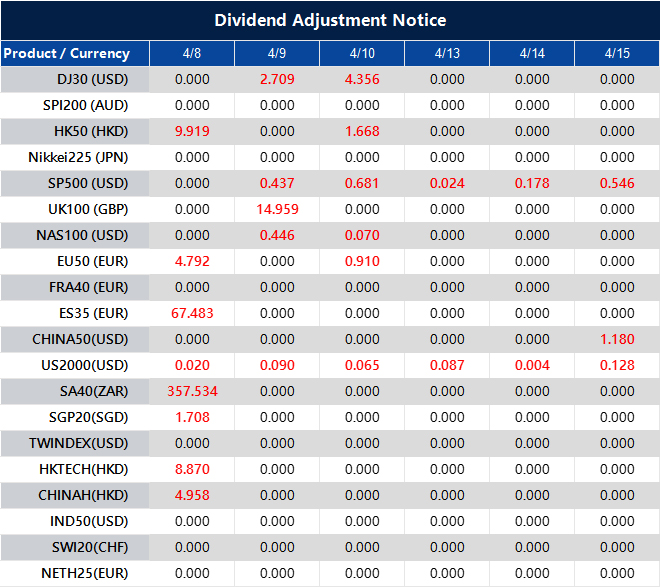
Please note that the dividends of the following products will be adjusted accordingly. Index dividends will be executed separately through a balance statement directly to your trading account, and the comment will be in the following format “Div & Product Name & Net Volume”.
Please refer to the table below for more details:
The above data is for reference only, please refer to the MT4/MT5 software for specific data.
If you’d like more information, please don’t hesitate to contact [email protected].
The Strait of Hormuz disruption is driving oil, forex and crypto markets at the same time.
Higher energy prices support the US dollar and pressure energy-importing currencies.
Crypto acts like a risk asset in the short term but still functions as a real-time financial system.
The real driver is not the price but how long the disruption lasts.
Why the Strait of Hormuz is the Defining Macro Story of 2026
There is a narrow strip of water, roughly 21 miles wide, sitting between Iran and Oman that is currently exerting more influence on currency markets and crypto prices than any central bank decision or earnings report.
The Strait of Hormuz has become the defining macro story of early 2026. Traders in forex and crypto who have not fully mapped its implications are operating with a serious blind spot.
Beginning on March 4, Iranian forces declared the Strait closed, threatening and in some cases attacking vessels attempting to transit it. What followed was not just an oil story. It became a cascading shock across every major asset class, with second-order effects that are still unfolding and far from fully priced.
Iran and Israel traded attacks as Tehran defiantly refused to reopen the Strait of Hormuz and accept a ceasefire deal on the eve of a deadline set by President Trump to agree to his demands or get ‘taken out’ https://t.co/jPmnzK5LX5pic.twitter.com/xNHAAi2HyY
How the Strait of Hormuz Closure Impacts Global Energy and Forex Markets
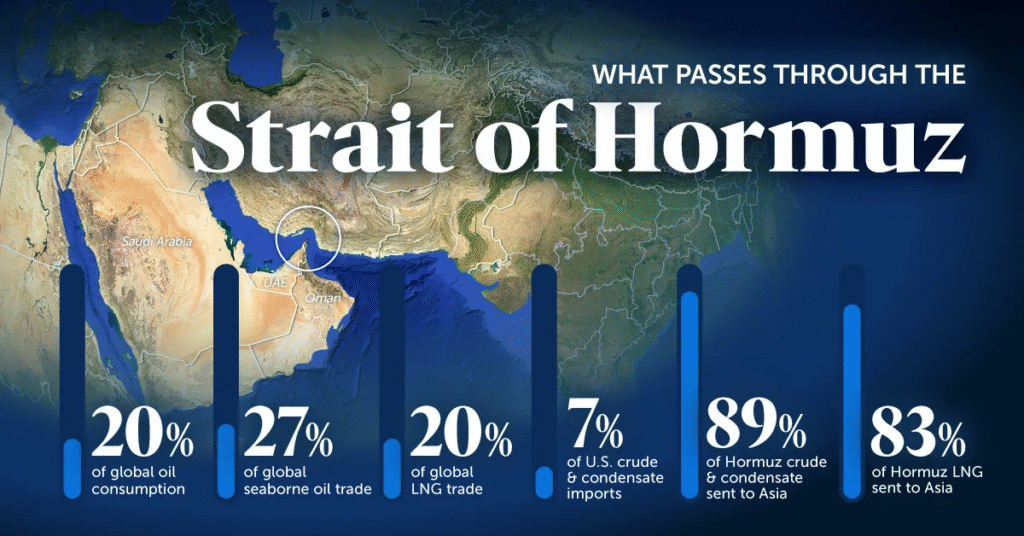
The Strait of Hormuz handles roughly 20% of global oil consumption, alongside a significant share of liquefied natural gas flows, particularly from Qatar. Any disruption here does not gently move markets. It forces a repricing.
Source: Visual Capitalist
During the recent escalation, Brent crude moved above 100 dollars per barrel for the first time in four years, peaking near 120. While exact intraday highs vary across contracts, the direction is what matters. A sharp and aggressive repricing of energy.
The Strait of Hormuz's closure and the resulting surge in global oil prices have handed financial windfalls to Iran, Oman and Saudi Arabia, while other states that lack alternative shipment routes have lost billions of dollars, a Reuters analysis found https://t.co/a8wAyrMrjS
How does the Strait of Hormuz closure impact the USD?
The impact across currencies follows a consistent structure.
The United States sits in a relatively advantaged position. As one of the world’s largest energy producers and a major LNG exporter, it benefits on a relative basis when prices rise. Higher oil supports the dollar through improved terms of trade and safe-haven demand. At the same time, elevated energy prices complicate the Federal Reserve’s path to rate cuts, reinforcing dollar strength.
The euro area faces a structural vulnerability. Heavy reliance on imported energy means rising oil and gas prices push inflation higher while pulling growth lower. This creates a stagflationary setup. The European Central Bank is left constrained and unable to ease aggressively without risking persistent inflation. The result is sustained pressure on EURUSD.
Japan and broader Asia face a similar dynamic. Economies such as Japan, South Korea, India and China remain heavily dependent on imported energy, much of it historically routed through the Gulf. When shipping risks rise and prices spike, trade balances deteriorate. This translates into depreciation pressure on currencies like JPY, KRW and INR, unless offset by policy intervention.
— Reuters Energy and Commodities (@ReutersCommods) April 7, 2026
There is also the Russia factor. Disruptions in Middle Eastern supply increase the relative importance of alternative producers. Russia’s discounted crude becomes more attractive to major importers such as India and China, supporting export revenues and indirectly stabilising trade-linked currency flows.
The takeaway is straightforward but often underestimated.
Energy is not just a commodity variable. It is a primary driver of currency markets.
Forex Chain Reaction: Impact of Strait of Hormuz Disruption
Currency
Market Position
Impact of Disruption
Economic Drivers
US Dollar (USD)
Strong / Bullish
Benefits on a relative basis as a safe haven.
US is a major energy producer/LNG exporter; high oil prices complicate Fed rate cuts.
Euro (EUR)
Weak / Bearish
Faces sustained pressure and a stagflationary setup.
Heavy reliance on imported energy; rising costs push inflation up while pulling growth down.
Japanese Yen (JPY)
Weak / Bearish
Significant depreciation pressure.
Heavily dependent on imported energy historically routed through the Gulf.
Indian Rupee (INR)
Weak / Bearish
Trade balances deteriorate, leading to currency weakness.
High dependency on Middle Eastern energy imports.
South Korean Won (KRW)
Weak / Bearish
Vulnerable to shipping risks and price spikes.
Heavy reliance on energy imports to sustain the economy.
Russian Ruble (RUB)
Stabilising
Increased importance of alternative supply.
Discounted crude becomes more attractive to major importers like China and India.
Is Bitcoin a Hedge or a Risk Asset? The Impact of Geopolitical Shocks on Crypto
Geopolitical shocks reveal what markets truly are, not what narratives suggest they should be.
In the immediate aftermath of major headlines, Bitcoin and the broader crypto market typically sell off. Liquidity tightens, volatility rises, and risk appetite fades. In these moments, crypto behaves less like a hedge and more like a high beta risk asset, closer to technology equities than digital gold.
But that is only half the story.
Crypto markets operate continuously. They do not close or pause. When geopolitical developments occur outside traditional trading hours, crypto becomes one of the only venues for real-time price discovery. This gives it a structural role that traditional markets cannot replicate.
During periods of heightened tension, trading volumes across major crypto exchanges tend to increase as participants react instantly to new information. This is observable behaviour embedded in market microstructure.
There is also a growing real economy dimension. In regions facing sanctions, capital controls or restricted access to banking infrastructure, crypto usage increases. It becomes not just a speculative asset but a functional alternative for settlement and value transfer.
Perhaps most tellingly, reports have emerged of vessels paying transit-related fees in Chinese yuan or even crypto to navigate the Strait under heightened risk conditions. These cases are still marginal, but they signal something more important. When traditional financial rails are disrupted, alternative systems are not just theoretical. They are used.
Crypto in this context carries a dual identity.
In the short term, it behaves like a risky asset.
In the longer term, it continues to evolve as a parallel financial system.
The Structural Tailwinds Beneath the Noise
Despite volatility, the broader trajectory for crypto remains intact.
Institutional participation continues to expand through Bitcoin exchange-traded funds (ETFs). Regulatory frameworks in the United States are gradually taking shape, with developments such as the CLARITY Act pointing toward a more defined operating environment. Meanwhile, stablecoins are quietly embedding themselves into the global financial system.
The scale is already significant.
In 2025, stablecoin transaction volumes exceeded 34 trillion dollars, surpassing the combined volumes of Visa and Mastercard. That figure carries more weight when viewed alongside real-world scenarios where digital assets are being used in high-friction geopolitical environments.
The underlying infrastructure is not slowing down, even when markets are.
Market Outlook: What Happens if the Strait of Hormuz Remains Closed?
Energy shocks do not hit markets in a single wave. They evolve.
At the outset, the reaction is driven by uncertainty and risk repricing. If disruptions persist, the impact becomes tangible. Shipping delays accumulate, inventories tighten, and volatility becomes sustained rather than temporary.
For traders, positioning becomes less about prediction and more about understanding the path forward.
If the situation stabilises and the Strait reopens, oil prices are likely to retrace from elevated levels. Inflation pressures ease, central banks regain flexibility, and risk assets, including equities and crypto, find support. Energy-importing currencies recover as external pressures fade.
If the disruption persists, the opposite dynamic takes hold. Elevated energy prices keep inflation stubborn, forcing central banks to maintain tighter policy for longer. Growth slows, the US dollar remains firm, and currencies tied to energy imports stay under pressure. In this environment, crypto becomes increasingly sensitive to liquidity conditions rather than acting as a defensive asset.
The market is not pricing where oil is today.
It is pricing how long this disruption will last and how deep its effects will run.
The Big Questions
1) How does the Strait of Hormuz closure impact global oil prices?
The Strait of Hormuz handles approximately 20% of global oil consumption and a significant share of liquefied natural gas (LNG). Any disruption forces aggressive repricing; during the March 2026 escalation, Brent crude spiked above 100 dollars per barrel, peaking near 120 dollars.
2) Why does the US Dollar (USD) strengthen during Middle East energy shocks?
The United States is one of the world’s largest energy producers and a major LNG exporter, which improves its terms of trade when prices rise. Additionally, elevated energy prices fuel inflation, making it harder for the Federal Reserve to cut interest rates, which further reinforces dollar strength.
3) How does the Hormuz disruption affect the Euro (EUR) and Japanese Yen (JPY)?
Both the Eurozone and Japan are heavily dependent on imported energy. Rising oil and gas prices create a stagflationary environment for the Euro—pushing inflation higher while pulling growth lower—and cause trade balances in Asia to deteriorate, leading to sustained depreciation pressure on the EUR, JPY, KRW, and INR.
4) Is Bitcoin a safe haven during geopolitical conflicts?
In the short term, Bitcoin typically behaves like a high-beta risk asset, similar to technology equities, often selling off when liquidity tightens and risk appetite fades. However, it functions as a parallel financial system in the long term, offering real-time price discovery and an alternative for settlement in regions with restricted banking access.
5) What is the role of stablecoins in global finance during disruptions?
Stablecoins are becoming a fundamental part of the global financial system, with 2025 transaction volumes exceeding 34 trillion dollars—surpassing the combined volumes of Visa and Mastercard. They provide critical infrastructure for value transfer in high-friction geopolitical environments where traditional rails are disrupted.
6) What happens to markets if the Strait of Hormuz reopens?
If the situation stabilises, oil prices are expected to retrace, inflation pressures would ease, and central banks would regain policy flexibility. This would likely lead to a recovery in risk assets, including equities and crypto, as well as energy-importing currencies.
Start trading now – Click here to create your real VT Markets account
AUD/JPY traded near 111.80 in Wednesday’s Asian session, keeping a positive tone while holding above the 100-day EMA near 107.50. The outlook is supported by RSI in the high-50s, with initial support at 111.00 and an upside barrier around 112.50.
The move came as the Australian Dollar rose against the Yen amid improved risk sentiment after Donald Trump said he agreed to suspend bombing and attacks on Iran for two weeks, if Iran reopens the Strait of Hormuz. Iran’s Foreign Minister Seyed Abbas Araghchi said safe passage through the strait “will be possible” during the two weeks via coordination with Iran’s Armed Forces, subject to technical limits.
Risk Sentiment Lifts Aud Jpy
Reduced demand for safe-haven assets weighed on the Yen, although concerns about potential Japanese intervention may limit Yen weakness. Japan’s top currency diplomat Atsushi Mimura said officials may take “decisive” steps if speculative moves persist.
Technically, price remains in the upper half of the Bollinger Bands, which are still wide. A break below 111.00 could open 110.00, then 109.00 near the lower band area, while resistance is at 112.61 and 113.15.
The Yen’s direction is shaped by Japan’s economy, Bank of Japan policy, Japan–US yield spreads, and risk sentiment. The BoJ’s ultra-loose policy from 2013 to 2024 weakened the Yen, with a 2024 shift away from it narrowing the 10-year yield gap.
Given the temporary de-escalation in the Middle East, we see a short-term window for further AUD/JPY strength. The two-week truce period weakens the safe-haven Japanese Yen, favouring the risk-sensitive Australian Dollar. This environment supports the current upward momentum towards the 112.50 resistance level.
Options Strategies For A Capped Rally
However, we must approach this with caution, as the move is based on a fragile geopolitical agreement. Buying short-dated call options with a strike around 112.50 and an expiry in late April or early May allows for participation in the upside while strictly defining our maximum loss. Implied volatility on one-month options has ticked up to 12.8%, reflecting this very uncertainty, making defined-risk strategies prudent.
The threat of intervention from Japanese authorities to support the Yen is capping the rally. We remember the Ministry of Finance’s decisive action in late 2022 when USD/JPY crossed 150, showing their willingness to act against rapid currency weakness. Japan’s latest national CPI data for March 2026, which came in at 2.4%, also continues to support the Bank of Japan’s gradual policy normalization, providing a longer-term headwind for this cross.
On the other side, recent trade balance figures from Australia showed a narrower-than-expected surplus, partly due to a slight easing in iron ore prices over the last quarter. This suggests the Australian dollar’s rally may not have the fundamental power to push significantly beyond the 113.50 level without fresh catalysts. This reinforces the view that the cross is facing strong resistance ahead.
With these conflicting forces, we can consider strategies that benefit from elevated volatility and a potential range. Selling a bear call spread with the short strike above 113.00 could be an effective way to bet that intervention fears and moderating Australian data will cap the rally. This strategy takes advantage of the current optimism to collect premium, while still being protected from an unexpected surge higher.
NZD/USD rose for a third day after dipping to 0.5700 in Asia and then climbing to a near two-week high on Wednesday after US-Iran ceasefire news. It held above 0.5800 and changed little after the Reserve Bank of New Zealand (RBNZ) decision.
The RBNZ kept the Official Cash Rate at 2.25% for a second meeting in a row, as expected, citing uncertainty around economic and inflation prospects linked to the Iran war. The decision had limited impact on the NZD, with attention turning to Governor Dr Anna Breman’s press conference.
Ceasefire Headlines Lift Risk Sentiment
US President Donald Trump said planned military strikes on Iran would be paused for two weeks if Tehran agrees to an immediate and safe opening of the Strait of Hormuz. Iran’s Foreign Minister Seyed Abbas Araghchi said Iran would stop defensive operations if attacks on the country end.
Araghchi also said safe passage through the waterway would be possible for two weeks, which led to a sharp fall in crude oil prices and reduced inflation concerns. This lowered expectations of a US Federal Reserve rate rise and weighed on the US dollar, supporting NZD/USD.
We recall from last year the brief risk-on rally in NZD/USD that followed the temporary US-Iran ceasefire in 2025. The market reaction pushed the pair towards the 0.5800 level, but the fundamental picture today is vastly different. The Reserve Bank of New Zealand’s Official Cash Rate is no longer 2.25%, but has been held at a restrictive 5.50% for over a year.
This high interest rate environment is a response to persistent domestic inflation, which, according to data from Stats NZ, was still running at an annualized 3.8% in the first quarter of 2026, well above the RBNZ’s target. Therefore, any strength in the kiwi is now more closely tied to this attractive yield differential rather than fleeting risk sentiment. This makes long NZD positions against lower-yielding currencies a fundamentally sounder play than it was in 2025.
Competing Central Bank Policy Keeps Pair Range Bound
Similarly, the situation for the US dollar has changed dramatically, as the Federal Reserve has also maintained its funds rate above 5% to manage its own inflation issues. This contrasts sharply with the conditions in 2025, when the ceasefire news tempered rate hike expectations. The high US interest rate provides a floor for the dollar, suggesting the NZD/USD pair is more likely to be range-bound by competing central bank policies.
The geopolitical landscape offers another key difference, as the temporary dip in oil prices we saw in 2025 is a distant memory. Ongoing tensions in the Middle East have kept Brent crude prices elevated, hovering around $90 a barrel through early 2026, which continues to fuel global inflationary concerns. This backdrop supports a cautious stance and reinforces central banks’ commitment to keeping rates higher for longer.
Given this, traders should consider using options to trade the volatility around key inflation data releases for both New Zealand and the United States. A straddle on the NZD/USD could be an effective way to profit from a significant move in either direction following a CPI announcement, without betting on the direction itself. The market is now driven by hard data, unlike the geopolitical headline reactions of 2025.
AUD/NZD traded near 1.2170 in Asian hours on Wednesday, ending a run of gains that started on 30 March. The pair edged lower after the Reserve Bank of New Zealand kept its Official Cash Rate unchanged at 2.25% at its April meeting.
Markets had largely expected no change, citing uncertainty around growth and inflation, alongside higher oil prices linked to conflict in the Middle East. Attention later turns to an address by RBNZ Governor Dr Anna Breman at the post-meeting press conference.
Drivers Behind The Earlier Rally
The cross had moved up as the Australian Dollar strengthened on improved risk mood after US President Donald Trump announced a two-week pause in military action against Iran. The plan includes a “double-sided ceasefire” linked to Iran reopening the Strait of Hormuz.
The ceasefire could affect inflation expectations and reduce pressure on the Reserve Bank of Australia to tighten policy further. Markets had priced a rate rise towards 4.35% at the May meeting, partly due to higher energy costs after the Strait’s closure.
The RBNZ holds seven policy meetings each year and sets the OCR at each decision. Higher rates tend to support the NZD, while lower rates tend to weaken it, and briefings often follow the announcements.
As of today, April 8, 2026, we see the AUD/NZD pair trading at a more subdued level of 1.0950. This is a significant change from the high of 1.2170 we observed around this time back in 2025. That previous strength was partly driven by geopolitical events that have since been resolved.
What We Are Watching Next
The key driver now is the diverging inflation outlook between the two countries. We have seen Australia’s latest quarterly inflation for Q1 2026 remain stubborn at 3.8%, while New Zealand’s has cooled more significantly to 3.1%. This suggests the Reserve Bank of Australia has more reason to maintain a hawkish stance than the Reserve Bank of New Zealand.
Unlike the temporary relief from the US-Iran ceasefire we saw in 2025, today’s energy markets are influenced by persistent OPEC+ production cuts. These cuts are keeping a floor under oil prices, which continues to feed into Australia’s stickier inflation numbers. This gives the RBA less room to consider easing its policy.
Given this divergence, the interest rate differential is likely to move in the Australian dollar’s favor over the coming weeks. We believe derivative traders should consider buying AUD/NZD call options, possibly with June or July 2026 expiries. This strategy allows for capitalizing on potential upside while clearly defining the maximum risk.
Current implied volatility in the pair is moderate, meaning option premiums are not excessively expensive right now. This presents a favorable entry point for establishing long positions before the central banks’ policy paths diverge more formally. Traders can structure these positions to profit from a gradual grind higher in the exchange rate.
In the near term, we will be watching for the next Australian CPI data and the RBA meeting minutes for further confirmation of this hawkish tilt. Any data point showing persistent price pressures in Australia will likely act as a catalyst for a move higher in AUD/NZD. This will be the main focus for adjusting positions in the weeks ahead.
The Reserve Bank of New Zealand kept the Official Cash Rate at 2.25%, in line with forecasts.
No further details were provided in the supplied text.
Market Reaction And Volatility Outlook
The Reserve Bank of New Zealand’s decision to hold the Official Cash Rate at 2.25% was fully anticipated, removing any immediate surprise from the market. This stability suggests implied volatility on the Kiwi dollar will likely decrease in the coming days. We should consider strategies that benefit from this, such as selling out-of-the-money options on NZD currency pairs.
This policy pause makes sense when we look at the broader data, with the latest quarterly inflation figures showing a welcome drop to 2.8%. That is a significant improvement from the multi-decade highs seen just a few years ago. With the unemployment rate holding steady around 4.1%, the RBNZ has room to wait and assess incoming information before its next move.
Looking back to the market environment of 2025, this period of calm is a notable change from the aggressive hiking cycle we were navigating then. That period of rapid policy tightening created significant directional trends and volatility. The current “wait-and-see” stance suggests range-bound trading conditions are more likely for now.
With the RBNZ on hold, the classic NZD/USD carry trade is less appealing, as United States interest rates are currently higher. We see better relative value in funding trades against currencies with lower yields, such as the Japanese Yen. The key pair to watch will be NZD/AUD, as any difference in tone from the Reserve Bank of Australia could spark a new trend.
Upcoming Data And Positioning
The focus now shifts from central bank commentary to the next round of economic data. The upcoming employment and inflation reports will be the next major catalysts for the Kiwi dollar. We should be prepared to use derivatives to position for any data that suggests the economy is stronger or weaker than currently expected.