The Reserve Bank of New Zealand (RBNZ) kept its key interest rate unchanged. Governor Breman said a rate rise was discussed, and markets took this as mildly hawkish.
The New Zealand Dollar (NZD) rose against the US Dollar (USD). It outperformed other currencies even as events in the Gulf region dominated market attention.
Market Rate Hike Expectations
Futures pricing now implies nearly three interest rate rises by year-end. This level of expected tightening was described as too high.
The RBNZ statement also warned of a real risk of an economic setback. It added that weaker activity would reduce medium-term inflation pressures.
The assessment pointed to downside economic risks. It said this may limit how long the NZD can keep gaining support.
Based on the current situation, the market appears to be getting ahead of itself by pricing in nearly three rate hikes from the Reserve Bank of New Zealand. The central bank’s own words highlight significant downside risks to the economy, creating a clear mismatch between market expectations and official guidance. We saw a similar dynamic back in 2025, where initial hawkish talk from central banks quickly faded as economic data began to soften.
Trade Ideas And Key Catalysts
As of today, April 8, 2026, we are seeing fresh data that supports the RBNZ’s cautious stance. The latest quarterly inflation print for Q1 2026 came in at 1.2%, bringing the annual rate down to 4.9%, showing a clear deceleration that undermines the case for aggressive tightening. Furthermore, the most recent business confidence survey from March showed a marked drop, with firms concerned about weakening domestic demand.
This suggests a strategy of buying NZD/USD put options over the next several weeks could be beneficial. This approach allows us to position for a potential decline in the Kiwi dollar as the market realigns with the more dovish economic reality. The fixed premium paid for the option defines our maximum risk, protecting us from an unexpected upside move.
Alternatively, the divergence can be played in the interest rate markets themselves. Given that futures markets are pricing in hikes that may not materialize, we could consider shorting New Zealand interest rate futures. This trade would profit directly if the RBNZ either holds rates for longer than expected or signals a more dovish path at its next meeting.
We should be watching for the next employment report and retail sales figures as key catalysts. Any signs of weakness in these releases will likely force the market to rapidly unwind its aggressive rate hike bets. This would put significant downward pressure on the New Zealand dollar.
Gold traded above $4,800 in the European session, near a three-week high, after rebounding from around $4,600. The move came as the US Dollar weakened and the USD Index (DXY) fell to a near one-month low.
US President Donald Trump said planned US strikes on Iran would be suspended for two weeks if Tehran agrees to a complete, immediate, and safe opening of the Strait of Hormuz. Iran said it accepted a two-week ceasefire, with talks due to start on Friday in Islamabad, Pakistan.
Ceasefire Developments And Market Impact
Iran’s Foreign Minister Seyed Abbas Araghchi said safe passage through the waterway would be possible for two weeks, and crude oil prices fell. Lower oil prices eased inflation worries and reduced expectations of a US Federal Reserve rate rise, pushing US Treasury yields down and supporting non-yielding gold.
On charts, gold shows a mildly bullish bias after moving above the middle of its recent range. It remains below the descending 200-period SMA on the 4-hour chart, which aligns with the 61.8% Fibonacci retracement of the March fall.
MACD has moved into positive territory and RSI is in the mid-60s. Resistance sits near $4,920, with targets at $5,000 and $5,141, while support lies at $4,760, $4,605, and $4,411.
The two-week ceasefire between the US and Iran has significantly shifted market sentiment, weakening the dollar and pushing gold above $4,800. This de-escalation presents a clear opportunity for us to re-evaluate gold and currency positions. We’re seeing a classic risk-on move, with the Dollar Index (DXY) dropping below 103.5 for the first time since early March.
Options Strategy And Risk Levels
With crude oil prices falling over 8% in the last 24 hours to below $85 a barrel, inflationary pressures are easing rapidly. The market is now pricing in less than a 15% chance of a Fed rate hike in June, down from over 40% just last week, according to CME FedWatch data. This decline in rate hike expectations is pulling Treasury yields down and further supporting non-yielding assets like gold.
Given the positive momentum, we see an opportunity in buying short-dated call options on gold with a strike price around the psychological $5,000 mark. However, the key is the $4,920 resistance level, where we could see significant selling pressure. A bull call spread could be a prudent strategy to profit from a potential rise while capping the risk if the rally stalls at that confluence point.
The ceasefire news has caused a sharp drop in implied volatility on gold options, with the GVZ index falling by 12% this morning. This makes buying options cheaper, favoring strategies like the bull call spread mentioned earlier. Traders should be prepared for this volatility to spike again if negotiations in Islamabad show any signs of failure over the coming days.
We are reminded of the short-lived de-escalation in the South China Sea back in late 2025, which also caused a temporary spike in gold and a dip in the dollar. In that instance, the rally faded within three weeks when diplomatic talks broke down. This history suggests we should consider taking profits if gold fails to break and hold above the $4,920 level within the next week or two.
For those looking to hedge or speculate on a reversal, the $4,760 support level is the first line of defense. A decisive break below this could signal the end of the rally, making put options with a strike price near $4,600 an attractive position. The fragility of the ceasefire means holding some protective puts could be a wise insurance policy against a sudden return to risk-off sentiment.
USD/JPY fell 0.9% to about 158.20 in European trading on Wednesday as the US Dollar weakened after a two-week ceasefire between the US and Iran. The US Dollar Index dropped 0.75% to around 98.75.
Donald Trump said planned attacks on Iranian civilian infrastructure were suspended for two weeks, after Tehran agreed to reopen the Strait of Hormuz. The strait carries almost 20% of global energy supply.
Usd Jpy Technical Outlook
Market pricing shifted on US interest rates after the truce, with the CME FedWatch tool showing no rate hikes priced for this year. This reversed earlier pricing for two hikes after the war began.
On the charts, USD/JPY turned bearish after breaking down from a symmetrical triangle on the four-hour timeframe. Price is below an ascending support line from 157.46, while the 200-period EMA near 158.40 is acting as resistance.
The 14-day RSI fell to 28, which is oversold. Resistance sits near 158.40 and around 159.00; a move above 159.00 would point to 159.60.
Support stands near 157.50, and a break below it would target 157.00. The technical section notes it was produced with help from an AI tool.
Macro And Strategy Implications
Last year, we saw the dollar weaken sharply against the yen when the US and Iran agreed to a temporary ceasefire, creating a “risk-on” mood. Now, in April 2026, we are seeing the opposite as renewed diplomatic friction in the region sends investors looking for safety. This is a classic “risk-off” scenario, which typically benefits the US Dollar.
A key driver then was the disappearance of Federal Reserve rate hike expectations due to easing global inflation. Today, however, the latest US Consumer Price Index (CPI) reading for March came in hot at 3.1%, pushing the odds of a June rate hike to over 65% according to the CME FedWatch tool. This hawkish shift is providing significant support for the dollar, especially against the yen.
This policy divergence is widening, as Japan’s own core inflation continues to miss its 2% target, suggesting the Bank of Japan will remain accommodative. The interest rate differential between the US and Japan is therefore set to expand further, making it attractive to hold dollars over yen. This fundamental backdrop strongly favors a higher USD/JPY exchange rate.
Given this shift to a “risk-off” environment where the US Dollar is a primary safe haven, the strategy has flipped from what we saw in 2025. We should consider buying call options on USD/JPY or selling put spreads to capitalize on expected upside while managing risk. These positions will profit if the pair continues to climb as we anticipate.
Unlike last year’s breakdown below 159.00, the pair is now testing resistance near 164.50. Any dips towards the 163.80 level should be viewed as buying opportunities, with a target of clearing the psychological 165.00 barrier in the coming weeks. Holding long positions is the preferred stance while this geopolitical and monetary policy dynamic persists.
The Cboe Volatility Index (VIX) has climbed back above 18, reflecting the market’s growing anxiety. This elevated volatility makes selling out-of-the-money puts more attractive, as the higher premium provides a better cushion if the pair pulls back temporarily. This strategy allows us to collect income while waiting for the next move higher.
Emini S&P June futures formed a potential bullish inverse head and shoulders, with a neckline at 6620. Price fell to 6573 before rising above 6650/6660, giving a buy signal with targets at 6690/6700 and 6740/6750, then reaching the 100-day moving average at 6825 and a high of 6831.
Resistance is noted at 6825/6835, while a break above 6845 is set as a buy signal targeting 6885/6890. Support is marked at 6775/6765 with stops below 6750, and a break lower risks a move to 6710/6700.
Nasdaq Inverse Head And Shoulders
Emini Nasdaq June futures also showed an inverse head and shoulders, with a neckline at 24170/24150, after dipping to 23942. Price then rose to 24310/24350 and broke 24550/25600 for a buy signal, hitting targets at 24940/24990 and 25100/25150, with 25250/25300 in view.
Support is at 25030/25000, with a break below 24900 risking 24800/24750 and stops below 24600. Emini Dow Jones June futures had a neckline at 47000/47100, with buy targets at 47250 and 47500, and resistance at 47900/48000; a break above 48100 targets 48400/48500, and above 48600 targets 48850/48900, with support at 47300/47200 and stops below 47000.
The bullish chart patterns we were watching have played out, with Emini S&P futures confirming the move by breaking above the key 6620 level. This technical signal is strongly supported by recent news, making the path of least resistance appear higher for now. Given this powerful momentum, attempting to sell short is exceptionally risky.
For S&P traders, the rally has pushed through our targets to the 100-day moving average around 6825. This strength is underpinned by the latest jobs report, which showed a healthy but not inflationary addition of 260,000 jobs, alongside inflation cooling to 2.7%. A break above 6845 should be seen as the next buy signal, while we can view 6775/6765 as a support zone for new longs.
Dow Breakout Levels To Watch
Nasdaq futures have soared, and this makes sense considering how growth stocks react to changes in interest rate expectations. After the market uncertainty we experienced in late 2025, the prospect of the Federal Reserve pausing or even cutting rates is fueling this rally. A clean move above 25350 can target the 25600 area, with downside now likely limited by support near 25000.
The Dow Jones has also confirmed the breakout, running right into the 48000 resistance level as anticipated. While the market may consolidate here briefly, the underlying trend is clearly bullish. We should view any break above 48100 as a fresh buy signal, with support for current long positions holding around 47300/47200.
Deutsche Bank reported that S&P 500 futures rebounded after a US–Iran two-week ceasefire announcement. Futures are now less than 2% below pre-strike levels and above late-March lows.
S&P 500 futures rose 2.48%, leaving them under 2% below the February 27 level before the Iran strikes began. They are also 6.8% above the March 30 closing low.
Risk Assets Surge On Ceasefire News
NASDAQ futures increased 3.15%. Euro STOXX 50 futures rose 5.42% after a weak session the previous day.
Markets had earlier traded cautiously amid reports of escalating strikes by the US, Israel and Iran across the Middle East. The report also cited a social media post from Trump warning that a “whole civilisation will die tonight” unless “something revolutionarily” happens on Iran’s side.
US markets later recovered as reports emerged that the US and Iran were considering Pakistan’s ceasefire proposal. The article was produced using an AI tool and reviewed by an editor, and attributed to the FXStreet Insights Team.
Given the sharp rally in risk assets, we see the primary immediate change in market volatility. The CBOE Volatility Index (VIX), which had surged to over 35 during the peak tensions in late March, has collapsed by over 30% to below 24 on this news. For the coming weeks, this suggests a strategy of selling volatility, such as writing covered calls or initiating credit spreads to capitalize on declining premiums.
With S&P 500 futures rebounding so strongly, we should consider positioning for further upside now that a major geopolitical risk is being priced out. The market is now less than 2% from its February highs, and with this overhang removed, fundamentals can again take focus. This environment favors buying call options on broad market indices like the SPY and QQQ to participate in a potential trend continuation.
Energy And Safe Haven Reversals
The ceasefire’s location in the Strait of Hormuz has a direct impact on energy markets. WTI crude oil, which had climbed above $105 per barrel last week on fears of supply disruption, has already fallen more than 8% to trade below $97. We anticipate this trend will continue, making put options on energy sector ETFs like XLE an attractive hedge or speculative position against falling oil prices.
We are also seeing a reversal in safe-haven assets that rallied during the conflict. Gold has given back its recent gains, and U.S. 10-year Treasury yields have jumped from below 3.60% to over 3.85% as money flows out of bonds and back into equities. This unwind presents opportunities to bet against assets like gold miners (GDX) or long-duration Treasury bond ETFs (TLT).
Deutsche Bank analysts report that S&P 500 futures rebounded after a US–Iran two-week ceasefire announcement and reduced war concerns. Futures are now less than 2% below pre-strike levels and well above the late-March lows.
S&P 500 futures are up 2.48%, leaving them less than 2% below levels on 27 February and 6.8% above the closing low on 30 March. NASDAQ futures are up 3.15%.
Market Rebound After Ceasefire
Euro STOXX 50 futures are 5.42% higher after a weak session the day before. The move followed earlier caution linked to worsening headlines and reports of increased strikes by the US, Israel and Iran.
US markets recovered late in the prior session after reports that the US and Iran were considering Pakistan’s ceasefire proposal. The article was produced using an AI tool and reviewed by an editor.
We remember how the S&P 500 futures ripped higher following the ceasefire announcement in 2025, showing how quickly markets price in geopolitical relief. That rally, which saw futures jump over 6% from their lows, serves as a key lesson on the value of being prepared for sudden reversals. Given the current calm, traders should consider how to position for the next unexpected shock.
With geopolitical tensions simmering elsewhere, the collapse in volatility we saw last year is a critical data point. The CBOE Volatility Index (VIX) is currently trading near 14, which is significantly lower than the spikes above 30 we witnessed during the peak of the US-Iran crisis in March 2025. This suggests that buying protective put options on indices like the SPX is relatively cheap insurance against complacency.
Volatility Options And Positioning
The situation in 2025 also provided a sharp lesson for energy traders, as oil prices likely fell hard on the ceasefire news after spiking on war fears. Right now, with WTI crude hovering around $85 per barrel, using options on energy ETFs provides a more defined-risk way to speculate on price swings than holding futures directly. This strategy would have protected capital during the rapid de-escalation last year.
The relief rally back then was broad, lifting not just the S&P 500 but also pushing NASDAQ and European futures significantly higher. This reminds us that when a major macro risk is removed, capital quickly flows back into growth and international assets. We should therefore keep long call option strategies on indices like the NASDAQ 100 ready to deploy on any signs of resolution in current global disputes.
Silver (XAG/USD) rose more than 6% on Wednesday, climbing above $77.00 after falling to $68.28 on Tuesday. The move followed the unwinding of US Dollar long positions and a rise in risk appetite after a two-week ceasefire in Iran was announced.
A last-minute agreement between the US and Iran set a two-week pause in hostilities and aimed to allow safe passage of oil, gas, fertilisers, and other goods through the Strait of Hormuz. Oil prices and the US Dollar fell, while precious metals rose alongside risk-sensitive assets.
Technical Picture And Momentum
XAG/USD traded near $77.40, staying within an ascending channel that began from lows around $61 in late March. On the 4-hour chart, the RSI moved towards 68 and the MACD turned positive.
Resistance is seen at $78.90, the 50% Fibonacci retracement of the early March sell-off, and near $80.00. Higher up, the channel top aligns with the 61.8% Fibonacci retracement at $83.20.
Support is expected near $75.00, around the 38.2% Fibonacci retracement, then near the channel floor at $72.60. The next lower reference is Tuesday’s low near $68.00.
We saw this playbook last year in 2025, when the temporary ceasefire with Iran caused a massive unwind of US Dollar strength and sent silver soaring above $77. That past event highlights how sensitive silver is to geopolitical relief and a softer dollar. Derivative traders should be watching for any signs of de-escalation in the current Middle East tensions, as a similar, rapid move could happen again.
The current environment is different, with the dollar remaining firm due to sticky inflation data, as the March 2026 Consumer Price Index just came in at 3.4%. This has kept the Federal Reserve from signaling any rate cuts, supporting the greenback and capping precious metals for now. However, this creates a coiled spring scenario, where any dovish pivot or geopolitical calm could remove that pressure very quickly.
Physical Demand And Positioning
Beneath the macro noise, the physical demand story for silver remains incredibly strong, providing a solid floor under the market. The Silver Institute just recently projected another significant supply deficit for 2026, marking the fourth consecutive year. This is largely driven by record demand for solar panel manufacturing, which continues to accelerate faster than mine output can keep up.
Looking at current positioning, data from the CFTC shows that managed money net-long positions in silver futures have climbed to a six-month high, suggesting speculators are already placing bets on a breakout. Implied volatility in silver options has also crept up, reflecting the market’s anticipation of a significant price move. This makes strategies like buying long-dated call options an attractive way to position for upside while defining risk.
Therefore, the prudent move is to prepare for a repeat of the 2025 price action by using derivatives to gain bullish exposure. Consider establishing positions that would profit from a sharp rally towards those old resistance targets near $80.00 and $83.20. Should geopolitical headlines soften or Fed policy shift, the rush out of the dollar and into silver could be just as abrupt as it was before.
Switzerland’s seasonally adjusted unemployment rate stayed at 3% in March. This was unchanged from the previous month.
The data is month-on-month and seasonally adjusted. The reported rate for March was 3%.
Swiss Labor Market Stabilization
The March unemployment rate holding steady at 3% suggests the Swiss labor market has stabilized after a period of weakening. This figure, while not improving, removes the immediate threat of a rapidly deteriorating economy. For us, this signals the Swiss National Bank (SNB) will likely remain in a “wait and see” mode for its next meeting.
With February’s inflation coming in low at 1.3%, this stagnant jobs number makes another interest rate hike extremely unlikely. The market will now probably increase its bets on a potential rate cut by the summer. We should therefore watch options on SARON futures, as they may offer value by pricing in a more dovish SNB.
This situation puts downward pressure on the Swiss franc, especially since the European Central Bank is holding its own key rate at 4.0%. This growing interest rate difference makes the franc less attractive to hold. We see an opportunity in being long EUR/CHF, expecting the euro to strengthen against the franc in the coming weeks.
Looking back, we remember how the SNB was the first major bank to cut rates back in March 2024, surprising many who expected them to wait. This history suggests the SNB is not afraid to act pre-emptively to support the economy. That memory should caution anyone from being aggressively bullish on the franc right now.
SMI Strategy Implications
For the Swiss Market Index (SMI), this economic picture points to limited upside. The 3% unemployment rate is notably higher than the 2.2% levels we saw through much of 2024, indicating weaker consumer demand for Swiss companies. This environment makes strategies like selling covered call options on the index appealing to generate income from a market we expect to move sideways.
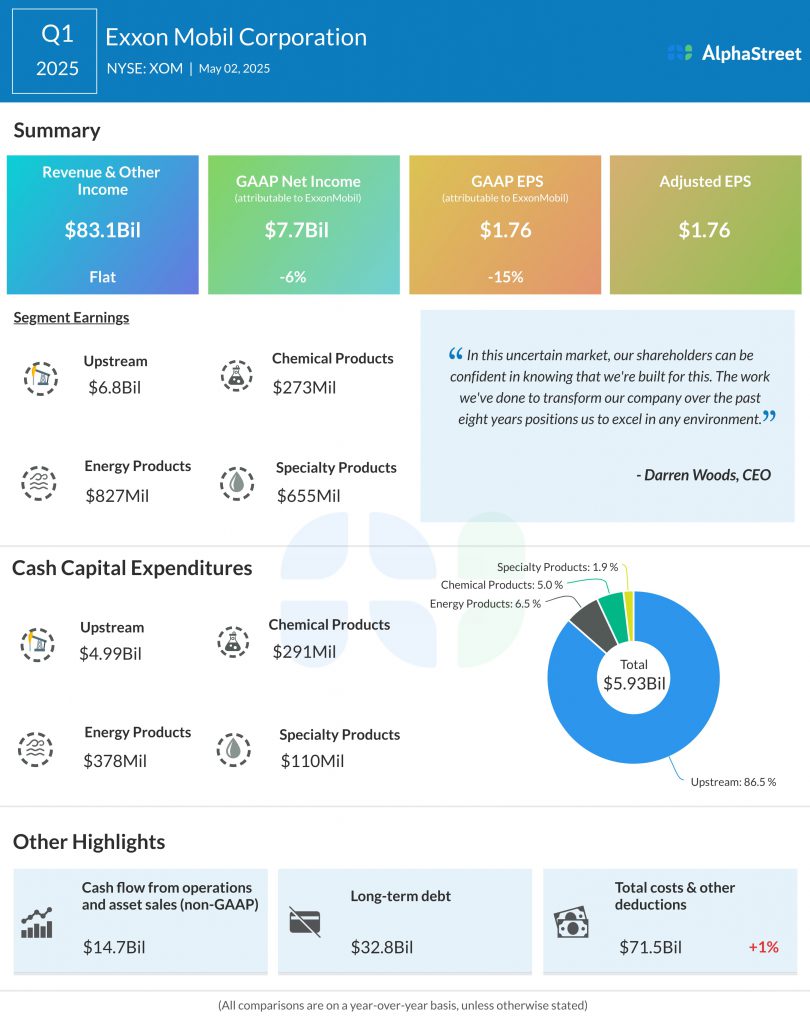
ExxonMobil sits at the centre of one of the biggest market debates: whether traditional oil majors can adapt to a lower-carbon future without sacrificing profitability.
Exxon is maintaining an oil-first strategy, backed by strong global demand and cash flow
The company is investing selectively in carbon capture, hydrogen, and low-emission fuels
For traders, XOM remains closely tied to oil prices, geopolitics, and energy demand cycles
Recent headlines have highlighted a shift in sentiment across the energy sector, with oil majors moving from a period of strong gains into renewed volatility. A key trigger has been the disruption to Exxon’s operations linked to geopolitical tensions in the Middle East.
According to recent reporting, Exxon has seen around 6% of its global output affected due to conflict-related disruptions in the region. At the same time, broader energy markets have started to soften after a strong run, with oil prices pulling back as supply concerns fluctuate and demand expectations adjust.
This combination has created pressure on XOM stock in the short term:
Production disruptions raise uncertainty around near-term output.
Shifting market sentiment moves energy stocks from momentum to reassessment.
What makes this particularly important is how quickly the narrative can change. Energy stocks often move in cycles, and the same factors that drove record gains, such as tight supply and geopolitical risk, can also lead to sharp pullbacks when conditions stabilise or expectations shift.
This is where Exxon’s strategy becomes relevant again.
When the market moves from strong gains into uncertainty, investors tend to reassess:
How resilient are earnings across cycles?
Whether production growth can offset disruptions.
How well-positioned are companies for longer-term structural shifts?
In other words, the recent decline is not just about short-term headlines. It is a reminder that Exxon’s performance still sits at the intersection of oil markets, geopolitics, and long-term energy transition dynamics.
The energy transition is often described as a simple shift away from oil. Markets, however, rarely move in simple lines. The real story is more complicated, and ExxonMobil sits right in the middle of it.
XOM still generates the bulk of its earnings from oil and gas. That alone makes it highly sensitive to crude prices, geopolitical risk, and the broader supply-demand balance in global energy markets.
Exxon Mobil says 6% of its global first-quarter production was knocked out as the US-Israel war on Iran paralyzed much of the Persian Gulf energy industry https://t.co/XYGLeLdxMn
At the same time, the company is also trying to position itself for a lower-carbon future, though on its own terms and in its own chosen areas.
That creates the central tension behind XOM stock. Exxon is not trying to reinvent itself as a renewable energy company. It is trying to remain an oil giant while selectively building businesses that fit the next phase of energy demand.
Exxon’s Strategy: Oil First, Transition Second
Exxon’s strategy stands out because it is more cautious and more selective than that of some of its peers. Rather than making an aggressive public pivot into wind and solar, the company has chosen to keep its core oil and gas engine firmly in place.
That decision reflects the company’s view that the world will continue to need large volumes of hydrocarbons for decades, even as lower-emission technologies gain ground.
In practice, that means Exxon is still allocating substantial capital toward upstream production, particularly in areas where it believes returns are strongest and project economics remain attractive.
Its expansion in places such as Guyana and the Permian Basin reflects that approach. These are not side projects. They are central to Exxon’s current earnings power and long-term production strategy.
Source: AlphaStreet
This oil-first model gives the company a few important advantages:
High cash flow during strong energy cycles: When crude prices rise, Exxon’s traditional operations generate the cash needed to support dividends, buybacks, and long-term investment.
Operational familiarity and scale: The company understands large-scale hydrocarbon production better than almost anyone in the industry.
Capital discipline: Management can continue investing in areas where returns are visible, rather than chasing growth in unfamiliar markets.
The trade-off, of course, is perception. Exxon can look slower to transition than its peers that market themselves more aggressively around renewables. But the company appears comfortable with that distinction. Its message is clear: remain strong in oil first, then build transition exposure in areas where it believes the returns are commercially durable.
A Different Take on the Energy Transition
That does not mean Exxon is ignoring the energy transition. It means it is approaching it in a different way.
Rather than spreading itself across a broad range of renewable technologies, Exxon has concentrated its lower-emission strategy around a narrower set of industrial opportunities. These are areas where it believes its engineering capability, industrial scale, and energy infrastructure experience can provide a competitive edge.
The company’s transition focus is concentrated in several key areas:
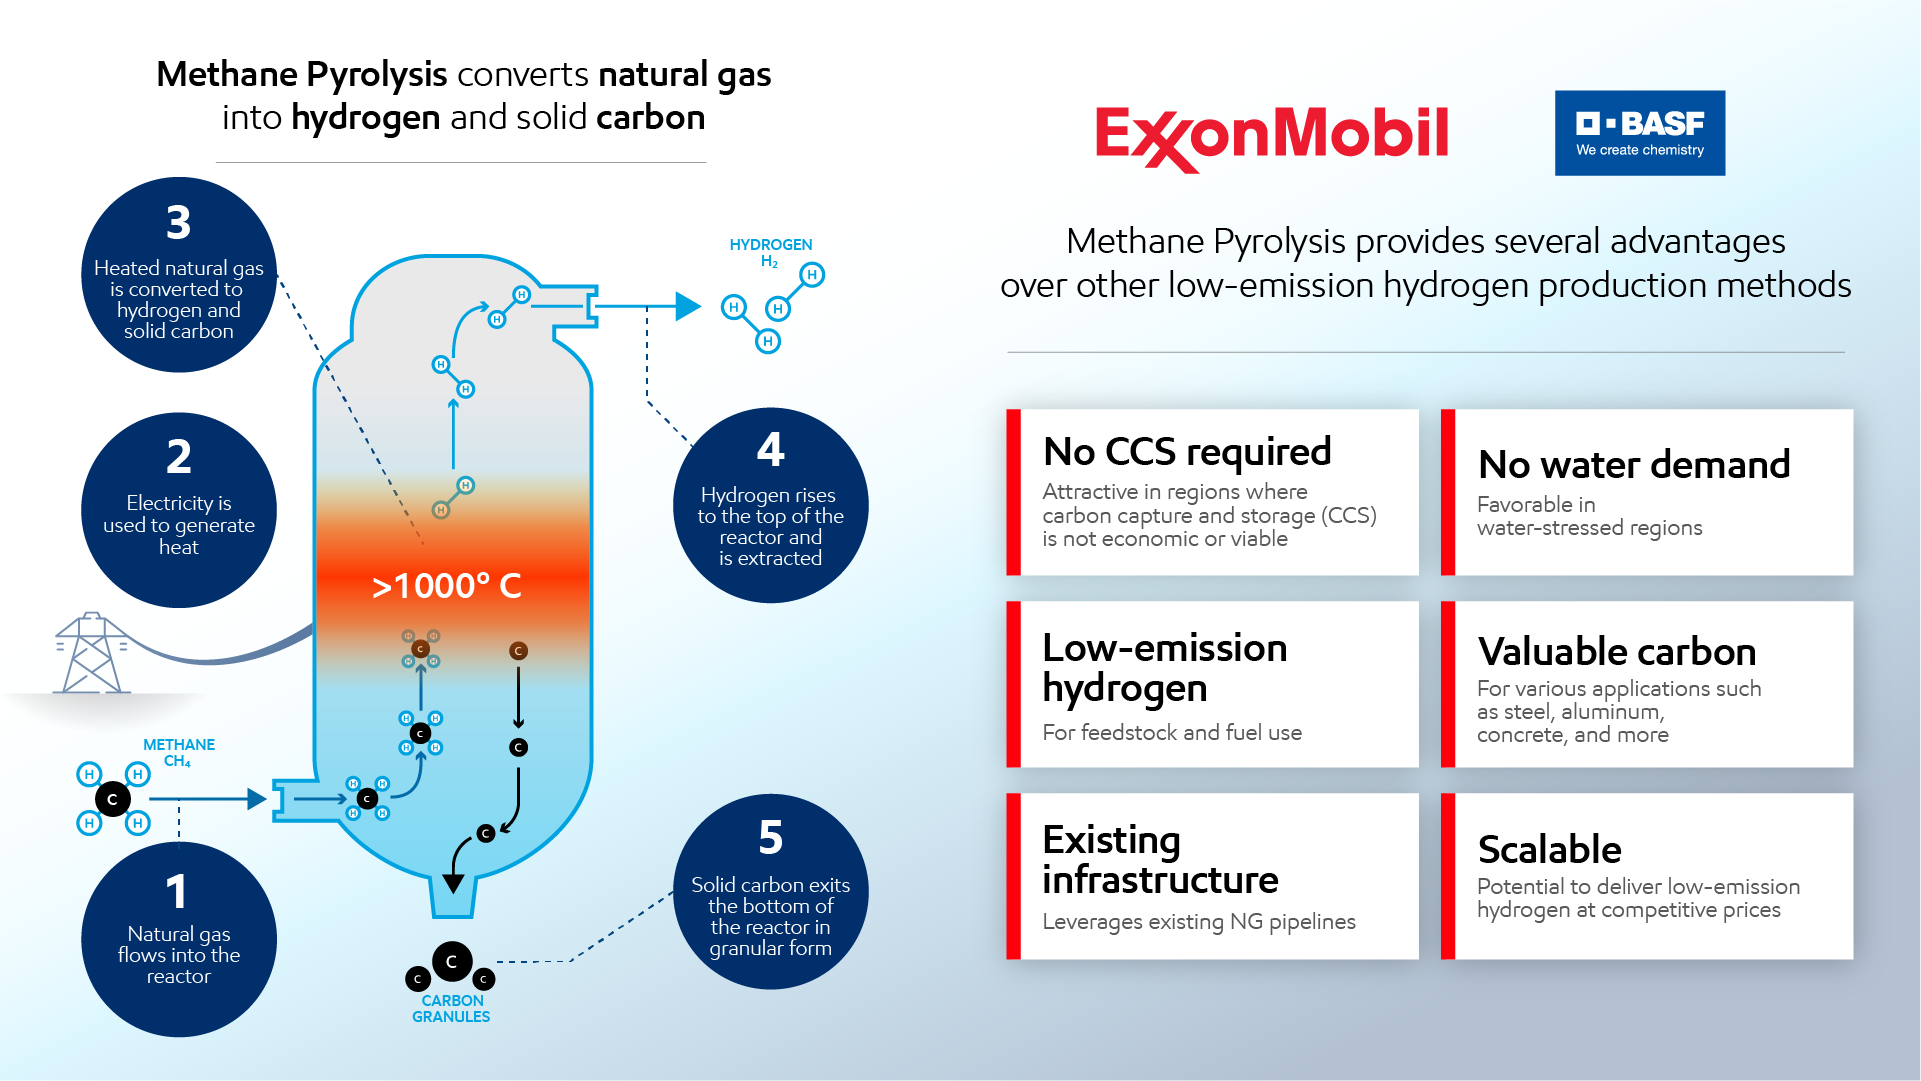
Carbon capture and storage (CCS): Exxon sees carbon capture as one of the most commercially viable pathways for reducing industrial emissions at scale.
Hydrogen: The company is building exposure to hydrogen as a fuel source for sectors that are difficult to electrify.
Low-emission fuels: This includes fuels aimed at industrial and heavy transport use cases where conventional electrification may be less practical.
Source: ExxonMobil
This is an important distinction. Exxon is not trying to win the consumer-facing renewable race. It is targeting industrial decarbonisation, where projects tend to be larger, longer-duration, and more aligned with the company’s existing capabilities.
That selective approach also helps explain why the market remains divided on Exxon’s transition story. Some investors see discipline and realism. Others see hesitation. In truth, the company is making a deliberate bet that the most profitable parts of the transition will not necessarily be the loudest ones.
As Darren Woods, CEO of ExxonMobil, has repeatedly argued, the world still needs a secure energy supply at scale, and reducing emissions must happen in a way that fits industrial reality rather than political slogans alone.
Oil Demand Is Still the Foundation
One of the reasons Exxon can maintain this strategy is that oil demand remains more resilient than many early transition narratives assumed.
Even as cleaner technologies gain market share, large parts of the global economy still depend on hydrocarbons. Aviation, shipping, freight, petrochemicals, and heavy industry continue to rely heavily on oil and gas. Emerging economies also remain major engines of incremental energy demand, particularly where infrastructure for alternatives is still developing.
This means Exxon’s core business still rests on a powerful foundation:
Global oil demand remains above 100 million barrels per day: That level of consumption continues to support large-scale upstream investment.
Demand is proving sticky in hard-to-electrify sectors: Industrial transport and heavy manufacturing still rely on traditional fuels.
Energy security remains politically important: Governments continue to prioritise stable access to oil and gas, especially during periods of geopolitical tension.
This matters for XOM stock because it reinforces the relevance of Exxon’s core earnings engine. The transition may be real, but so is the continued need for hydrocarbons. For now, Exxon is operating in the overlap between those two realities.
Cash Flow Is the Real Advantage
Exxon’s transition strategy only works because its traditional business continues to generate the cash to support it.
That cash flow is arguably the company’s biggest strategic advantage. In stronger oil environments, Exxon has the ability to fund shareholder returns and future-facing projects at the same time. That is a powerful position, particularly when compared with transition strategies that rely more heavily on external capital or lower-margin growth areas.
The company’s financial strength supports several priorities at once:
Dividend support: XOM remains attractive to income-focused investors because of its long-standing dividend profile.
Shareholder returns: Buybacks and balance-sheet flexibility are easier to sustain when operating cash flow is strong.
Transition investment: New spending on carbon capture, hydrogen, and low-emission technologies can be funded internally.
However, this also creates a subtle tension. Strong oil profits give Exxon more flexibility, but they can also reduce the market urgency to diversify. In other words, the better the oil cycle is for Exxon, the easier it becomes to keep the transition on a selective rather than transformative path.
That is why traders need to look beyond the headline cash flow number. The real question is how effectively Exxon uses the strength of its traditional business to prepare for a changing energy mix.
Geopolitics Still Favours Oil
The energy transition is also shaped by geopolitics, and in the short to medium term, geopolitics still tends to favour oil.
Tensions in the Middle East, OPEC production decisions, sanctions, shipping disruptions, and supply shocks all have a direct effect on crude prices. Because Exxon’s earnings remain closely linked to hydrocarbon markets, the company often benefits when supply risks push energy prices higher.
This is one of the reasons EXXON continues to hold macro relevance. It is not just a stock tied to company-specific execution. It is also a market proxy for broader energy security concerns.
Several geopolitical drivers continue to matter:
Middle East tensions: These can quickly raise supply-risk premiums in oil markets.
OPEC and producer coordination: Production cuts or discipline can support oil prices and improve earnings visibility for Exxon.
Sanctions and trade routes: Disruptions to global flows can reinforce the value of established producers with global scale.
From a trading perspective, this means XOM often becomes more attractive when oil volatility rises. Even if the long-term transition story remains a live debate, short-term market conditions can still swing strongly in favour of Exxon’s legacy strengths.
Exxon’s performance remains closely tied to crude oil movements. Traders often monitor XOM alongside broader energy markets and USOil to track shifts in supply and demand.
What Traders Should Watch
For traders, XOM is best understood as a stock where corporate fundamentals and macro conditions are tightly linked.
The first and most obvious variable is oil itself. Exxon’s earnings power still responds directly to crude prices, so any sustained move in WTI or Brent is likely to shape sentiment around the stock.
But the stock is not driven by oil alone. Traders should also watch whether Exxon’s capital allocation supports the case that the company is preparing intelligently for the next phase of the energy market.
A few signals matter most:
Oil price trends: These remain the strongest short-term driver of earnings expectations.
Capital expenditure discipline: The market wants to see spending support growth without eroding returns.
Transition project progress: Carbon capture and hydrogen investments matter more when they start to show commercial traction.
Dividend durability: Exxon’s appeal for many investors still depends on reliable shareholder returns.
Geopolitical developments: These can reprice the stock quickly through the oil channel, even before company-specific news arrives.
This is where interpretation matters. A trader looking at XOM is not just analysing an oil major. They are also analysing the shape of the global energy cycle, the durability of oil demand, and whether the market is rewarding traditional profitability over transition ambition.
As energy markets evolve, traders can also explore opportunities across oil, commodities, and global energy stocks through CFD Shares on the VT Markets app.
How XOM Fits Into a Broader Trading Strategy
XOM works well in a broader trading strategy because it can express multiple market views at once.
For some traders, it is primarily a crude oil proxy with equity characteristics.
For others, it is a dividend-backed energy exposure with lower volatility than pure commodity instruments. It can also serve as a way to gain exposure to inflationary or geopolitically driven market environments.
Within portfolio construction, XOM can play several roles:
Energy exposure with company-specific cash flow support
A real-asset hedge during inflationary periods
A more stable complement to commodity-linked trades
A way to monitor how the market is pricing the tension between oil demand and energy transition policy
It also creates natural links to other tradable assets. Traders following XOM often keep one eye on crude, one eye on broader energy indices, and another on transition-sensitive names across industrials and clean energy. That wider context is what makes the stock useful. It is not just a single-company story. It is a window into how markets are balancing old energy and new energy at the same time.
Bottom Line
For traders and investors, that makes XOM stock a useful name to watch. It remains deeply tied to oil markets, but it also offers insight into how one of the world’s largest energy companies is navigating the shift toward a lower-carbon future without giving up the earnings power of its traditional business.
Create a live VT Markets account today to access our platform features, including market insights and educational content.
FAQs
What is XOM stock?
XOM stock represents shares of Exxon Mobil Corporation, one of the world’s largest oil and gas companies.
Is ExxonMobil investing in clean energy?
Yes. Exxon is investing in carbon capture, hydrogen, and low-emission fuels, although it remains heavily focused on oil and gas.
Why is XOM stock tied to oil prices?
Exxon’s revenue and profits are largely driven by oil and gas production, making its stock highly sensitive to energy prices.
Is XOM a good dividend stock?
XOM is known for its strong dividend, typically offering yields in the 3% to 4% range, supported by cash flow from operations.
Can ExxonMobil adapt to the energy transition?
Exxon is pursuing a selective strategy, focusing on industrial decarbonisation while maintaining its core oil business.
Start trading now – Click here to create your real VT Markets account
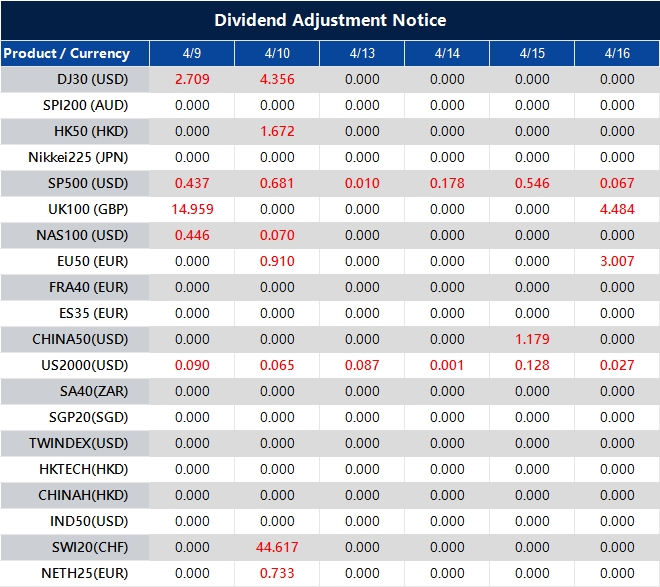
Please note that the dividends of the following products will be adjusted accordingly. Index dividends will be executed separately through a balance statement directly to your trading account, and the comment will be in the following format “Div & Product Name & Net Volume”.
Please refer to the table below for more details:
The above data is for reference only, please refer to the MT4/MT5 software for specific data.
If you’d like more information, please don’t hesitate to contact [email protected].