The stock market surged to historic heights as the Dow Jones Industrial Average closed above 37,000 for the first time, fueled by the Federal Reserve’s indication of upcoming rate cuts amidst eased inflation projections. This move drove notable gains across indices and sectors, with banking stocks like Bank of America and Wells Fargo rising significantly, alongside Home Depot, while pushing year-to-date gains for the Dow, S&P 500, and Nasdaq Composite. Simultaneously, the currency market witnessed substantial shifts, marked by the dollar index’s plunge and various currency pairs reacting to the Fed’s revised outlook, while attention turned to potential impacts on retail sales in the evolving landscape.
Stock Market Updates
The stock market soared to new heights, with the Dow Jones Industrial Average reaching a record-breaking close above 37,000 for the first time, spurred by the Federal Reserve’s indication of multiple rate cuts in the coming year. This move comes in response to the Fed’s acknowledgment of eased inflation and a revised forecast for a lower inflation rate of 2.4% in 2024, down from the previously projected 2.6%. Investors welcomed this shift in monetary policy, driving the Dow up by 512.30 points (1.40%), the S&P 500 by 1.37%, and the Nasdaq Composite by 1.38%, all hitting fresh 52-week highs. The market’s positive response was further reinforced by promising inflation data and a decrease in the 10-year Treasury yield to 4.03%, its lowest since August.
The Fed’s decision to signal forthcoming rate cuts boosted specific sectors: banking stocks like Bank of America and Wells Fargo, poised to benefit from a softer monetary policy, surged by 4% and nearly 3%, respectively. Additionally, Home Depot experienced a 3% gain, potentially due to expectations of increased sales driven by a potential housing market revival. This shift in market sentiment, aligning with investors’ desires for a more accommodating Fed stance, has significantly contributed to the Dow’s remarkable 11.9% year-to-date rise, while the S&P 500 and Nasdaq Composite have seen even more substantial gains of 22.6% and 40.8%, respectively, in 2023.
Data by Bloomberg
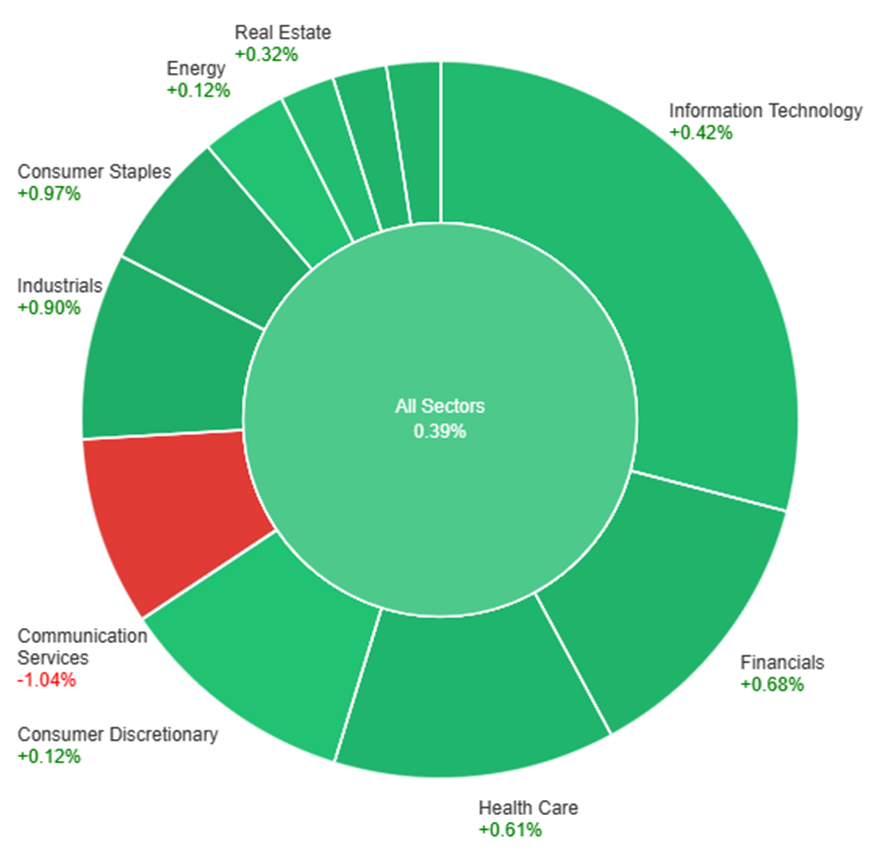
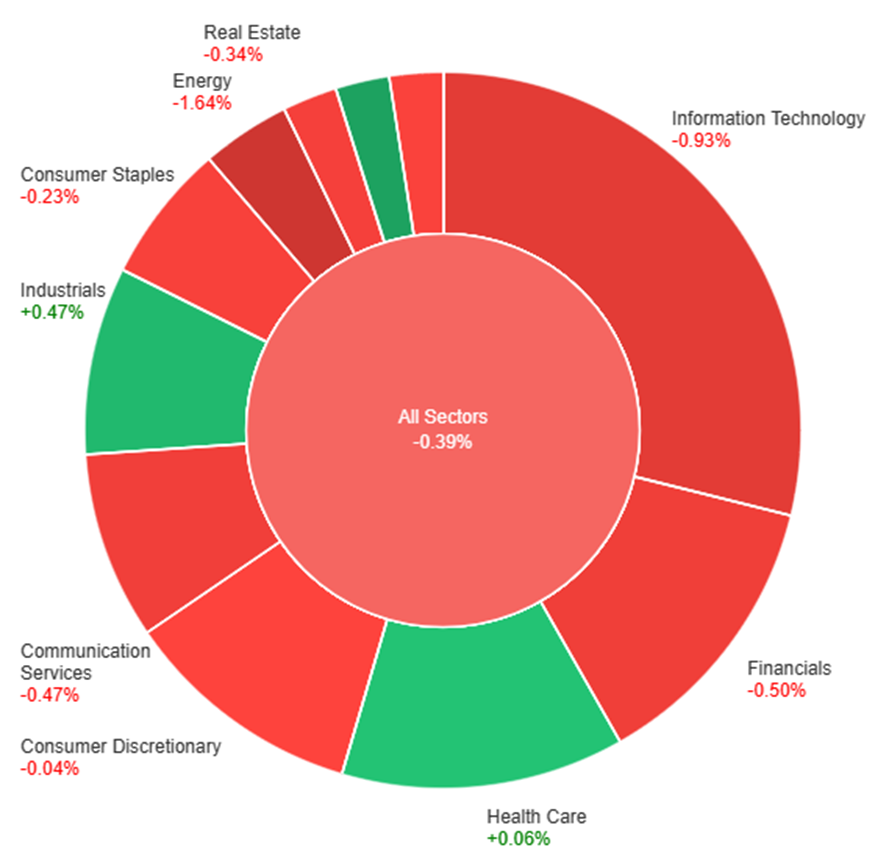
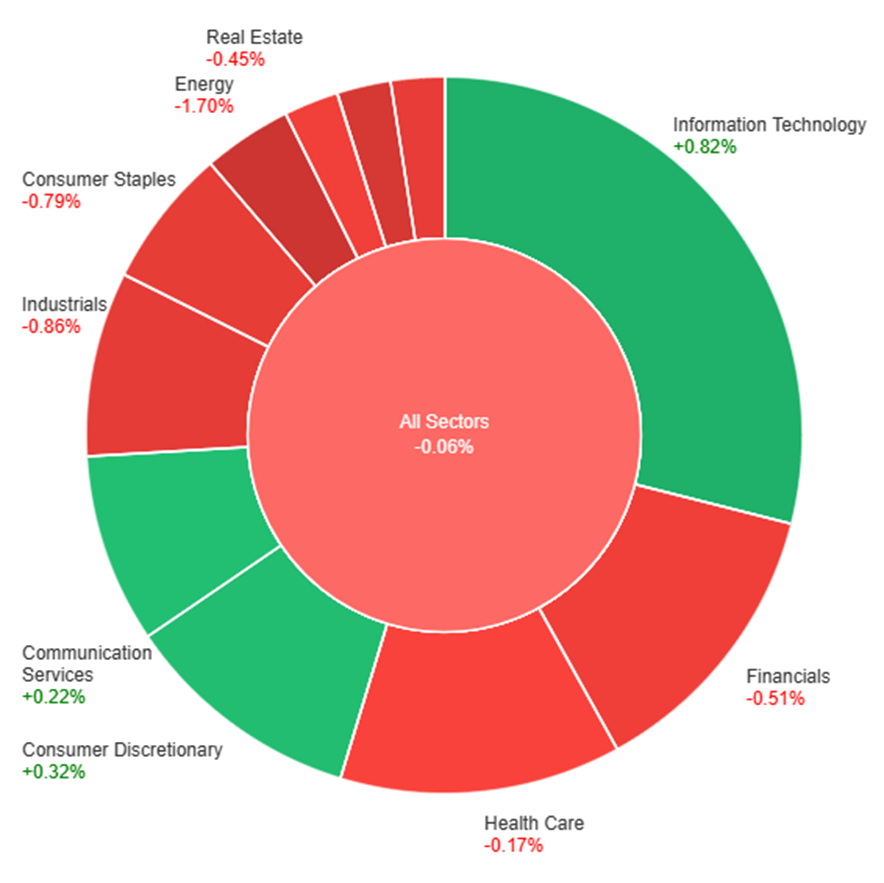
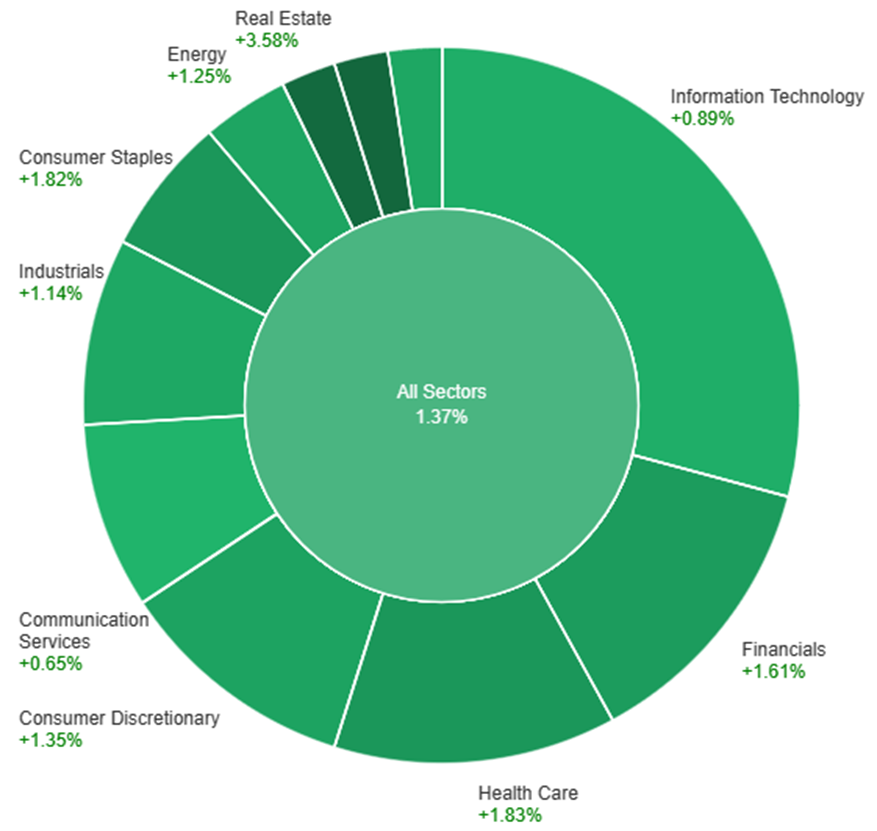
On Wednesday, across all sectors, the market saw a positive trend with a gain of 1.37%. Notably, the Utilities and Real Estate sectors experienced robust growth, rising by 3.72% and 3.58% respectively, outperforming other sectors. Health Care and Consumer Staples also showed healthy gains of 1.83% and 1.82% respectively. Financials, Consumer Discretionary, Energy, Materials, and Industrials followed suit with increases ranging from 1.14% to 1.61%. However, Information Technology and Communication Services had comparatively modest gains, recording 0.89% and 0.65% respectively, contributing to the overall positive market movement.
Currency Market Updates
The currency market witnessed significant shifts following the Federal Reserve’s announcements, causing a plunge in the dollar index by 0.7% during New York afternoon trade. Projections of three rate cuts in 2024, coupled with economic assessments, prompted a drop in two-year Treasury yields and futures pricing, with a notable rise in the probability of a March rate cut to 69%. The Fed’s deviation from previous dot plots, altering the trajectory from expected hikes in 2023 to anticipated cuts in 2024, marked a substantial change in market expectations. Notably, the EUR/USD pair surged by 0.85% following the Fed’s news, hitting a seven-day high, partly attributed to the European Central Bank’s projected rate cuts and the Eurozone’s economic performance lagging behind the US. Meanwhile, sterling experienced a shift from a loss to a gain, with expectations concerning the Bank of England’s stance on rate cuts diverging from the market’s projections.
Additionally, USD/JPY experienced a significant decline of 1.6% post-Fed, contrasting with its 0.2% dip ahead of the announcement. This movement aligned with lower Treasury-JGB yields following the Fed’s update, despite Japan’s positive Tankan survey and the Bank of Japan’s potential divergence as the sole major central bank possibly considering rate hikes next year. The dynamics in the currency market were influenced by oil price movements, with Brent finding support preceding June lows, driven by unexpected drops in WTI inventories and the amplified prospects of easing by major central banks, including the Fed. Looking ahead, the market’s focus shifted toward U.S. retail sales, anticipated to show soft figures, further contributing to the evolving currency landscape.
Picks of the Day Analysis
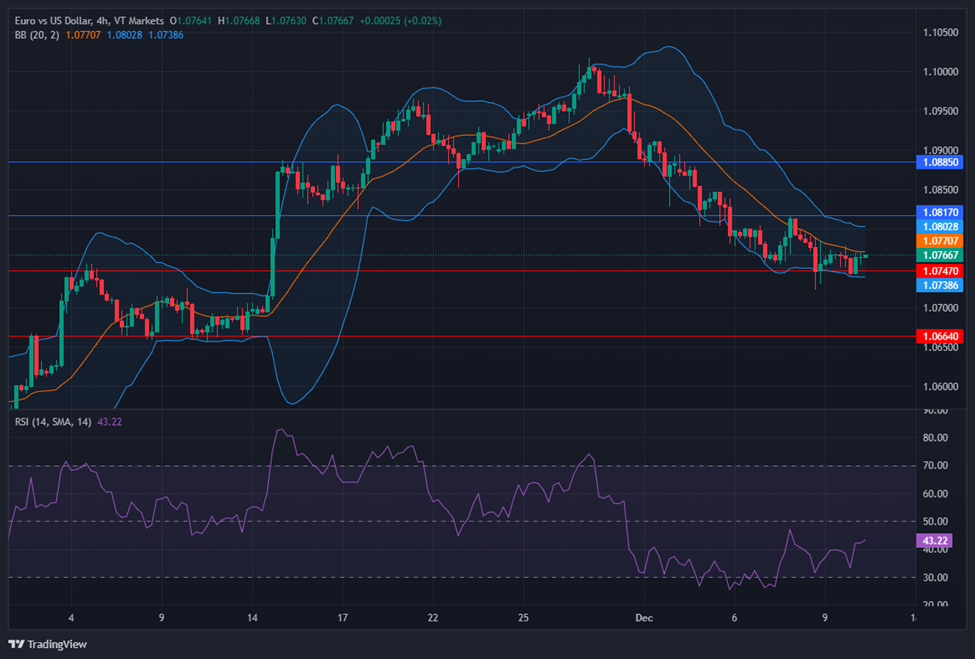
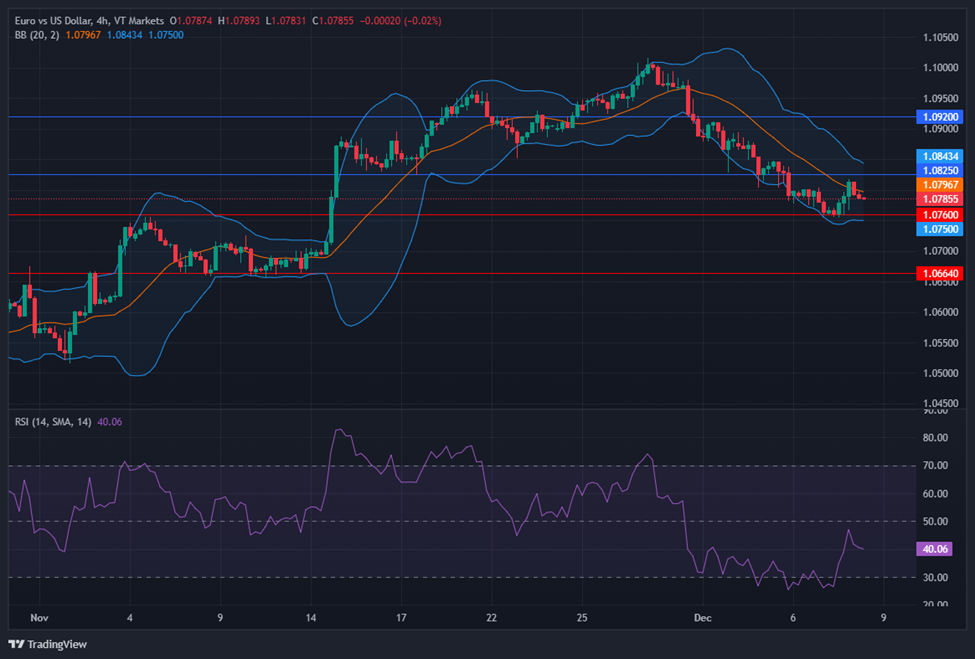
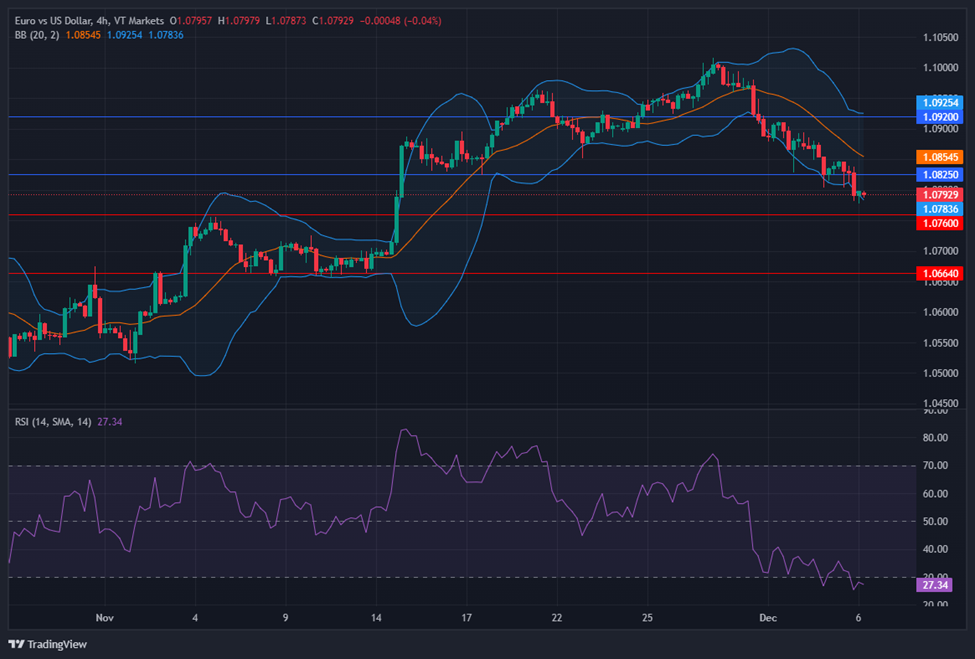
EUR/USD (4 Hours)
EUR/USD Rallies Amid Fed’s Stance, Eyes on ECB Decision
The EUR/USD pair surged more than 100 pips post the Federal Reserve meeting, breaching the 1.0900 mark on a firmly bullish trajectory driven by the US Dollar’s dip. The Fed’s decision to maintain interest rates and the projection of future rate cuts in 2024 propelled US bond rallies, pushing the 10-year yield to 4% lows and the US Dollar Index down by nearly 1%. Ahead of the European Central Bank’s anticipated decision, expectations loom around unchanged rates, discussions on PEPP reinvestment, and updated projections, foreseeing potential downgrades in growth and inflation forecasts. Market sentiment appears dovish, factoring in a possible rate cut in April, pressuring the Euro. Attention shifts to the ECB’s stance for insights into future market repositioning, with the US Dollar’s decline potentially propelling a rally toward 1.1000, tempered by the ECB decision or Eurozone PMI reports.
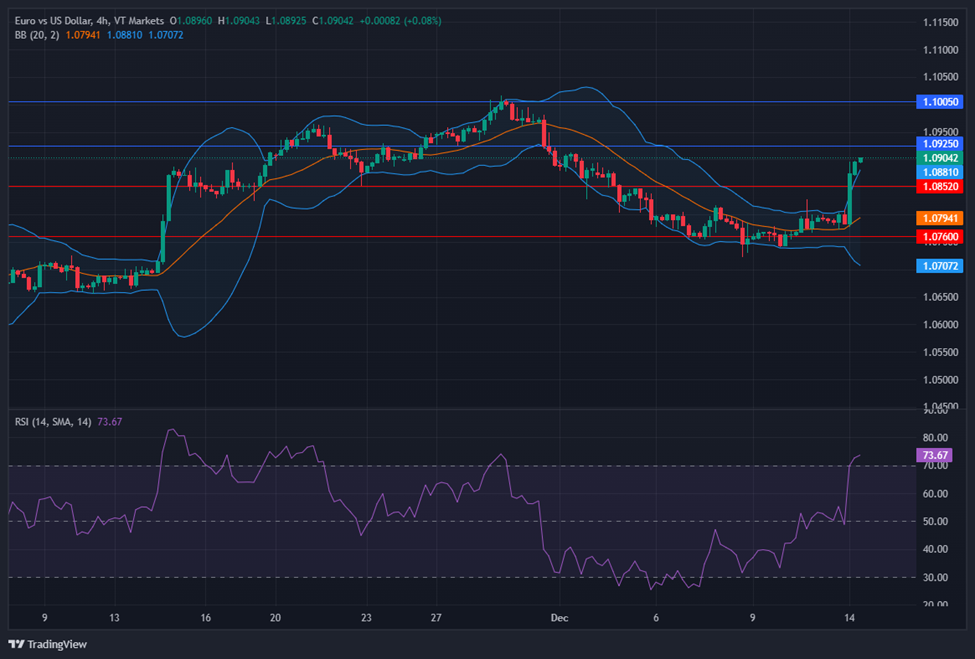
On Wednesday, the EUR/USD moved higher and was able to reach the upper band of the Bollinger Bands. Currently, the price moving slightly above the upper band, suggesting a potential continuation movement, potentially reaching the resistance level at 1.0925. Notably, the Relative Strength Index (RSI) maintains its position at 73, signaling a bullish outlook for this currency pair.
Resistance: 1.0925, 1.1005
Support: 1.0852, 1.0760
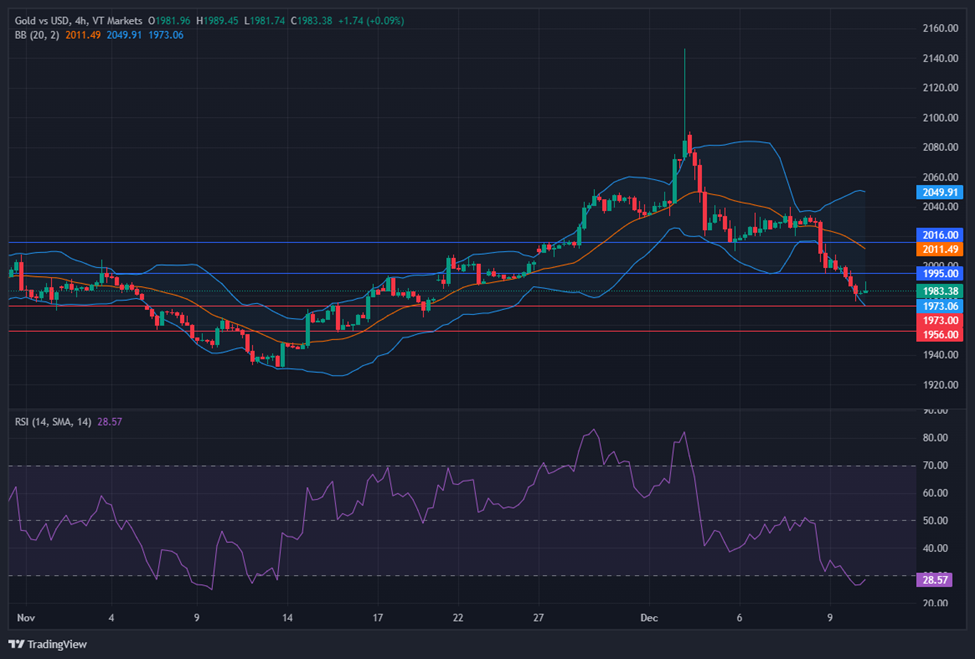
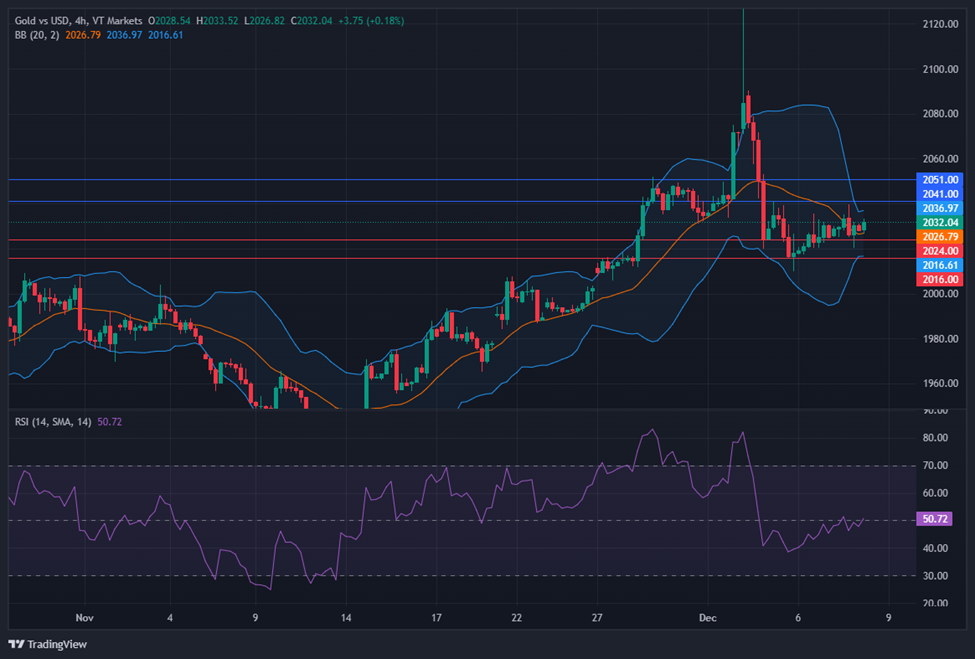
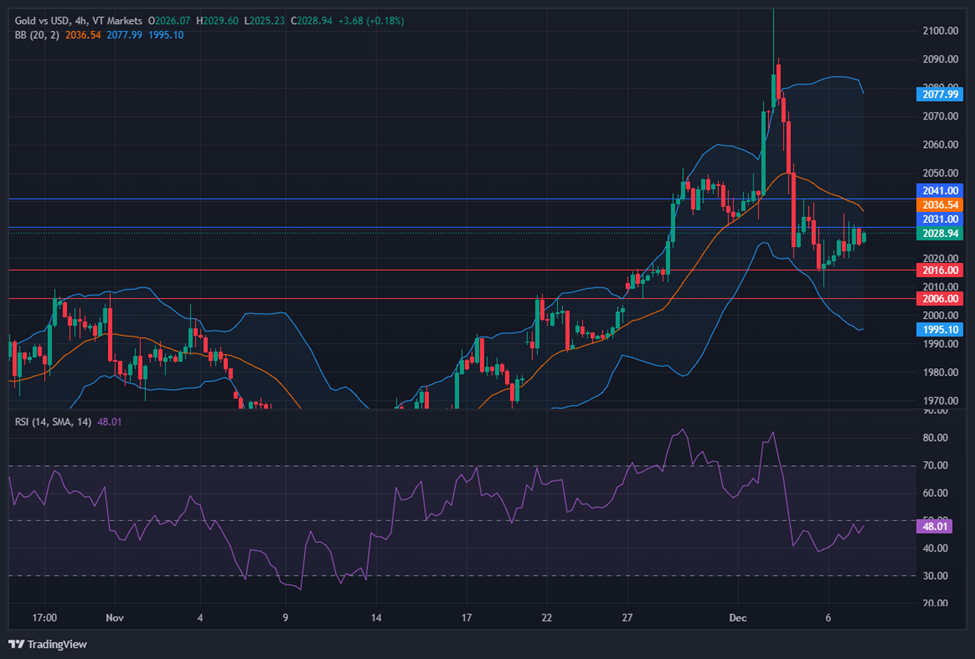
XAU/USD (4 Hours)
XAU/USD Surges Above $2,000 as Fed’s Dovish Tone Weakens Dollar and Treasury Yields
Gold (XAU/USD) soared past the $2,000 mark amidst the early Asian session, buoyed by a weaker US Dollar and declining Treasury yields following the Federal Reserve’s meeting. The Fed maintained interest rates unchanged, adopting a dovish stance on monetary policy. Fed Chair Jerome Powell hinted at potential rate cuts, contributing to the Dollar Index’s sharp decline and boosting gold prices. Despite market expectations aligning with the Fed’s decision, the possibility of rate cuts in 2024 exceeded forecasts, intensifying interest in gold. With upcoming US economic reports and Chinese data on the horizon, gold traders anticipate further cues from jobless claims, retail sales figures, and international economic indicators.
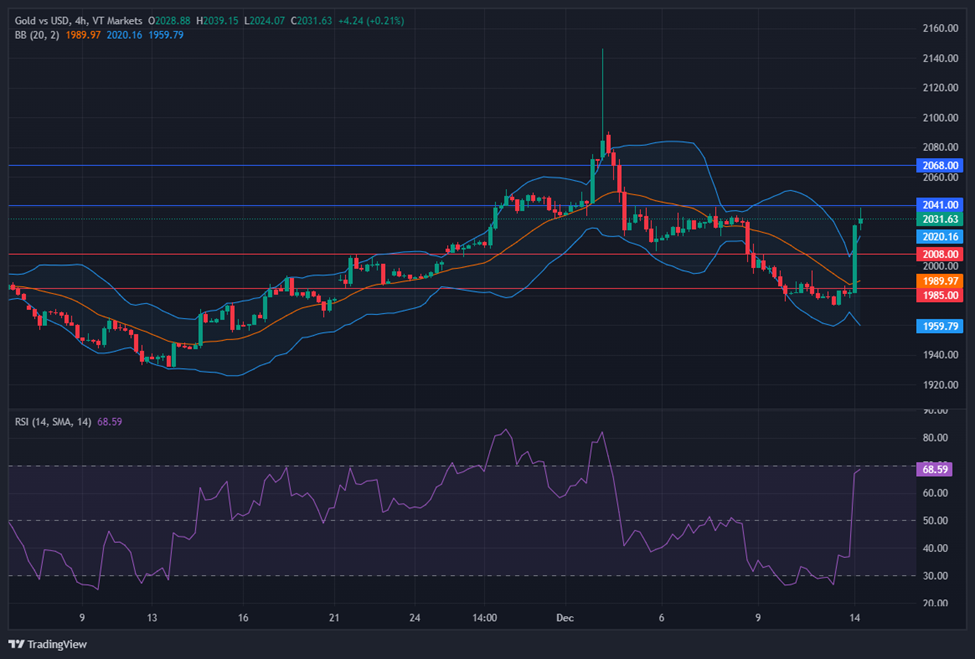
On Wednesday, XAU/USD moved higher and was able to reach the upper band of the Bollinger Bands. Currently, the price moving slightly above the upper band, suggesting a potential continuation movement, potentially reaching the resistance level at $2,041. The Relative Strength Index (RSI) stands at 68, signaling a bullish outlook for this pair.
Resistance: $2,041, $2,068
Support: $2,008, $1,985
Economic Data
| Currency | Data | Time (GMT + 8) | Forecast |
|---|---|---|---|
| CHF | SNB Monetary Policy Assessment | 16:30 | |
| CHF | SNB Policy Rate | 16:30 | 1.75% |
| CHF | SNB Press Conference | 17:00 | |
| GBP | Monetary Policy Summary | 20:00 | |
| GBP | MPC Official Bank Rate Votes | 20:00 | 2-0-7 |
| GBP | Official Bank Rate | 20:00 | 5.25% |
| EUR | Main Refinancing Rate | 21:15 | 4.50% |
| EUR | Monetary Policy Statement | 21:15 | |
| USD | Core Retail Sales m/m | 21:30 | -0.1% |
| USD | Retail Sales m/m | 21:30 | -0.1% |
| USD | Unemployment Claims | 21:30 | 219K |
| EUR | ECB Press Conference | 21:45 |