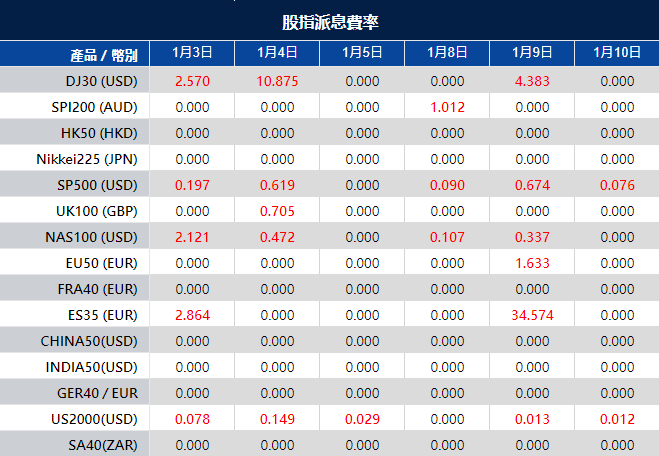
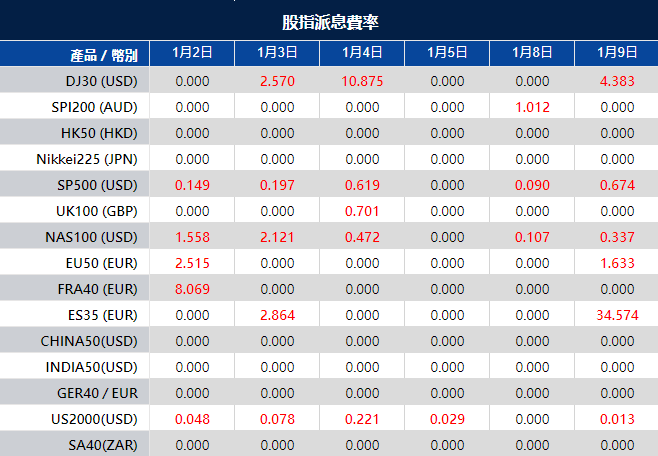
Please note that the dividends of the following products will be adjusted accordingly. Index dividends will be executed separately through a balance statement directly to your trading account, and the comment will be in the following format “Div & Product Name & Net Volume ”.
Please refer to the table below for more details:
The above data is for reference only, please refer to the MT4/MT5 software for specific data.
If you’d like more information, please don’t hesitate to contact [email protected].
The new year began with a mild downturn in the stock market, seeing the S&P 500 drop by 0.57% after an impressive 2023. Tech giants like Apple faced setbacks, while defensive stocks supported the Dow Jones. Despite this, the market enjoyed a bullish run in 2023 due to a strong economy and Fed signals. Analysts maintain optimism, anticipating a potential rebound during the earnings season. In currency markets, the dollar rebounded by 0.8% after a dovish Fed stance, influencing various pairs like EUR/USD and USD/JPY. The focus shifts to upcoming U.S. economic indicators and FOMC minutes for insights into potential market shifts.
Stock Market Updates
The stock market kicked off the new year on a slightly bearish note, with the S&P 500 falling by 0.57%, marking its first decline after a strong 2023. The Nasdaq Composite experienced its worst day since October, dropping by 1.63%, while the Dow Jones Industrial Average managed a slight gain of 0.07%. Apple faced a significant setback, sliding over 3% due to a downgrade from Barclays, impacting the performance of the Magnificent Seven market leaders basket. However, defensive stocks like Johnson & Johnson and Merck supported the Dow’s positive momentum.
In 2023, the stock market saw a remarkable surge, with the S&P 500 climbing for nine consecutive weeks, ending the year on a high note—its best streak since 2004. The bullish run was fueled by a resilient economy, cooled inflation, the Federal Reserve signaling an end to rate hikes, and an anticipation of future rate cuts. Tech giants like Apple, Microsoft, and Nvidia led the charge, with the Nasdaq Composite registering its best year since 2020. Despite the initial decline in the new year, analysts like Hatfield remain optimistic about equities, foreseeing a potential rebound during the upcoming earnings season.
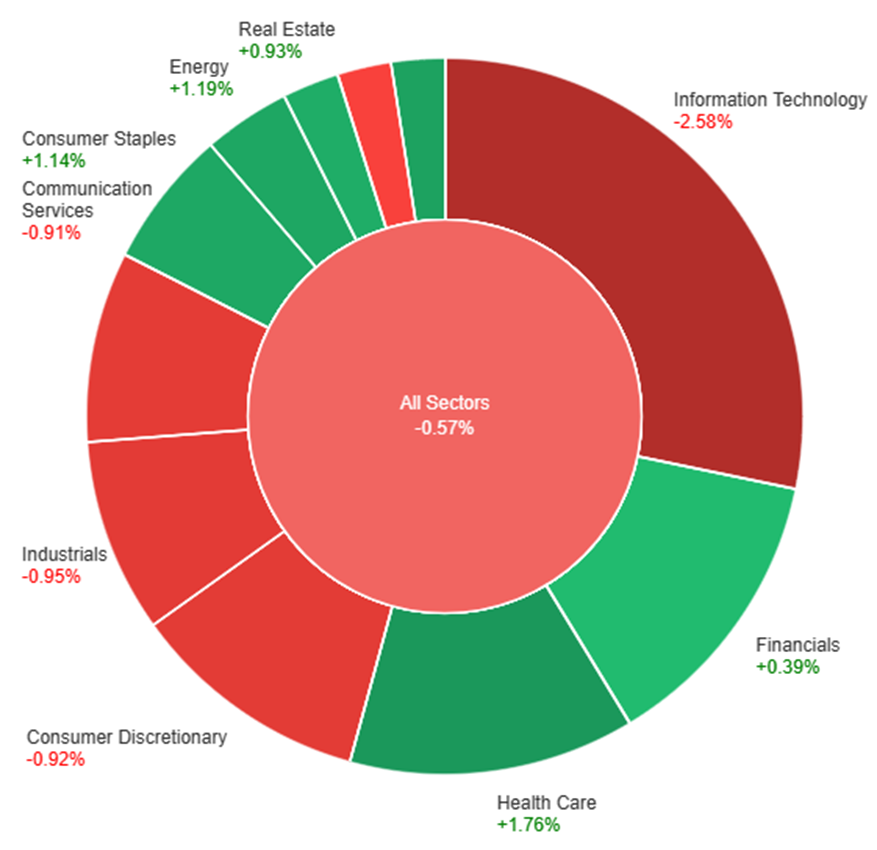
On Tuesday, across all sectors, the market experienced a slight decline of 0.57%. Health Care, Utilities, and Energy sectors showed positive gains, with Health Care leading at +1.76%, followed by Utilities at +1.38% and Energy at +1.19%. Conversely, Information Technology took a significant hit, dropping by -2.58%. Sectors like Consumer Discretionary, Communication Services, and Industrials also experienced declines ranging from -0.91% to -0.95%. Meanwhile, Financials and Real Estate showed modest gains, while Materials faced a small decrease of -0.20%.
Currency Market Updates
The currency markets witnessed a resurgence of the dollar index by 0.8% following profit-taking on short trades that ensued after a more dovish stance from the Fed in mid-December. This unexpected turn led to a tumble in Treasury yields and rate expectations, prompting a surge in risk-taking behavior. The focus now hovers around the upcoming key U.S. labor market data, ISM releases, and the scrutiny of FOMC meeting minutes as market participants gauge the impact of these factors on the dollar’s recent slide and the potential for a reversal.
EUR/USD experienced an 0.82% decline, approaching the 50% retracement level of December’s surge, while USD/JPY rose 0.8%, seeking to breach resistance around 142 to push towards 143. Sterling mirrored the pressures faced by EUR/USD, dropping by 0.77%, largely influenced by lagging gilt treasury yield spreads. Concurrently, USD/CAD ascended by 0.63%, propelled by Canada’s PMI hitting a 3-1/2-year low at 45.4. Market sentiment hinges on upcoming crucial U.S. economic indicators that are expected to confirm a cooling labor market with receding inflationary pressures, yet still shy of the Fed’s 2% target. The interplay of these data releases will likely shape the trajectory of major currency pairs in the coming days.
Picks of the Day Analysis
EUR/USD (4 Hours)
EUR/USD Declines as Dollar Gains Ground Amidst Economic Contractions
The EUR/USD pair experienced a significant downturn, touching lows of 1.0940 amidst a stronger US Dollar driven by a gloomy market sentiment due to persistent economic contraction signals at the close of 2023. S&P Global’s released PMI data for both the Eurozone and the US showcased a slight improvement in the EU’s manufacturing index while the US saw a contraction, aligning with a risk-averse atmosphere that pushed stocks downward and lifted Treasury yields. Eyes are now on upcoming data, particularly the December US ISM Manufacturing PMI and FOMC Meeting Minutes, as Chairman Jerome Powell hinted at potential rate cuts, prompting curiosity about policymakers’ official discussions.
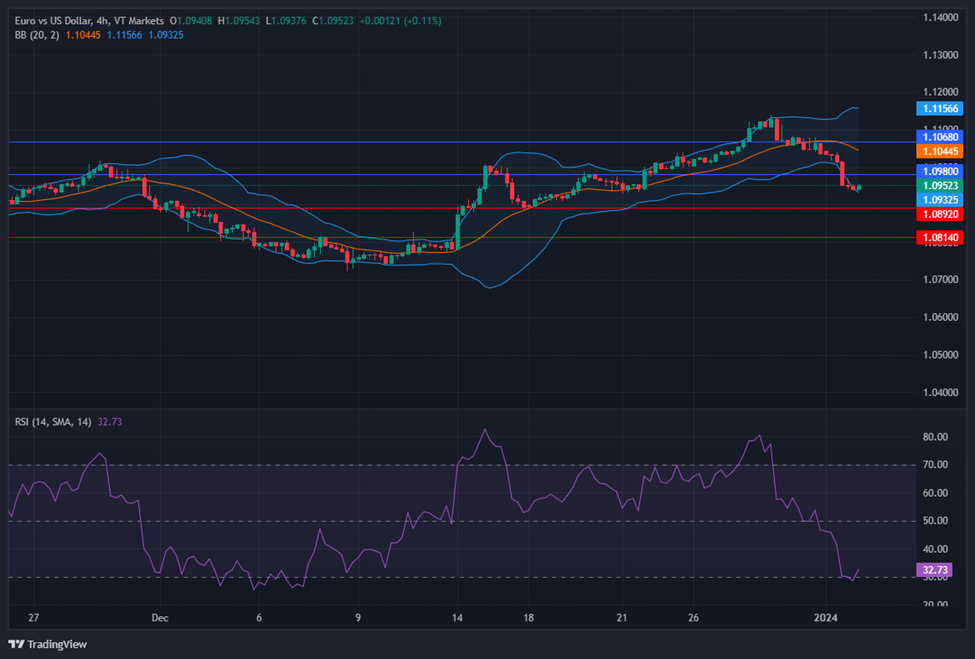
On Tuesday, the EUR/USD moved lower and reached the lower band of the Bollinger Bands. Currently, the price moving slightly above the lower band, suggesting a potential upward movement. Notably, the Relative Strength Index (RSI) maintains its position at 32, signaling a bearish outlook for this currency pair.
Resistance: 1.0980, 1.1068
Support: 1.0892, 1.0814
XAU/USD (4 Hours)
XAU/USD Holds Steady Amidst Market Caution and Dollar Strength
Spot Gold maintained a steady stance, lingering around its daily opening without a definitive trajectory, recuperating slightly from an intraday dip to $2,055.82. The US Dollar gained traction throughout the European trading session, bolstered by Wall Street’s subdued performance. Investor apprehension loomed after the long weekend, accentuated by the forthcoming pivotal US employment data and a lineup of significant economic indicators. The sentiment downturn followed the disappointing US S&P Global Manufacturing PMI, overshadowing the better-than-expected European Manufacturing PMIs. This cautionary atmosphere was compounded by US stocks dipping and government bond yields edging upwards, indicating renewed market apprehension regarding projected rate cuts across major economies. Eyes remain fixed on the imminent US employment reports and upcoming European inflation updates, shaping the short-term technical outlook for XAU/USD.
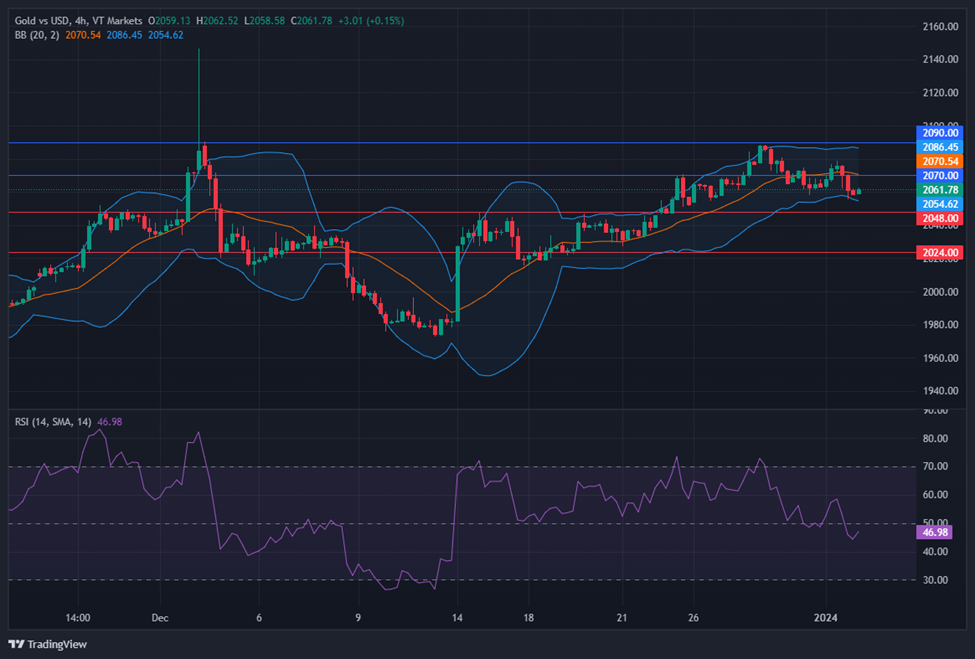
On Tuesday, XAU/USD moved lower and reached the lower band of the Bollinger Bands. Currently, the price moving just above the lower band, suggesting a potential upward movement. The Relative Strength Index (RSI) stands at 46, signaling a neutral outlook for this pair.
Economic data: S&P Global US Services PMI, December, final (48.4 expected, 48.2previously); MBA Mortgage Applications, week ending December 29
CURRENCIES:
U.S. Dollar’s Downward Correction
Witnessed a significant downward correction in the U.S. dollar due to expectations of the Federal Reserve reducing borrowing costs.
US Treasury yields plunged in the last quarter of 2023, contributing to the dollar’s lowest level in five months.
Currency and Precious Metal Performance
EUR/USD and GBP/USD experienced a notable surge, reaching multi-month highs in late December.
Gold prices showed strength, concluding 2023 above $2,000, though slightly below its all-time high.
The bullish trend in gold is expected to continue, benefiting from the Federal Reserve’s policy shift.
Equity Market Rally
The pullback in U.S. bond yields triggered a substantial rally in the equity market.
Major stock market indexes reached new records, reflecting the prevailing risk-on sentiment.
Outlook for Q1 2024
U.S. dollar may continue to face losses in the coming months due to downward-sloping yields.
Anticipated upward momentum for gold, EUR/USD, GBP/USD, and stocks in Q1.
Caution advised as some markets approach potential overbought conditions.
Increased Volatility and Trading Setups
Expect different market dynamics leading to heightened volatility.
Opportunities for enticing trading setups in major assets, including currencies, commodities (gold, silver, oil), and cryptocurrencies.
STOCK MARKET:
Fed Rate Cut Speculation:
Morgan Stanley’s Ellen Zentner suggests a possible Fed rate cut may come later than market expectations.
Zentner emphasizes that monthly payroll additions below 50,000, coupled with consistent low inflation, could trigger a March rate cut.
Caution is advised, highlighting that a single weak jobs report might not be sufficient for a rate cut decision.
Morgan Stanley’s Base Case:
The base case for Morgan Stanley remains a Fed cut in May, contrary to earlier market expectations.
Late 2023 Market Rally Impact:
Investors face the question of whether the late 2023 market rally accelerated the gains expected in 2024 or if there is room for further upward movement.
Ryan Detrick, Chief Markets Strategist at Carson Group, cites historical data indicating that after a late-year S&P 500 rally exceeding 10%, the benchmark average historically rose by an average of 19.5% in the following year.
Contrasting Views on Market Continuation:
Tom Lee, Fundstrat’s Head of Research, acknowledges the likelihood of new all-time highs for the S&P 500 but anticipates a subsequent consolidation.
Lee points out key concerns, including investor uncertainty about the Fed’s rate-cut timing and a potential downturn around February or March in an election year.
Tom Lee’s Market Outlook:
Lee predicts a brief pullback after new all-time highs, suggesting a range of S&P 500 at 4,400-4,500.
Consistent with the 2024 Year Ahead Outlook, Lee’s base case envisions most gains for the S&P 500 in the second half of 2024.
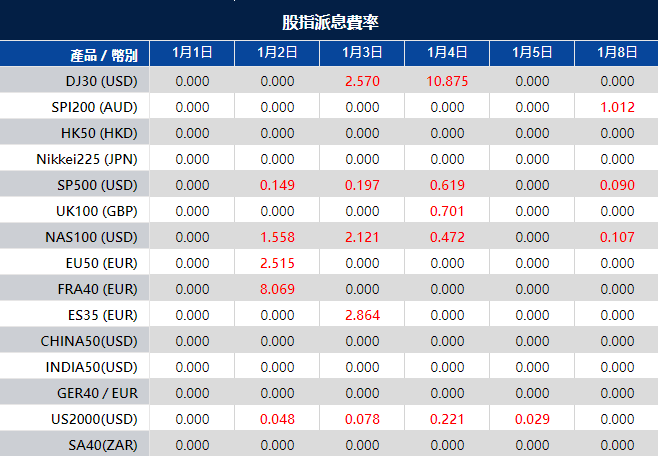
Please note that the dividends of the following products will be adjusted accordingly. Index dividends will be executed separately through a balance statement directly to your trading account, and the comment will be in the following format “Div & Product Name & Net Volume ”.
Please refer to the table below for more details:
The above data is for reference only, please refer to the MT4/MT5 software for specific data.
If you’d like more information, please don’t hesitate to contact [email protected].
The inaugural week of 2024 is poised to be a dynamic period for traders and investors, with a spotlight on critical economic indicators that are expected to shape market sentiments. Among the pivotal data releases are the ISM Manufacturing and Services PMI from the US, the German Preliminary CPI from the EU, and the highly anticipated US and Canada Employment Change figures. This overview aims to guide you through the key developments and predictions, with a specific emphasis on the potential impact on major currencies, particularly the US Dollar.
It’s crucial for traders to be cautious and stay on top of the latest developments for a successful week of trading.
ISM Manufacturing PMI (3 January 2024)
The ISM Manufacturing PMI, holding steady at 46.7 in November 2023, is expected to modestly increase to 47.1 in the upcoming release on 3 January 2024.
FOMC Meeting Minutes (4 January 2024)
The Federal Reserve maintained the fed funds rate at 5.25%-5.5% for a third consecutive meeting in December 2023. However, they have hinted at a potential 75 basis points cut in 2024. Therefore the meeting minutes on 4 January 2024 will provide insights into the Fed’s latest monetary policy stance, reflecting the current economic indicators, including slowed growth, moderated job gains, and persistent but slightly eased inflation.
German Prelim CPI (4 January 2024)
After a 0.4% decline in November 2023, Germany’s Preliminary CPI, anticipated on 4 January 2024, is expected to rebound with a projected increase of 0.2%.
Canada Employment Change (5 January 2024)
Following positive employment numbers in October and November of 2023, Canada is poised to release its December 2023 employment data on 5 January 2024. Forecasts suggest an increase of 12K jobs, but with a marginal uptick in the unemployment rate to 5.9%.
US Non-Farm Employment Change (5 January 2024)
November 2023 saw a robust addition of 199k jobs in the US, surpassing October figures. The upcoming release on 5 January 2024 is anticipated to reveal a positive trend with an estimated increase of 163,000 jobs, while the unemployment rate is expected to inch up to 3.8%.
US ISM Services PMI (5 January 2024)
Closing the week, the US ISM Services PMI, reflecting growth in the services sector, is projected to experience a marginal decline from 52.7 to 52.6 in the December figures, set for release on 5 January 2024.
As traders embark on the first week of 2024, vigilance and adaptability will be key. Stay informed, monitor the latest developments, and be prepared for potential market shifts in response to these critical economic indicators.
Please note that the dividends of the following products will be adjusted accordingly. Index dividends will be executed separately through a balance statement directly to your trading account, and the comment will be in the following format “Div & Product Name & Net Volume ”.
Please refer to the table below for more details:
The above data is for reference only, please refer to the MT4/MT5 software for specific data.
If you’d like more information, please don’t hesitate to contact [email protected].
In the penultimate trading session of the year, the S&P 500 approached an all-time high, indicating a robust finish to an exceptionally bullish year for stocks. The Dow Jones Industrial Average secured a new record, while the Nasdaq Composite saw a slight dip. With major indices poised to end 2023 on gains, projected around 13.8% for the Dow and 24.6% for the S&P, the Nasdaq’s remarkable 44.2% rise stands out, buoyed by tech giants and fervor over AI. As the market anticipates the traditional “Santa Claus rally,” the late 2023 surge sets an optimistic tone for 2024, backed by positive technical indicators and expectations of rate cuts and reduced inflation. In the currency market, the US Dollar Index fluctuated significantly, buoyed by rising Treasury yields, impacting major pairs like EUR/USD and GBP/USD. Additionally, USD/JPY and AUD/USD experienced noteworthy volatility, while gold faced a pullback amidst the USD resurgence and climbing yields, reflecting the complex interplay of economic factors and geopolitical events shaping currency movements.
Stock Market Updates
In the penultimate trading day of the year, the S&P 500 edged slightly higher, nearing an all-time high at 4,783.35, signaling a robust end to a bullish year for stocks. The Dow Jones Industrial Average also achieved a new record, closing at 37,710.10, while the Nasdaq Composite experienced a minor dip to 15,095.14. Notably, all major indices are set to conclude 2023 with gains, with the Dow and S&P projected to finish up nearly 13.8% and 24.6%, respectively. The Nasdaq stands out with a remarkable 44.2% climb, its most substantial increase since 2003, primarily fueled by the resurgence of mega-cap tech companies and the fervor surrounding artificial intelligence.
Amidst this year-end rally, the market looks forward to the “Santa Claus rally,” historically observed in the final days of a year and the early days of the subsequent one. The market’s impressive late-2023 surge, rebounding from a sluggish third quarter, positions the S&P with an 11.6% quarterly increase, marking its strongest quarterly performance in three years. As 2023 concludes, the optimistic sentiment continues, with a positive technical outlook and expanding market breadth anticipated to set the stage for a promising 2024. Forecasts pivot on expectations of forthcoming rate cuts and sustained alleviation in inflation, creating what’s termed a “perfect storm” for stocks in the coming year.
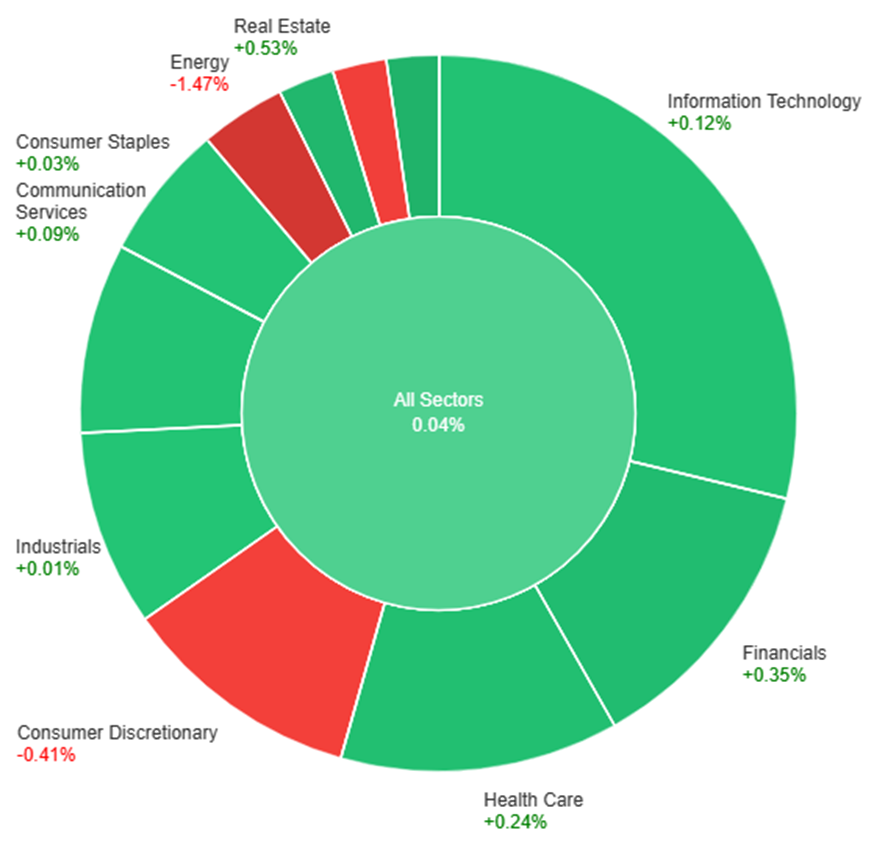
On Thursday, most sectors experienced modest gains, with Utilities leading at +0.70%, followed closely by Real Estate at +0.53% and Financials at +0.35%. Health Care, Information Technology, and Communication Services saw smaller increases ranging from +0.12% to +0.24%. However, Consumer Discretionary and Materials faced declines of -0.41% and -0.46% respectively. Energy witnessed a significant drop of -1.47%, marking the most substantial decrease among all sectors for the day.
Currency Market Updates
In the currency market update, the US Dollar Index (DXY) demonstrated significant volatility, bottoming out at 100.86 before sharply rebounding to 101.25. The Greenback’s resurgence was propelled by a surge in US Treasury yields, reaching 3.85% following a successful auction of the 7-year note. Despite the correction, with higher yields contributing to its recovery, the overall trend for the USD remains downward, albeit with potential for further correction.
EUR/USD faced its steepest decline in two weeks, sliding from a monthly high of 1.1139 to the 1.1055 area. The pair’s movement was influenced by Spain’s impending inflation figures and Eurostat’s scheduled release of Eurozone figures, both expected to provide significant insights into the euro’s trajectory. Similarly, GBP/USD retreated from above 1.2800 to around 1.2700, with the UK’s final economic report for 2023 focusing on Nationwide Housing Prices for December.
USD/JPY experienced notable volatility, plunging to 140.23—the lowest level since July—before recovering to 141.40, supported by rising yields. AUD/USD reached a peak at 0.6871 but failed to maintain momentum, slipping to 0.6835. The Australian Dollar faces immediate support at 0.6825, while a potential upswing could occur if it surpasses 0.6850.
Gold faced a pullback from $2,088 to $2,065 due to the rebounding US Dollar and rising yields. Despite the overarching upward trend, current conditions hint at a potential downside bias ahead of the Asian session for the precious metal. These fluctuations across currency pairs and gold prices reflect the intricate interplay between economic indicators, market sentiments, and geopolitical events driving currency market movements.
Picks of the Day Analysis
EUR/USD (4 Hours)
EUR/USD Falters Despite US Economic Data; Eyes on Eurozone Inflation
The EUR/USD faced setbacks as it slipped below 1.1100, driven by a surge in US Treasury yields despite mixed American economic reports. The US Dollar remained resilient, largely unaffected by the jobless claims uptick and stagnant pending home sales. Amidst Wall Street’s festive rally, the greenback found strength with a rebound in yields post a 7-year note auction, sidelining the impact of economic data. Attention turns to Spain’s preliminary CPI figures for December, crucial for insight into Eurozone inflation, likely to shape the pair’s trajectory.
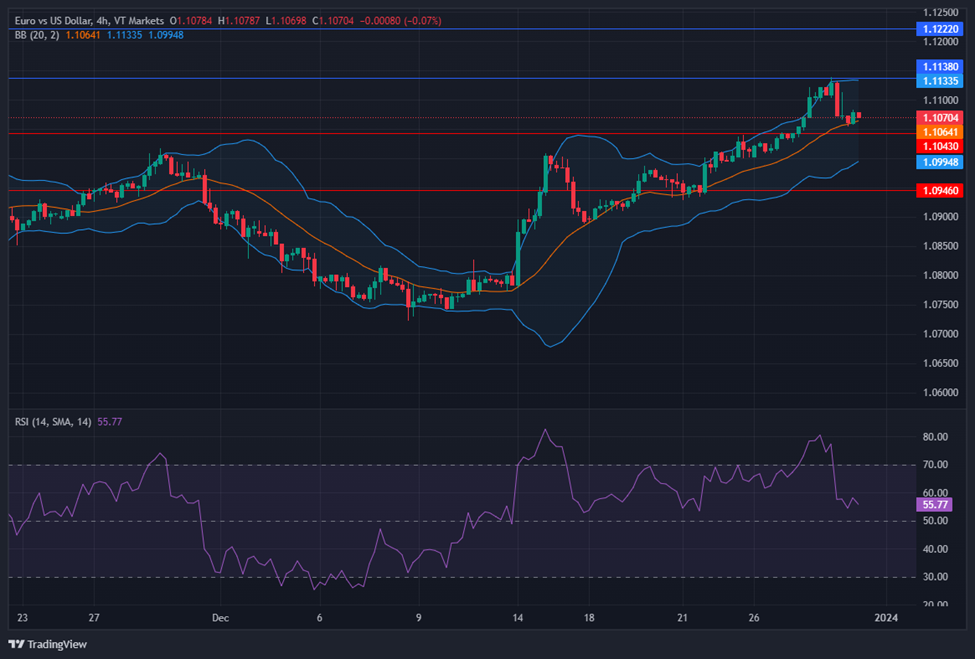
On Thursday, the EUR/USD moved lower and reached the middle band of the Bollinger Bands. Currently, the price moving slightly above the middle band, suggesting a potential upward movement. Notably, the Relative Strength Index (RSI) maintains its position at 55, signaling a neutral outlook for this currency pair.
Resistance: 1.1138, 1.1222
Support: 1.1043, 1.0946
XAU/USD (4 Hours)
XAU/USD Continues Surge Amid Dollar Weakness and Investor Optimism
Gold prices are on the rise as the US Dollar faces pressure amidst a buoyant Asian stock market. Investor enthusiasm for anticipated aggressive interest rate cuts by the Fed, coupled with China’s commitment to bolster domestic demand and liquidity injections by the PBOC, fuels risk appetite, edging the Dollar lower. Despite a slight rebound in US Treasury bond yields, Gold maintains its upward momentum, nearing the $2,100 mark in Asian trade. The Dollar Index hovers near five-month lows, while US Treasury bond yields, after bouncing off multi-month lows, stand at 3.81%, up 0.50% on the day. Wednesday’s market return saw Gold hit a record close above $2,070, propelled by a Dollar sell-off post-positive US auctions. Anticipation of Fed rate cuts continues to drive demand for stocks and bonds, influencing Treasury yields. With the focus shifting to mid-tier US Jobless Claims and a seven-year bond auction, Gold traders remain vigilant amid pre-New Year thin liquidity conditions, expecting potential upside boosts.
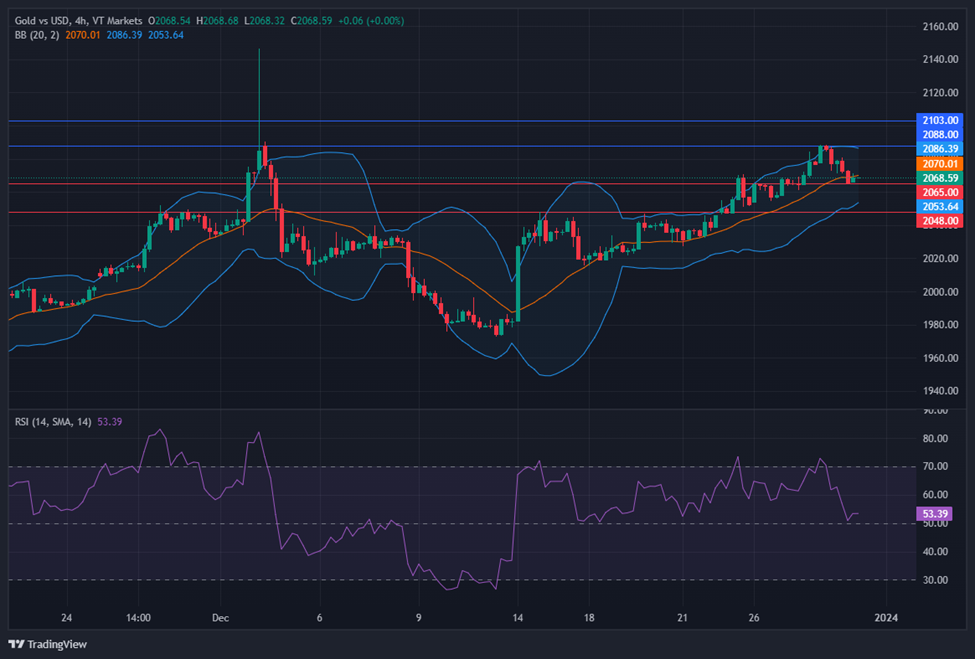
On Thursday, XAU/USD moved lower and reached the middle band of the Bollinger Bands. Currently, the price moving at the upper band, suggesting a potential upward movement. The Relative Strength Index (RSI) stands at 53, signaling a neutral outlook for this pair.
Stocks closed higher as the S&P 500 edged up 0.14%, nearing its all-time high from January 2022. The Dow Jones Industrial Average also hit a new closing high, while the Nasdaq Composite rose 0.16%, marking an eight-week winning streak. Analysts anticipate a potential ‘Santa Claus rally’ despite concerns over market over-optimism, cautioning investors about unexpected shifts as the Federal Reserve’s rate decisions loom. Additionally, the US Dollar weakened against major currencies, influenced by lower Treasury yields and economic data releases, while the commodity market saw Gold nearing record highs and Silver stabilizing.
Stock Market Updates
Stocks closed higher, with the S&P 500 edging up 0.14% to nearly reach its all-time high from January 2022, ending at 4,781.58. The Dow Jones Industrial Average also hit a new closing high, while the Nasdaq Composite rose 0.16%. This climb marks an eight-week winning streak for the S&P, Dow, and Nasdaq, with the S&P nearing its record. Analysts anticipate a ‘Santa Claus rally,’ a period noted for market upswings at the end of one year and the start of the next, which historically sees an average increase of about 1.3% for the S&P 500.
Despite the overall positive market sentiment, concerns loom regarding potential over-optimism. Some experts worry that the market’s enthusiasm might lead to disappointment if the Federal Reserve delays rate cuts. While Fed funds futures indicate possible rate cuts as early as March, experts caution that the current bullish sentiment might expose investors to unexpected market shifts, especially with 90% of S&P 500 stocks trading above their 50-day moving average, suggesting a level of market “frothiness.” Analysts advise caution amidst this optimistic climate to guard against unforeseen market volatility.
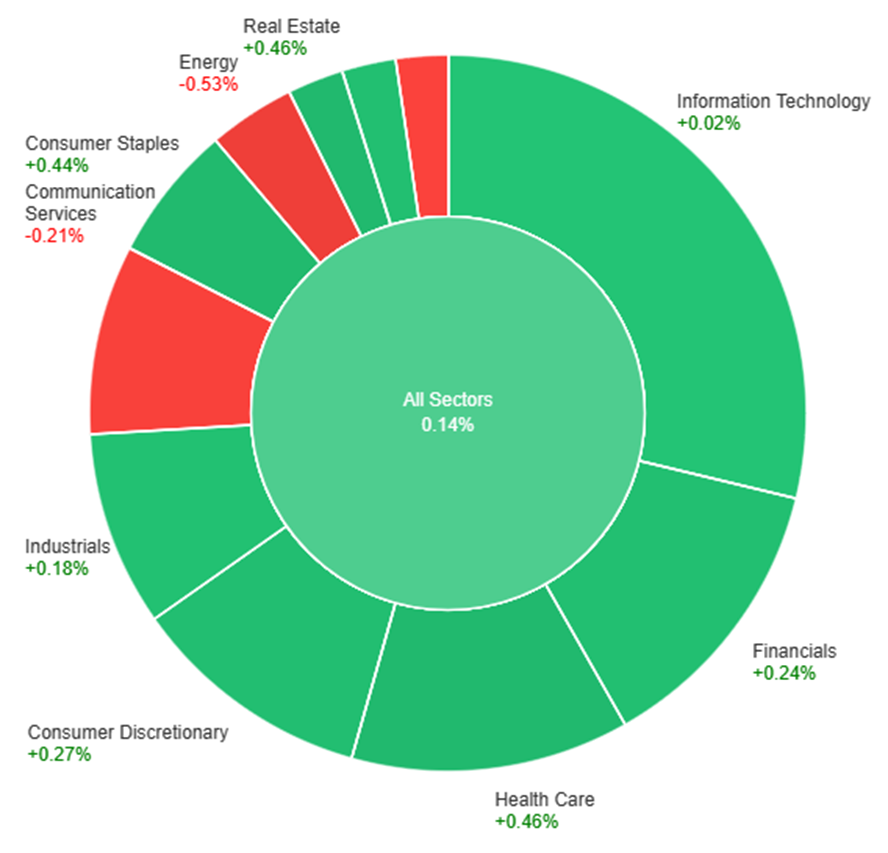
On Wednesday, across various sectors, the market showed a modest overall increase of 0.14%. Health care and real estate sectors led the gains, both surging by 0.46%, followed closely by consumer staples at 0.44%. Sectors like consumer discretionary and materials experienced moderate gains at 0.27% and 0.25%, respectively. However, there were declines in certain sectors, with energy facing the most significant drop of 0.53%, followed by communication services at -0.21% and utilities at -0.12%. Information technology saw the smallest change, with a marginal increase of 0.02%.
Currency Market Updates
The currency markets saw a notable weakening of the US Dollar as the US Dollar Index (DXY) dropped below 101.00, marking its lowest point since July. This decline was attributed to a combination of factors, including the 10-year Treasury yield hitting a five-month low at 3.78%, coupled with the 2-year settling at 4.24%, the lowest since May. Amidst this, US stocks hovered near recent highs, especially the Dow Jones, which edged closer to an all-time high. However, the Dollar’s decline persisted due to increased risk appetite and the sustained pressure of lower Treasury yields. The release of economic data further exacerbated the situation, with the Richmond Fed Manufacturing Index dropping to -11 in December, reflecting worse-than-expected figures across shipments, new orders, and employment. The upcoming release of the weekly Jobless Claims report, trade figures, and November’s Pending Home Sales report could add to the market’s sentiment.
Meanwhile, the Euro (EUR/USD) surged past 1.1100 for the first time in five months, driven by the broad-based weakness of the Dollar. The Pound (GBP/USD) also witnessed a strengthening trend, reaching 1.2802, its strongest level since August, although it subsequently retreated slightly. The Japanese Yen outperformed amidst the Dollar’s decline, pushing USD/JPY below 142.00 and approaching December lows. Australian (AUD/USD) and New Zealand (NZD/USD) currencies remained in upward trajectories, facing resistance levels around 0.6850 and reaching the 0.6350 area, respectively, backed by a combination of risk appetite and lower yields. Conversely, the Canadian Dollar (USD/CAD) experienced a lag despite bottoming at 1.3175, its lowest since August, as it climbed back above 1.3200 by the end of the trading day. In the commodity market, Gold continued its upward trajectory, nearing a record close above $2,070, while Silver stagnated around $24.25, failing to follow Gold’s upward trend.
The EUR/USD rallied past the 1.1100 mark propelled by a weakening US Dollar, sinking below 101.00 in the DXY index for the first time in five months. With US Treasury yields hitting new lows amidst expectations of Federal Reserve rate cuts in the upcoming year, the Dollar faced downward pressure while equity markets remained buoyant. Despite quiet trading, anticipation grows for crucial reports like the US weekly Jobless Claims and Spain’s preliminary inflation figures. As 2023 concludes, the serene market conditions continue to weigh on the Dollar, setting the stage for a pivotal turn with the impending release of US employment data next week.
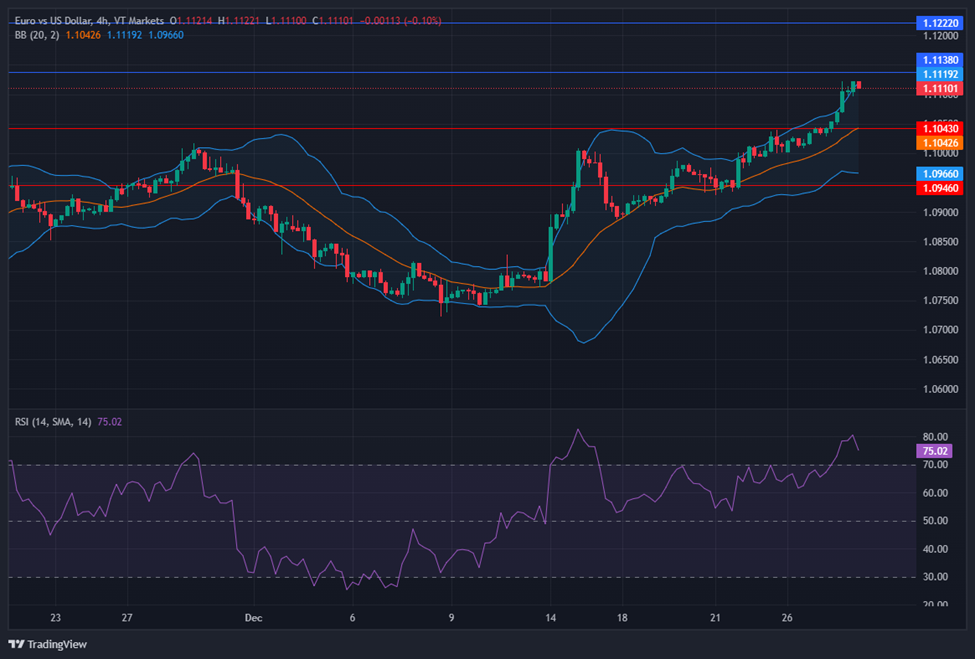
On Wednesday, the EUR/USD moved higher and reached the upper band of the Bollinger Bands. Currently, the price moving slightly below the upper band, suggesting a potential upward movement. Notably, the Relative Strength Index (RSI) maintains its position at 75, signaling a bullish outlook for this currency pair.
Resistance: 1.1138, 1.1222
Support: 1.1043, 1.0946
XAU/USD (4 Hours)
XAU/USD Navigates Volatility Amidst Cautious Dollar and Fed Watch
Gold (XAU/USD) is experiencing a pause as the US Dollar (USD) stabilizes amidst market caution, despite sluggish US Treasury bond yields. Investors, returning from the Christmas holiday, are refraining from substantial trades, closely monitoring macroeconomic developments. Uncertainty looms as Fed interest rate cut expectations for 2024 remain ambiguous, leaving Gold buyers in suspense. The dovish sentiment surrounding the Fed’s policy shift strengthened following lackluster data on the Core PCE Price Index, propelling the US Dollar Index to a five-month low. With thin liquidity and cautious trading ahead due to the holiday week, Gold’s trajectory remains vulnerable to intense fluctuations amidst this landscape.
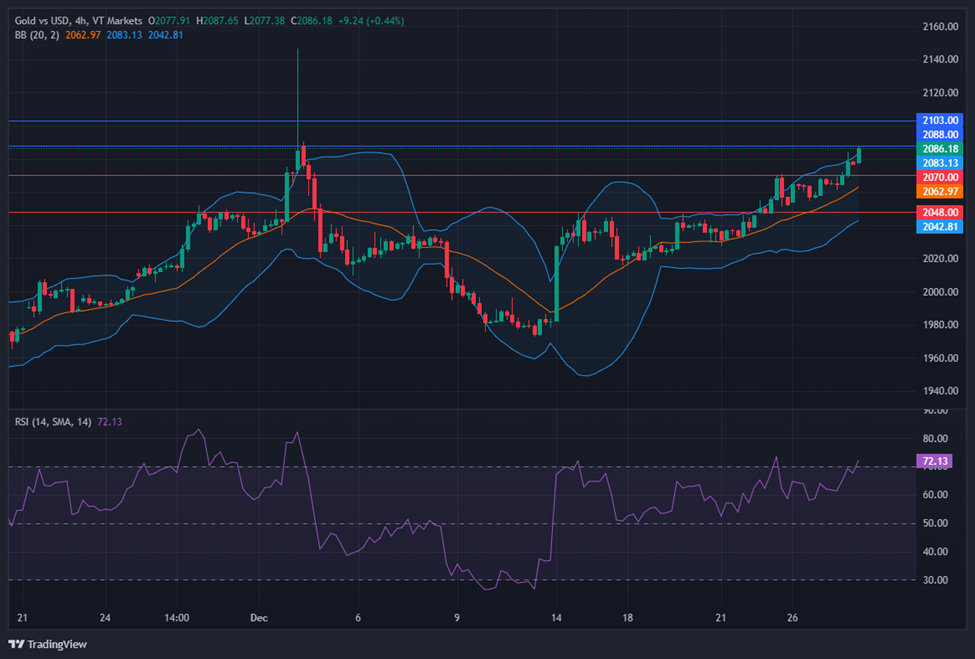
On Wednesday, XAU/USD moved higher and reached the upper band of the Bollinger Bands. Currently, the price moving at the upper band, suggesting a potential upward movement. The Relative Strength Index (RSI) stands at 72, signaling a bullish outlook for this pair.
Take a journey from beginner to expert with our webinar, ‘Basic to Expert: Start Trading Effortlessly.’ We’ll guide you through trading essentials, offering insights and strategies to make your transition smooth. Learn to navigate the markets confidently, turning beginner steps into pro moves.
The markets witnessed a surge as major indices edged closer to historic peaks in the final week of the year. The S&P 500, Nasdaq Composite, and Dow Jones Industrial Average all marked significant gains, with the Nasdaq 100 hitting a new all-time high. Wall Street’s bullish run continued, fueled by optimism stemming from encouraging inflation data aligning with the Federal Reserve’s targets. Meanwhile, the USD/JPY pair saw movement, while the Australian Dollar stood strong against a subdued US Dollar, influenced by potential central bank stances. Furthermore, developments in China’s industrial profits hinted at a slowdown, impacting trade relations and currency movements. In the currency markets, the EUR/USD pair maintained stability, influenced by data-driven decisions by the ECB and prevailing market sentiment, as economic data remained minimal.
Stock Market Updates
Stocks surged at the onset of the final week of the year, propelling major indices closer to historic peaks. The S&P 500 escalated by 0.42% to reach 4,774.75, nearing its all-time high of 4,796.56 from January 2022. Similarly, the Nasdaq Composite surged by 0.54% to settle at 15,074.57, while the Dow Jones Industrial Average gained 159.36 points, closing at 37,545.33, marking a 0.43% increase. The Nasdaq 100 notably climbed by 0.6%, achieving a new all-time high and ending at 16,878.46.
The market’s bullish trajectory persisted as the S&P 500 approached record levels, merely less than 1% away from its previous peak. Wall Street sustained this momentum, with the S&P 500 marking its eighth consecutive weekly advance, the lengthiest streak since 2017, and similar winning streaks observed in the Dow and Nasdaq Composite. Investor optimism soared following encouraging inflation data indicating a closer alignment with the Federal Reserve’s 2% target. Moreover, the anticipation of potential rate cuts in the upcoming year further bolstered equities, contributing to recent weeks’ market upswings.
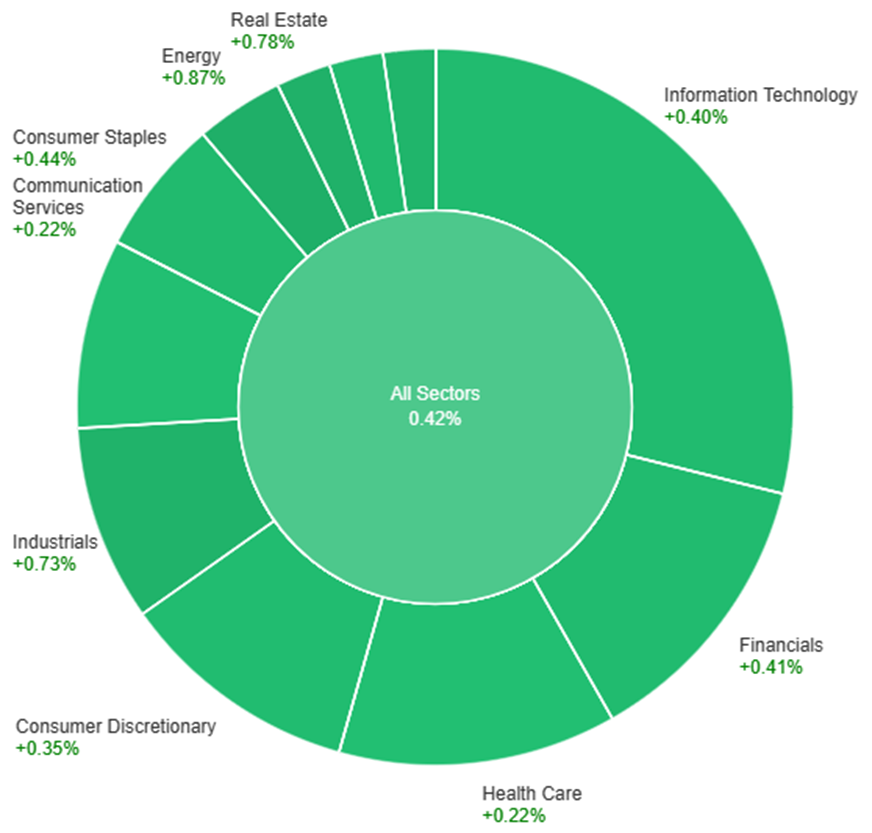
On Tuesday, across various sectors, the market saw a positive trend with a general increase in most sectors. Energy stood out with a notable rise of 0.87%, leading the charge, followed closely by Real Estate at 0.78% and Industrials at 0.73%. Utilities and Materials showed moderate gains at 0.65% and 0.44% respectively, aligning with Consumer Staples also at 0.44%. Financials and Information Technology both saw increases of around 0.4%, while Consumer Discretionary showed a slight uptick of 0.35%. Communication Services and Health Care trailed the pack with a smaller increase of 0.22% each. Overall, the market demonstrated positive momentum, particularly in the Energy and Real Estate sectors on Tuesday.
Currency Market Updates
The USD/JPY pair experienced upward movement, reaching 142.84 after the Bank of Japan’s Summary of Opinions release, with the market showing quiet activity amidst the holiday season’s thin trading. The BoJ hinted at potential policy shifts if the wage-price cycle strengthens but has not finalized the timing for such changes. Meanwhile, in the US, the latest Core PCE figures fell slightly below expectations, signaling a 3.2% YoY growth in November, potentially influencing the Federal Reserve’s future interest rate decisions. Amidst these developments, the currency market awaits the US Richmond Fed Manufacturing Index and Initial Jobless Claims for further insights, but their impact might be limited given the prevailing light trading conditions.
Concurrently, the Australian Dollar stood at a five-month high against a subdued US Dollar, backed by the Australian central bank’s potential hawkish stance in early 2024 due to robust inflation. However, China’s reported decline in Industrial Profits for January to November by 4.4% hints at a slowdown, prompting expectations for additional policy support to bolster the second-largest global economy. This slowdown could impact the RBA’s stance, considering the significance of trade relations between Australia and China. The weakening US Dollar Index, influenced by Fed easing speculations and declining Treasury yields, further highlights the prevailing pressure on the Greenback.
On the EUR/USD front, the pair traded near August’s highest level around 1.1040, encountering minimal losses. The Core PCE figures in the US slightly missed expectations, growing 3.2% YoY, while the Eurozone witnessed a consistent ECB policy stance, with no change in interest rates. The ECB’s data-driven decisions, clarified by President Christine Lagarde, and the slightly more hawkish tone from ECB Vice President Luis de Guindos may contribute to lifting the Euro and maintaining stability for the EUR/USD pair. However, with minimal top-tier economic data expected, market sentiment remains a crucial factor influencing the pair’s movement.
The EUR/USD pair hovers near 1.1037, experiencing marginal setbacks amidst subdued trading conditions. The Federal Reserve’s favored inflation metric, the Core PCE, exhibited a 3.2% year-on-year growth, slightly under the anticipated 3.3%, further affecting the US Dollar’s stance. Conversely, ECB statements from President Christine Lagarde emphasized the bank’s data-dependent approach, dismissing market pressures. Eurozone outlook remained cautiously optimistic, with ECB Vice President Luis de Guindos highlighting a reluctance to alter monetary policy prematurely. As economic calendars lack major data releases, the EUR/USD trend hinges on prevailing market sentiment, potentially swayed by upcoming US Richmond Fed Manufacturing Index and Initial Jobless Claims reports, influencing near-term price movements.
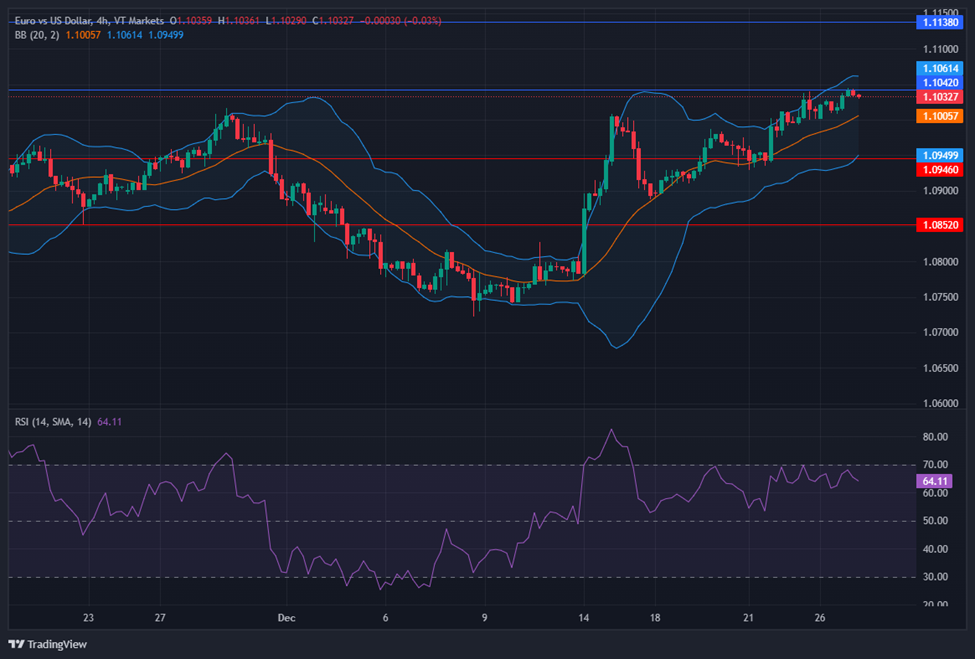
On Tuesday, the EUR/USD moved slightly higher and tried to reach the upper band of the Bollinger Bands. Currently, the price moving slightly below the upper band, suggesting a potential upward movement. Notably, the Relative Strength Index (RSI) maintains its position at 64, signaling a neutral but slightly bullish outlook for this currency pair.
Resistance: 1.1042, 1.1138
Support: 1.0946, 1.0852
XAU/USD (4 Hours)
XAU/USD Holds Steady Above $2,060 Amid Dollar Weakness and Easing Speculations
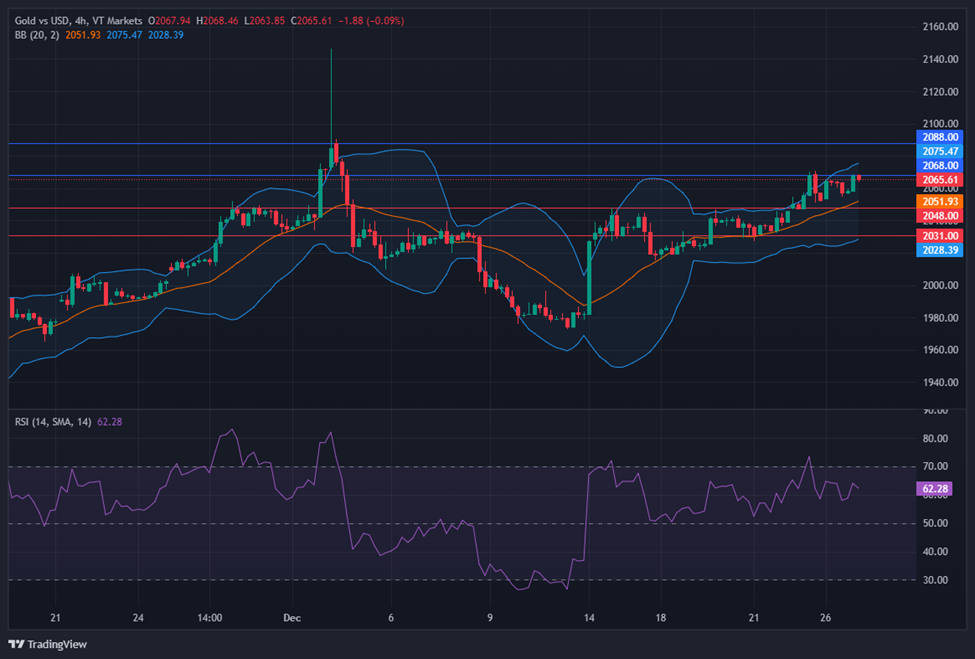
In the early Asian session, Gold (XAU/USD) maintained its position above $2,060 despite a marginal 0.09% dip, set amidst a quiet trading week expected due to light volumes in the final stretch of 2023. The US Dollar weakened against its counterparts, pressing the US Dollar Index (DXY) to its lowest since July near 101.45. As Treasury yields edged lower, resting at 3.89%, expectations of Federal Reserve easing intensified, with the market pricing in potential cuts in January and fully anticipating cuts by March 2024. This dovish stance, alongside recent data showing a softer increase in the Core PCE, has positioned lower interest rates as a potential boon for gold, reducing its opportunity cost as a non-yielding asset. Geopolitical tensions in the Middle East, particularly Yemen’s threat to Red Sea shipping and Iran’s potential actions in the Gibraltar Strait, are adding pressure, potentially elevating gold’s safe-haven appeal. Traders are keenly observing the unfolding geopolitical landscape alongside upcoming economic indicators like the US Richmond Fed Manufacturing Index and Initial Jobless Claims.
On Tuesday, XAU/USD moved slightly higher and tried to reach the upper band of the Bollinger Bands. Currently, the price moving just below the upper band, suggesting a potential upward movement. The Relative Strength Index (RSI) stands at 62, signaling a neutral but slightly bullish outlook for this pair.