Daily Market Analysis

Market Focus

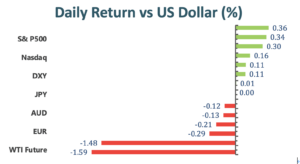
US equities retreated from all-time highs as the spread of delta variants weighed down on risk appetite. The S&P 500 index suffered the most, down 0.86%. Meanwhile, the Nasdaq 100 and Dow Jones Industrial Average index dropped 0.6% and 0.75% respectively. Cyclical sectors such as industrial and material had the worst performance within S&P 500 index on Thursday. The 10-year US treasury yield lost another 3 basis points, settled at 1.294%.

Pfizer Inc. will procced to request US emergency authorization after third dose vaccine data has showed significant improvement in protection against Covid-19. Study report from the company suggests a third dose of its existing vaccine is safe and can raise neutralizing antibody levels by 5 to 10-fold compared with the original vaccine.

The Tokyo Olympics Committee announced domestic spectators will be banned in events held in Tokyo prefecture. The difficult decision was made as Japanese Prime Minister Yoshihide Suga declared another extension of emergency lockdown to August 22. More than half of the 43 Olympic events, including the opening ceremony on July 23, are set to take place in Tokyo.


Main Pairs Movement:

Volatility spiked within the forex space on Thursday amid risk-off mood. The two safe-haven Japanese Yen and Swiss Fran were gaining traction, climbed 0.79% and 1.17% respectively. Recent resurgence in coronavirus cases revived the concerns of economic slowdown in the near term, thus prompted investors to seek protection. This also weighed down on commodity linked currencies such as the Aussie, the Kiwi and the Loonie.

The Euro was another currency that outperformed the US dollar on Thursday. The upbeat move was driven by higher expectation of inflation from the ECB. The central bank raised its inflation goal and signaled inflation can temporarily run above 2% target.

Gold reached as high as $1819, but gains were trimmed during US trading session, ended the day where it started. If equities market continue to decline in the next few days, we may see demand pick up in this precious metal.


Technical Analysis:

XAUUSD (Daily Chart)

After reaching the weekly high at 1818 price level, gold bounces back to 1797 during the American session amid the plummet of the US stock market. From the technical aspect, the short- term trend continues to be upward on the daily chart, re- confirming its bullish move after standing above the 20 simple moving averages around 1796. Moreover, the MACD has leaned positively upward, lending supports to the bulls; at the same time, the RSI has not reached the overbought territory, signalling that there are still rooms for the bullish momentum to move further. On the upside, a break of the current resistance at 1825 will bring gold to challenge 1860 afterward. To the downside, if current support level at 1796 can’t hold, then it will open a bearish path toward 1768.

Resistance: 1825, 1860

Support: 1768, 1733, 1676


EURUSD (4- Hour Chart)

EURUSD holds near 1.1830 after the ECB strategy announcement. From the technical perspective, EURUSD manages to advance above the bearsih trend line and above the 50 simple moving averages, heading north within positive levels. The dominant trend for the pair shifts to bullish even though the momentum is still downside in a bigger outlook. Short term bullish momentum is supported by a positive MACD and the RSI of 51 readings. To the upside, the pair is looking to move toward 1.1919 level; on the other hand, if the current support pivot at 1.1837 can’t hold, falling below the level and the trend line will confirm a reverse from bullish to bearish.

Resistance: 1.1919, 1.1985

Support: 1.1837, 1.1704


GBPUSD (4- Hour Chart)

GBPUSD remains under pressure below 1.3800 amid the dollar’s strength and the pandemic concerns. On the 4- hour time frame, the pound continues to behave weaker against the greenback. Bearish trend dominates as the pair still trades within the descending channel. From the technical indicators, even though the RSI is neutral at this point, the MACD extends its negative move, suggesting that GBPUSD is declining. The bearish momentum will be re- confirmed if the pair drops below 1.3733, where the previous lowest leg and the lower bound of the decending channel. If a break of 1.3733 level happens, then it will open an accelerating path toward the support at 1.3675.

Resistance: 1.38, 1.3926, 1.4007

Support: 1.3675


Economic Data

Currency

Data

Time (GMT + 8)

Forecast

GBP

GDP (MoM)

14:00

N/A

GBP

GDP (YoY)

14:00

N/A

GBP

Manufacturing Production (MoM) (May)

14:00

1.0%

GBP

Monthly GDP 3M/3M Change

14:00

N/A

GBP

BoE Gov Bailey Speaks

18:00

N/A

EUR

ECB President Lagarde Speaks

18:00

N/A

CAD

Employment Change (Jun)

20:30

195K

USD

Fed Monetary Policy Report

23:00

N/A

Daily Market Analysis

Market Focus

Stocks gained to end at records on Wednesday, closing out a choppy session higher after the FOMC’s June meeting minutes signaled a split on the timing for rolling back crisis-era monetary policies. The S&P 500 and Nasdaq (+0.01%, or +1.42) ticked up to reach record intraday and closing highs, led by a resurgence in growth and technology names. The Dow also rose for about 0.30%, or 104.42.

一張含有 文字 的圖片

自動產生的描述

Biden set a goal for 70% of American adults to get at least one Covid-19 shot by July 4, a symbolic nod to Independence Day. Despite ample vaccine supplies, he missed that target, largely because the government has struggled to give away shots in rural, deeply conservative regions.

Now the delta variant is spreading. While it’s been found across the U.S., hotspots are erupting in less-vaccinated areas, like southern Missouri. As of June 27, for the first time since the U.S. started administering shots, the rate of Covid-19 hospitalizations in less-vaccinated places exceeded the rate in places with the highest proportions of inoculated people. 

The main concern about the vaccines is their side effect, to who refused to take. Southern Missouri is nowhere near Biden’s goal of 70% of adults with at least one shot, and even if it was, it might not be enough to stop delta, said Steve Edwards, president and chief executive of CoxHealth, which operates six hospitals in the region.


Main Pairs Movement:

The dollar index closed in the green Wednesday but retreated part of its gains ahead of the close due to the dull FOMC Minutes. The document showed that Fed officials consider the standard of “substantial further progress” needed to adjust monetary policy hasn’t yet been met, added that various FOMC members judged the risks to their inflation projections were tilted to the upside. In general, the document didn’t offer any fresh insights regarding the timing of tapering but showed that some policymakers saw the uncertainty around the economic outlook elevated after the latest data.

The euro pair settled at 1.1790 amid the lower-than-expected Germany industrial data. Loonie stretched further north, trading at 1.2488 as of writing. The antipodean pairs headed to the different directions as Aussie dropped to the 0.748 level, while Kiwi managed to close with mild gains at 0.7015.

Cable ended the day with a slight uplift while the UK reported over 32k new coronavirus cases, the biggest one-day increase since late January. However, the number of those falling into critical conditions or dying is low, reflecting the effectiveness of the immunization campaigns. There is no news so far suggesting restrictive measures will maintain after July 19.

US 10-year Treasury yields remained under selling pressure, hitting an intraday low of 1.29%. Gold prices are up for a sixth consecutive day, with the bright metal trading at around $1,804.00 a troy ounce as the US session came to an end. Crude oil prices came under strong selling pressure on Wednesday, with the US benchmark hitting a fresh two-week low of $71.05 a barrel, its lowest since mid-June. WTI recovered ahead of the close and settled at $72.00. Brent trades at $73.24 at the moment.


Technical Analysis:

XAUUSD (Daily Chart)

一張含有 文字, 螢幕擷取畫面 的圖片

自動產生的描述

Gold hovers around 1800 level ahead of the FOMC meeting’s minutes and falling Treasury yields. From the technical aspect, the dominant momentum looks to shift to the bulls in the near- term as the consecutive days of positive moves have formed an uptrend. Moreover, a successful break of the resisatance at 1802 and the midline of the bollinger band give gold some hope for the bulls. Even though gold still trades below the 50 simple moving averages, there are some potential for gold to continue moving upward amid a postive MACD and a neutral reading of RSI. In order to re- confirm gold’s bullish momentum, gold needs to break the next immediate resistance at 1829.14.

Resistance: 1829.14, 1876.18

Support: 1802, 1771.95, 1676.89


EURUSD (4- Hour Chart)

EURUSD tumbles around 1.1800, the lowest level since April ahead of the FOMC Meeting. From the technical perspective, after failing to hurdle the resistance level at 1.1837 during the European session, the dominant outlook of EURUSD looks bearish on the 4- hour chart. Additionally, the downside is also supported by the negative MACD while the pair trades well below the 20 and the 50 simple moving averages. The pair is expected to continue extending further south toward 1.1704; however, it might consolidate a bit before the decline as the RSI reading is nearly oversold.

Resistance: 1.1837, 1.1919, 1.1985

Support: 1.1704


GBPUSD (4- Hour Chart)

GBPUSD advances modestly, making little progress as an immediate reaction to the FOMC Meeting. On the 4- hour chart, GBPUSD clings above 1.3800 level during the American session. The near- term outlook looks to turn positive because the pair has breached the descending trend line, signaling a reverse from bearish to bullish. The bullish momentum will confirm if the pair can eventually trade above the 20 simple moving averages and the midline of the bollinger band. As the time of writing, the technical indicators, both the MACD and the RSI, seem to lack of directional strength as they are both in the neutral position.

Resistance: 1.3926, 1.4007

Support: 1.38, 1.3675


Economic Data

Currency

Data

Time (GMT + 8)

Forecast

USD

FOMC Meeting Minutes

02:00

N/A

EUR

ECB Monetary Policy Statement

19:30

N/A

USD

Initial Jobless Claims

20:30

350 K

USD

Crude Oil Inventories

23:00

-4.033 M

Daily Market Analysis

Market Focus

US equities declined as low 10-year Treasury yield weighed down on risk-sentiment. The S&P 500 and Dow Jones Industrial Average index fell 0.2% and 0.6% respectively. Meanwhile, the tech heavy Nasdaq index closed at another record high, climbed 0.4%. The 10-year Treasury yield dropped to lowest point since February, traded at 1.351%. Sarah Hunt, a money manager at Alpine Woods, commented that 10-year yield below 1.45% had people worried about a potential economic slowdown.

Investors are growing concerns of where oil price will go after OPEC+ abandoned their Monday meeting. The two big players Saudi Arabia and the UAE had dispute over an extension of output agreement to 2022. The immediate consequence of the collapse in talks is that output hike expected for August won’t take place, leaving the fuel market short of barrels. However, over the medium term, current six-year high oil price at mid-$70s may prompt oil-rich nations to pump more.

Reserve Bank of Australia kept benchmark rate unchanged on Tuesday, and here is Bloomberg’s key takeaway from RBA’s monetary statement:

• The central bank announced a pared-back extension of its QE program and expects interest rates at record low for at least another two-and-a-half years.

• Purchase of longer-dated securities is lowered from A$5 billion a week to A$4 billion a week to at least mid-November.

• RBA will not increase the cash rate until actual inflation is sustainably within the 2% to 3% target range.


Main Pairs Movement:

Aussie and Kiwi advanced as much as 0.92% and 1.14% respectively prior to US session, but all the gains were pared and both pairs closed in the red. Other G-7 currencies followed a similar path except the Japanese Yen. Tuesday’s rise in dollar greenback was somewhat peculiar given a big miss in June’s ISM Non-Manufacturing PMI, printed 60.1 compared to anticipated 63.5, and was declined from May’s 64. Perhaps speculators are positioning for a more hawkish FOMC meeting minutes for June, which may justify why Gold fell sharply from $1815 to $1790, and the 10-year Treasury yield lost 7 basis points as US session kicks in.

UK Prime Minister Borris Johnson announced on Monday that the government will proceed with the final stage of easing lockdown restrictions on July 19th. The government is aware of potential pick up in infections after fully reopened, but is also confident that NHS will be able to handle the situation than before. This may mitigate some downside risk for the Sterling if dollar were to strengthen on Wednesday’s FOMC meeting minutes.


Technical Analysis:

XAUUSD (Daily Chart)

一張含有 文字, 監視器, 螢幕擷取畫面, 螢幕 的圖片

自動產生的描述

After jumping to fresh three weeks highs at 1810 level, gold pullbacks during the American trading session. On the daily chart, gold remains downside as it continues trading below the 50 simple moving averages and the descending trend line. Despite of showing some bullish hope on the intraday bias, today’s bounce back from the midline of bollinger band seems to discourage the bulls. From the technical indicator, the MACD has slightly turned back to negative, suggesting that the bears might show some potential at this point. At the same time, the RSI has not reached the oversold territory, giving the bears rooms to move further.

Resistance: 1829.14, 1876.18

Support: 1771.95, 1676.89


EURUSD (4- Hour Chart)

EURUSD declines near 1.1800 level as the US indexes are sharply lower, suggesting the demand for the greenback. From the technical aspect, the intraday bias turns bearish because the pair has tackled the 20 and the 50 simple moving averages. In addition, the break of the support level at 1.1837 gives the pair some potential to the downsie testing the next support at 1.1704. The dominant trend is bearish as the MACD has turned negative whilist the RSI has not reached the oversold territory, providing bears rooms to extend further south.

Resistance: 1.1837, 1.1919, 1.1985

Support: 1.1704


GBPUSD (4- Hour Chart)

GBPUSD suffers downside pressure toward 1.3780 amid some legal action against Brexit and the decline of the US bond yields. From the technical perspective, the dominant trend turns to the downside on the 4- hour chart as the pair falls below the 20 SMA and below the support level at 1.38. Moreover, previous short- term bullish momentum has been diminished as the pair bounces back to the descending trend line. The bears are supported by the negative MACD and at the same time the RSI of 43 suggests that the bearish momentum still have potential to continue, heading toward the next support at 1.3675.

Resistance: 1.38, 1.3926, 1.4007

Support: 1.3675


Economic Data

Currency

Data

Time (GMT + 8)

Forecast

USD

JOLTs Job Openings (May)

22:00

9.388 m

CAD

Ivey PMI (Jun)

22:00

N/A

VT Markets The Adjustment Of Weekly Dividend Notification

Dear Client,

Warmly reminds you that the component stocks in the stock index spot generate dividends. When dividends are distributed, VT Markets will make dividends and deductions for the clients who hold the trading products after the close of the day before the ex-dividend date.

Indices dividends will not be paid/charged as an inclusion along with the swap component. It will be executed separately through a balance statement directly to your trading account, the comment for which will be in the following format “Div & Product Name & Net Volume ” .

Please note the specific adjustments as follows:

If you’d like more information, please don’t hesitate to contact [email protected].

Daily Market Analysis

Market Focus

US equities advanced forward as upbeat job report ease concerns of an early Fed tapering. The S&P 500 and the Nasdaq index both made record high, climbed 0.75% and 1.15% respectively. The S&P 500 had a seven-days winning streak, and marked the longest rally since last August. Technology and Consumer Discretionary shares gained the most within the S&P 500, whereas Financials fell slightly behind. The 10-year Treasury yield dropped 3 basis points to 1.429%.

Friday’s US job report was a Goldilocks scenario for stocks market. The Non-farm payroll number printed 850,000 compared to consensus’s 700,000, good enough to signal a healthy recovery in labor market. However, the Unemployment rate, a top priority of Federal Reserve, dropped 0.1% from May’s 5.8%, suggesting the Fed is still distance away from full employment, thus unlikely to pull liquidity away from the financial market in the near term.

Talks between oil-rich nations are stuck. Saudi Arabia along with other OPEC+ members proposed an increase production over the coming months and extend a broader agreement in output until the end of 2022 for the sake of stability. However, UAE opposed to such extension, and demanded better deal for itself for 2022. The UAE asked for 3.8 million barrels a day under an extension, the current level is set at about 3.2 million barrels a day. According to Bloomberg, Saudi Arabia and Russia have rejected re-calculating the output target for UAE, fearing that everyone else would ask for the same treatment. Negotiation is scheduled to resume on Monday.


Main Pairs Movement:

Non-US currencies recovered part of their losses against the dollar upon Friday’s job report. The decline in unemployment rate in United States will help to moderate recent dollar strengths, but it provides little incentive to shift from a bullish dollar as its economic recovery remains robust. Moreover, the structural resistance line in the dollar index also contributed to a pullback, reached highest point of 92.63 since April.

Gold rebounded from $1760 support line to $1795 during a three-day rally. The precious metal has been rejected from $1795 since June 18th, indicating the upward momentum lacks follow up buys. We expect a continuation to the downside given the fading demand for inflation hedging, as well as an absence of any major risk events.

Oil prices may recede from multi-year high if Saudi Arabia and its allies can’t seal a deal with the UAE on Monday. The Canadian dollar could also be impacted given its large exposure to the oil export, thus USDCAD could shoot up significantly under strong dollar and possible oil retreat.


Technical Analysis:

USDJPY (4- Hour Chart)

After rising to the highest since last year, USDJPY weakens desipte of NFP surpasses expectations. From the technical perspective, USDJPY meets a tough resistance level at 111.65; however, the bias remains bullish as the pair continues to trade within the ascending channel, at the same time, the pair trades well above the 20 and the 50 simple moving averages. Today’s retreat can be seen as an adjustment for the pair since the RSI reading was above the 70, the overbought territory on the 4- hour chart. As the time of writing, the RSI has dropped below 70, signaling that the gain might be triggered again, heading to test the resistance at 111.65.

Resistance: 111.65

Support: 110.92, 110.475, 110.10


EURUSD (4- Hour Chart)

EURUSD hovers below 1.1850 after the release of the better than expected US Nonfarm Payrolls. On the 4- hour chart, EURUSD continues suffering from downside momentum, trading below the 20 and the 50 SMAs. The pair settles below the resistance level at 1.18615. To the downside, if the pair fails to bounce back, trading above 1.1837, then the pair will move towards the next major support at 1.1704, the lowest since April. On the upside, in case the attempt to trade stably above 1.1837, the pair will head towards the psychological resistance at 1.1900 and 1.1919.

Resistance: 1.1837, 1.1704

Support: 1.1919, 1.1985


GBPUSD (4- Hour Chart)

GBPUSD bounces above 1.3800 amid the Delta virus variant worries. After falling below the support level at 1.3793 on the previous day, GBPUSD retreats above the level today as the time of writing. However, the outlook bias remains downside as the pair continues trading below the 20 and the 50 simple moving averages; at the same time, the pair continues trading near the descending trend line. All in all, the bearish momentum is still in control. To the upside, the pair will have a chance to turn bullish on the 4- hour chart if a break of 1.4007 is successful, where the 100 SMA is. The RSI is currently outside of the overbought territory, giving the pair rooms to extend further north.

Resistance: 1.4007

Support: 1.3793, 1.3675


Economic Data

Currency

Data

Time (GMT + 8)

Forecast

AUD

Retail Sales (MoM) (May)

09:30

0.1%

GBP

Composite PMI (Jun)

16:30

61.7

GBP

Services PMI (Jun)

16:30

61.7

VT Markets July futures rollover announcement

Dear Client,

New contracts will automatically rolled-over as follows:

Please note:

• The rollover will be automatic, and any existing open positions will remain open.

• Positions that are open on the expiration date will be adjusted via a rollover charge or credit to reflect the price difference between the expiring and new contracts.

• To avoid CFD rollovers, clients can choose to close any open CFD positions prior to the expiration date.

• Clients should ensure that take profits and stop losses are adjusted before this rollover occurs.

If you have any questions, our team will be happy to answer your questions.Please mail to [email protected] or contact the service online.

VT Markets Notification of Server Upgrade

Dear Client,

As part of our commitment to providing the best reliability and service to our customers, we are planning an upgrade in our server on July 3th 2021.

As a result, we will be conduct maintenance according to the schedule below.
Start date and time: 2021-07-03 18:00 GMT+3(Server time)
End date and time: 2021-07-03 22:00 GMT+3(Server time)

The impact can only make customers be unable to log in to the MT4 /MT5 software temporarily, and that won’t affect any order which has been opened.

After the upgrade, clients can login to MT4/ MT5 software using the server which is shown in the account activation mail.

No action is required by our customers. Your services will come back online at the end of the maintenance.

Thank you for your patience and understanding with regard to this important initiative.

If you have any questions, our team will be happy to answer your questions.Please mail to [email protected] or contact the service online.

Daily Market Analysis

Market Focus

All three major US stock indexes ended the session in positive territory. The Dow Jones Industrial Average added 131.02 points, or 0.38%, to 34,633.53, the S&P 500 put on 22.44 points, or 0.52%, to 4,319.94 and the Nasdaq Composite added 18.42 points, or 0.13%, to 14,522.38.

一張含有 文字 的圖片

自動產生的描述

Earlier on Thursday, the Organization of Petroleum Exporting Countries and its allies appeared to have an agreement in principle to boost output by 400,000 barrels a day each month from August to December. It would also have extended the duration of the broader OPEC+ accord, setting the final expiry of the cuts in December 2022 instead of April.

That preliminary agreement was upended by the United Arab Emirates, which said it will block the deal until the baseline for its own cuts is adjusted, effectively raising its production quota, delegates said.

“Any request to adjust the production quota would be like opening Pandora’s box,” said Giovanni Staunovo, a commodity analyst at UBS Group AG. That could add up to a production increase of about 700,000 barrels a day for the UAE alone, and “other OPEC+ states might also request an adjustment.”

The standoff between the United Arab Emirates and the rest of the cartel could ultimately mean that OPEC+ won’t increase production at all, according to a delegate. Without a deal it would fall back on existing terms that call for output to remain unchanged until April 2022. That would squeeze an already tight market, risking an inflationary price spike.

The dramatic turn of events leaves the market in limbo — just as inflationary pressures are fixating investors with oil above $75. It also tarnishes the cartel’s carefully reconstructed reputation, raising the specter of the destructive Saudi-Russia price war of last year.

图表

描述已自动生成


Main Pairs Movement:

The US dollar has started the month on a solid footing after closing June with a total 2.81% gain, being the best month in four and a half years. On Thursday, ahead of the highly anticipated Nonfarm Payrolls report, the dollar hit three-month highs but traded within narrow ranges as traders get set for more clues on whether the Federal Reserve will start to reduce monetary stimulus sooner rather than later. The U.S. dollar index rose to 92.601, the highest since early April.

The euro pair fell to 1.1837 as a fresh low amid upbeat domestic data, which Eurostat announcing that the Unemployment Rate declined to 7.9% in May, compared to analysts’ estimate of 8%. Additionally, Markit Manufacturing PMI edged higher to 63.4 in June and surpassed the market expectation of 63.1.

Sterling dropped on Thursday after Bank of England Governor Andrew Bailey warned against over-reaction to rising inflation in Britain. Cable slipped in morning trading to $1.3752, its lowest level since April.

Both antipodean pairs breached their critical support line and now trading at worse prices. NZD/USD dived below 0.7000, while AUD/USD violated the 0.7500 support line and trades at 0.7470 as of writing; the loonie pair ended the day at 1.2430.

Gold priced higher despite yet another surge in the US dollar, sitting at $1,776.30 in the close; Crude oil price headed to the north supported by demand optimism and increased output. WTI was at $75.00 and higher by 2.06% at the end of the day, while Brent bounced off the yearly high at $76.71 and closed with a modest gain at $75.58.

For the day ahead, it is all about the highly anticipated US Nonfarm Payrolls.


Technical Analysis:

USDJPY (4- Hour Chart)

USDJPY advances further north and stands above 111.00 yardstick ahead of Friday’s US Nonfarm Payrolls data. From the technical aspect, the break of previous day’s resistance at 111.12 confirms USDJPY’s bullish outlook on the 4- hour chart. At the moment, further upside move remains optimistic on the cards amidst the current atmosphere. The pair has traded to the highest level since March in 2020. The MACD signals that the pair is on the way to sustain its positive move; however, the pair might face an adjustment before heading toward the next immediate hurdle at 111.63 as the RSI reading is above 70, in the overbought territory.

Resistance: 111.63

Support: 110.91, 110.46, 110.10


EURUSD (4- Hour Chart)

EURUSD hovers around its support level at 1.1837 amid US mixed economic data today whith an upbeat US jobless claims and worst- than- estimate ISM Manufacturing PMI. From the technical viewpoint, EURUSD pauses its decending momentum, bouncing off the lows in order to push the RSI away from the 30 levels, the oversold condition on the 4- hour chart; however, the downside momentum of the pair does not end in the outlook since pushing the RSI above 30 will allow for more falls afterward. Moreover, momentum remains downside due to the pair continues to trade below the 50, 100, and 200 SMAs. To the downside, if the fall resumes, then it is expected to the pair head toward the next support at 1.1704, the lowest level since March.

Resistance: 1.1919, 1.1985, 1.2052

Support: 1.1837, 1.1704


GBPUSD (4- Hour Chart)

GBPUSD tumbles to fresh monthly lows under 1.3770 level during the American session after the comments from BOE’s Andrew Bailey. From the technical perspective, earlier break of the support at 1.3793 has re- confirmed GBPUSD’s bearish trend, which signals that downside momentum remains robust on the 4- hour chart. It is expected to see the pair to continue descending as the RSI is well above 30 readings, outside of the oversold territory, giving the pair rooms to extend further south. In the meantime, remaining to trade below the 50, 100, and 200 SMAs also suggests that the pair is under pressured. To the downside, the pair is expected to head toward its next support level at 1.3675, the lowest point since March.

Resistance: 1.3793, 1.4007

Support: 1.3675


Economic Data

Currency

Data

Time (GMT + 8)

Forecast

GBP

BoE Gov Bailey Speaks

03:00

N/A

USD

Nonfarm Payrolls (Jun)

20:30

700k

USD

Unemployment Rate (Jun)

20:30

5.7%

EUR

ECB President Lagarde Speaks

20:30

N/A

Daily Market Analysis

Market Focus

Stocks were mixed on Wednesday, with the S&P 500 gaining for a fifth straight session to end the day at yet another record closing high. Dow Jones surged 0.61% to 34502, but Nasdaq declined 0.17% due to the poor performance of its main components. Look back on the first half of 2021, S&P 500 has increased by about 14.4%, Nasdaq by 12.5%, and Dow Jones by 12.7%.

一張含有 文字 的圖片

自動產生的描述

Some of the biggest names in the hedge fund industry are wading deeper into crypto. Steve Cohen’s Point72 Asset Management is seeking to hire a head of cryptocurrencies, while the family office of billionaire George Soros has started trading Bitcoin, according to people familiar with the matter. Spokespeople for the firms declined to comment.

The moves, which were both reported earlier by the TheStreet.com, come as a growing number of marquee hedge funds have begun to dabble in digital assets. Point72 rival Millennium Management has been active in crypto-related futures and exchange-traded funds, while Brevan Howard Asset Management and macro trader Paul Tudor Jones have begun investing in crypto. In March, hedge fund manager Dan Loeb said he was doing a “deep dive” into crypto.

“We are exploring opportunities around blockchain technology and its transformative and disruptive capabilities,” Point72 said in a May letter to investors seen by Bloomberg. “We would be remiss to ignore a now $2 trillion crypto currency market.”

In a March interview with Bloomberg Television’s Erik Schatzker, Dawn Fitzpatrick, who oversees Soros Fund Management, said that Bitcoin was interesting and that the firm had been making investments into crypto infrastructure, such as exchanges, asset managers and custodians.

“There’s a real fear of debasing fiat currencies” that’s driving demand for crypto, Fitzpatrick said in the interview. “Bitcoin, I don’t think it’s a currency — I think it’s a commodity” that is easily stored and transferable, with a finite supply. She declined to say whether she owned any Bitcoin.


Main Pairs Movement:

The US dollar index appreciated to the highest level yet since it took off from 90.441 following the Federal Reserve’s surprise hawkish hold on 16 June. Printing a high of 92.448, DXY traded at its best level since 8 April earlier this year.

A mix of strong US data, delta covid flows, hawkish Fed speakers, and anticipation of a healthy Nonfarm Payrolls report on Friday helped the greenback maintain its strong narrative in financial markets on Wednesday. Fed’s Robert Kaplan reaffirmed his hawkish stance and said, ”I’d want to taper sooner than the end of the year.”

The euro pair extended its losses sub-1.1900 to test the June lows in the 1.1840 price zone. Aussie fell further to break the 0.7500 level to score a fresh low of 0.7492, while the loonie pair continued to test bearish commitments through 1.2400 again in the New York session to print a high of 1.2421, recovering from the London sell-off.

Cable settled around 1.3830 and remains undermined by Brexit jitters related to the Northern Ireland Protocol. Sterling is also facing uncertainty over the spread of the Delta variant of COVID-19 in the UK. Earlier this month forced the government to delay full reopening.

Gold recovered from the fresh two-month lows in the $1,750s and tallied a gain of over 0.5% on the day, printing a high of $1,774.45 before ending by the closing bell near $1,770. WTI crude oil price rose from near the day’s lows of $72.84 on a big draw on US inventories ahead of the highly anticipated OPEC+ meeting with a spot near to $73.51 by the close of play on Wall Street. Meanwhile, Brent’s price moved roughly along with the WTI’s, closed the day at $74.64.


Technical Analysis:

USDJPY (4- Hour Chart)

一張含有 文字, 監視器, 螢幕擷取畫面 的圖片

自動產生的描述

USDJPY climbs to daily highs above 110.70 level during the American session amid better- than- expected ADP data. After spending the majority of the week in a narrow range, the pair regains traction today, reaching as high as 111.09 as the time of writing. On the 4- hour chart, the intraday bias turns bullish as the pair trades within the ascending channel and it has reached the top of the ascending trend line, signalling that a bullish momentum has been resumed. Additionally, the pair has officially traded above the 20 and the 50 simple moving averages, suggesting a bullish mode. From the technical indicator, the RSI has not reached the overbought territory, meaning that the pair still has rooms to extend further north before an adjustment. To the upside, if the pair ends up breaching its resistance of 111.12, then it will open up an acelerated path for bulls.

Resistance: 111.12

Support: 110.51, 110.14, 109.84


EURUSD (4- Hour Chart)

EURUSD declines below 1.1900 after the US ADP jobs figures have come with 692K, beating the estimates. From the technical aspect, EURUSD remains bearish, attempting to contest its current resistance at 1.1837 as the time of writing. A successful break of the resistance at 1.1837 will lead the pair to the next level at 1.1704, which is the lowest since April. On the support side, if the pair can sustain and settle above 1.1837, it will give a chance to move toward 1.1919. In the short- run, bears are expected to pause a bit as the RSI reading has reached below 30, an oversold territory, which gives the pair an opportunity to bounce back. However, in a bigger outlook, the pair remains under pressured.

Resistance: 1.1919, 1.1985, 1.2052

Support: 1.1837, 1.1704


GBPUSD (4- Hour Chart)

GBPUSD slides toward 1.3800 level as the US dollar edges higher on US upbeat ADP data. From the technical perspective, the intraday bias of the pair remains bearish as it trades well below the 50 and 100 simple moving averages. The RSI has not yet reached the oversold territory, giving bears more rooms to decline further and heading toward its immediate support of 1.3787. To the downside, a successful test of the support at 1.3787 will open the path to the next support at11111. On the upside, if the pair can recover above 1.3896, then it will head to challenge the nexxt resistance at 1.3963 and 1.4017.

Resistance: 1.3896, 1.3963, 1.4017, 1.4072

Support: 1.3787


Economic Data

Currency

Data

Time (GMT + 8)

Forecast

JPY

Tankan Large Manufacturers Index (Q2)

07:50

15

JPY

Tankan Large Non-Manufacturers Index (Q2)

07:50

3

CNY

Caixin Manufacturing PMI (Jun)

09:45

51.8

EUR

German Manufacturing PMI (Jun)

15:55

64.9

GBP

Manufacturing PMI (Jun)

16:30

64.2

USD

Initial Jobless Claims

20:30

390K

USD

ISM Manufacturing PMI (Jun)

22:00

61

Daily Market Analysis

Market Focus

The three major indexes traded mixed Tuesday afternoon after gaining earlier in the day, with traders looking for fresh catalysts to rally beyond current record levels. The information technology and consumer discretionary sectors outperformed in the S&P 500. The tech-led session kept the Nasdaq in slightly positive territory (+0.19%). Dow Jones was little changed (+0.03%) as more than 1% drops in shares of Intel, Disney and Boeing offset gains in other components including Nike, Home Depot and Apple.

一張含有 文字 的圖片

自動產生的描述

A divided U.S. Supreme Court refused to lift the federal moratorium on evictions during the Covid-19 outbreak, leaving the ban in place until the end of July.

Voting 5-4, the justices rejected calls by landlords and real-estate trade associations from Alabama and Georgia to block the moratorium while their challenge goes forward. They contend the Centers for Disease Control and Prevention exceeded its authority by imposing the spread of the coronavirus.

Chief Justice John Roberts and Justice Brett Kavanaugh joined the court’s three liberals in the majority. Kavanaugh said he was doing so because the moratorium is set to expire on July 31.

The ban applies to tenants who, if evicted, would have “no other available housing options.” The CDC and President Joe Biden’s administration say the moratorium is geared toward protecting tenants who would be forced to live in close quarters elsewhere or become homeless and dependent on shelters.


Main Pairs Movement:

The greenback appreciated against most major rivals as the dollar index reached a five-day high above 92.00, especially against high-yielding currencies. There was no obvious catalyst for the gains as the greenback actually retreated in the final trading session of the day, despite better than anticipated US data.

The euro pair hovered below 1.1900, awaiting the upcoming inflation figures; cable settled around 1.3840, undermined by Brexit jitters related to the Northern Ireland Protocol. Aussie fell toward the 0.7500 level, while the loonie pair flirts with 1.2400. The American currency strength and the modest performance of Wall Street weighed on commodity-linked currencies.

Gold plummeted to a fresh two-month low of $1,750.60 a troy ounce, bouncing ahead of the close to $1,761. Crude oil prices were mixed, as WTI surged around 1%, settling at $73.40 a barrel, and Brent almost declined for another day, closing with a tiny gain at $74.63.

“Unemployment rate would have to drop fairly substantially, or inflation would have to stay high, to have a 2022 rate hike,” Fed Governor Christopher Waller said on Tuesday’s Bloomberg TV Interview. “If you think you may need to raise rates by end-2022 or early 2023, you need to get tapering done before then.”

Though Fed’s Waller add to the market’s anxiety over inflation and rate-hike, major pairs still trade at familiar levels, seemingly unaffected by the press time. The reason could be traced from the cautious sentiment ahead of the day’s key data, namely China PMI and US ADP Employment Change.


Technical Analysis:

USDJPY (4- Hour Chart)

一張含有 文字 的圖片

自動產生的描述

USDJPY loses its traction around 110.5 level during the American session. Even though the pair still trades within the overall ascending trend, it stages a technical correction. Similar to the previous day, USDJPY remains neutral for its intraday bias. Further rally will resume with its resistance of 111.12 intact. On the downside, break of 110.51 will turn the pair’s bias back to the downside for 110.14, turning the pair to bearish as it will breach the ascending trend line. From the technical indicator’s view of point, the pair is bearish in the near- term as the MACD is turning down, lending supports to bears; the RSI is neutral, lacking directional strength as of now.

Resistance: 111.12

Support: 110.51, 110.14, 109.84


EURUSD (4- Hour Chart)

EURUSD remains pressured under 1.1900 level as the greenback gains strength. From the technical aspect, EURUSD is poised to extend its decline, heading toward its support of 1.1837. On the 4- hour chart, the outlook of the pair is bearish as it trades below the 20 simple moving average as well as the 50 SMA, stating that the pair is under pressured. At the same time, the downside pressure is also supported by the negative MACD. If the pair falls below the previous low on the 22nd of June, then it will accelerate its slide within negative level, favoring a chanllege against 1.1837.

Resistance: 1.1919, 1.1985, 1.2052

Support: 1.1837, 1.1704


GBPUSD (4- Hour Chart)

GBPUSD slips below 1.3850, reaching the weekly low as the greenback gains ground across the board. On the 4- hour chart, GBPUSD remains bearish as it has been unable to recapture the 20 and the 50 SMAs, experiencing the downside momentum. Additionally, the RSI is currently above the 30 readings, thus far from oversold conditions, allowing the pair for more declines; the MACD sustains its negative mode, lending supports to bears. As the time of writing, GBPUSD is expected to extend its fall toward its next support of 1.3787 in the near- term.

Resistance: 1.3896, 1.3963, 1.4017, 1.4072

Support: 1.3787


Economic Data

Currency

Data

Time (GMT + 8)

Forecast

CNY

Manufacturing PMI (Jun)

09:00

50.8

GBP

GDP (QoQ) (Q1)

14:00

-1.5%

GBP

GDP (YoY) (Q1)

14:00

-6.1%

EUR

German Unemployment Change (Jun)

15:55

-20k

EUR

CPI (YoY) (Jun)

17:00

1.9%

USD

ADP Nonfarm Employment Change (Jun)

20:15

600k

CAD

GDP (MoM) (Apr)

20:30

-0.8%

USD

Pending Home Sales (MoM) (May)

22:00

-0.8%

USD

Crude Oil Inventories

22:30

-4.686m

Back To Top
server

Hello there 👋

How can I help you?

Chat with our team instantly

Live Chat

Start a live conversation through...

  • Telegram
    hold On hold
  • Coming Soon...

Hello there 👋

How can I help you?

telegram

Scan the QR code with your smartphone to start a chat with us, or click here.

Don’t have the Telegram App or Desktop installed? Use Web Telegram instead.

QR code