Daily Market Analysis
Market Focus
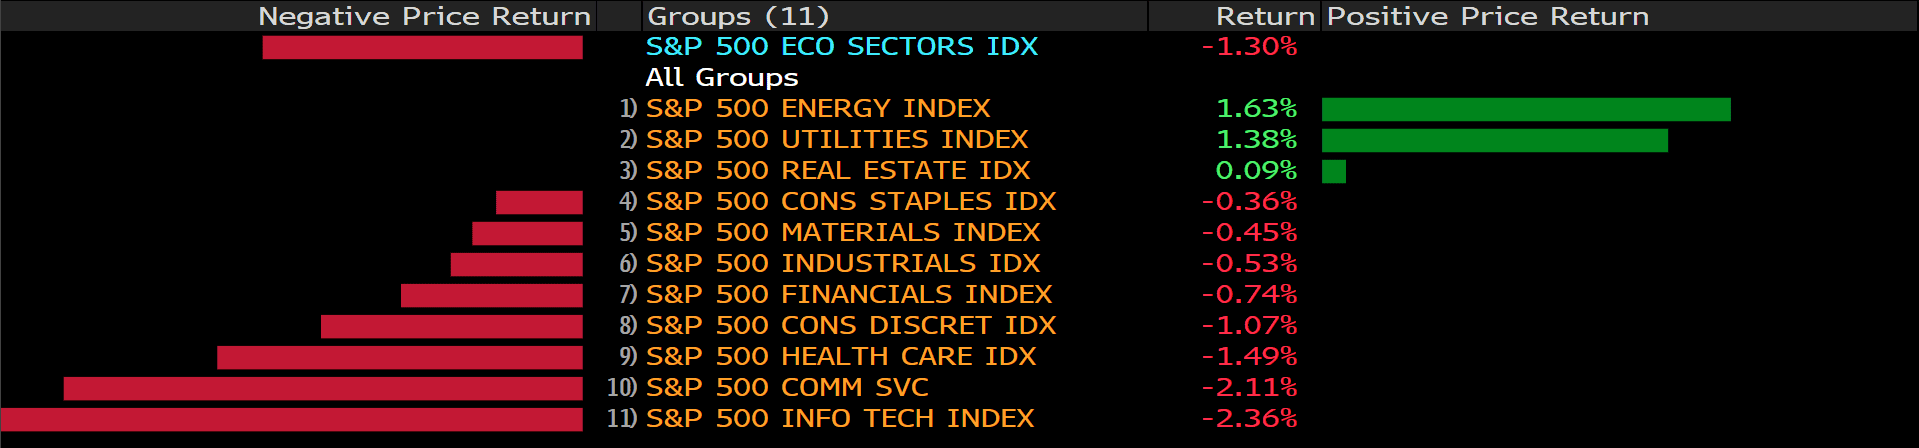
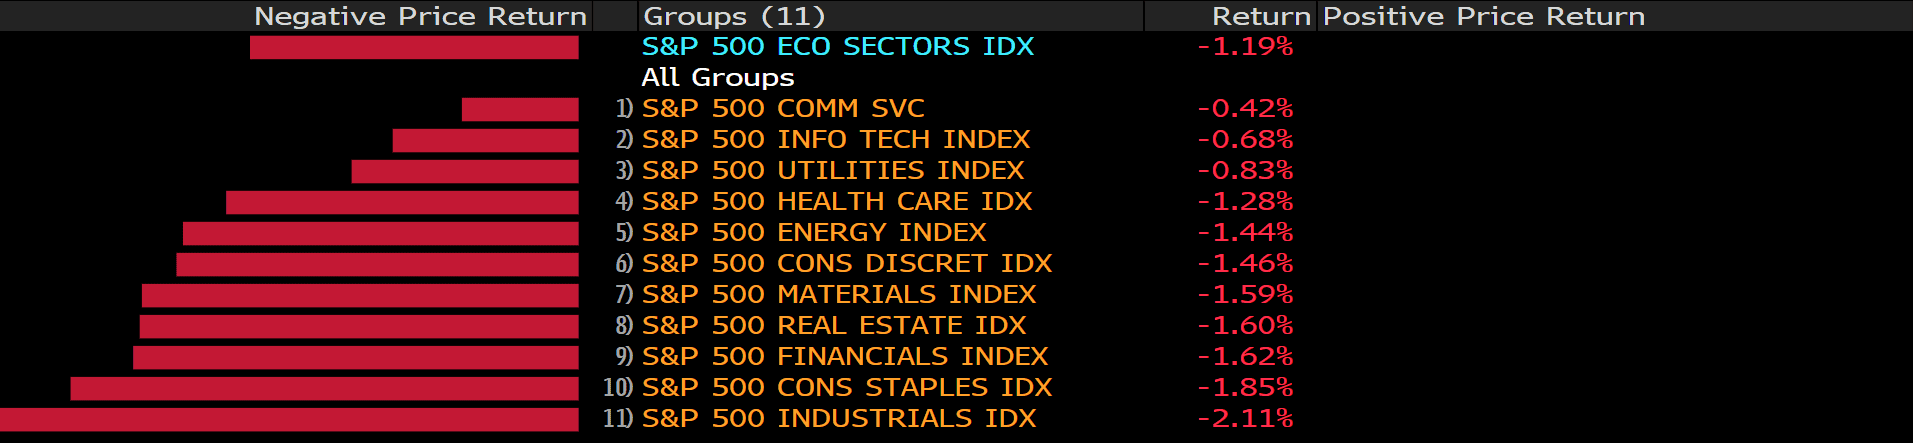
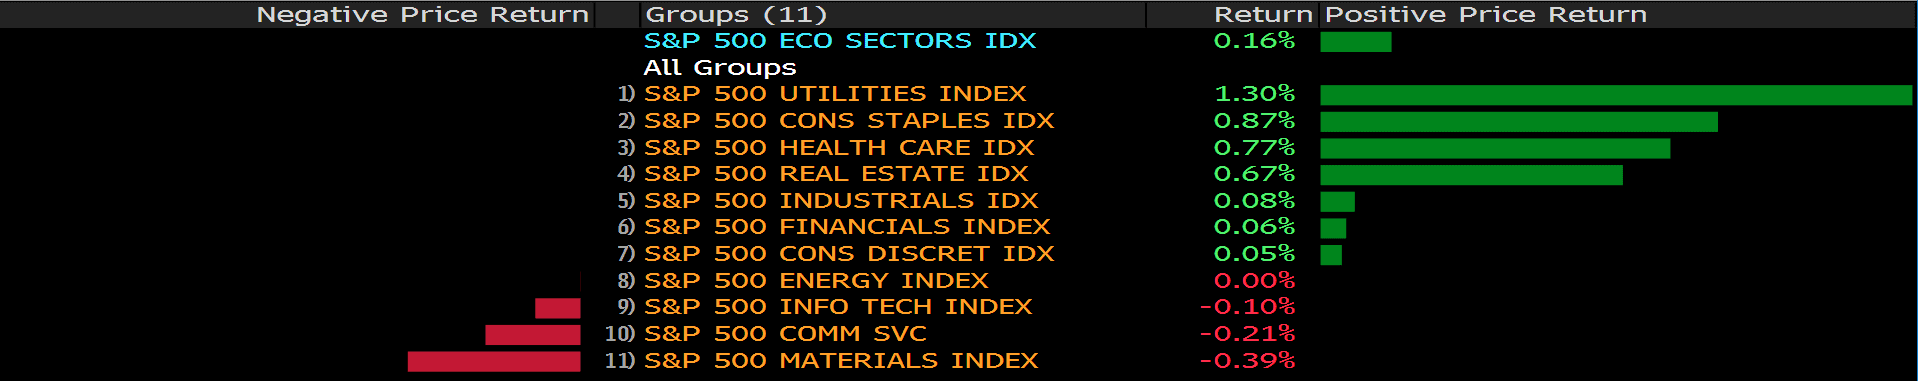
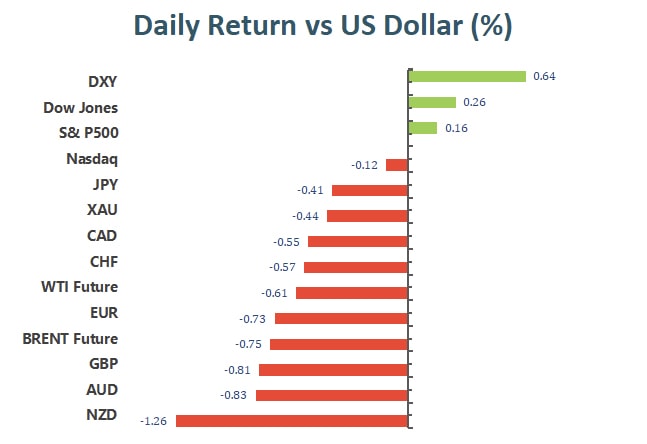
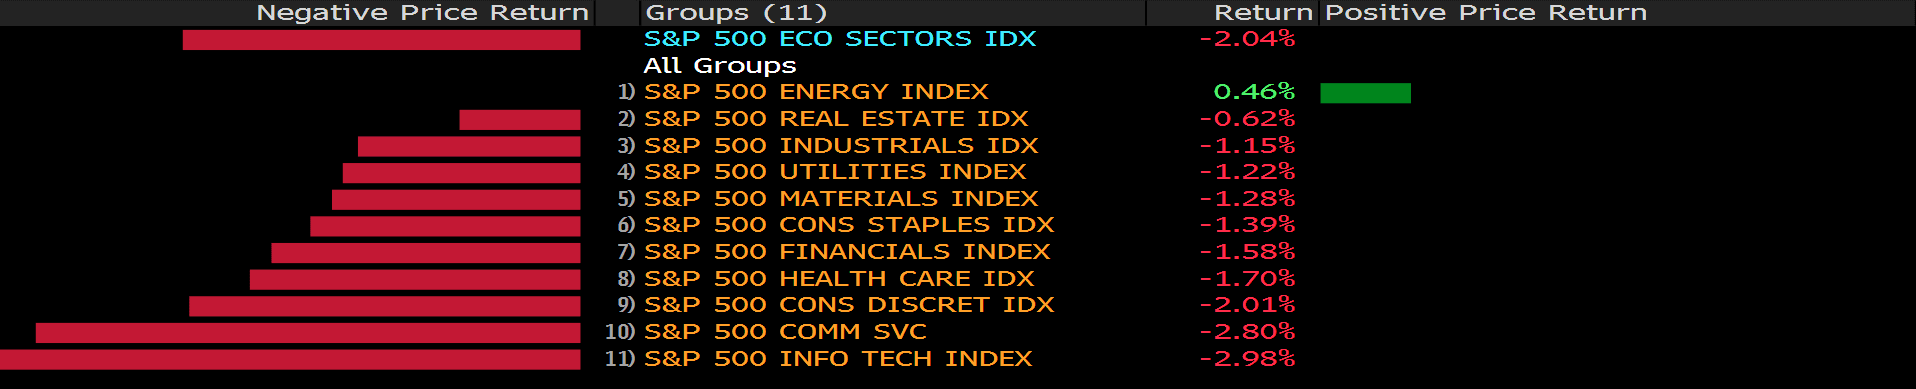
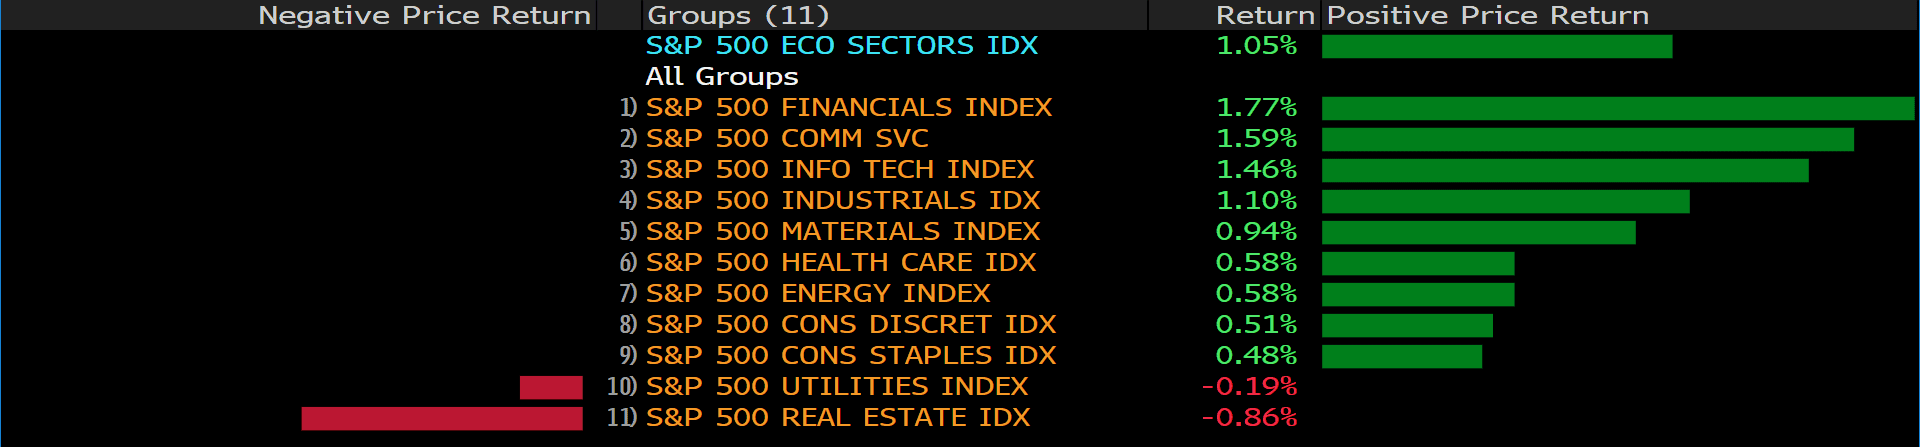
Major indices rebounded on Tuesday following a major sell- out in the technology- centered market in the previous session. The Dow Jones rebounded 0.92%. The S&P500 climbed 1.05% while the Nasdaq rallied 1.25%, led by advances in mega- cap technology companies. However, the 10- year yield surged to 1.53%. Investors awaited the latest job data later this week, following the signal on the Federal Reserve’s next move.
The US Treasury Secretary Janet Yellen said that the economy would fall into a recession if Congress ends up failing to raise the debt ceiling before a default on the US debt. In the meanwhile, President Biden also calls on Congress to raise the ceiling this week in order to avoid the catastrophe to not pay the government’s bill. While the US has never failed to pay the bills on time, a default will have a high possibility to result in a jump in interest rates and a damage in Washington’s ability to fulfill its future obligations on time.
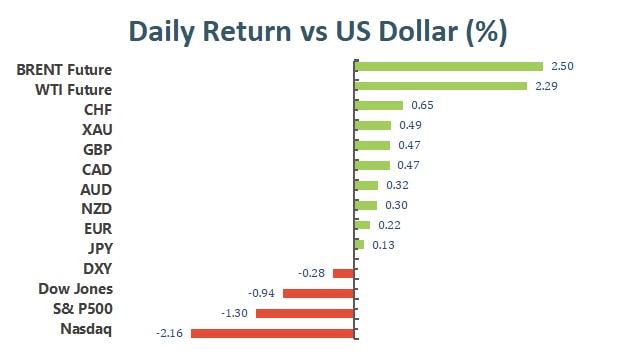
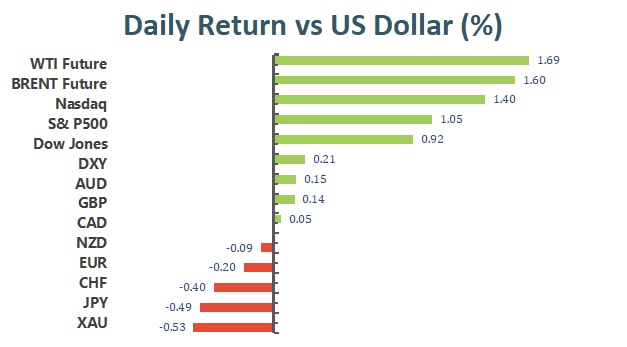
Oil price continues to surge, hitting multi- year highs as OPEC+ sticks to its original output plan. Early this week, OPEC+ agreed to adhere to its pact in July, rather than raising the output in the further. As a result, the fuel market is likely to be undersupplied for the next couple of months.
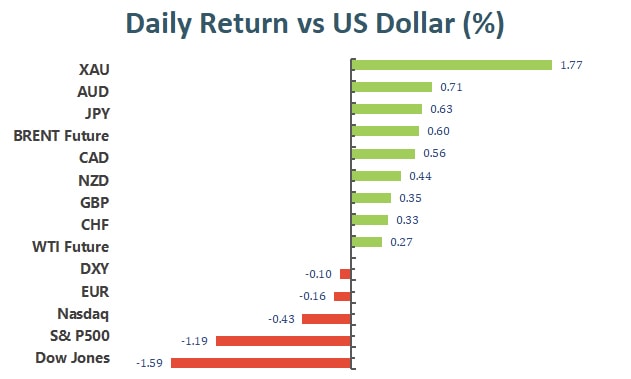
Main Pairs Movement:
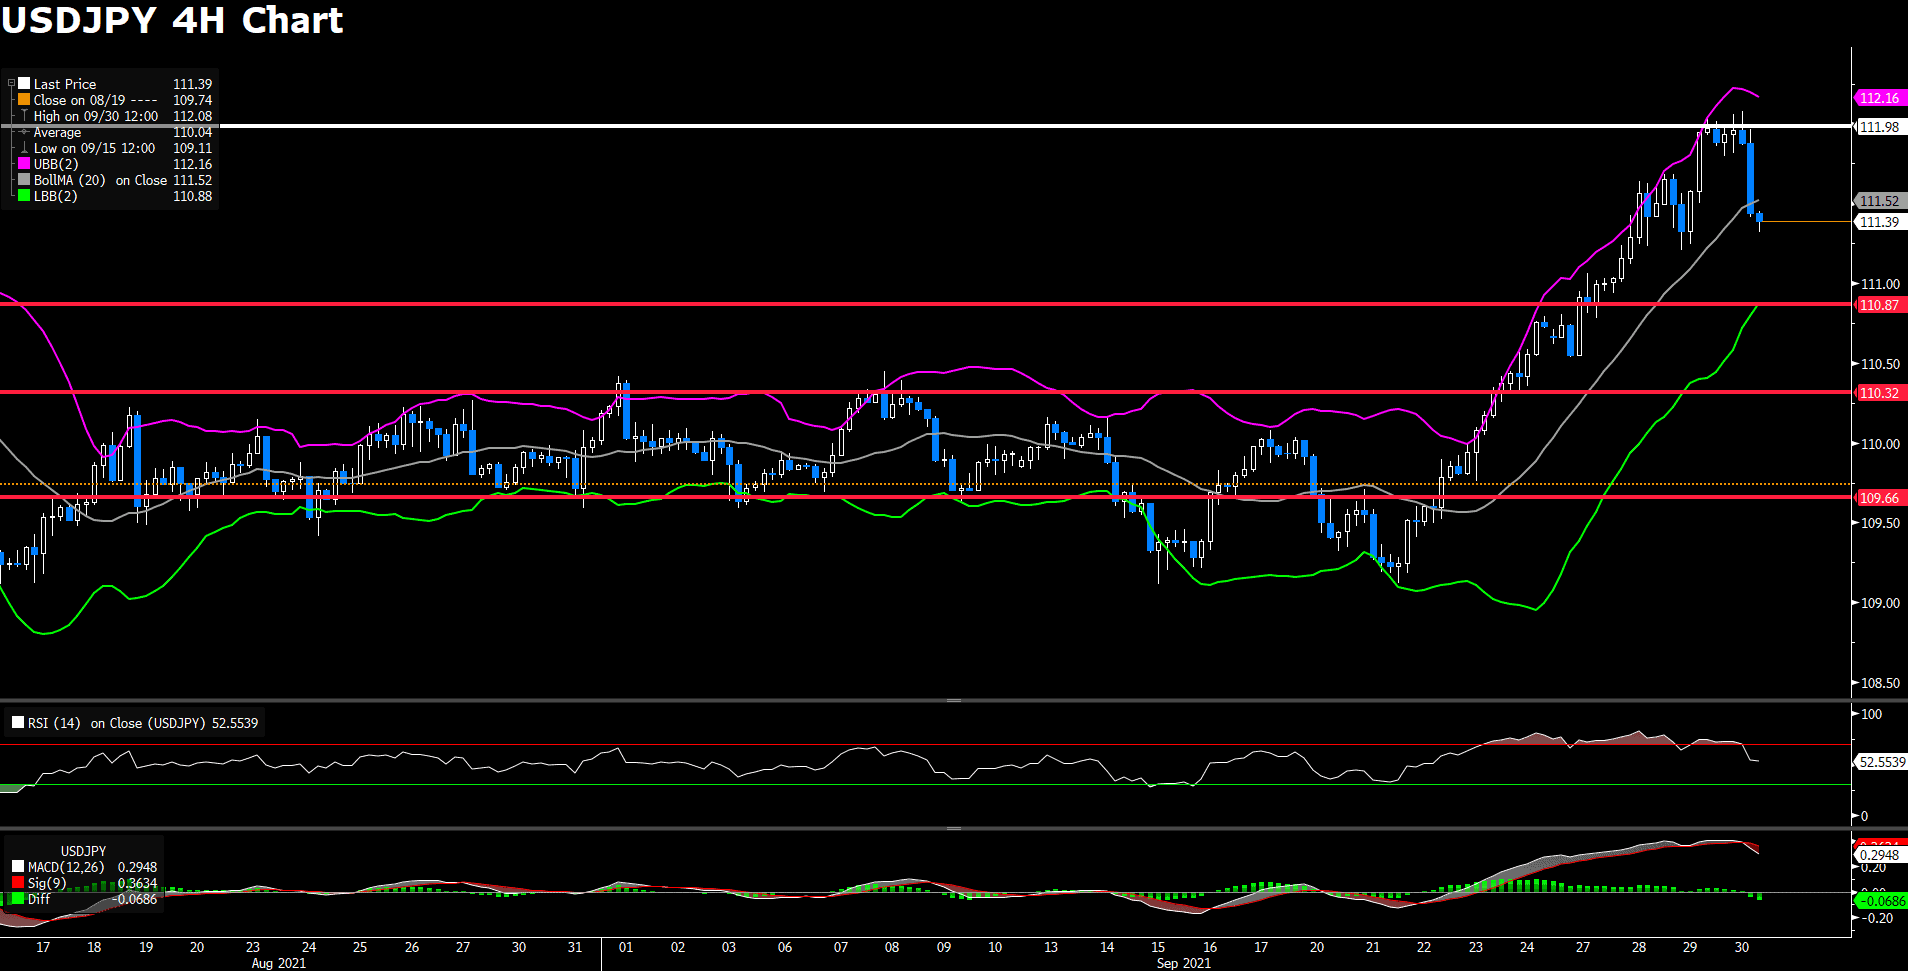
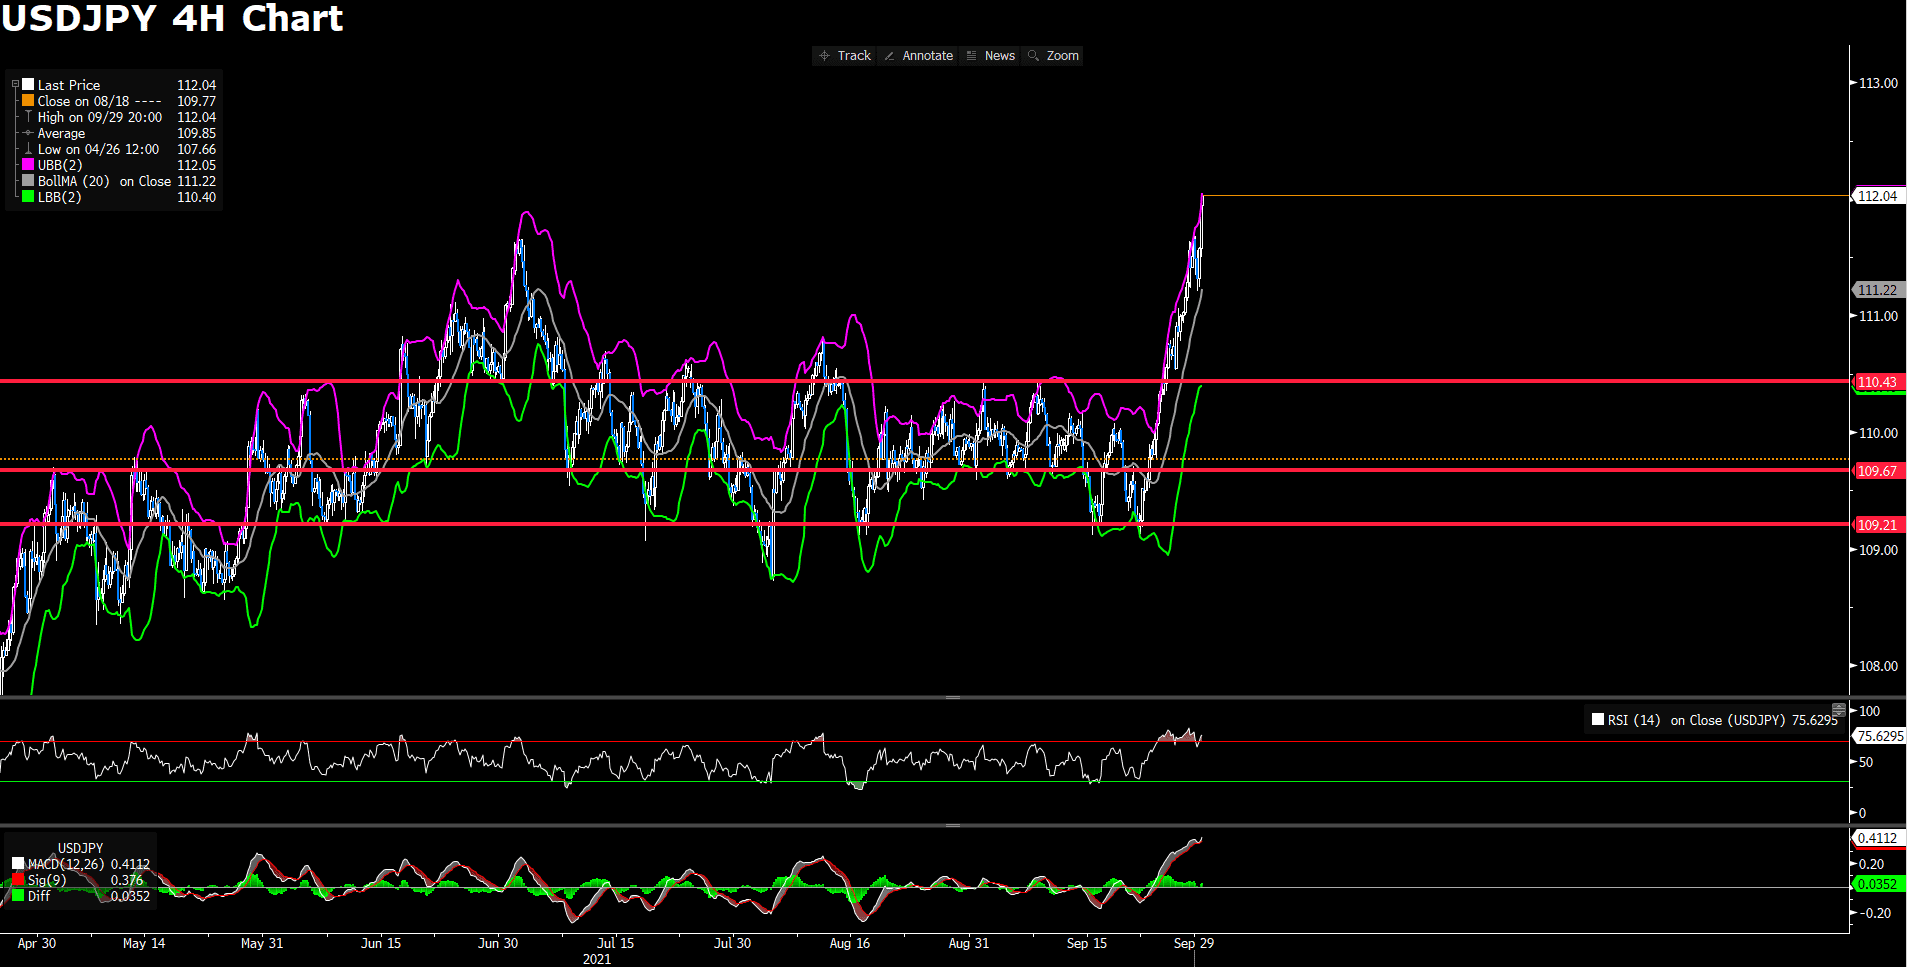
The Japanese Yen is testing its downside a US stocks recovered and the US yields climbed as investors conern over inflation. USDJPY is trading above 111.00 level with eye on 112 region, where selling pressure is also prone to emerge.
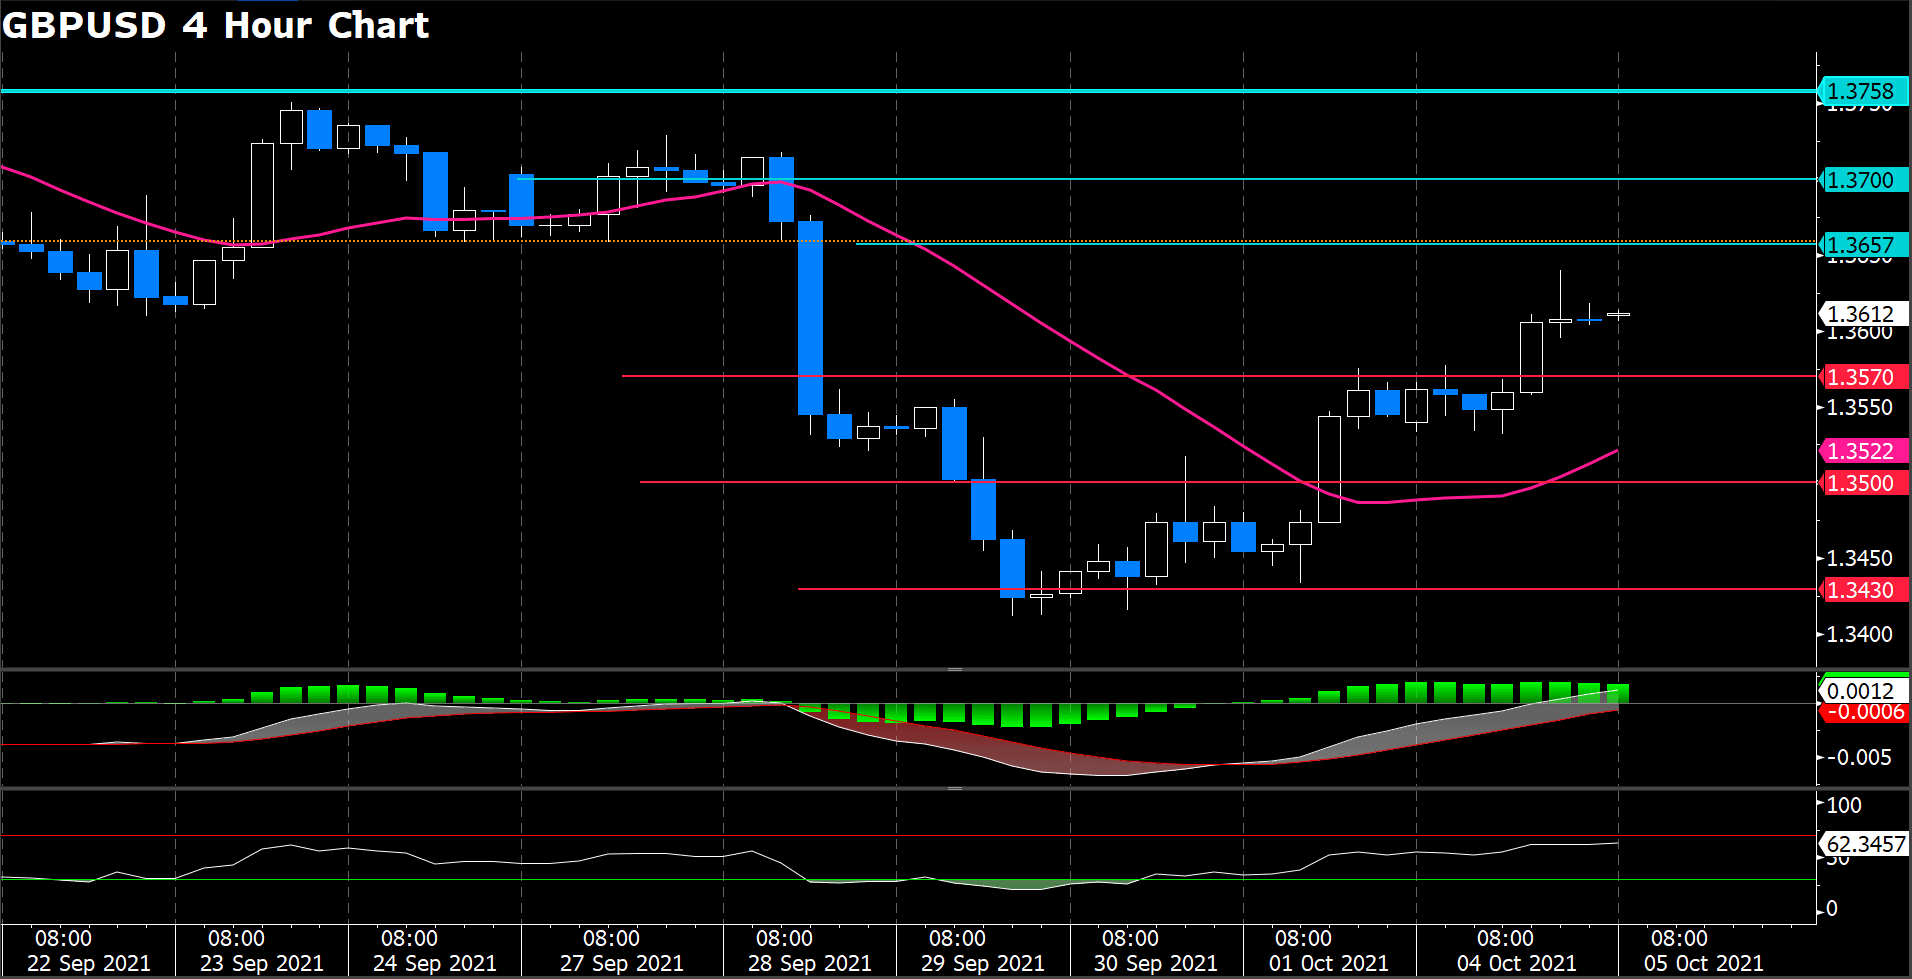
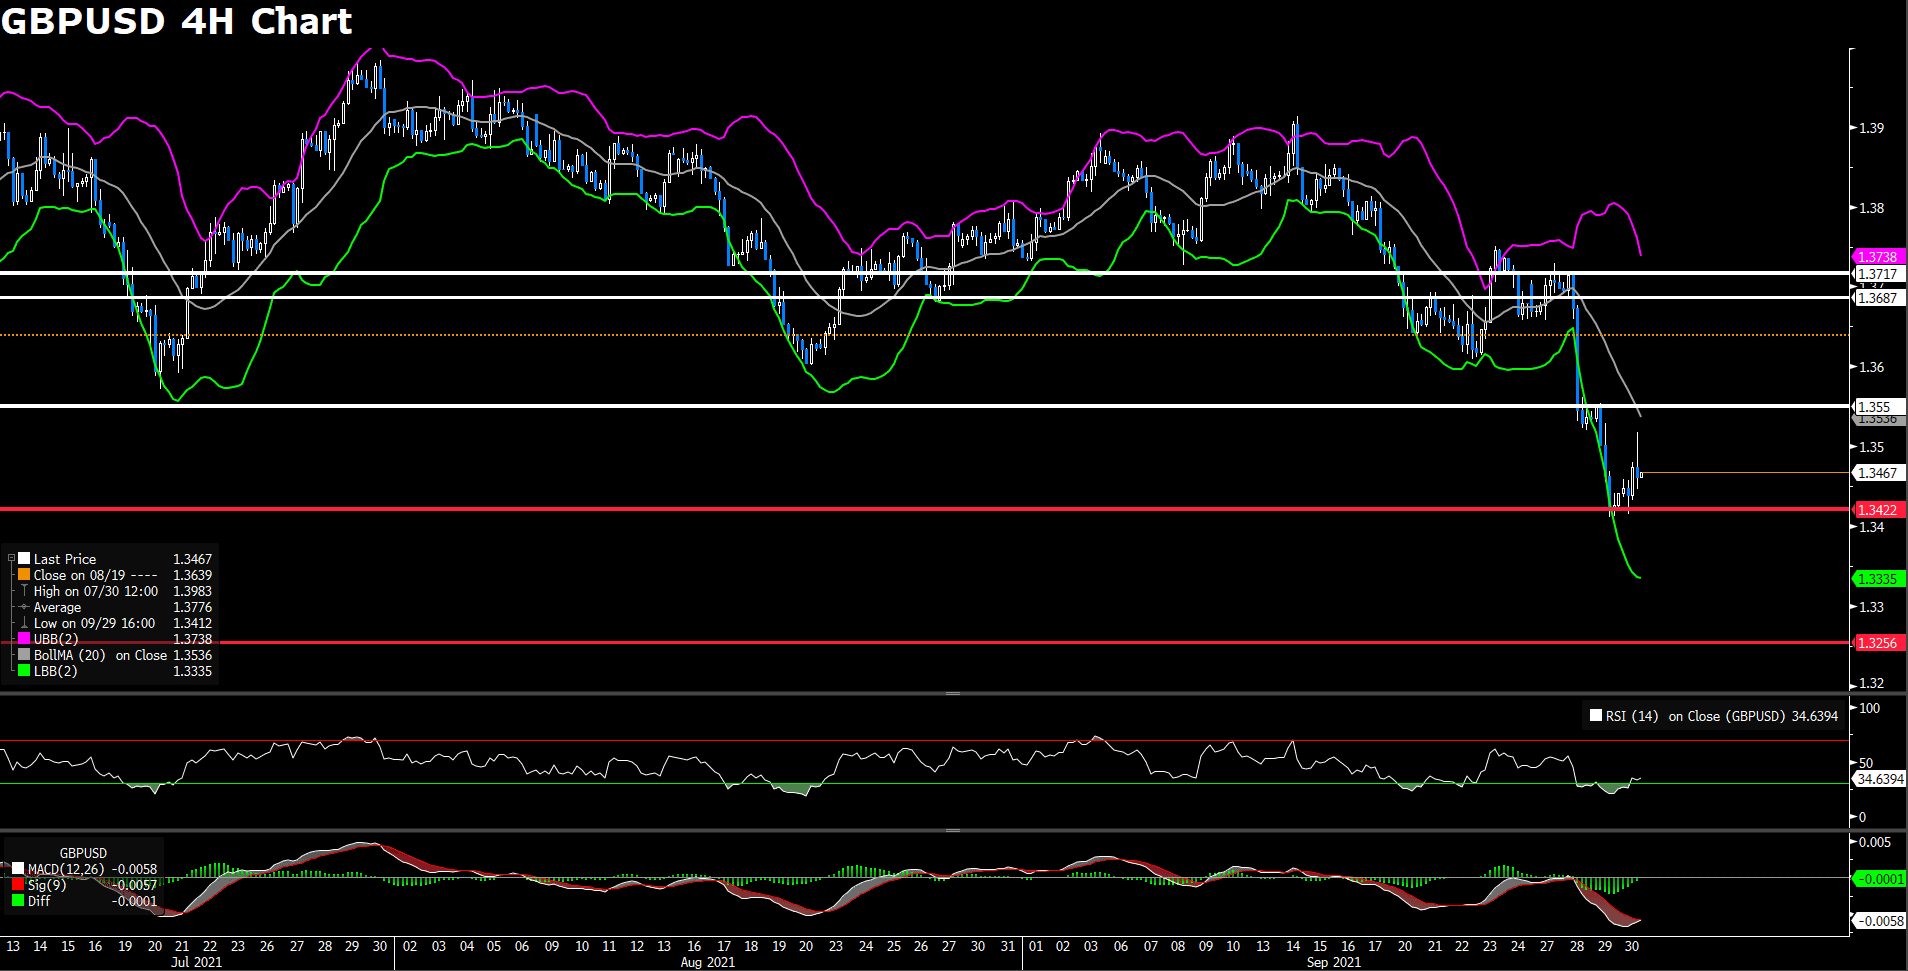
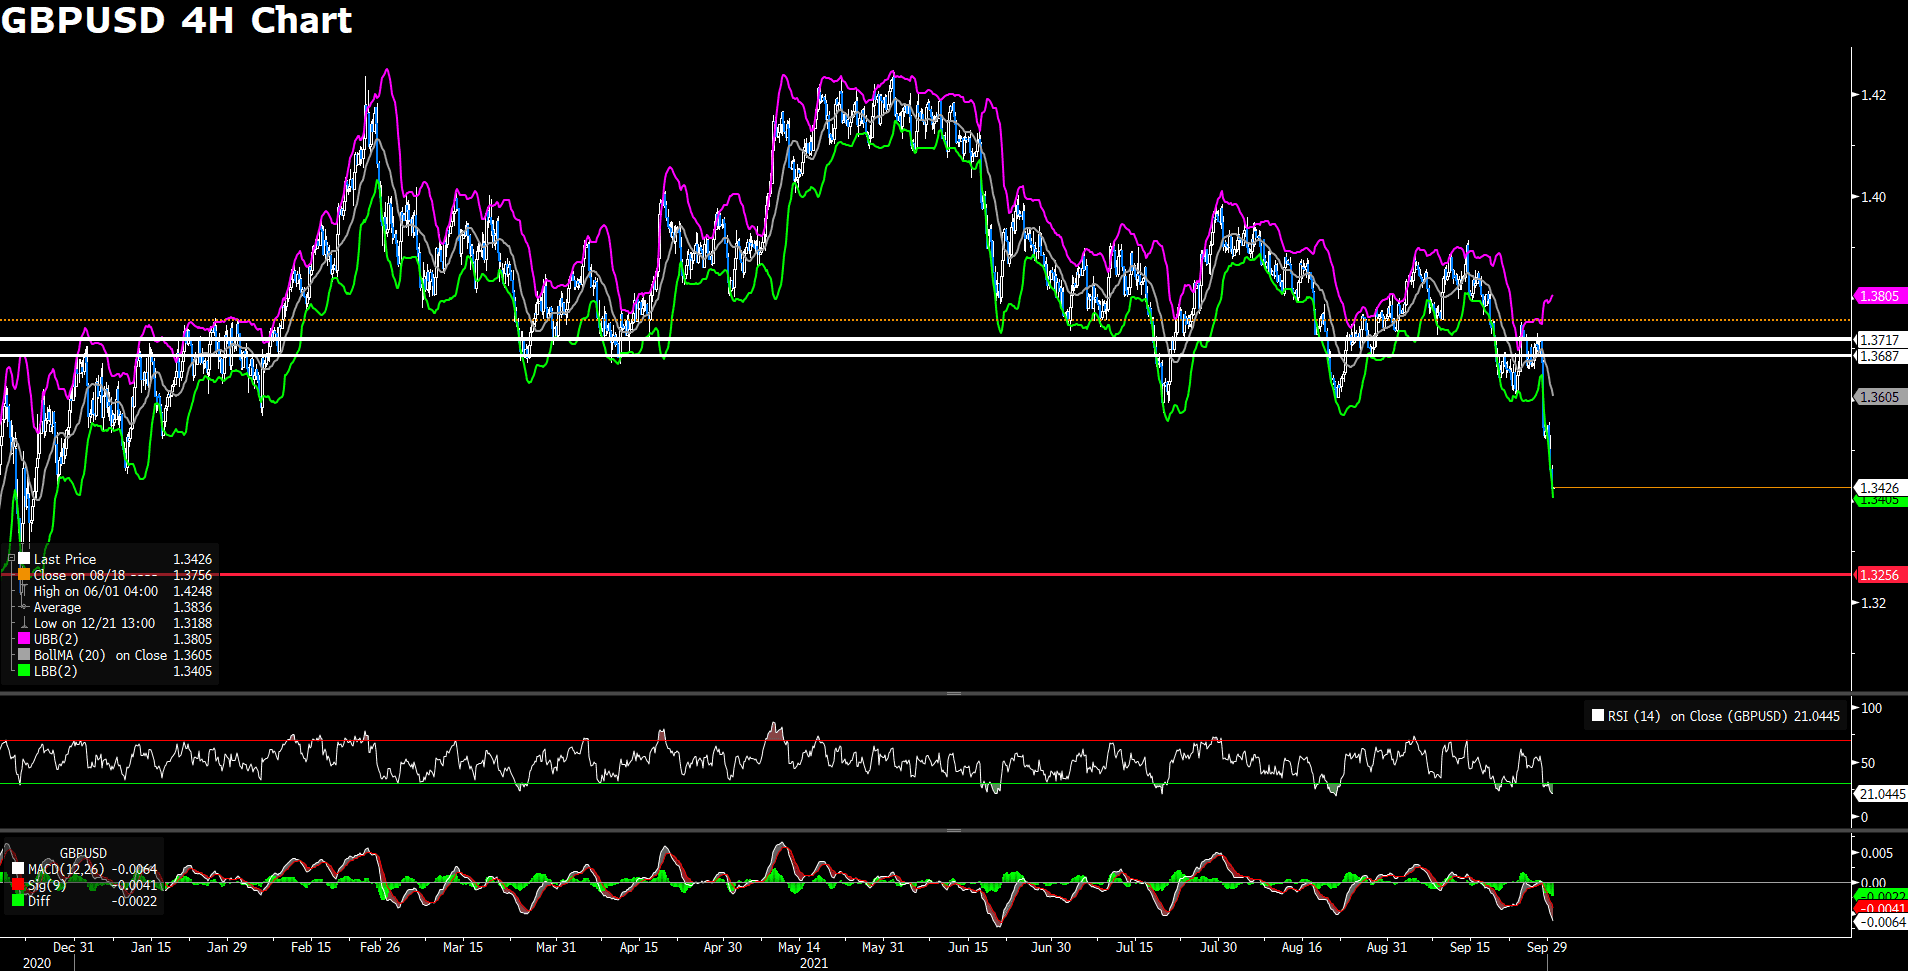
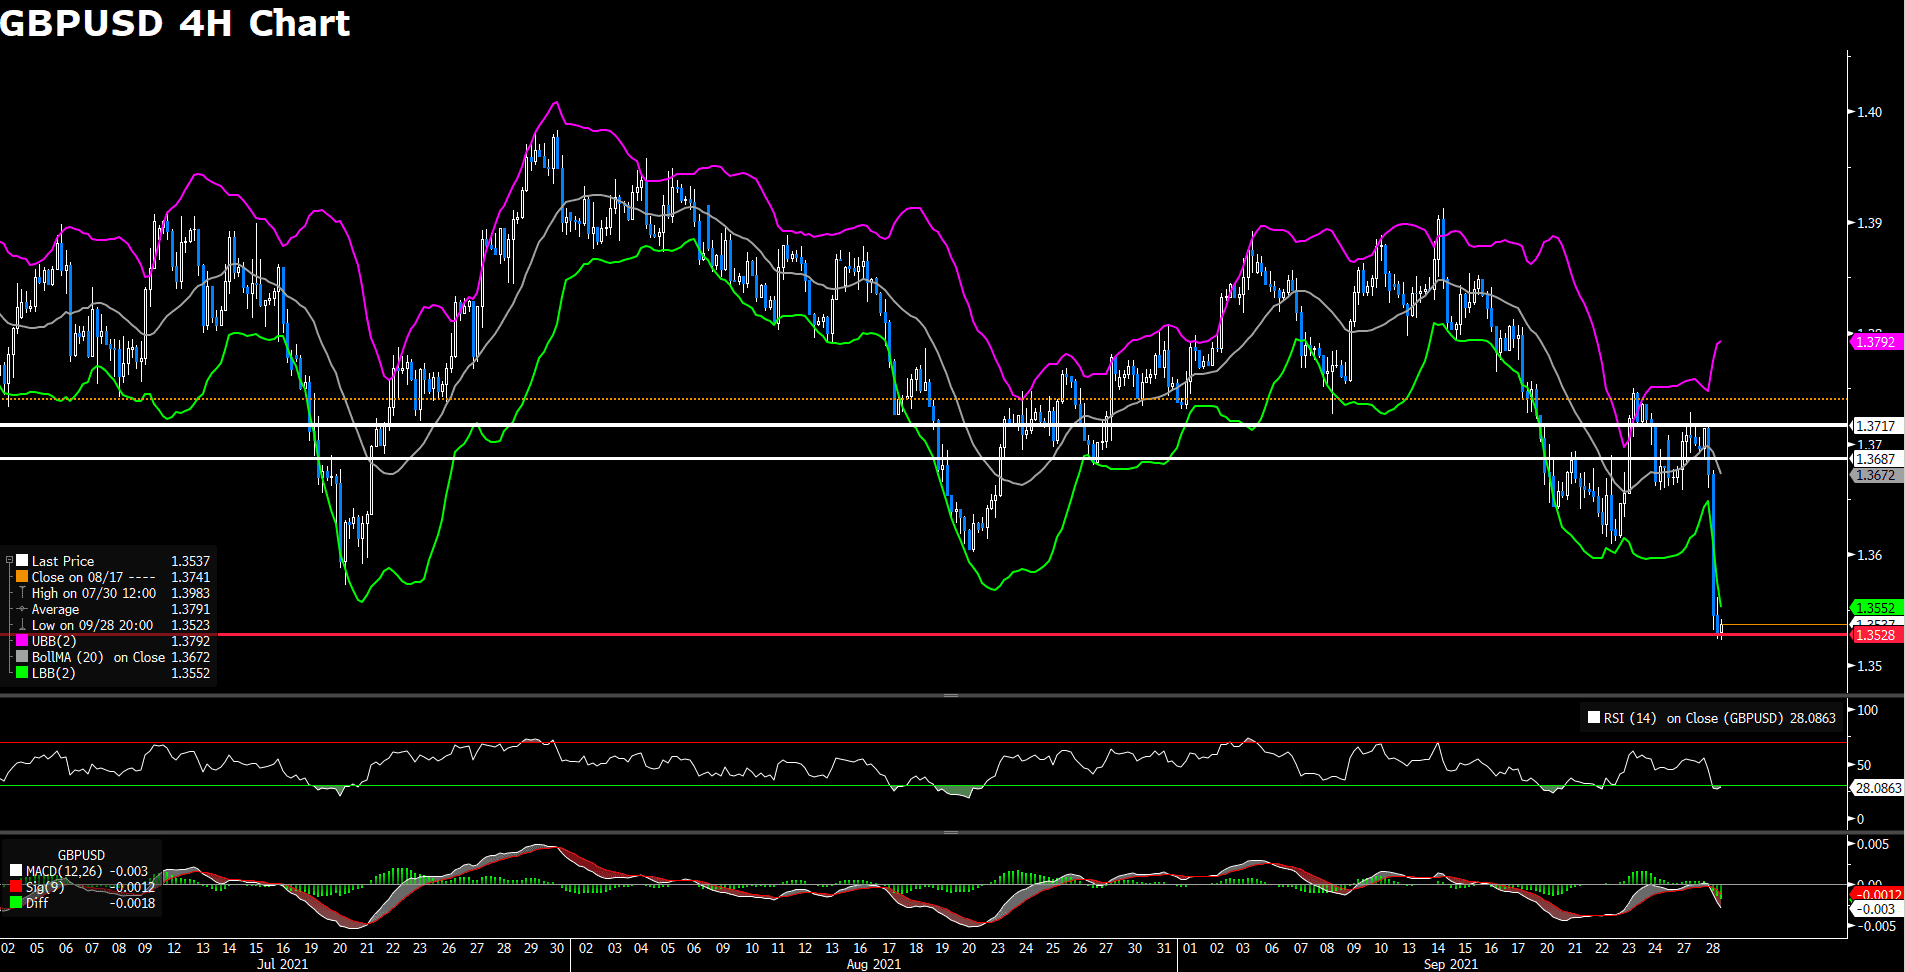
GBPUSD climbed higher, approaching 1.3650. After dipping last week, the pound rebounded as the markets seem to have shifted the focus from the fuel shortage to the impact of the Bank of England, whether it will lead the major central banks on hiking rates.
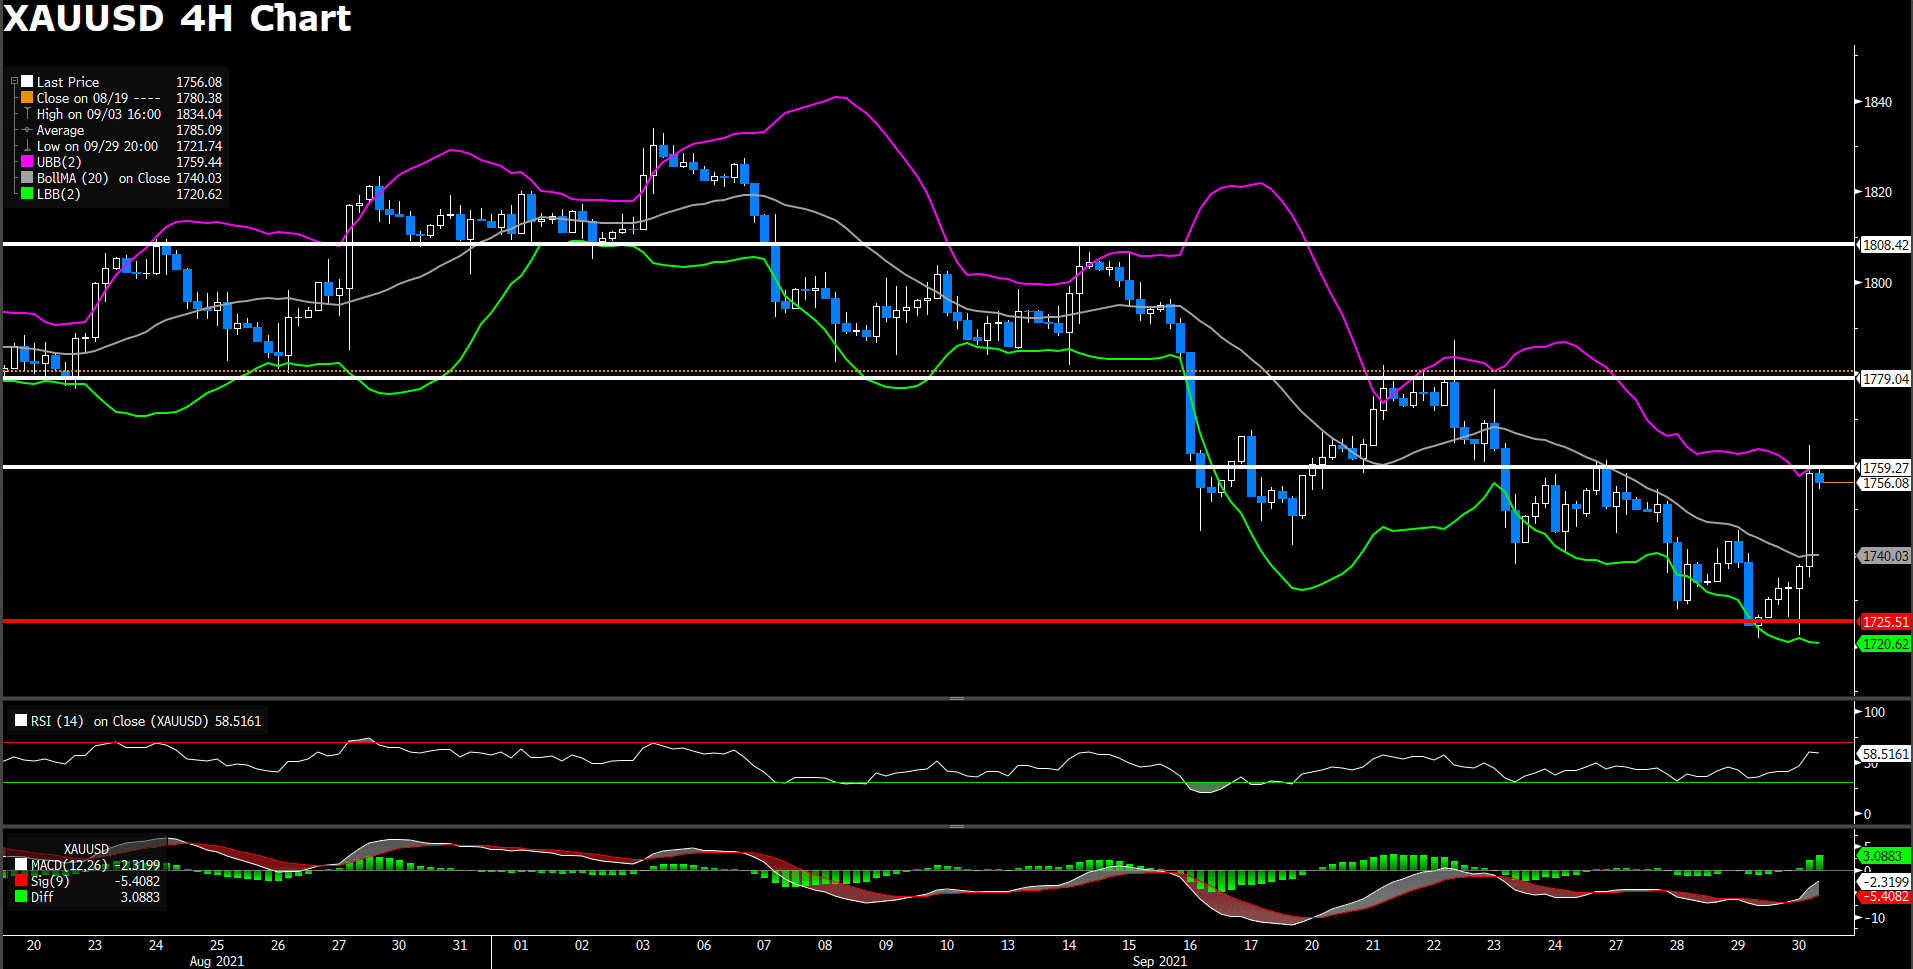
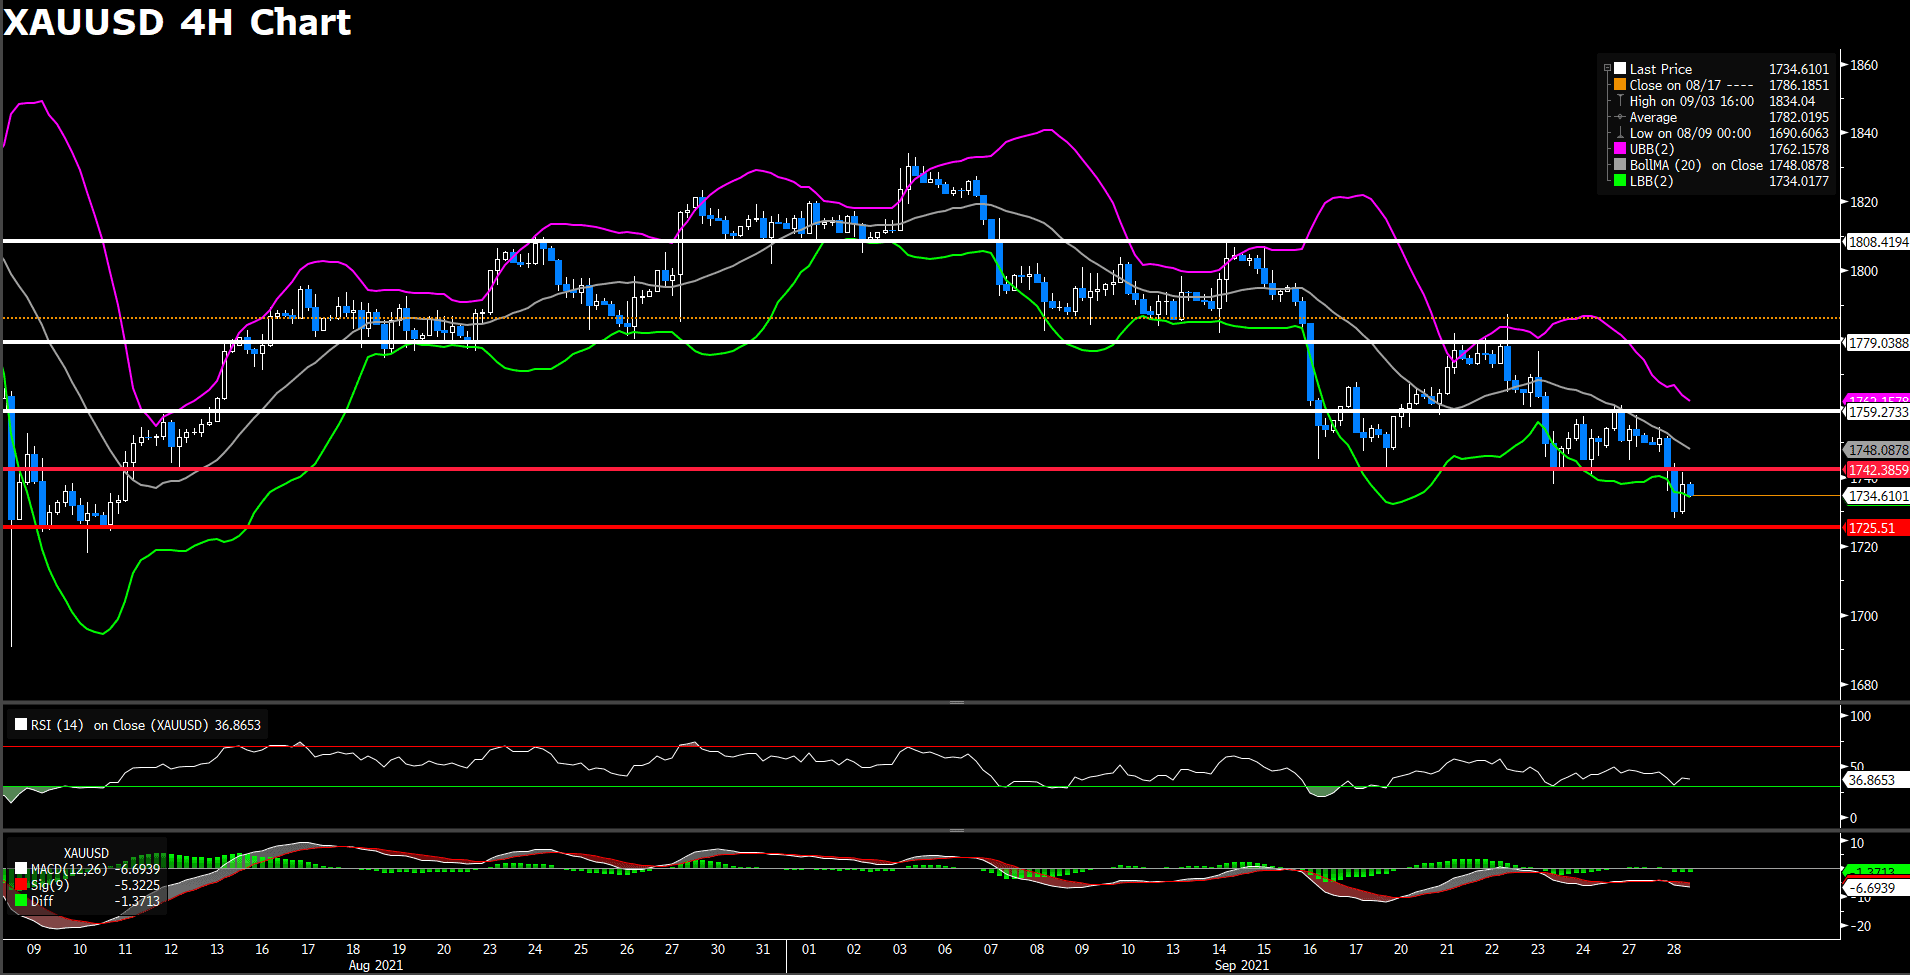
Gold declined, trading at $1759 as the Treasury yields edged higher after US data from last week boosted optimism about the economic recovery. In the meanwhile, the decline in gold also came from the dollar rebound, pressuring bullion, which did not earn interest.
Technical Analysis:
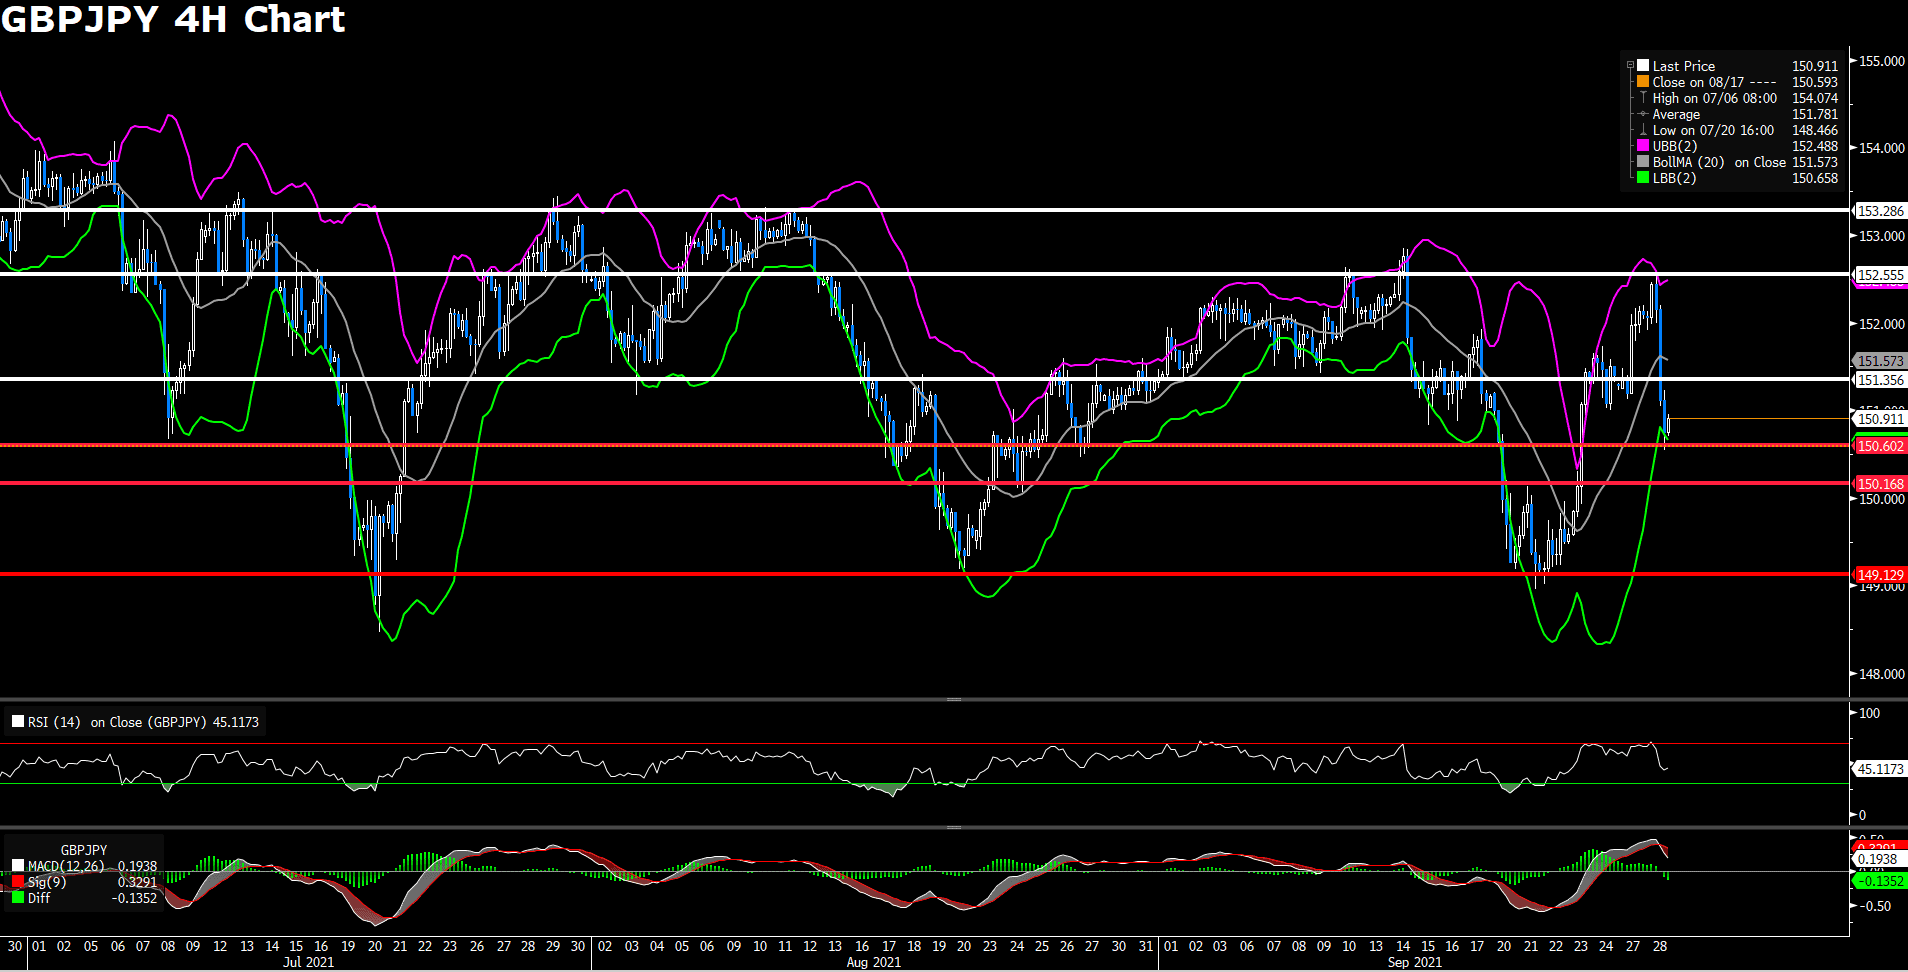
GBPJPY (Daily Chart)
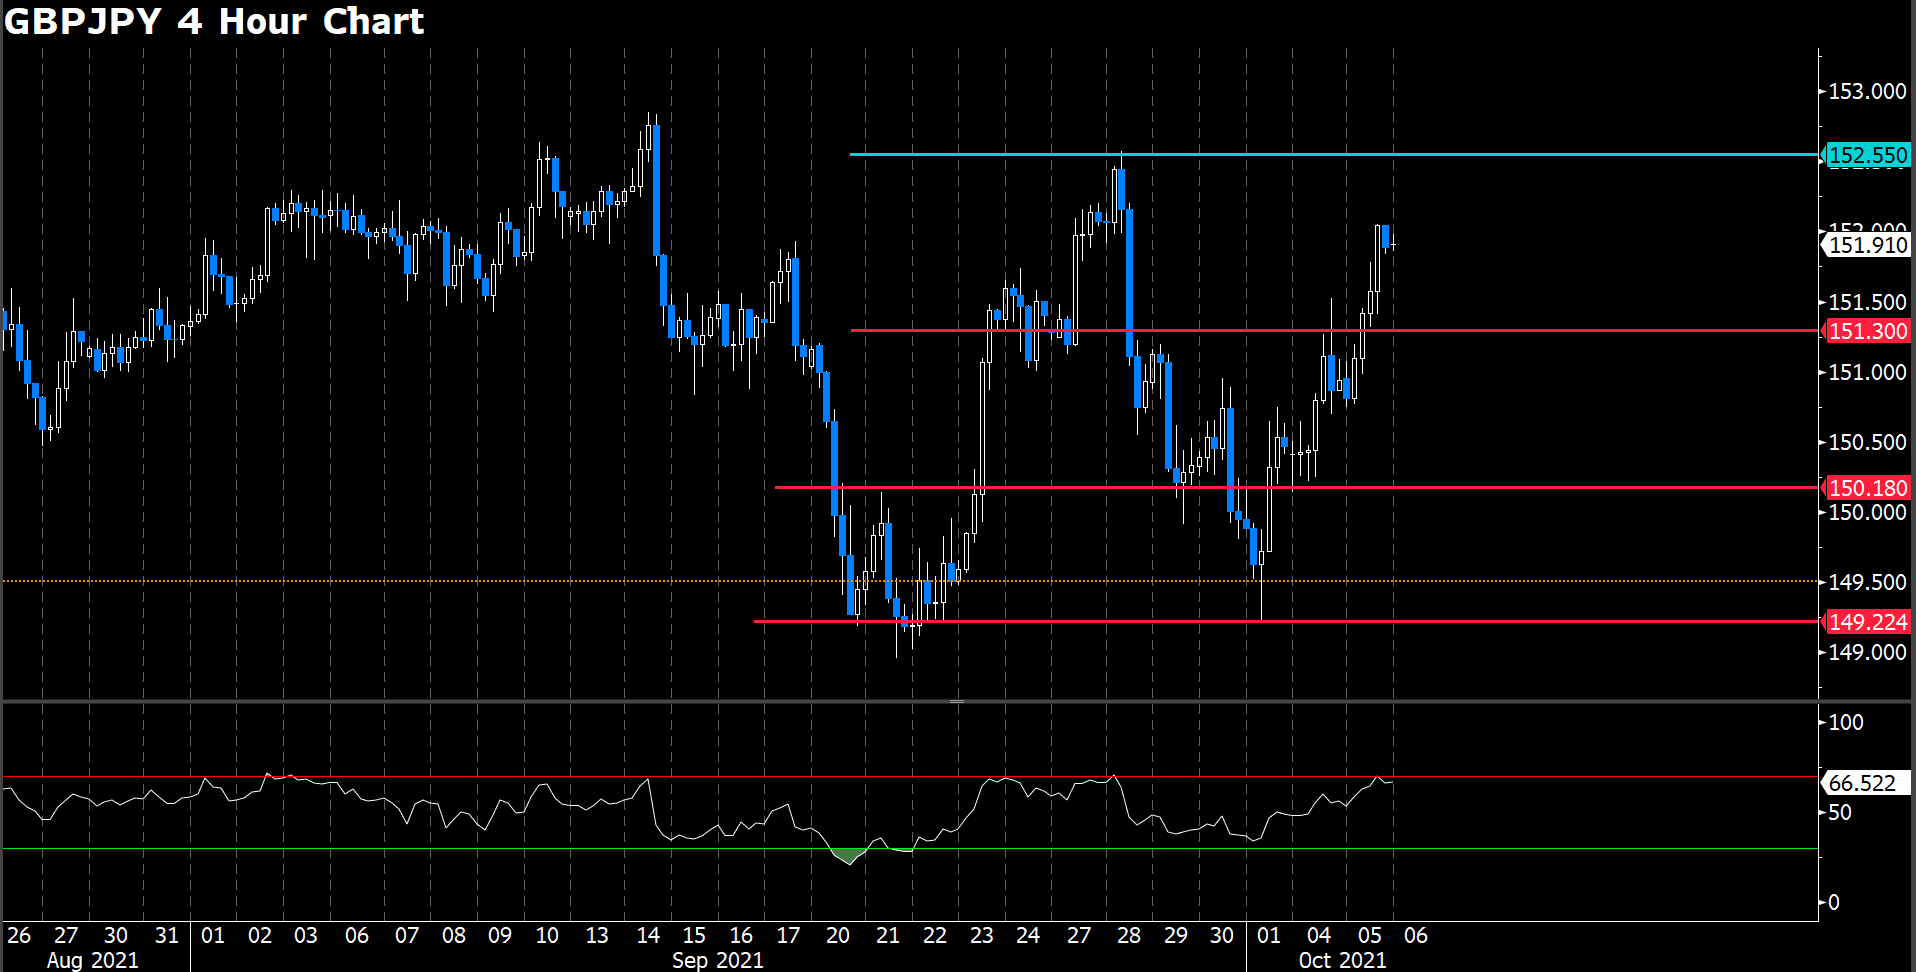
GBP/JPY has breached both the 200-DMA at 150.18 and the 50-DMA at 151.36, once bounced off the 152.00 price level, and trading at 151.90 as of writing.
If the GBP/JPY buyers would like to resume the uptrend, they would need a daily close above 152.00. in case of that outcome, it could pave the way for further gains. The first resistance level would be 152.55, the key supply zones with the confluence of the September 28 high and the 100-DMA. A breach of that level would expose the July’s top 153.50, followed by the yearly top 156.08.
On the other hand, a retreat heading to the 50-DMA could exert downward pressure in the cross-currency. The first support level would be the 50-DMA 151.30. A daily close below that level could push the price towards the 200-DMA at 150.18, immediately followed by October’s first low at 149.22.
Both RSI indicator and MACD histogram are above the middle line, supporting the upside bias, but caution is warranted as the negative macro impact looms.
Resistance: 152.55, 153.50, 156.08
Support: 151.30, 150.18, 149.22
EURUSD (4 Hour Chart)
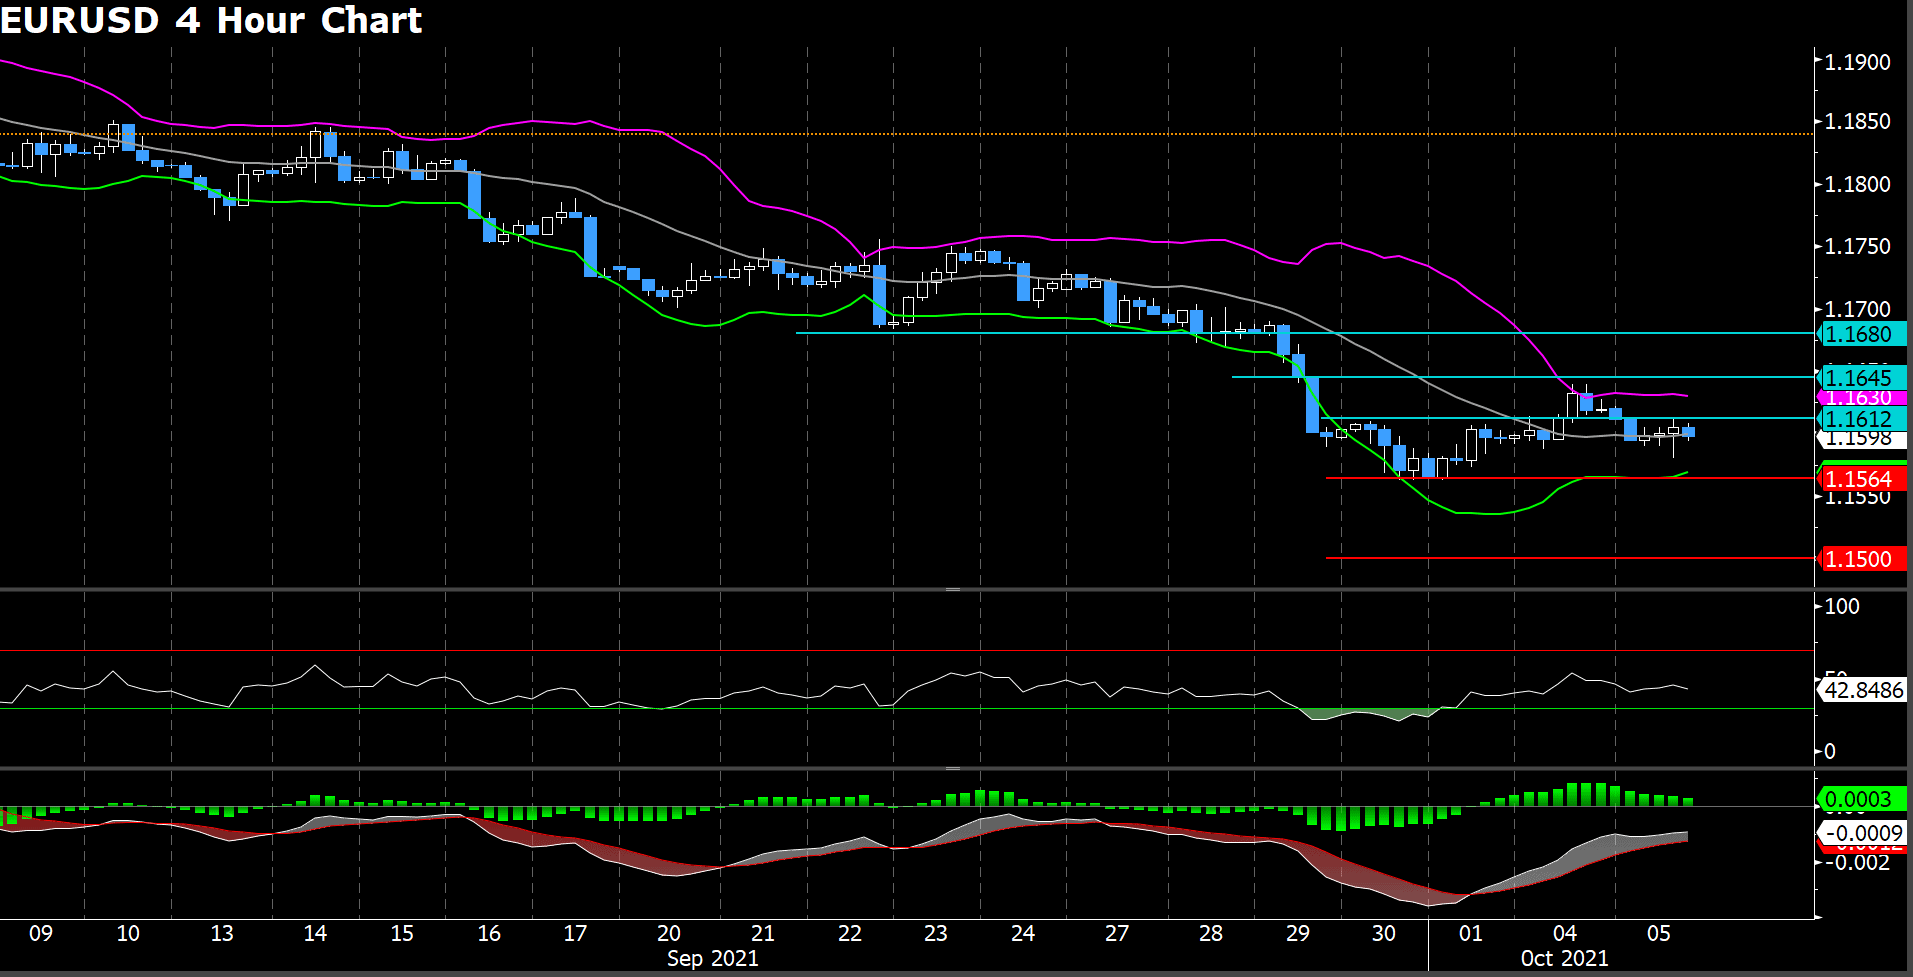
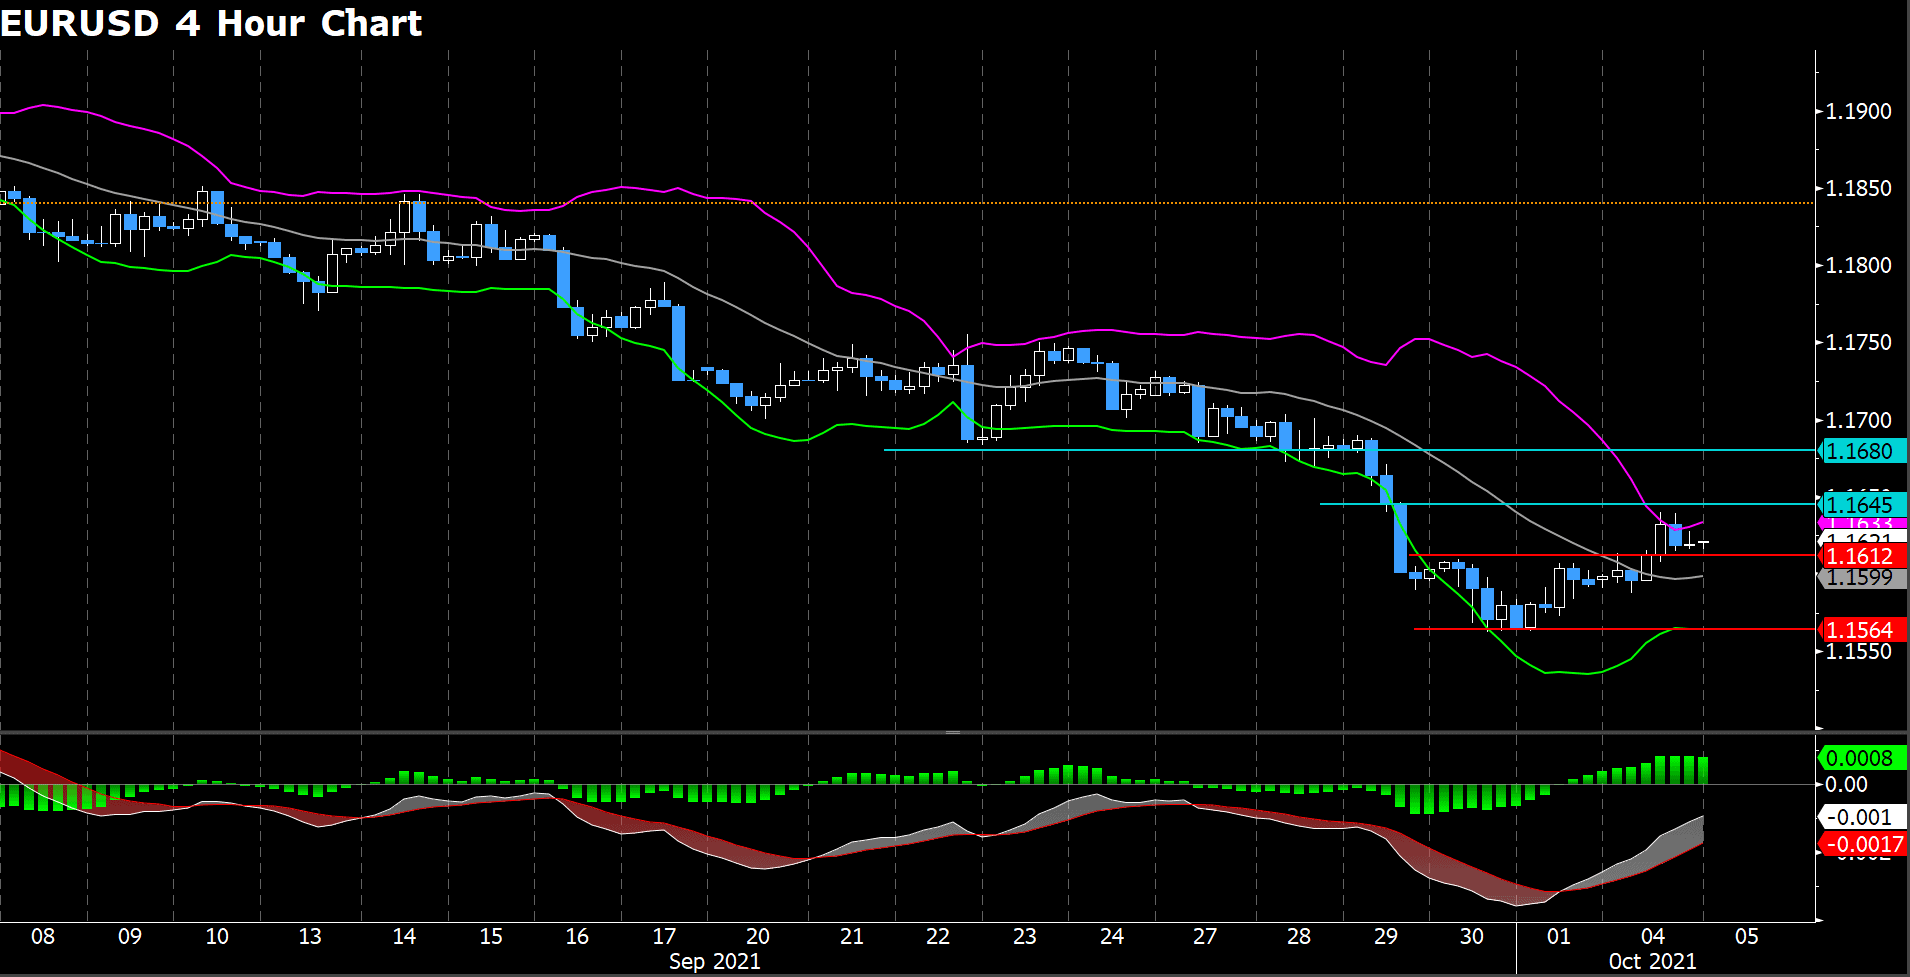
The euro fiber pair retreated from its Monday gains, is sliding during the U.S. session, down 0.22%, trading at 1.1598 as of writing. During the day, the pair bottomed at 1.158 but bounced back on slightly greenback weakness. The U.S. dollar index is advancing 0.18% hover around 93.98, underpinned by higher U.S. 10 years Treasury yields, sitting at 1.534%.
From a technical perspective, RSI index slightly sliding to 42.8, suggesting a weakeness guidance in further market. On MACD side, indicator continuing to converge to zero horizontal.
On price action, we expect the first barricade ahead of is 1.1645, following a strong resistance at 1.168 for upside way. On contrast, we expect the immediately support will set at 1.1564 and psychological support at 1.15 follow behind. All of all, we foresee market will choppy between 1.1564 and 1.1645 consolidation channel.
Resistance: 1.1612, 1.1645, 1.168
Support: 1.1564, 1.15
USDCAD (4 Hour Chart)
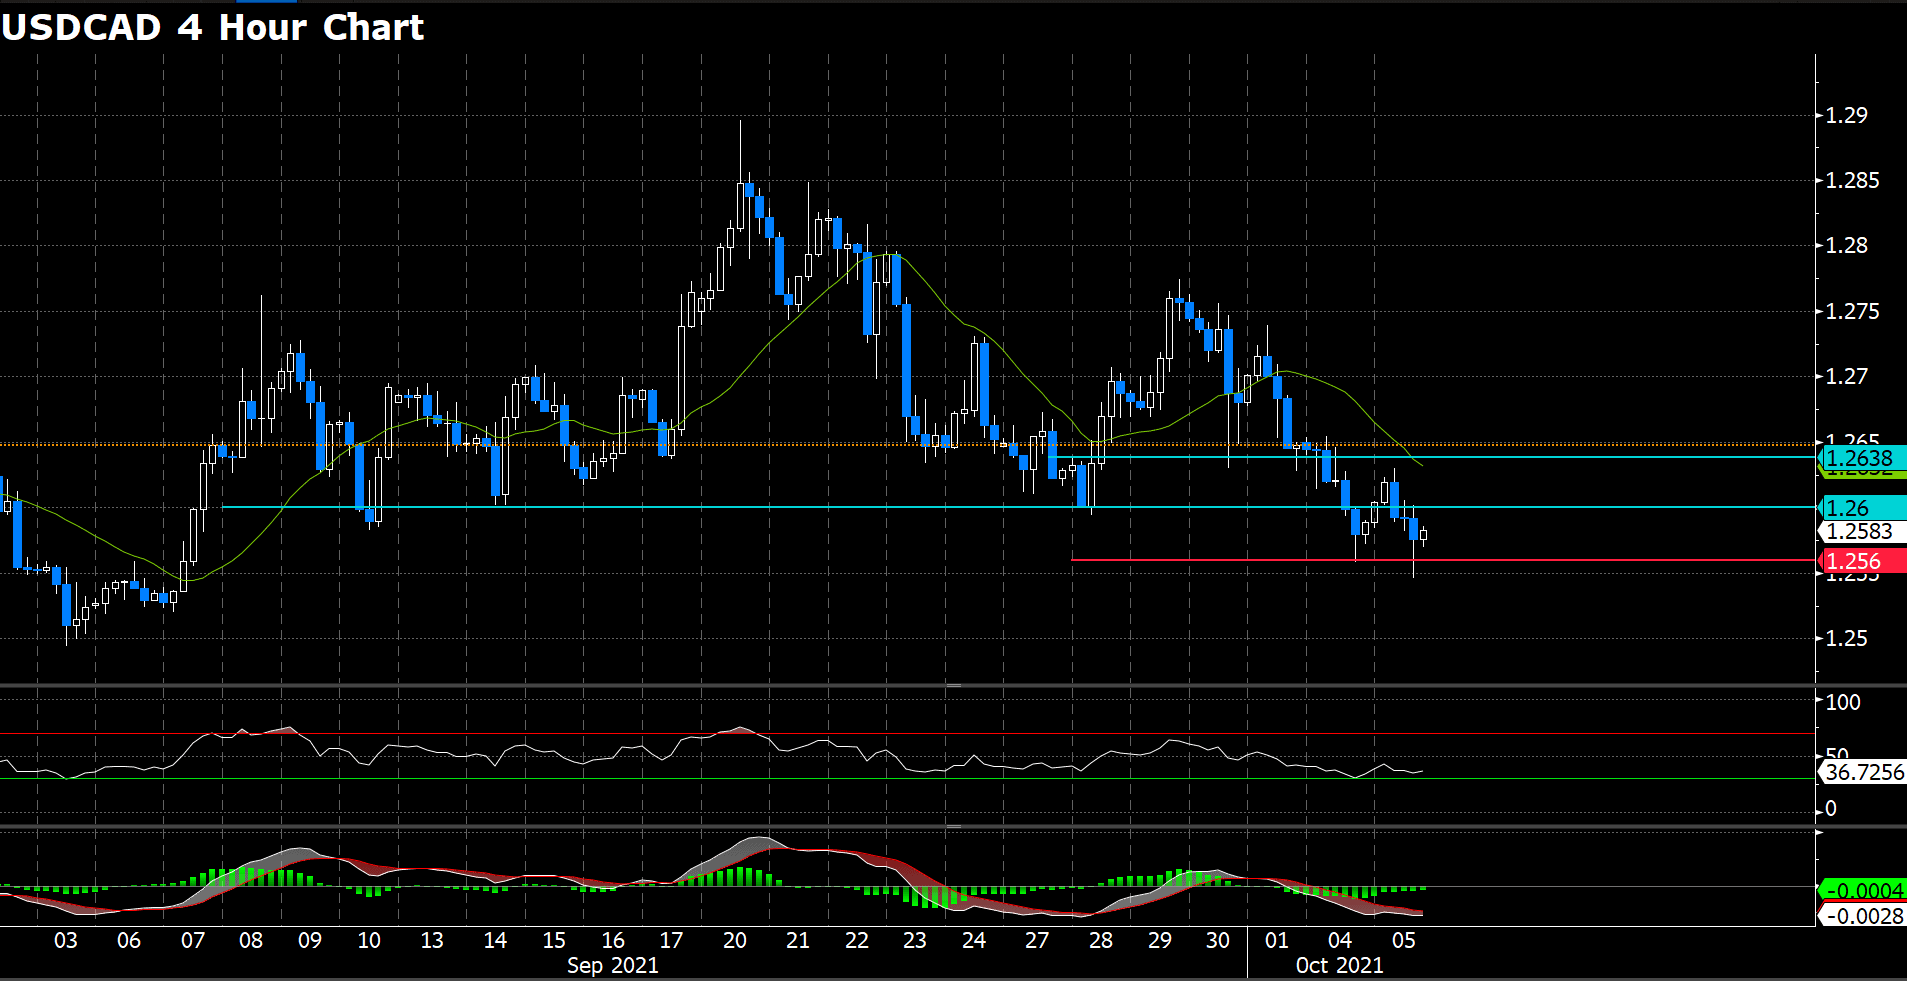
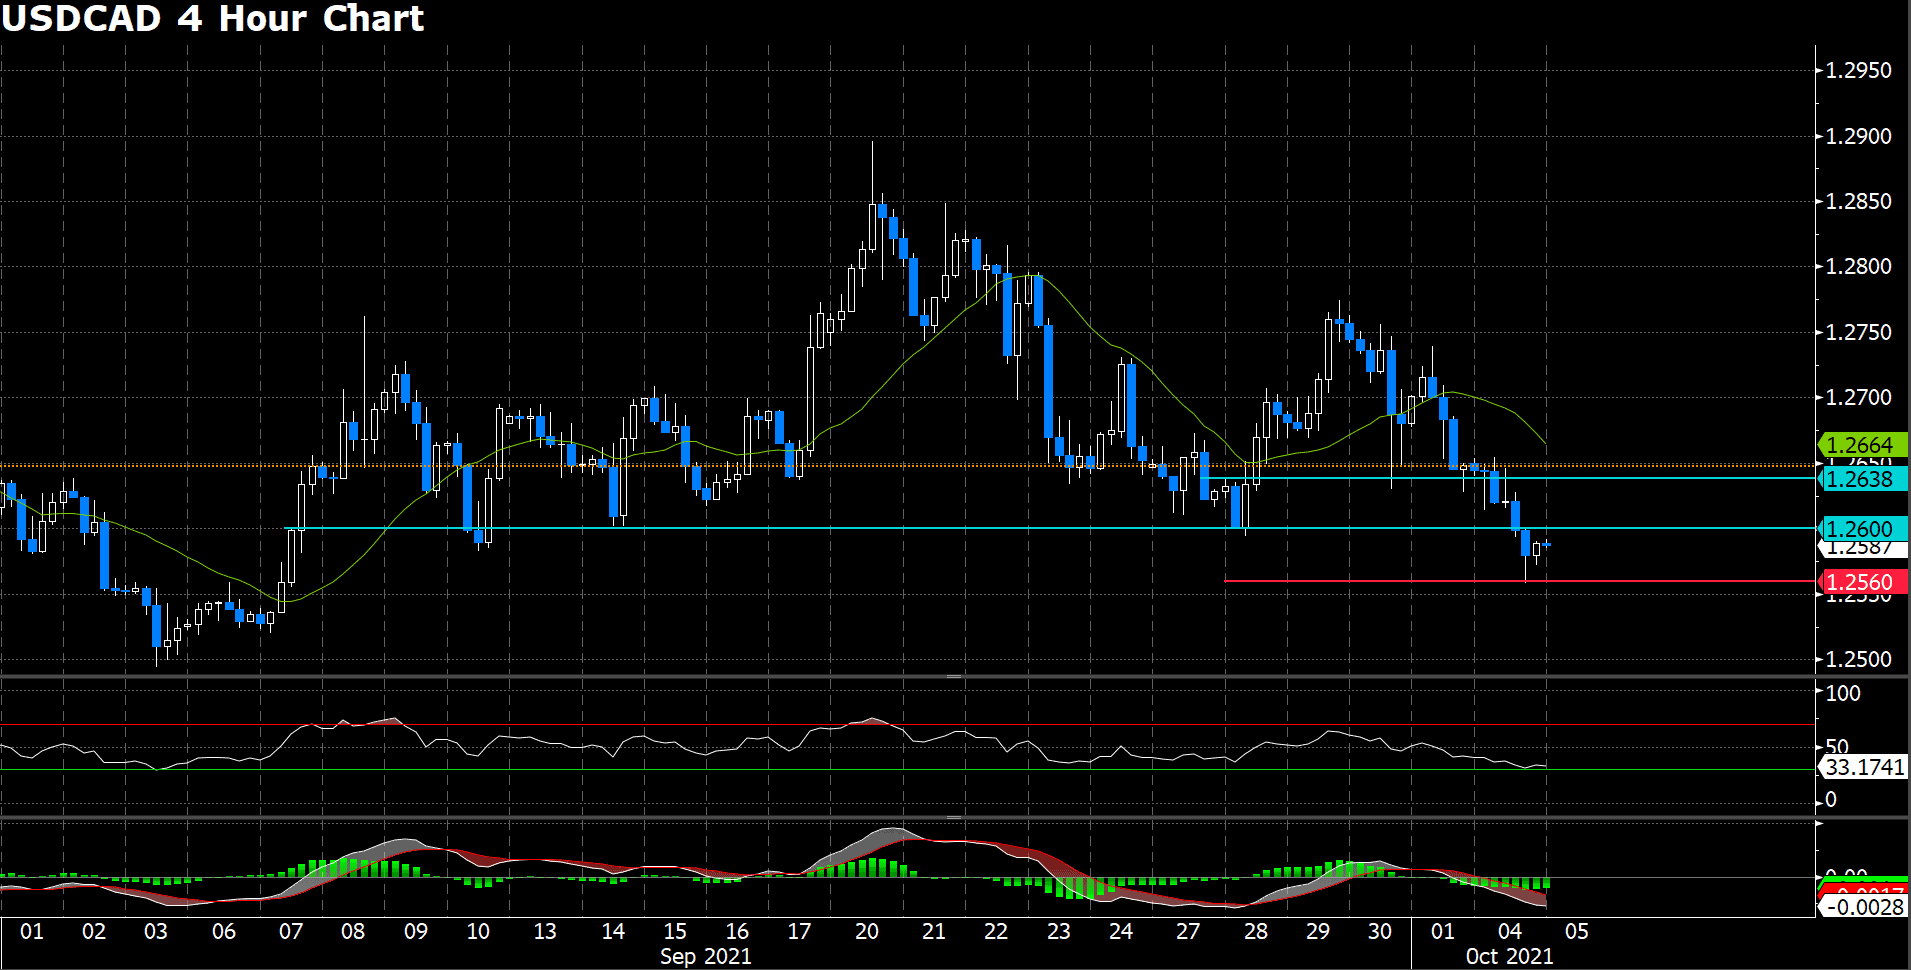
Loonie was falling in the New York session, trading below 1.26, down over 0.24% in the day market at the time of writing. The market sentiment has improved throughout the day. European and U.S. shares indices are advancing between 0.8% and 1.56%, whereas Asian stocks ended the day with losses except for the Hang Seng. Meanwhile, WTI is edging higher for the fifth consecutive day, trading at $78.95 which breached seven year-highs, up almost 2%.
From a technical perspective, RSI index shows 36.7 figure which slightly improve bearish momentum, still suggesting bear movement ahead. On the other hands, MACD shows another downside guidance where figure successive print negative figure as of writing.
For the slip way, it seem doesn’t have to much downside support level where last support at 1.256, expecting effectively support will between 1.255 and 1.256. On up way, the first resistance will be psychological level at 1.26
Resistance: 1.26, 1.2638
Support: 1.256
Economic Data
|
Currency
|
Data
|
Time (GMT + 8)
|
Forecast
|
|
NZD
|
RBNZ Interest Rate Decision
|
09:00
|
0.5%
|
|
NZD
|
RBNZ Rate Statement
|
09:00
|
N/A
|
|
GBP
|
Construction PMI (Sep)
|
16:30
|
54
|
|
USD
|
ADP Nonfarm Employment Change
|
20:15
|
428K
|
|
Oil
|
Crude Oil Inventories
|
22:30
|
-0.418 M
|
|
|
|
|
|
|
|
|
|
|
|
|
|
|
|
|
|
|
|
|
|
|
|
|
|
|
|
|
|
|
|
|