Market Focus
After closing down 0.3% to 0.7% last week, the three major US stock indices opened higher this week. As optimistic Chinese economic data eased concerns about the slowdown in the world’s second largest economy, world stock markets are optimistic after recent record highs.
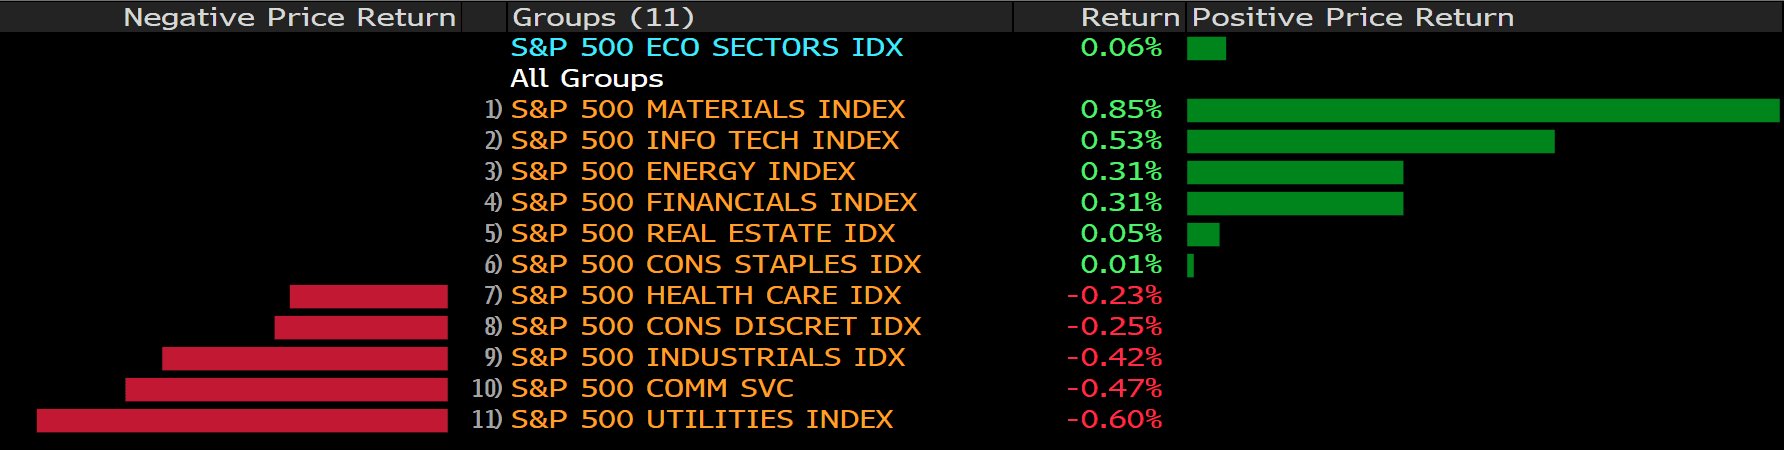
Five minutes after the market opened, the three indexes opened higher, the Dow Jones Industrial Average rose by 0.32%, the S&P500 Index rose by 0.23%, and the Nasdaq Index rose by 0.26%. However, as US Treasury yields reversed and climbed, these three indices became weaker. In the end, the S&P 500 Index closed flat at 0.0%, the Dow Jones Industrial Average fell 0.04%, and the Nasdaq Index fell 0.07%.
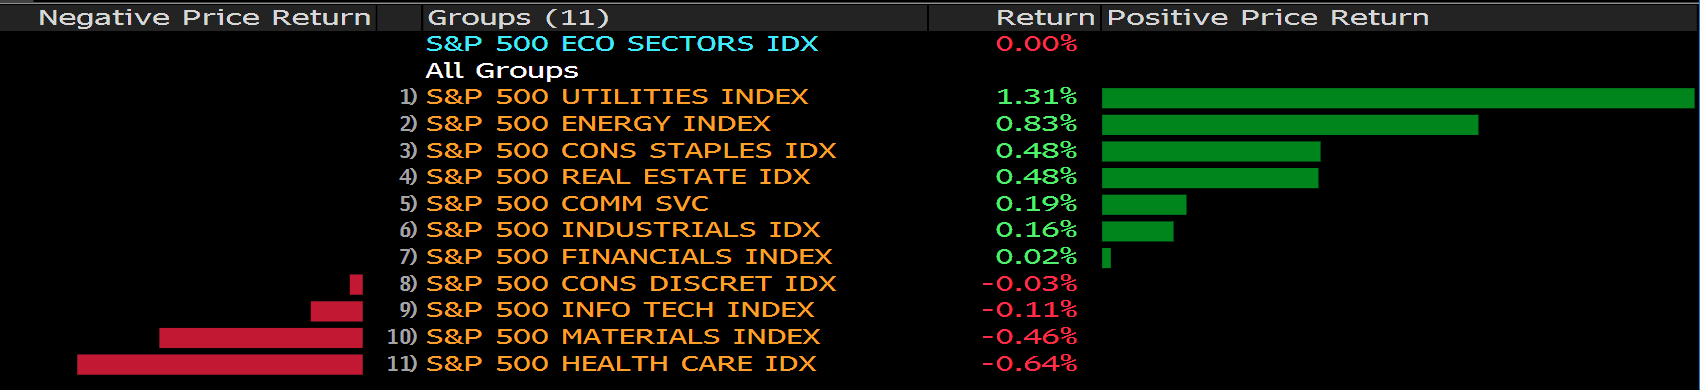
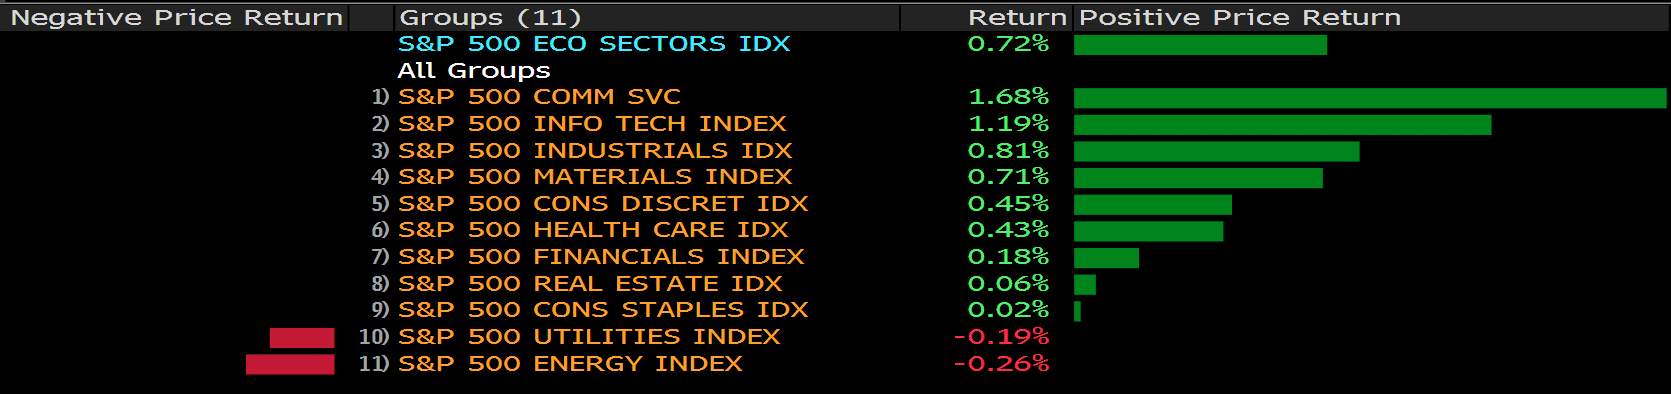
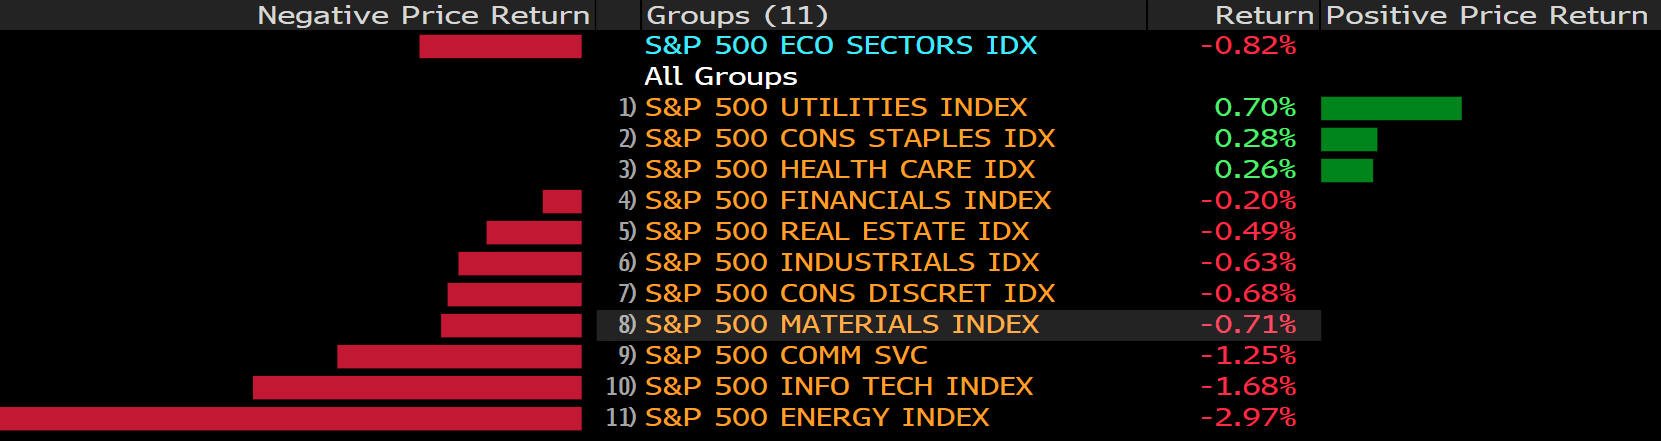
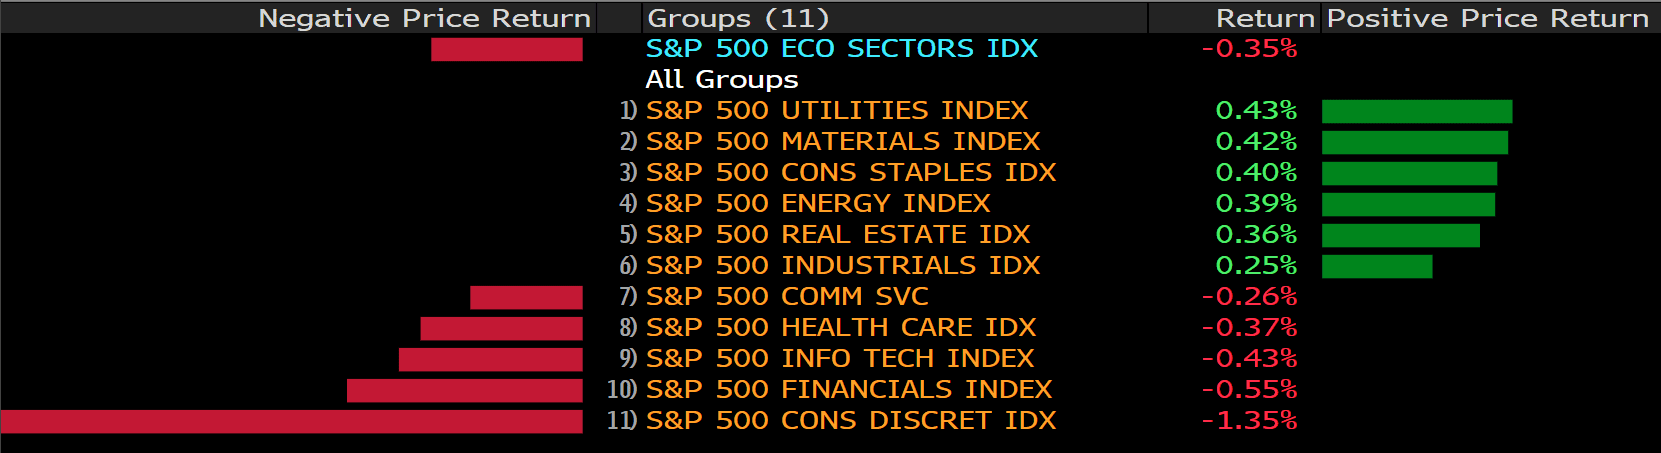
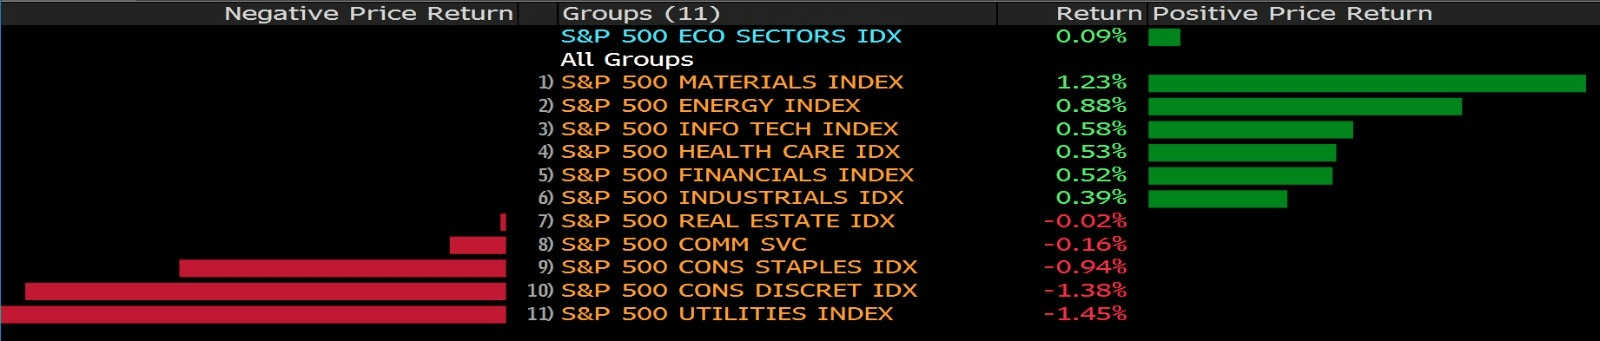
Utilities, energy and consumer staples-the defensive sector of the market-led the gains, indicating that investor sentiment remains unstable. In the utility index, Entergy Corp outperformed the market on a strong trading day, rising 3.39% to $105.04. Tyson Foods has become the largest increase in consumer staples after announcing that its fourth-quarter earnings and profits exceeded expectations. Kinder Morgan, Phillips 66 and Chevron led gains in the energy sector, thanks to UBS’s upgrade to a neutral buy rating based on higher oil price expectations. On the other hand, the rise in U.S. Treasury yields is reflected in Tesla, dragging down consumer discretionary stocks. The company’s stock price fell 1.9% and continued to fall since last week, when CEO Elon Musk sold Tesla stock worth nearly $7 billion.

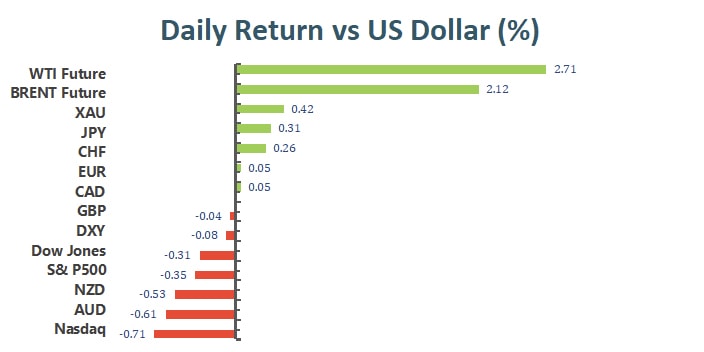
Main Pairs Movement:
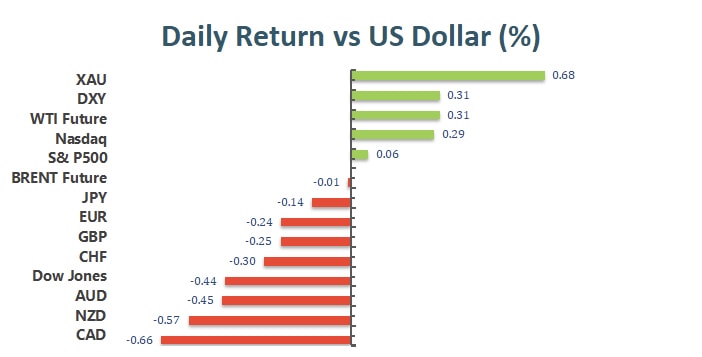
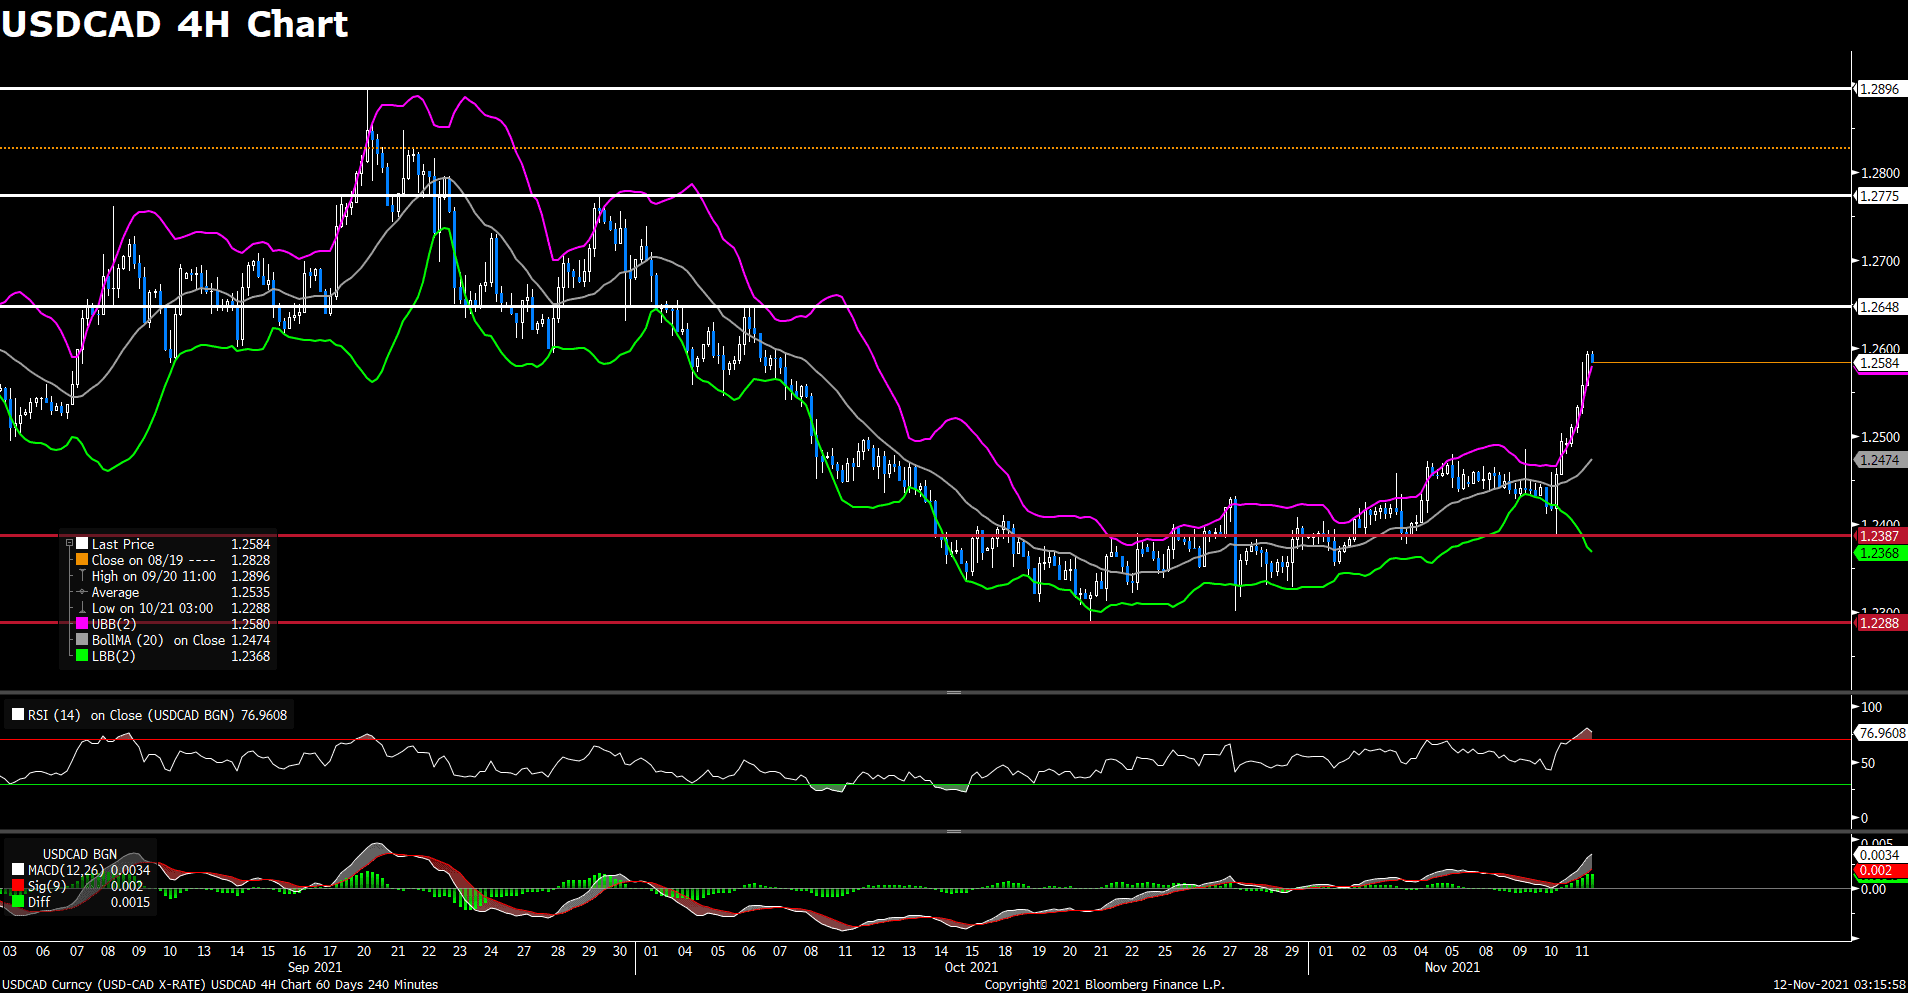
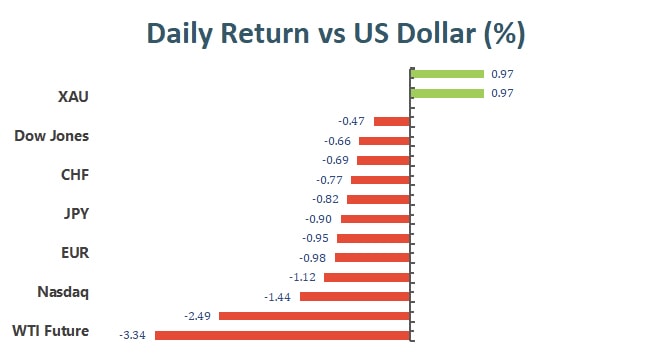
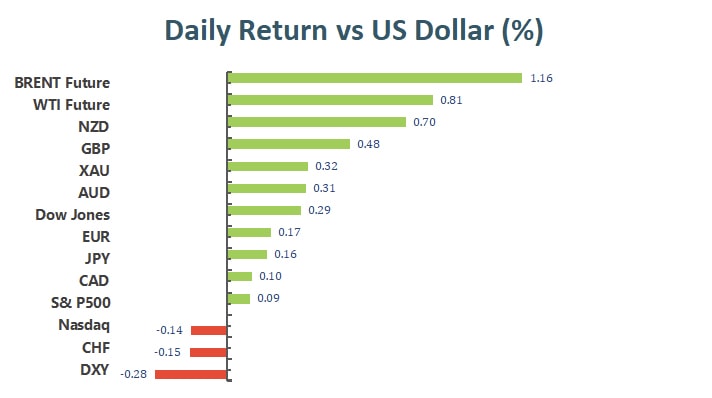
After the optimistic Chinese data, market sentiment was positive at the opening of the market, but subsided after the opening of Wall Street. U.S. Treasury yields rose without a clear catalyst. The reversal of Treasury yield gave the greenback strong momentum, pushing the US dollar index above the level of 95, which is a new high since July 2020. As the US dollar climbed, the euro performed the worst, falling to a new low of 1.1381 against the dollar in 2021.On the other hand, as inflation hit a new high in the United States, the price of gold has climbed to its highest level in nearly three months. The gold after breaking through the pivot resistance level of $1,834, gold has set a five-month high of $1,870.The next important resistance level is $1,878, then $1,900.
On Tuesday, the Bank of Australia will release the latest meeting minutes, while the US will release October retail sales data. In addition, the UK will release employment data for October.
Technical Analysis:
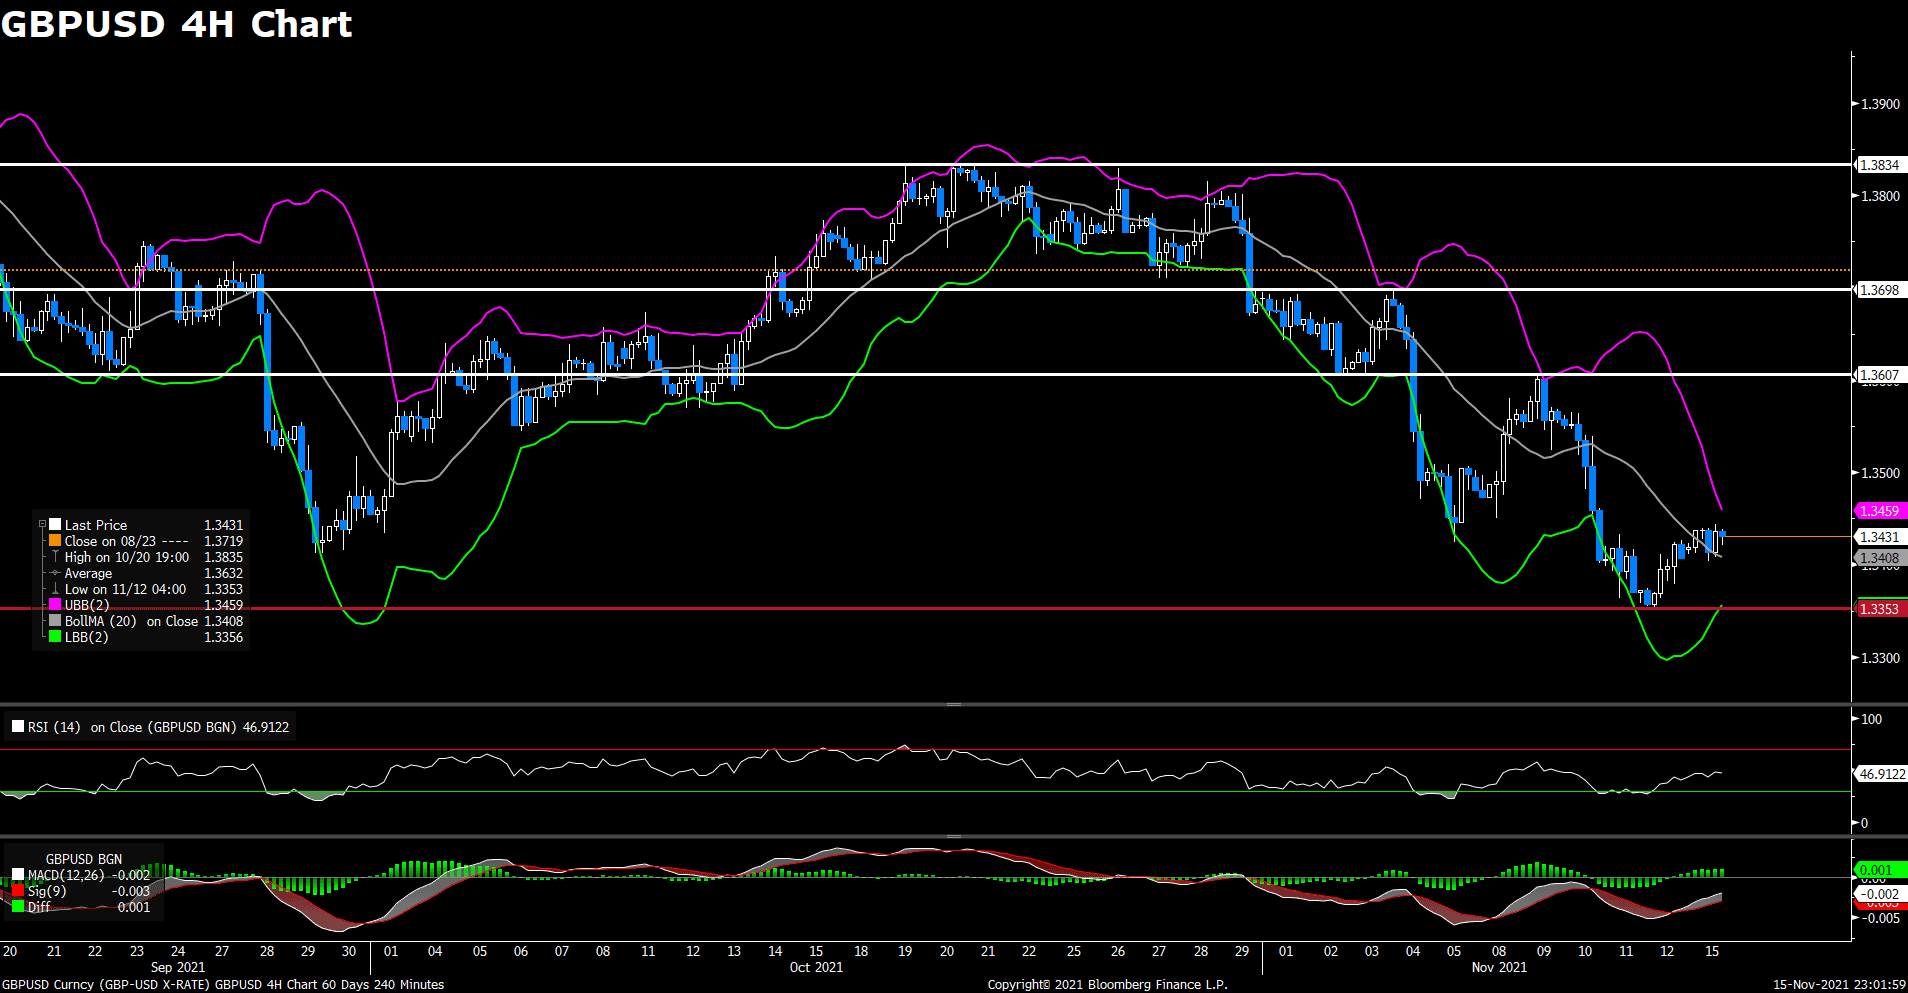
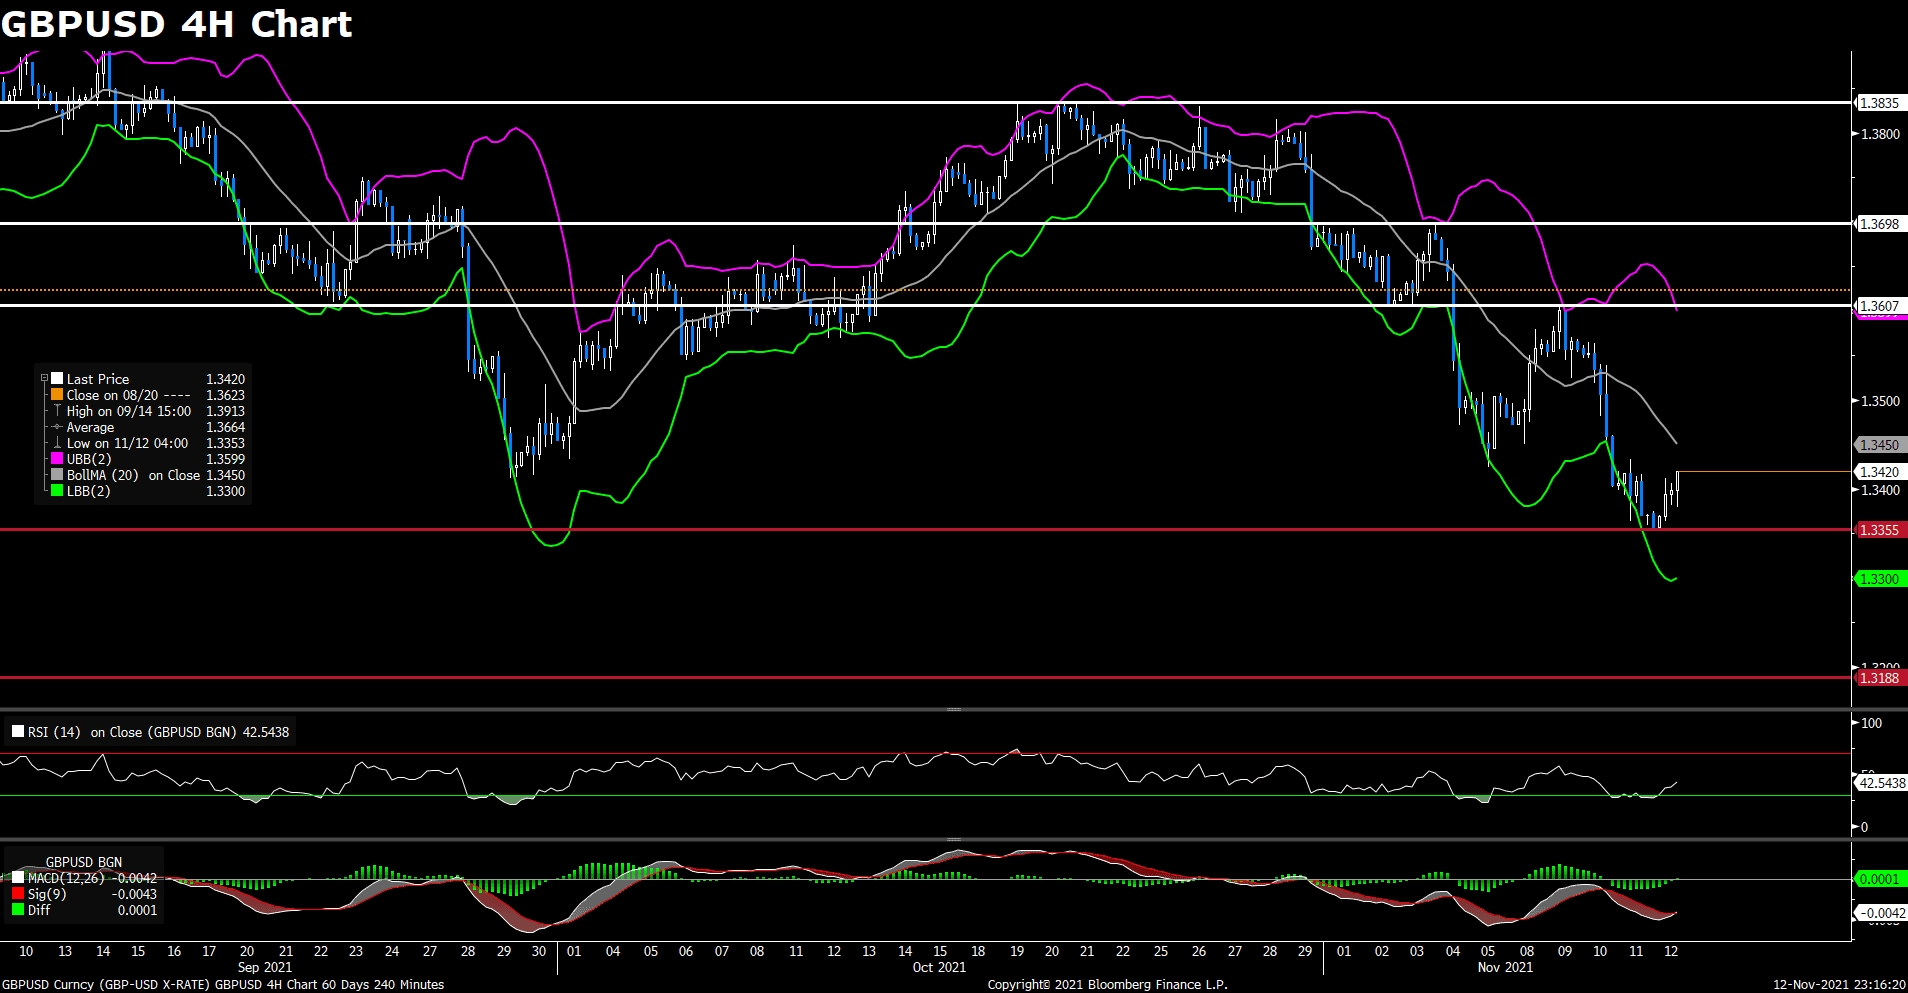
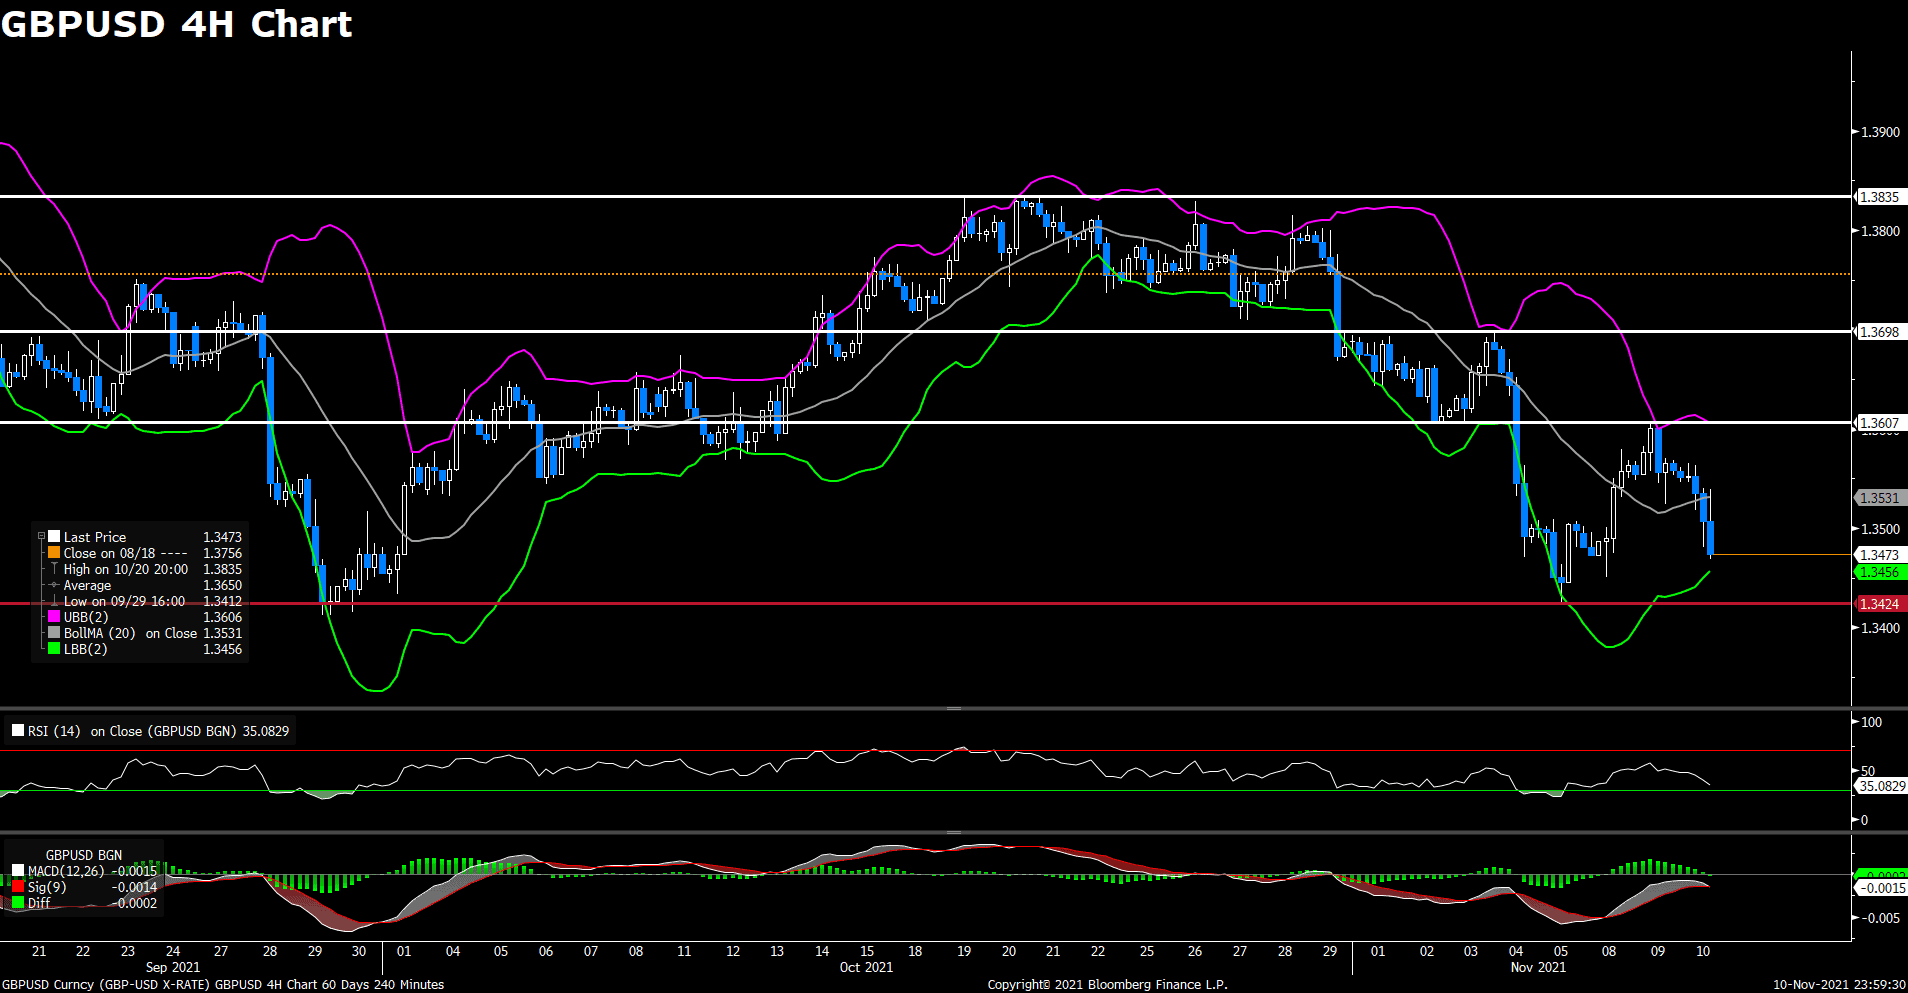
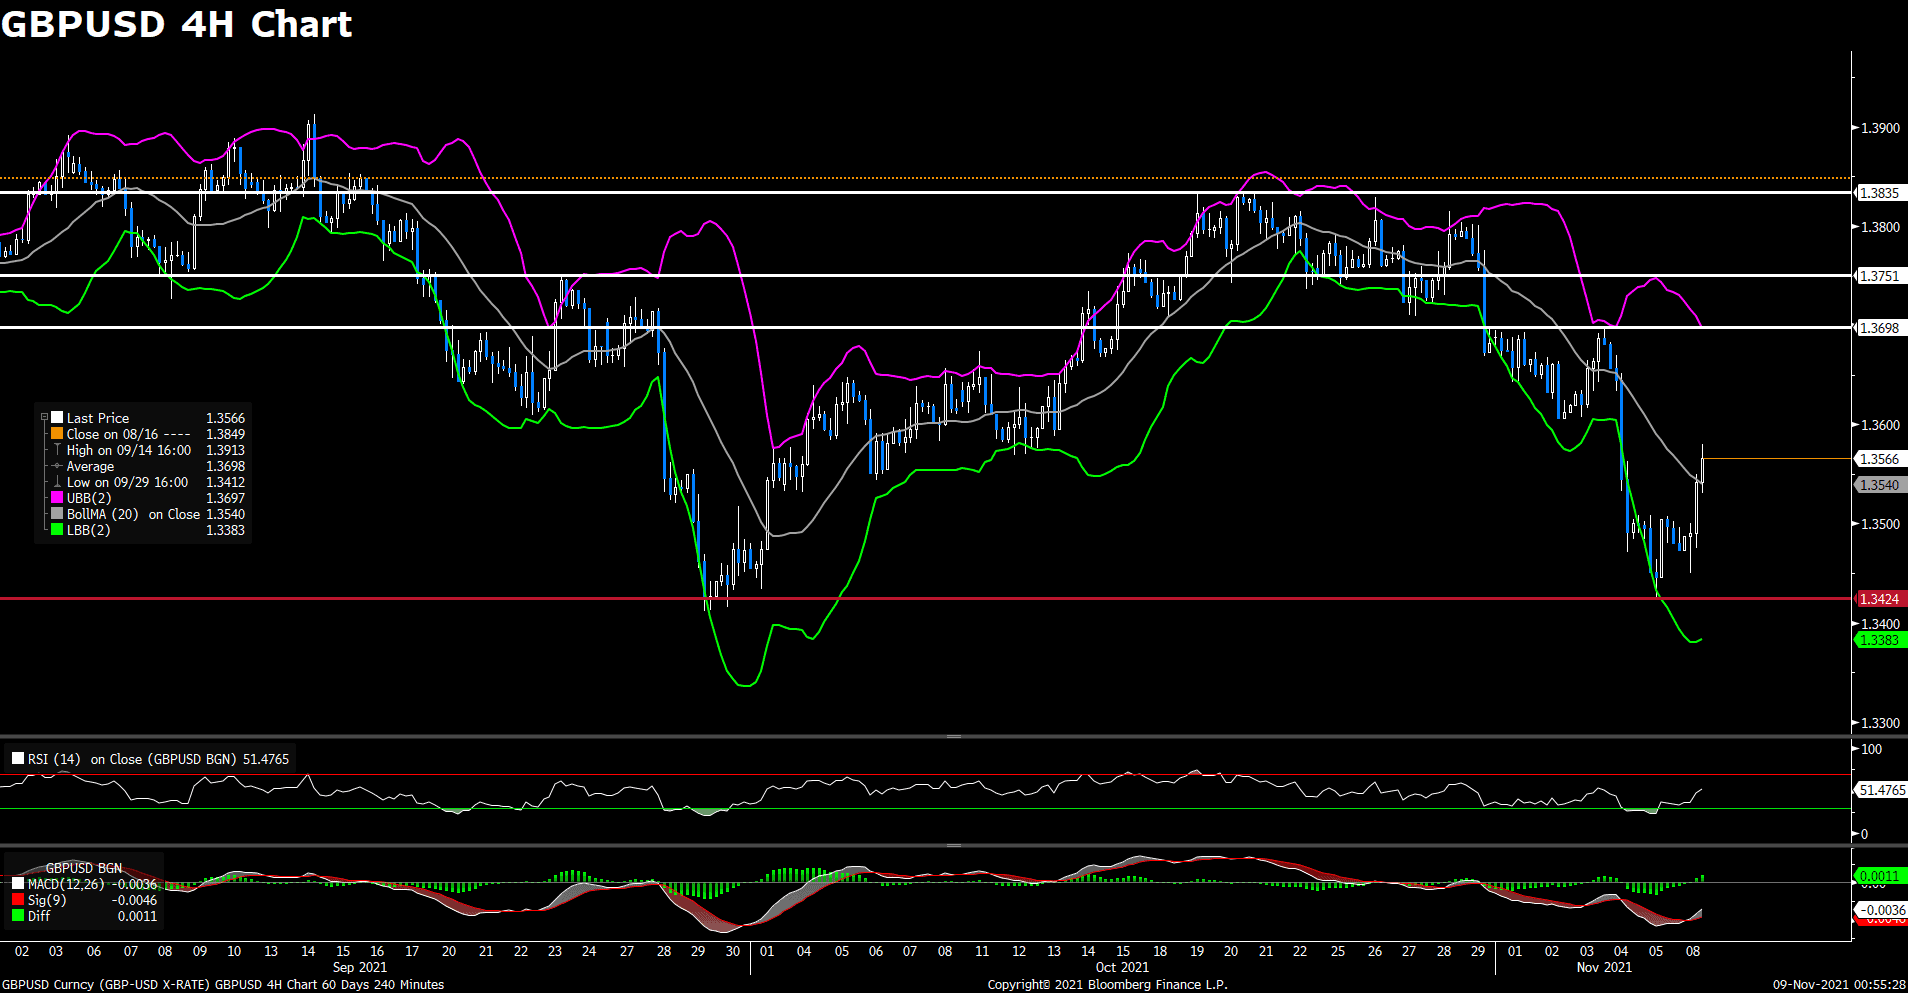
Following last Friday’s recovery move from yearly lows, the pair GBP/USD continued to rebound on Monday. The pair dropped to a daily low in early European session, but then started to see some fresh buying and climbed above 1.342 level amid US dollar’s weakness. The cable now stays in positive territory while rising 0.09% on a daily basis. The downbeat US consumer sentiment data and risk-on market sentiment undermined the safe-haven greenback and pushed the GBP/USD pair higher. However, concerns about that UK will trigger Article 16 of the Northern Ireland Protocol might cap the upside for the pair. The good news is, UK Prime Minister’s spokesman said their aim to reach a consensual solution on to the protocol remains.
For technical aspect, RSI indicator 46 figures as of writing, suggesting tepid bear movement ahead. But for the MACD indicator, the MACD is now sitting above the signal line, which also indicates a possible upward trend for the pair. Looking at the Bollinger Bands, the price rose from the lower band and crossed above the moving average, a bull market could be expected. In conclusion, we think market will be bullish as long as the 1.3353 support line holds, which is a yearly low that touched last week.
Resistance: 1.3607, 1.3698, 1.3834
Support: 1.3353

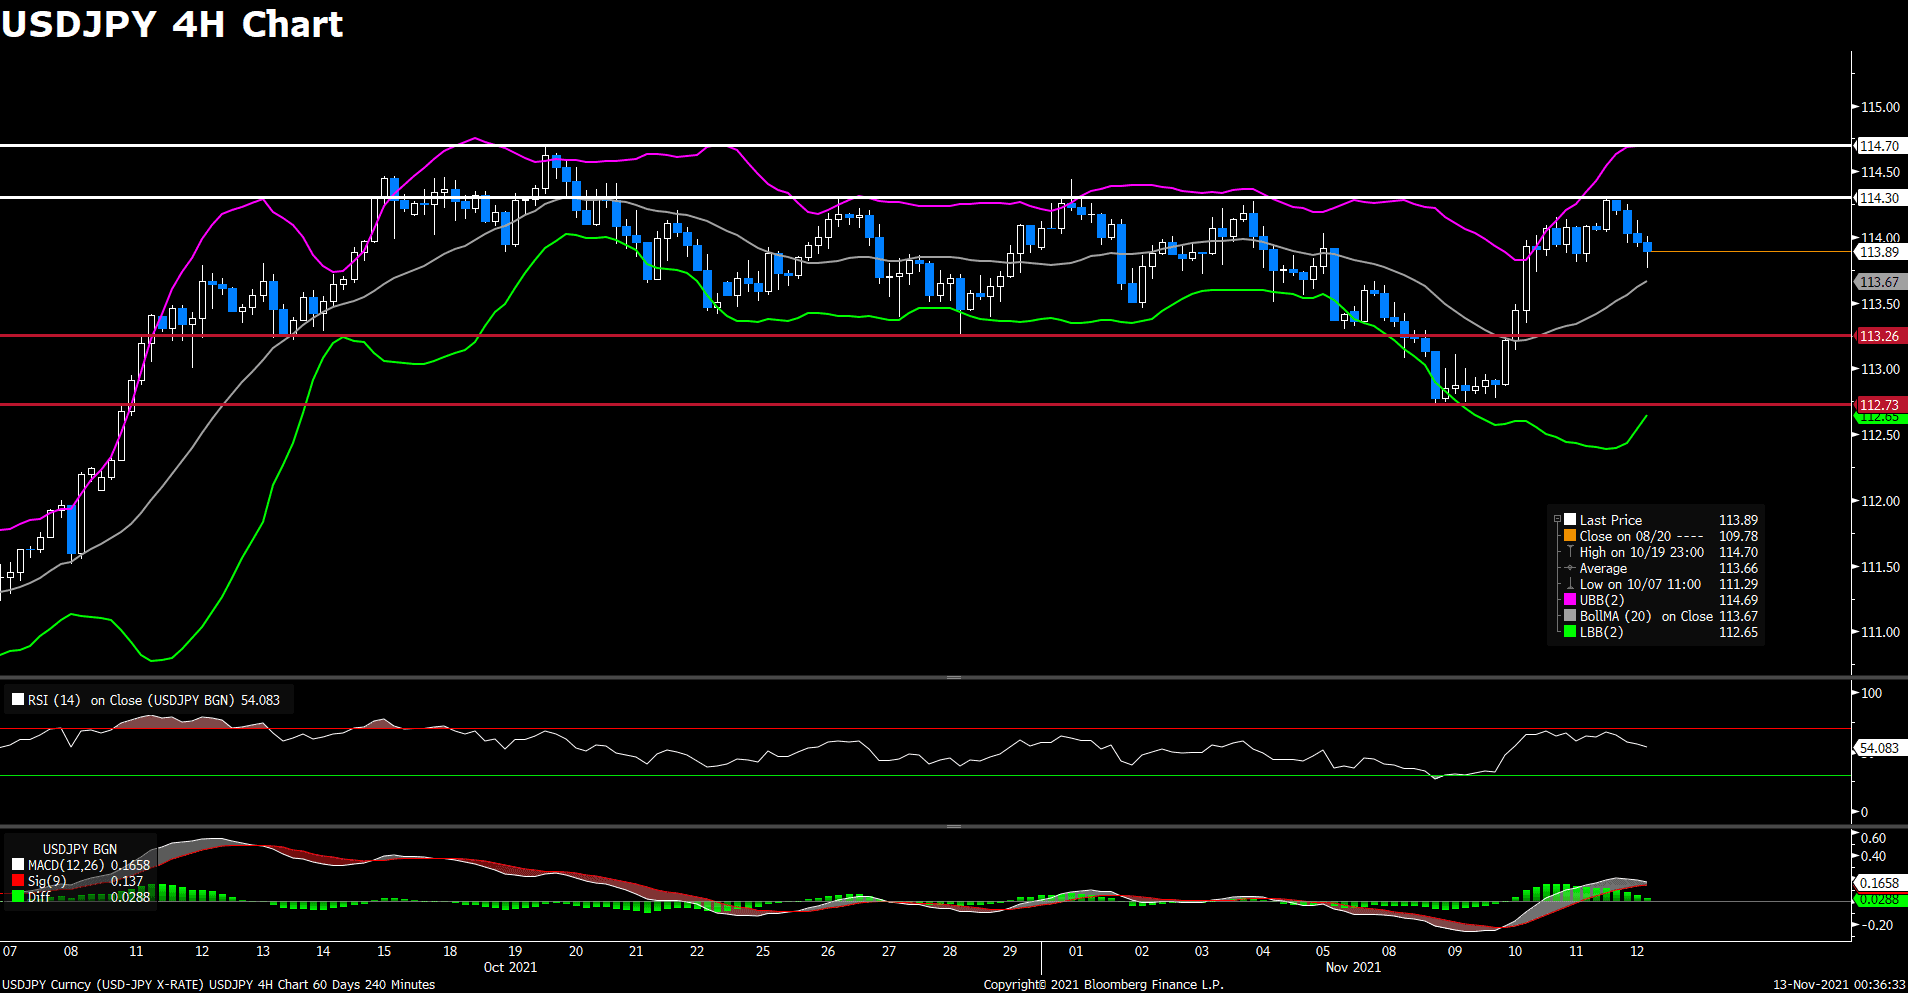
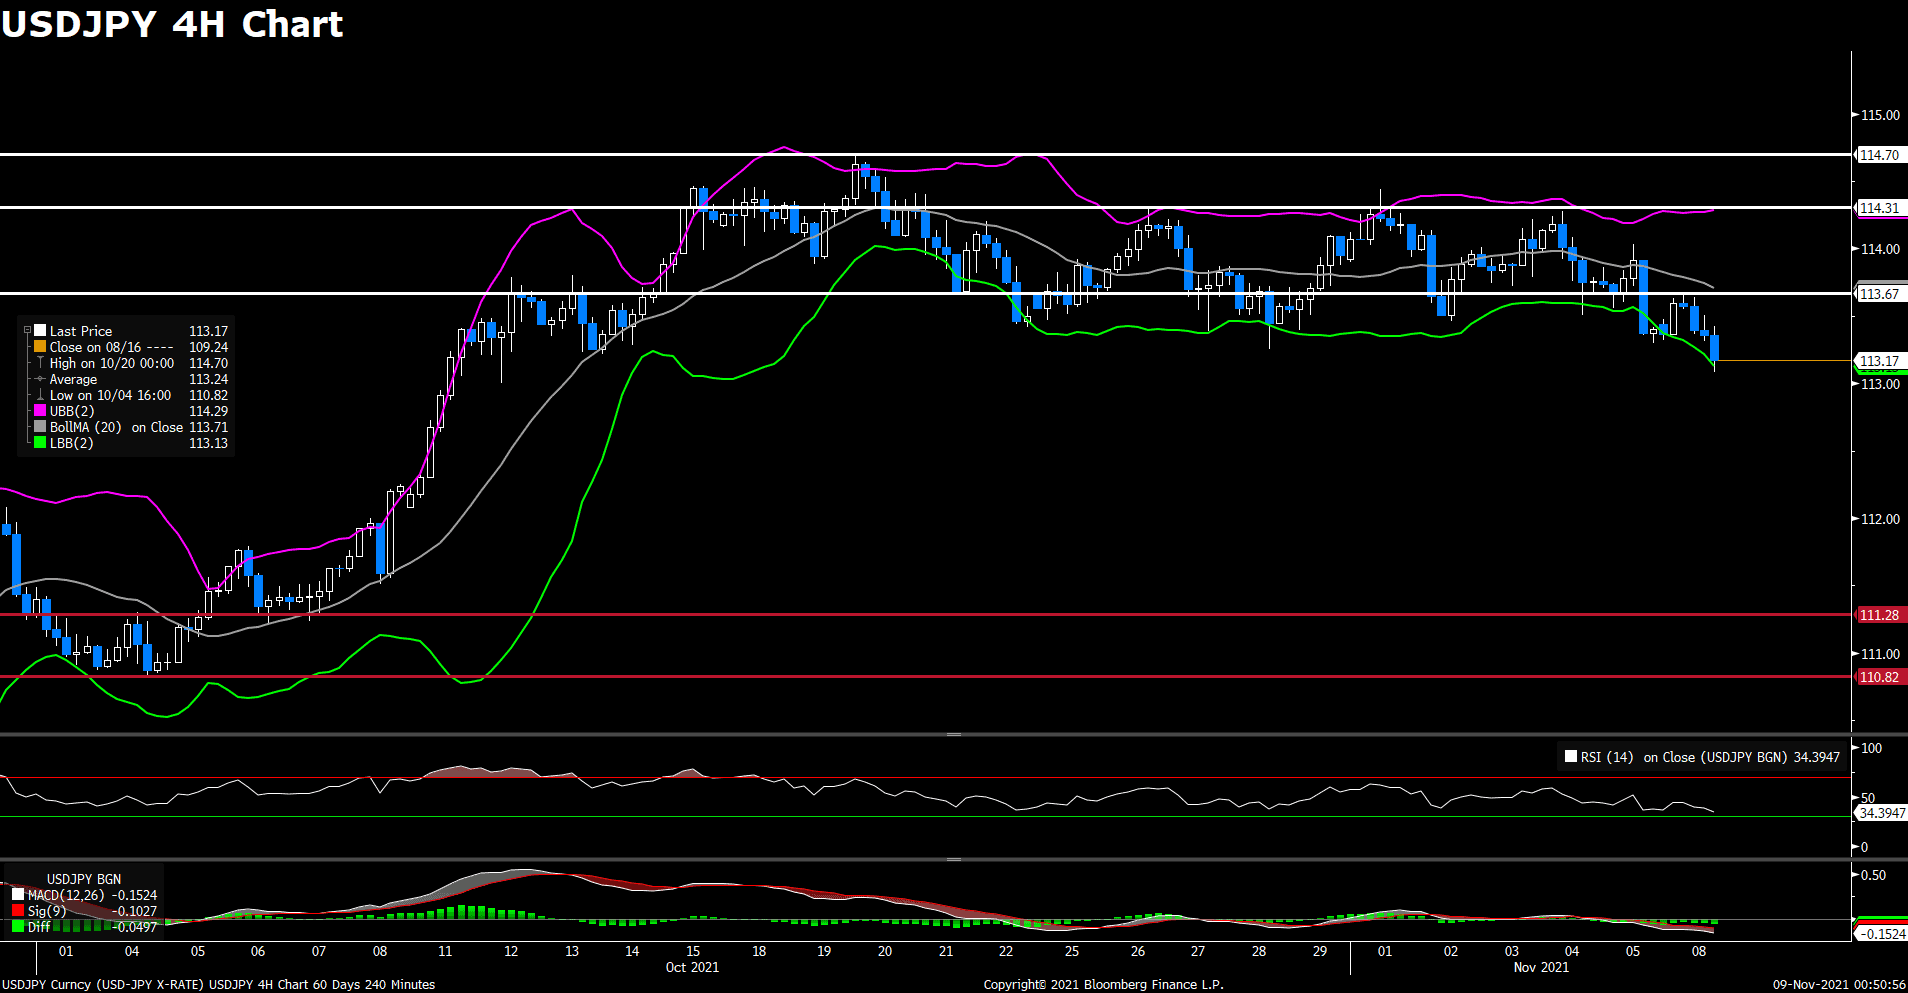
The pair USD/JPY stayed in positive territory on the first day of a new trading week, trading in a range below 114.00 level. The pair took a roller coaster ride most of the day without a specific direction, currently rising 0.20% on a daily basis. The risk-on sentiment around the equity markets and resurging US dollar strength both extended some support to the USD/JPY pair. Furthermore, the downbeat Japan Q3 GDP report which showed that the economy contracted more than expected by 0.8%, undermining the safe-haven Japanese Yen. The dovish comments by Bank of Japan Governor also kept a lid on any meaningful gains for the Yen.
For technical aspect, RSI indicator 58 figures as of writing, suggesting tepid bull movement ahead. But looking at the MACD indicator, the MACD is now sitting below the signal line, which indicates a possible downward trend for the pair. In conclusion, we think market will be bullish as the pair is heading to re-test the 114.3 resistance. If the pair break above that resistance line, a test of the monthly high at 114.70 seems likely.
Resistance: 114.30, 114.70
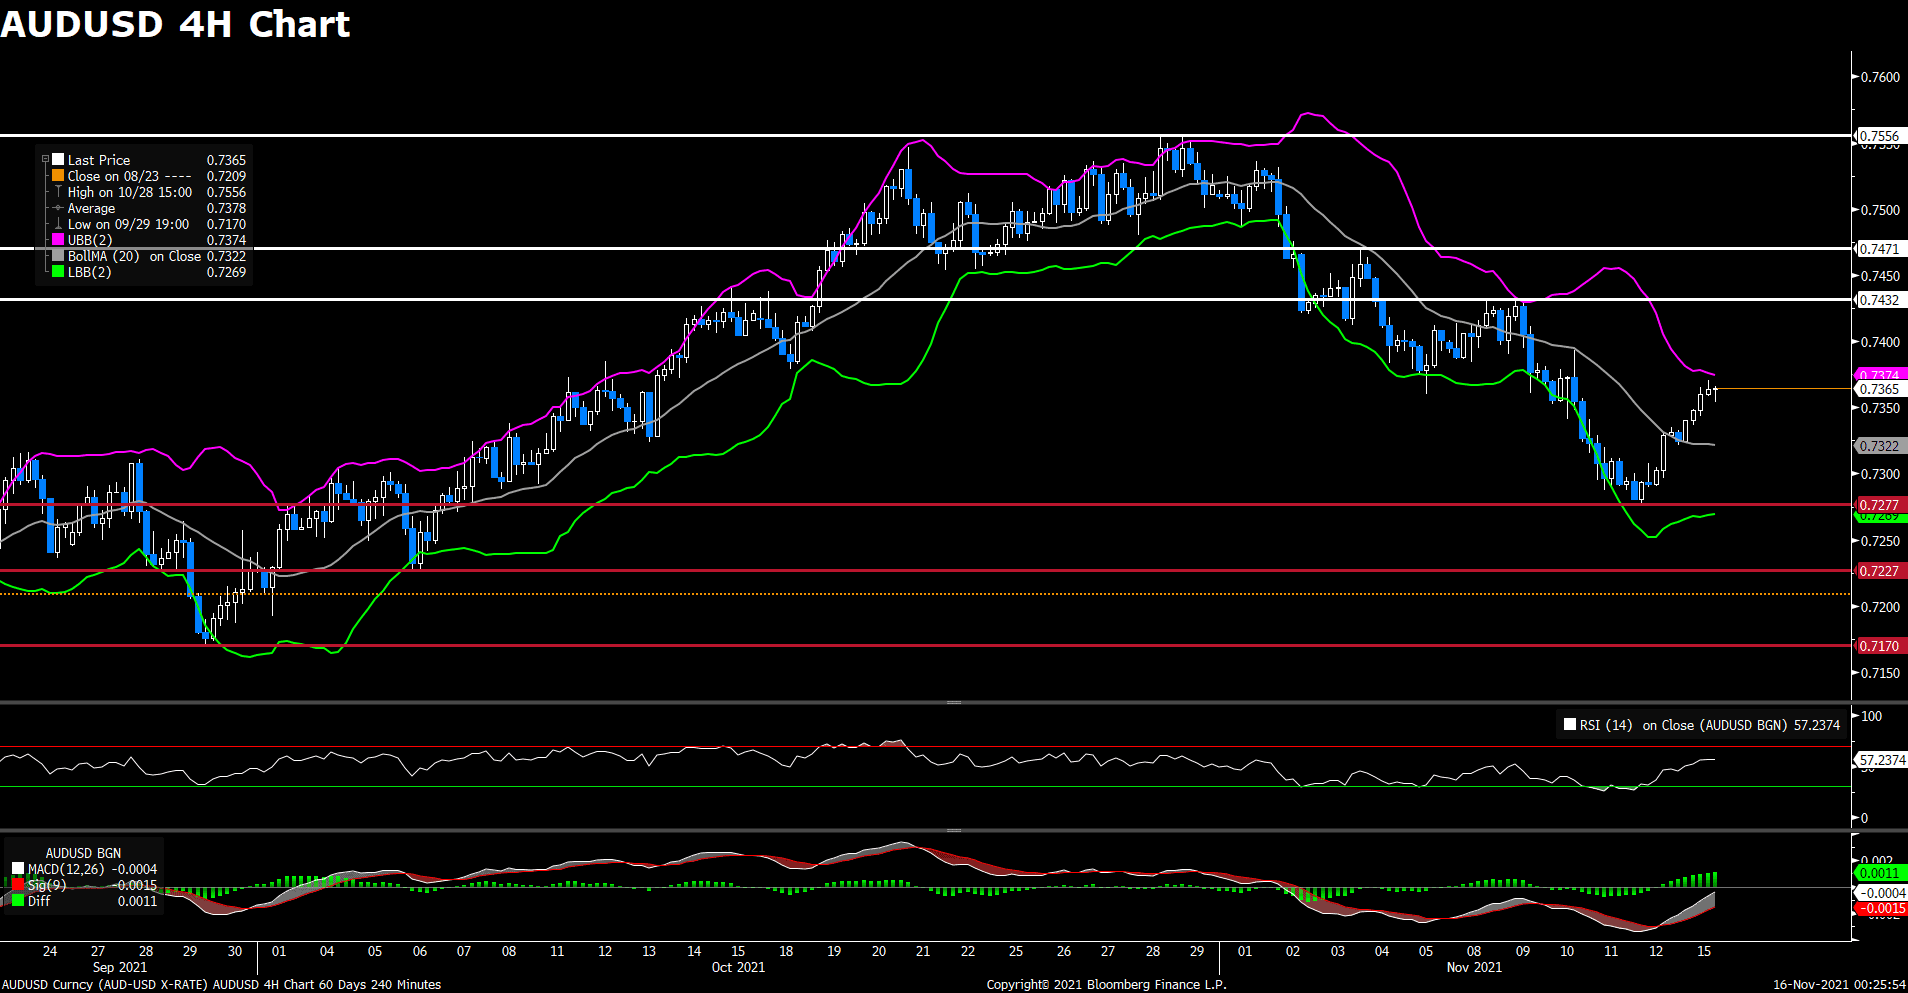
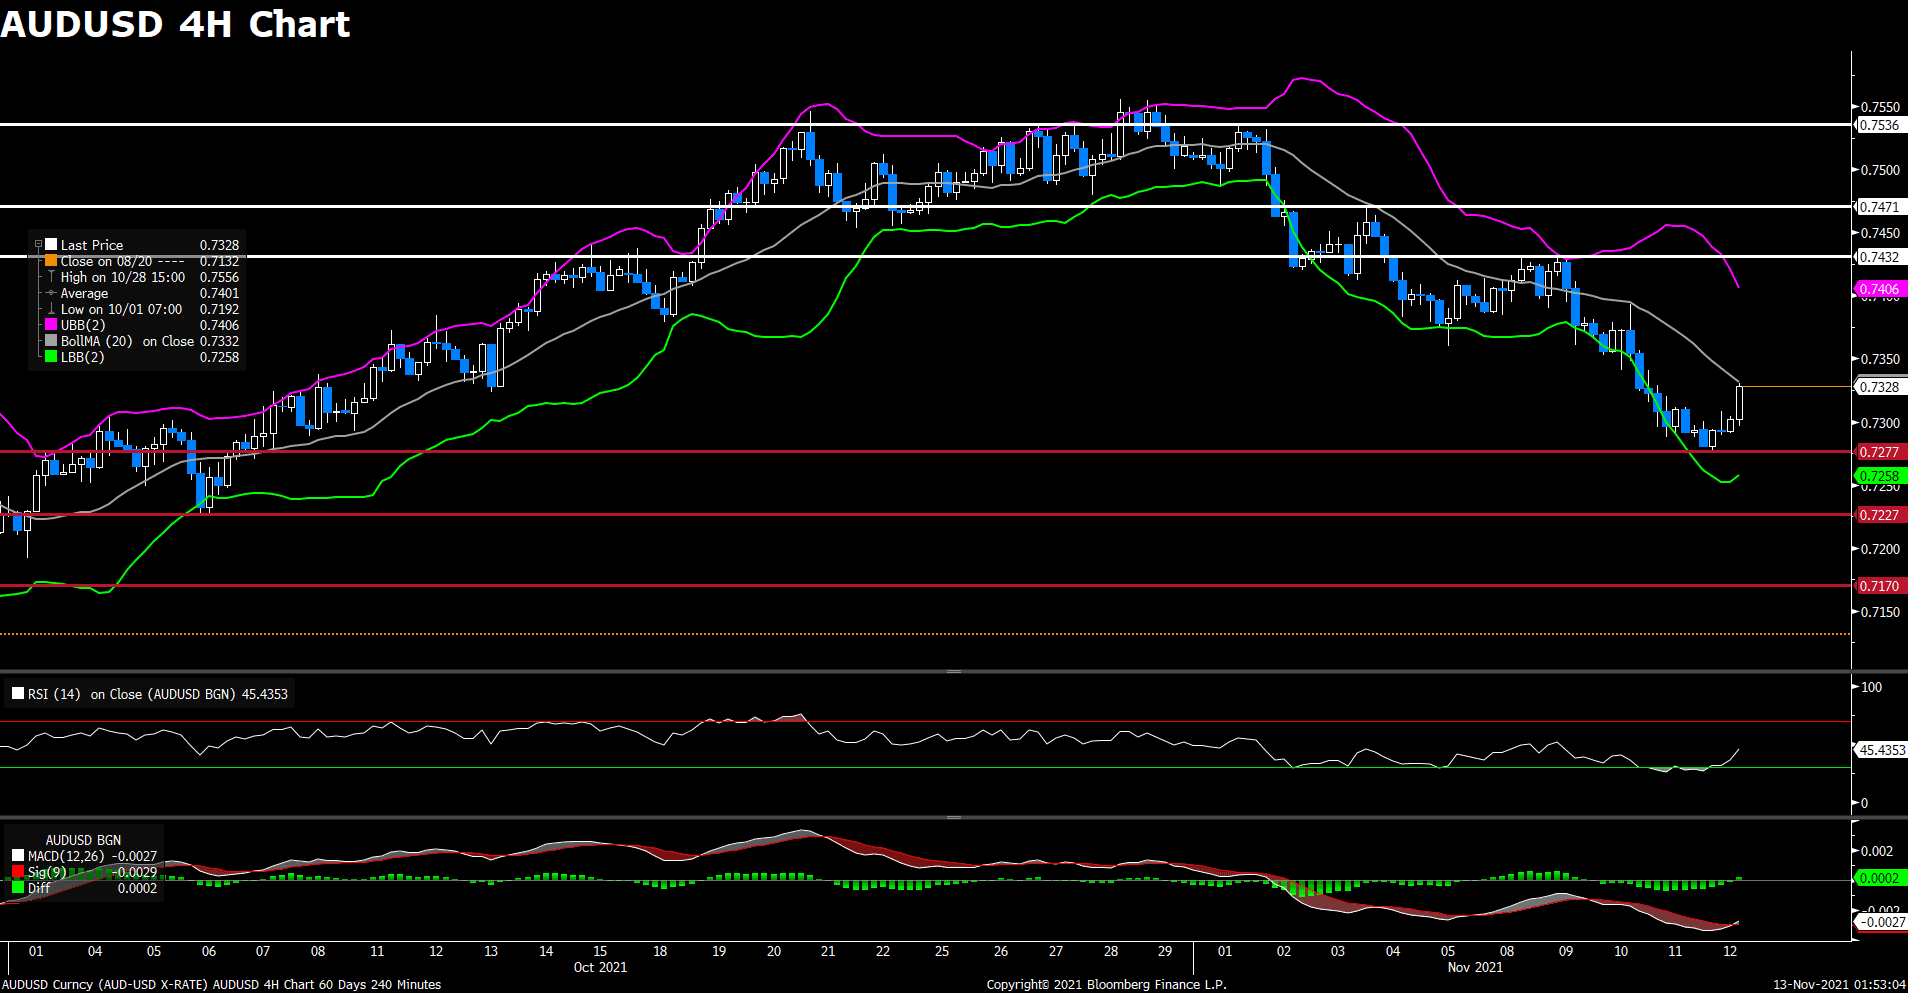
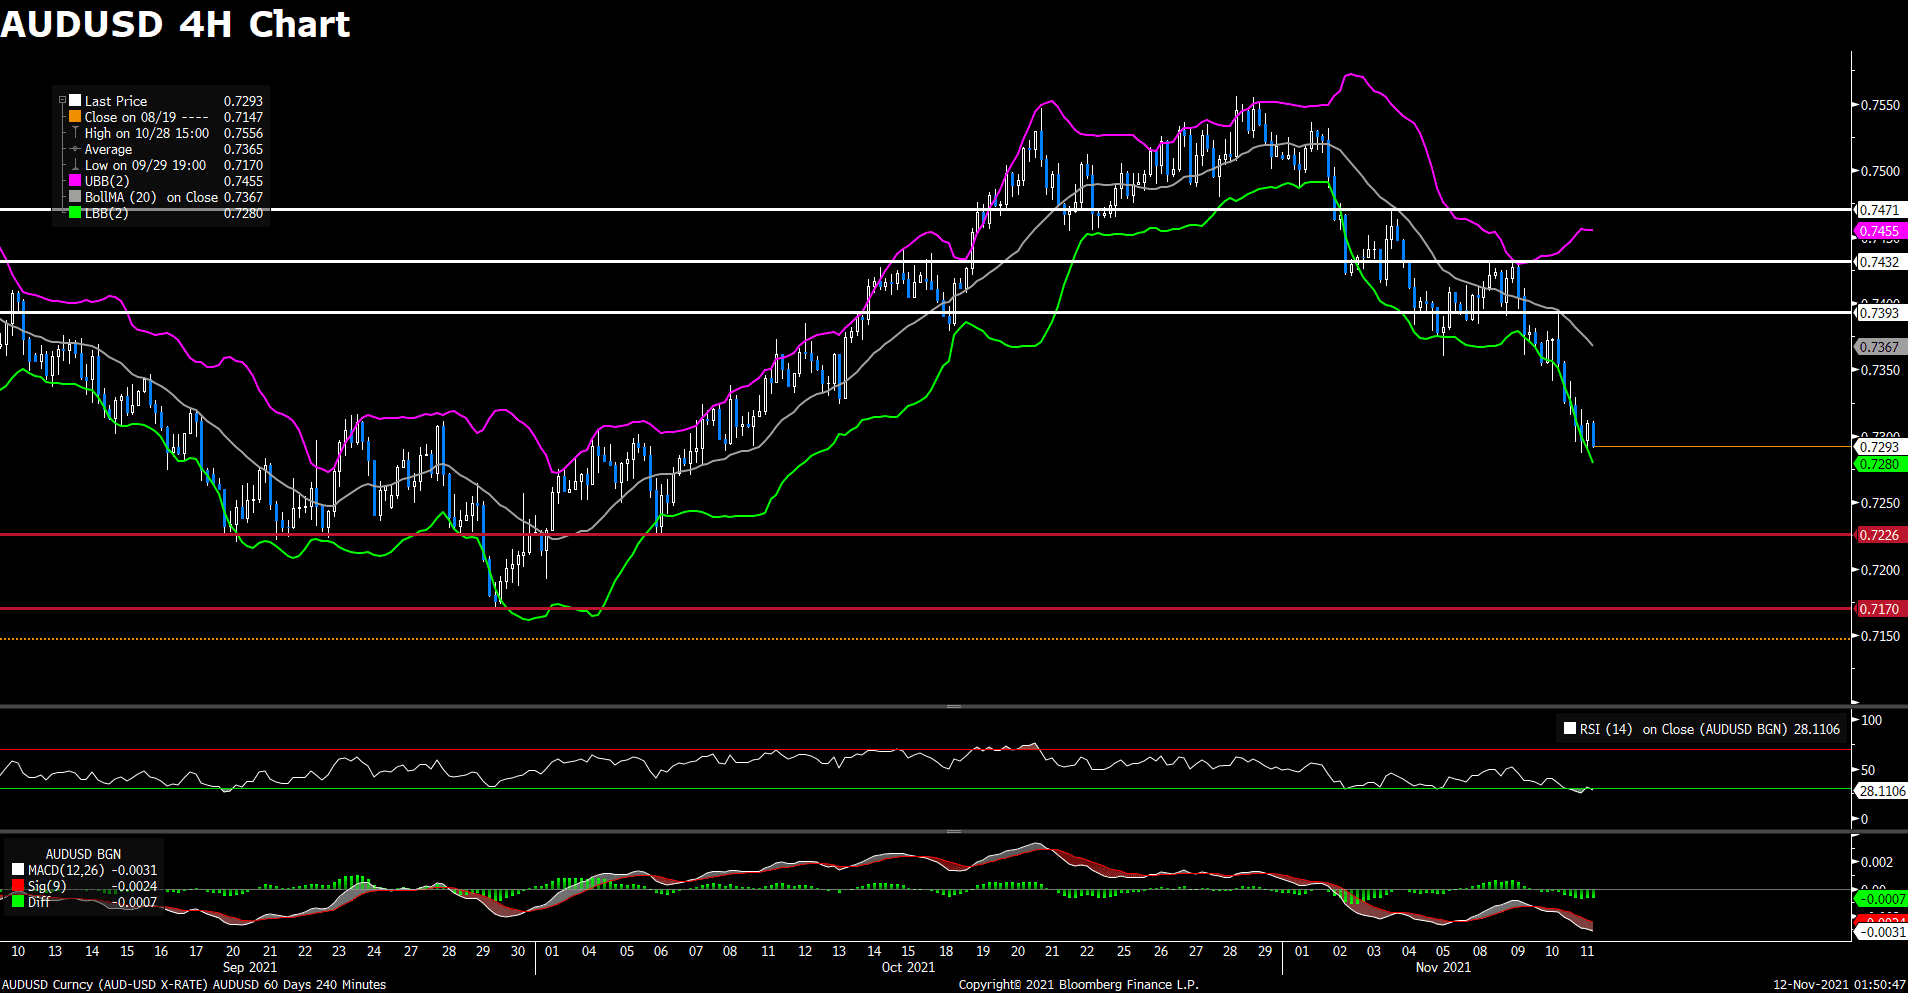
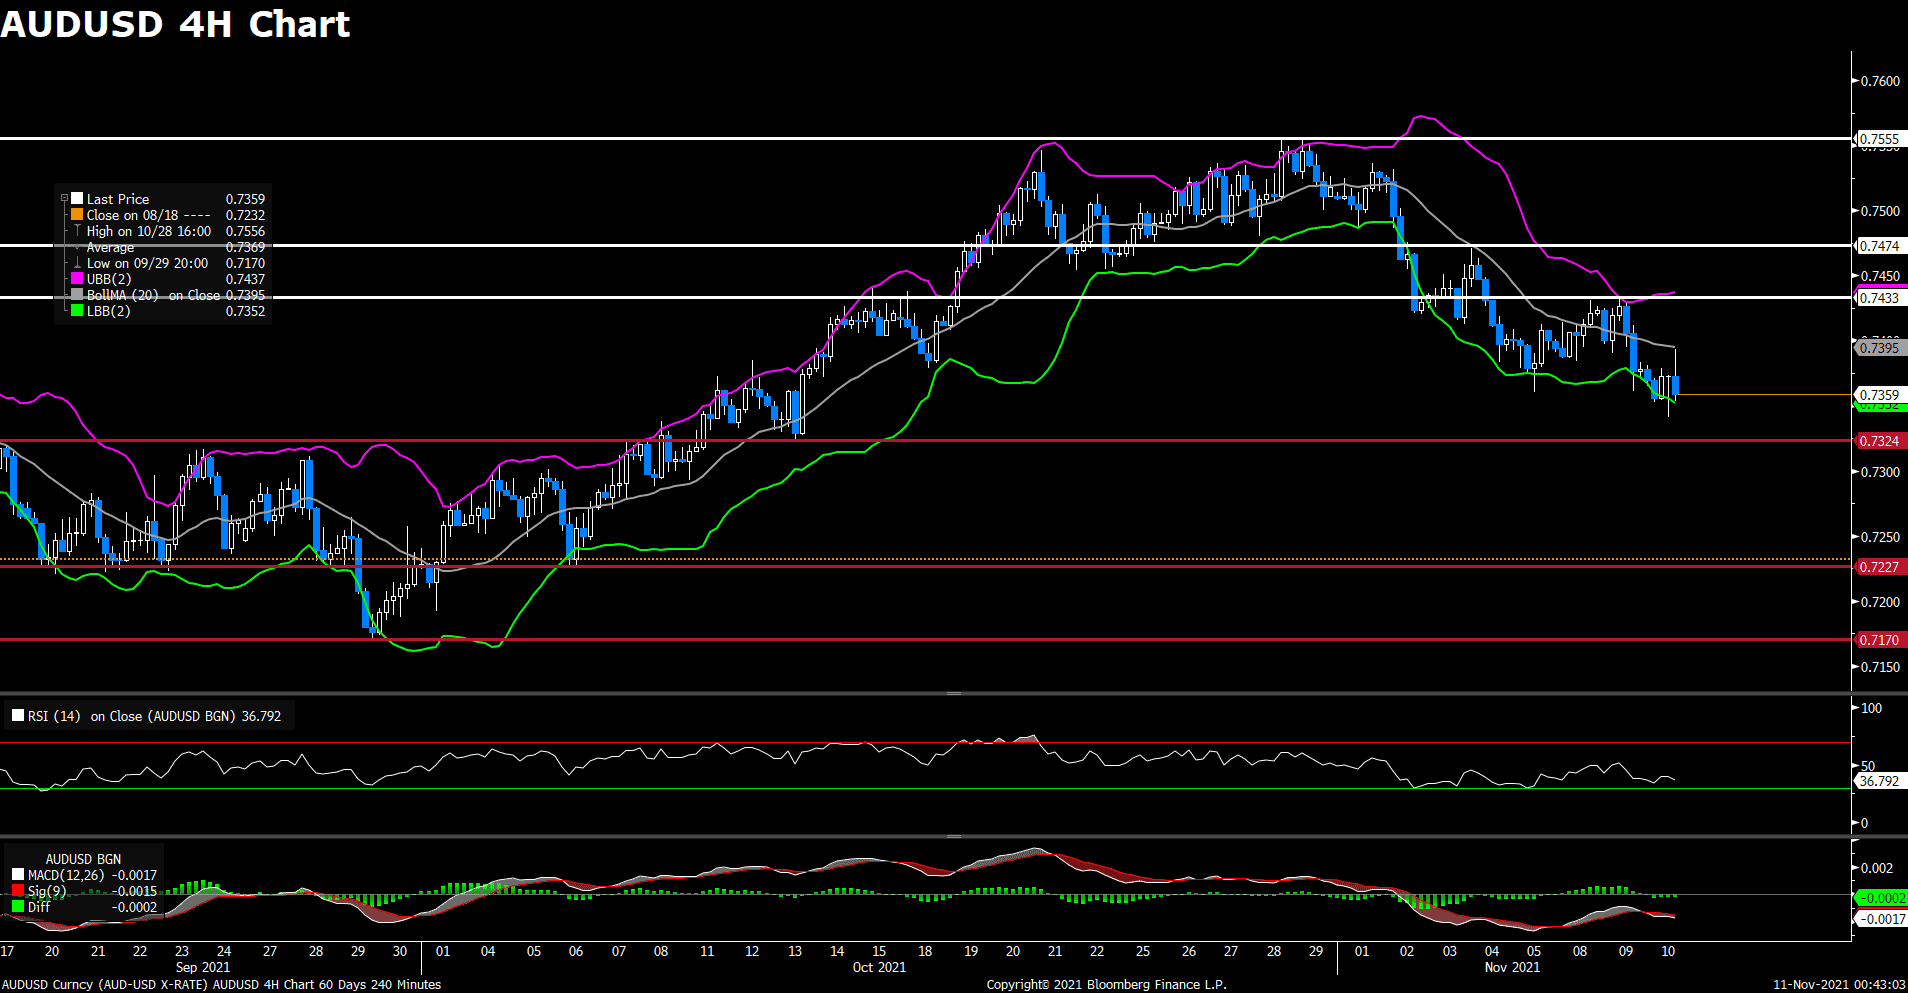
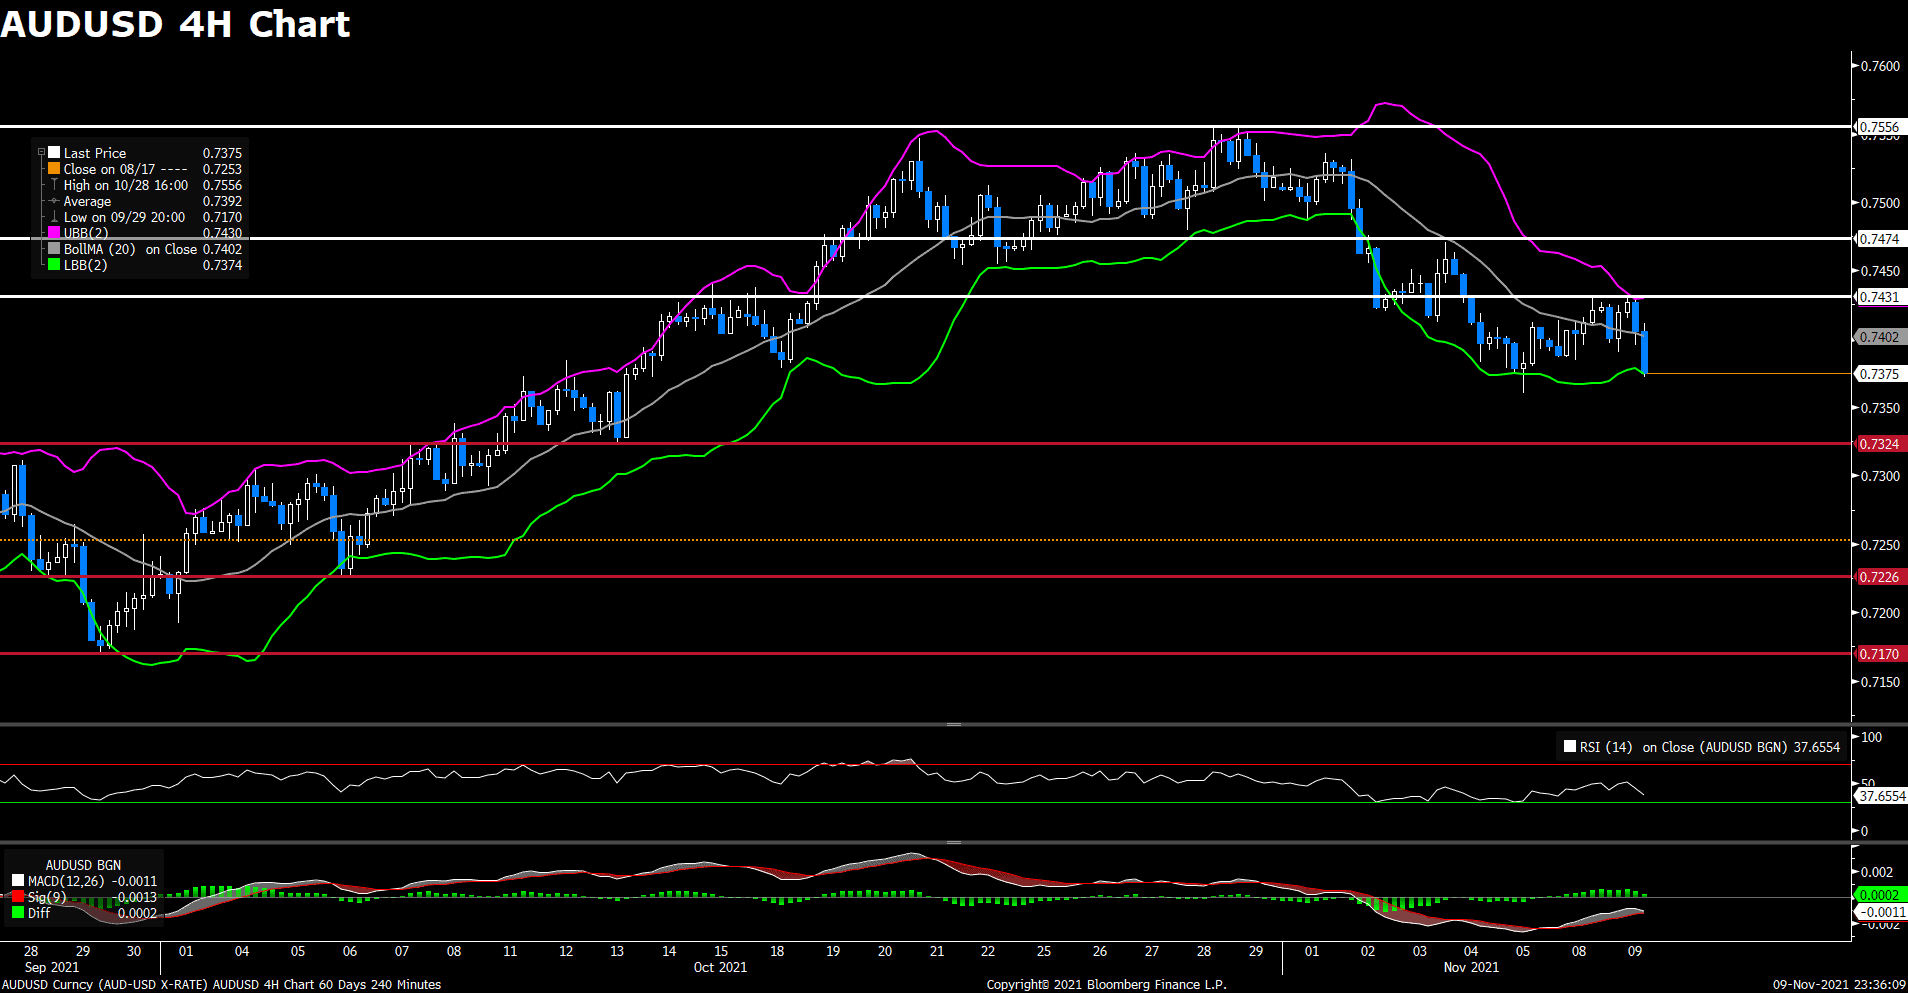
The pair AUD/USD advanced on Monday, gaining some bullish momentum for the second day amid the underlying bullish sentiment in the financial markets. The pair touched a three-day top near 0.737 level in mid-European session, now retreated slightly and pared some of its intraday gains. The recent buying witnessed in AUD/USD pair is mainly due to stronger Chinese macro data today. As the Chinese Industrial Production rose 3.5% in October, while Retail Sales rose 4.9%, both above economist’s forecasts. In addition to that, the risk-on market mood also acted as a tailwind for the riskier Aussie. Investors now await the RBA meeting minutes and RBA Governor’s speech tomorrow for trading impetus.
For technical aspect, RSI indicator 57 figures as of writing, suggesting bull movement ahead. Looking at the MACD indicator, the positive histogram shows big distance between the MACD and its signal line, which means bullish momentum is high. As for the Bollinger Bands, the price crossed above the moving average and ready to touch the upper band, which could be a buying signal for the pair. In conclusion, we think market will be bullish as the pair is eyeing a test of the 0.7432 resistance.
Resistance: 0.7432, 0.7471, 0.7556
Support: 0.7277, 0.7227, 0.7170
Economic Data
|
Currency |
Data |
Time (GMT + 8) |
Forecast |
||||
|
AUD |
RBA Meeting Minutes |
08:30 |
|||||
|
GBP |
Average Earnings Index +Bonus (Sep) |
15:00 |
5.6% |
||||
|
GBP |
Claimant Count Change (Oct) |
15:00 |
|||||
|
USD |
Core Retail Sales (MoM) (Oct) |
21:30 |
1.0% |
||||
|
USD |
Retail Sales (MoM) (Oct) |
21:30 |
1.2% |
||||