Market Focus
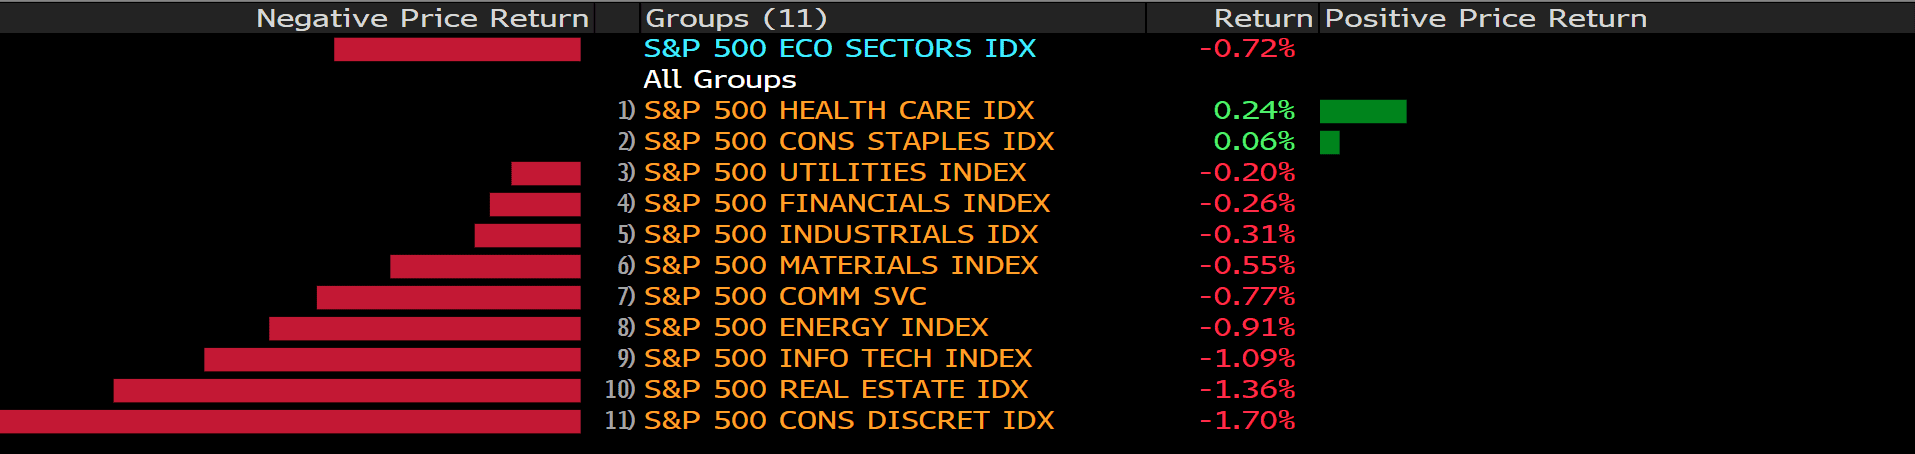
US stocks fell on Monday due to concerns about the Omicron coronavirus variant before the Federal Reserve meeting later this week. The decline was mainly concentrated in the oil and gas, consumer services and technology sectors. At the end of the market, the Dow Jones Industrial Average lost 0.89% to 35,650.96 points, the S&P 500 index lost 0.91% to 4,668.98 and the Nasdaq Composite Index, dropped 1.39%.
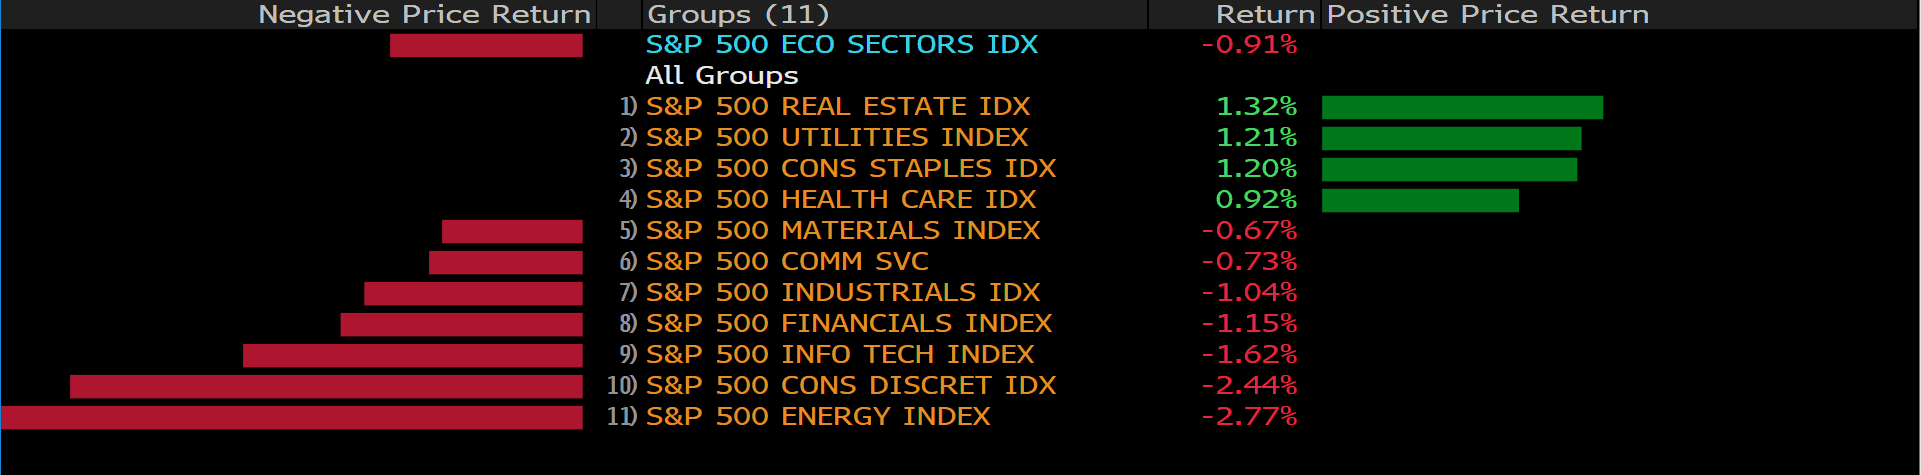
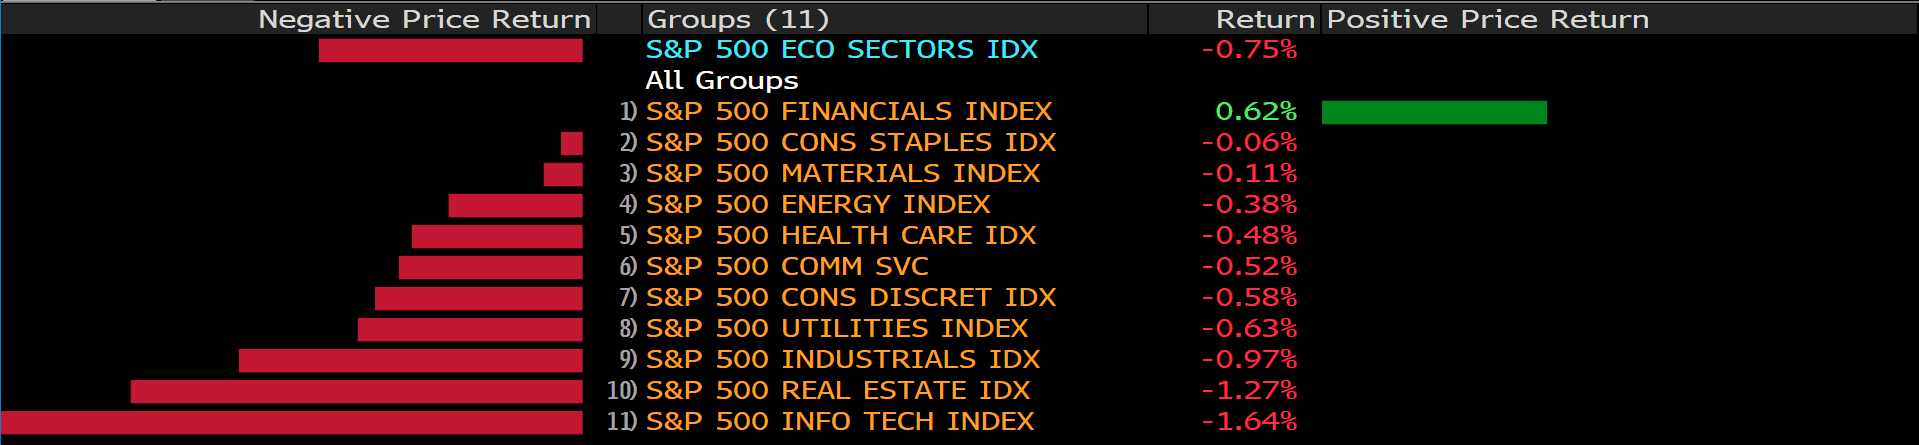
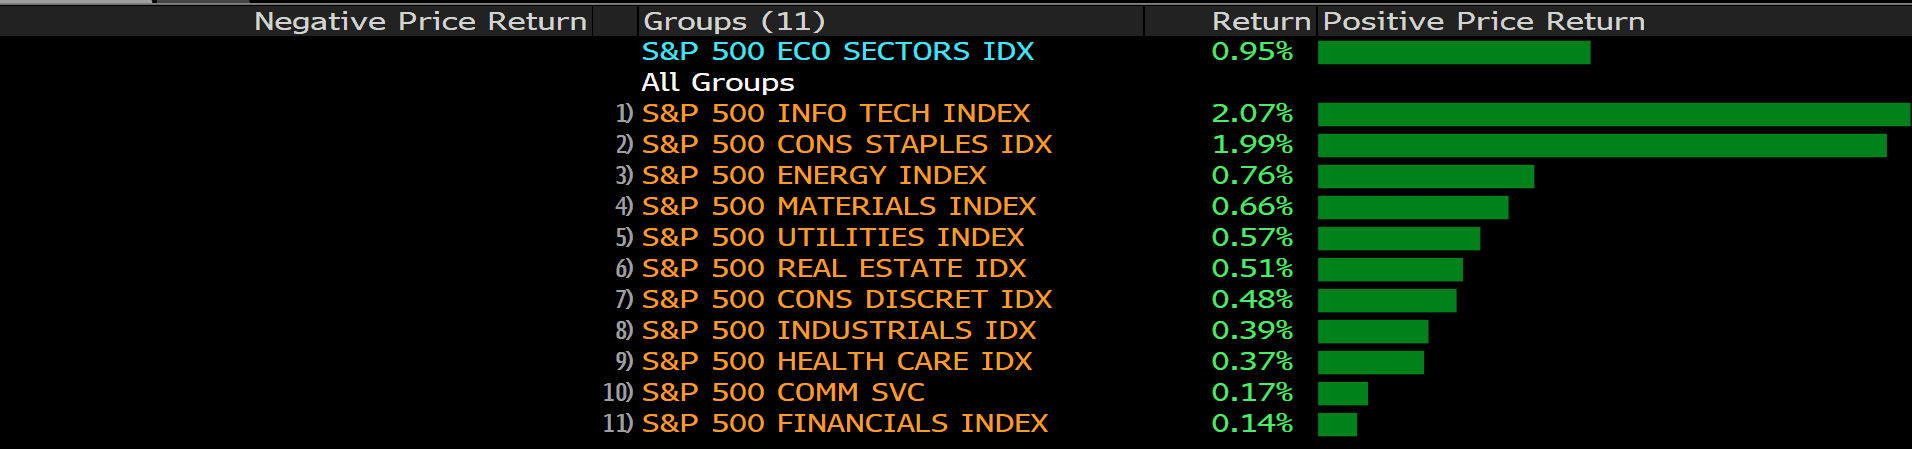
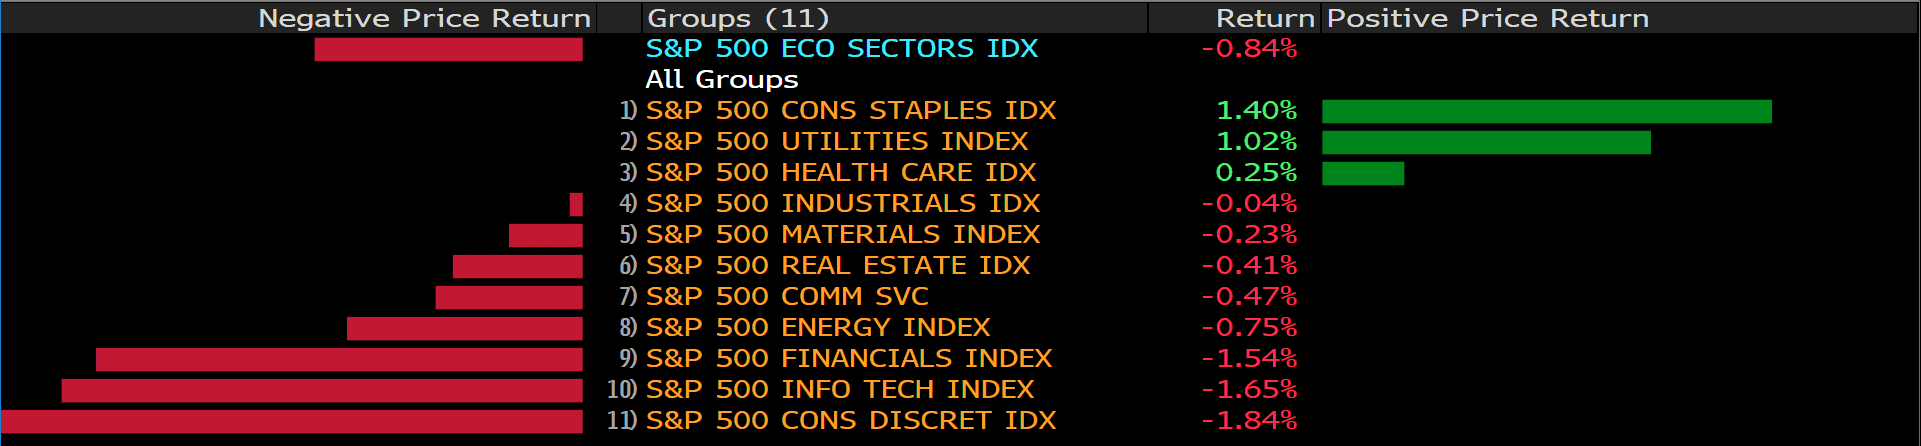
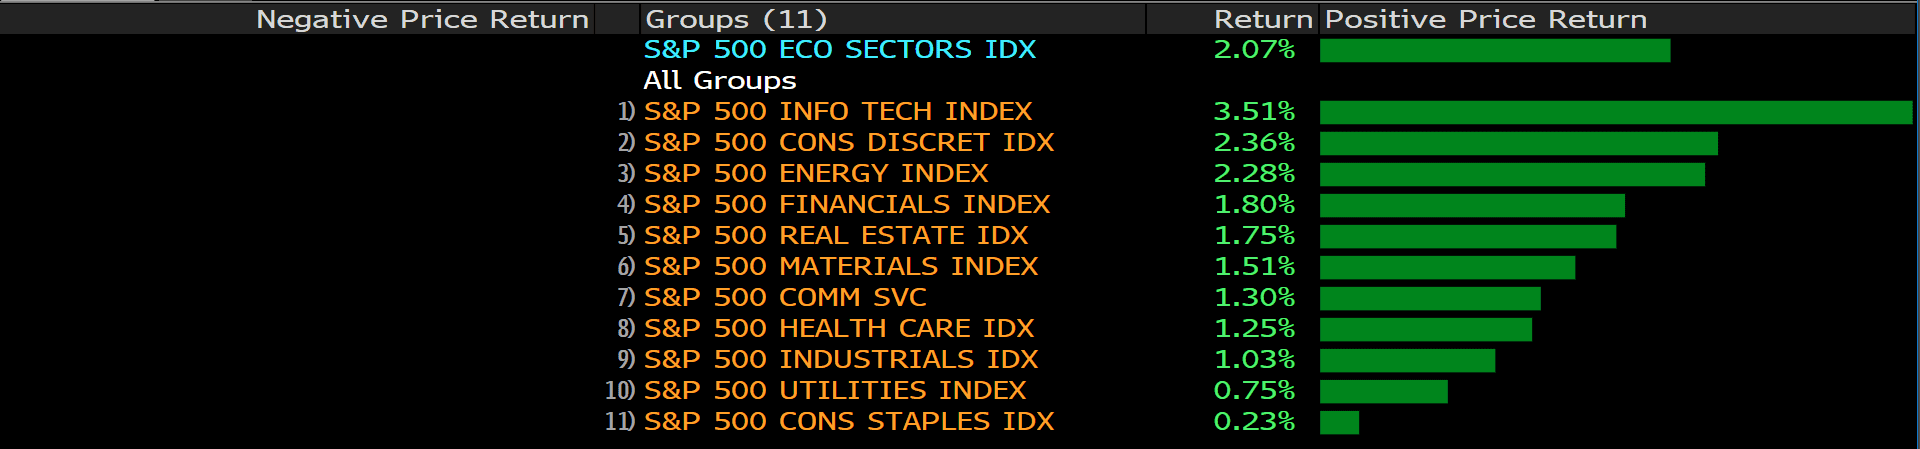
Seven of the 11 major sectors of the S&P 500 fell, with only defensive stocks such as real estate, utilities, consumer staples and healthcare rising. Travel-related stocks fell because the fast-spreading Omicron accounted for about 40% of COVID-19 infections in London, and at least one person died in the UK. On the other hand, the best-performing stock in the Dow Jones Industrial Average was Coca-Cola Company, which rose 2.63%, Walmart rose 1.80% and Johnson & Johnson rose 1.79% in late trading. The worst performing stock was Boeing, which fell 3.74%, the Dow fell 2.49% and the Home Depot fell 2.45%. In addition, the best performing company in the Nasdaq Composite Index was SeaChange International Inc, which rose 128.81%, Arena Pharmaceuticals Inc soared 80.38% after Pfizer agreed to acquire a $6.7 billion all-cash transaction, Pfizer also rose 5.3%, and Foghorn Therapeutics Inc rose 54.96%. The worst performers were Nisun International Enterprise Development Group Co Ltd, which fell 60.29%, X4 Pharmaceuticals Inc fell 44.13%, and IGM Biosciences Incclose fell 41.31%.
Main Pairs Movement:
The three most important central banks in the world will hold their last monetary policy meeting in 2021, which will exacerbate weak sentiment. The Federal Reserve will announce its monetary policy decisions on Wednesday, while the Bank of England and the European Central Bank will announce their monetary policy decisions on Thursday. Concerns about how the ongoing Omicron epidemic might affect such decisions and global economic growth continue. At the same time, the UK reported its first death related to the Omicron variant, which stimulated market risk aversion.
In the US Treasury market, the 10-year long-term Treasury bond yields fell, and the 20-year and 30-year Treasury yields fell 7-8 basis points to close at 1.414%, 1.84% and 1.80%, respectively.
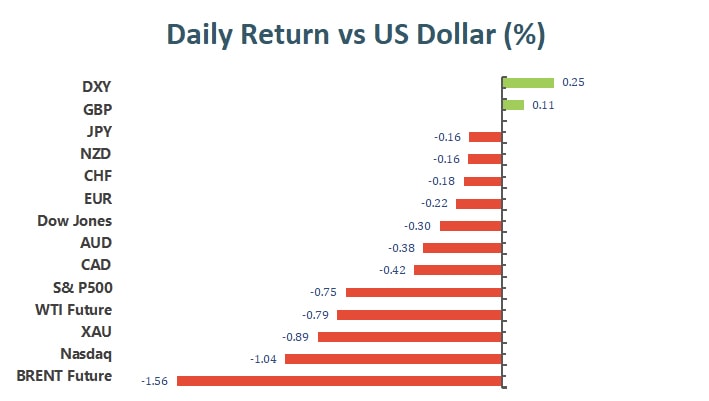
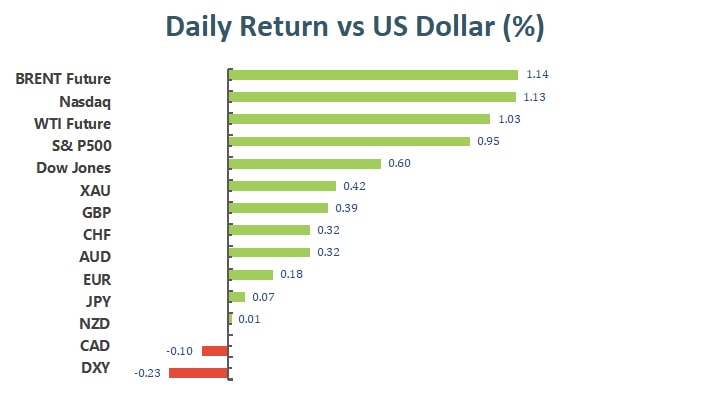
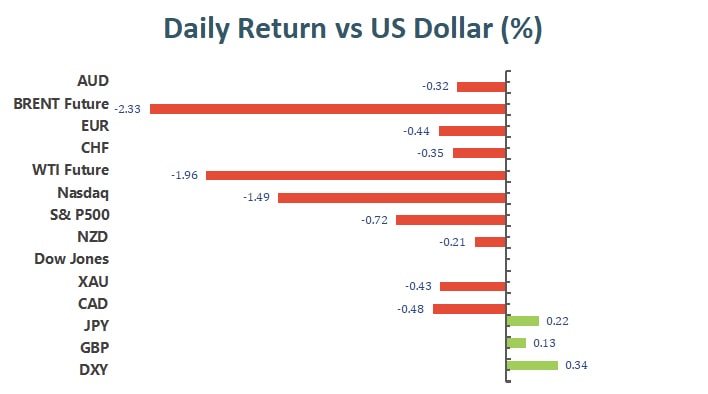
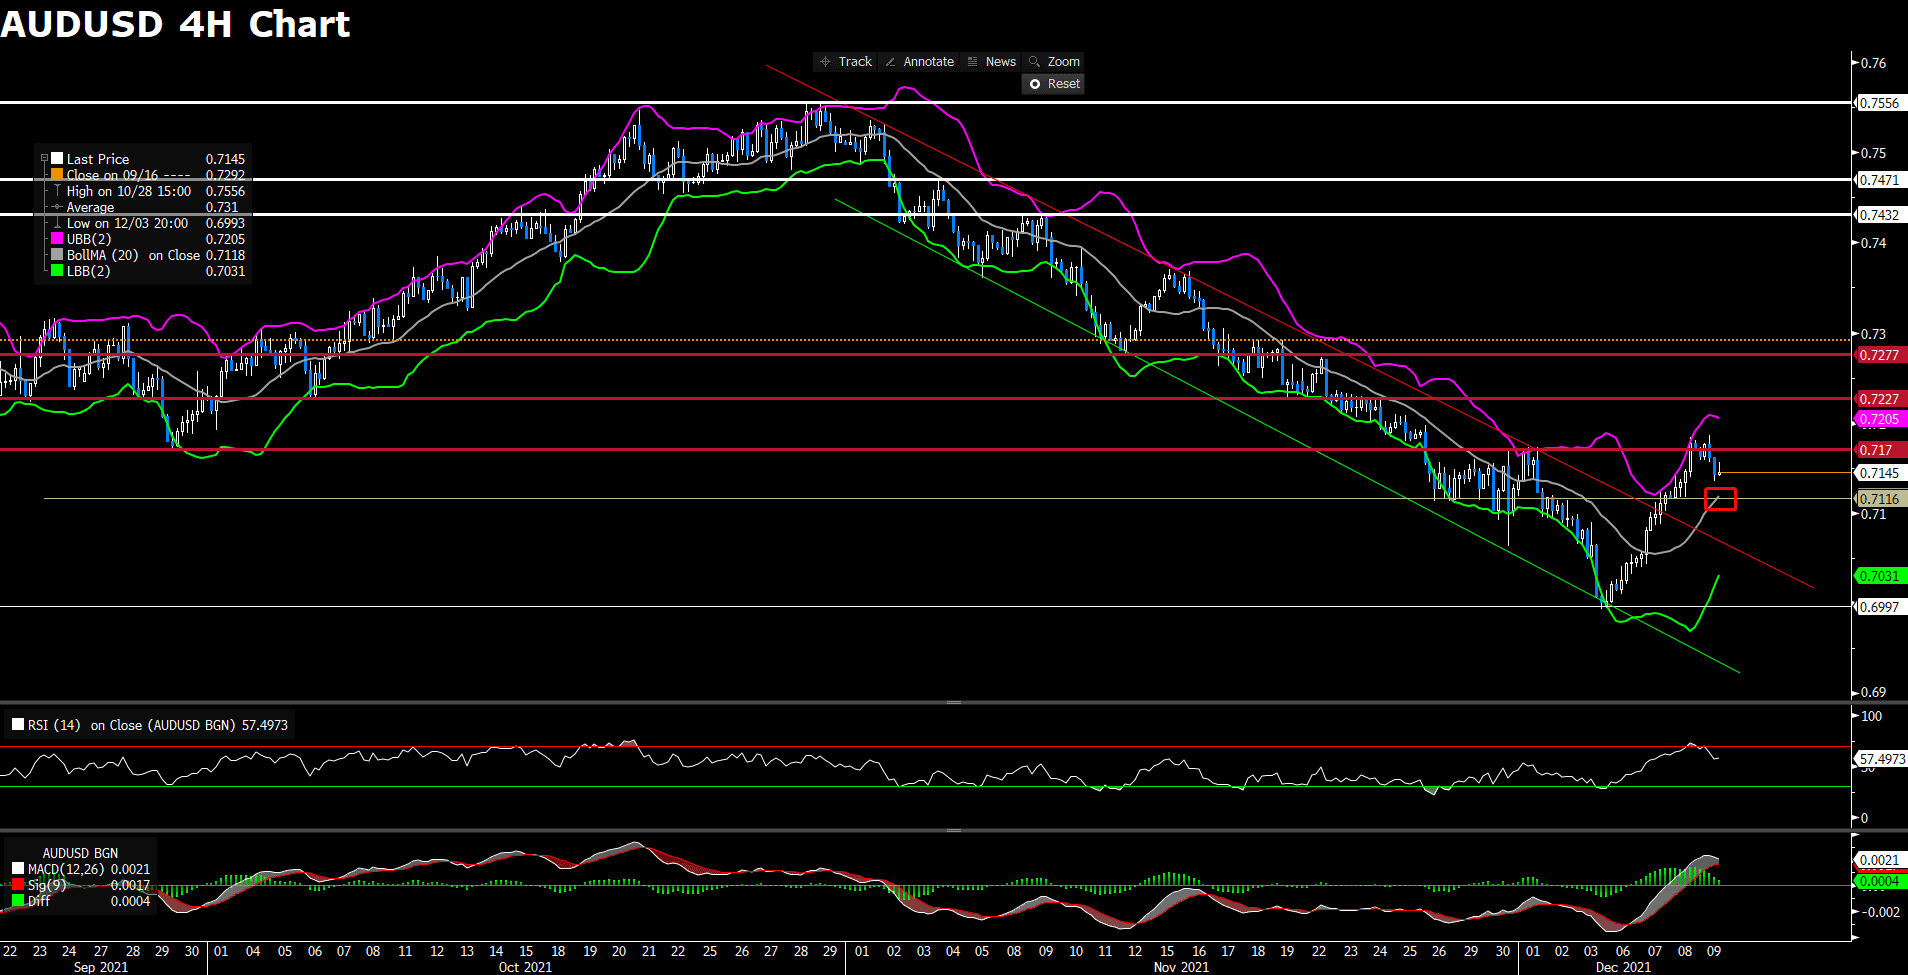
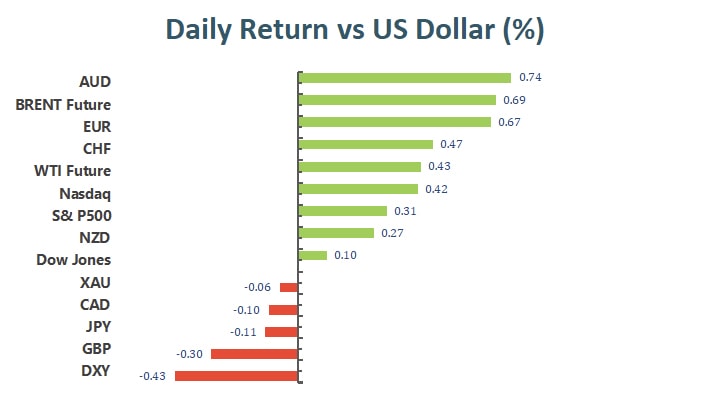
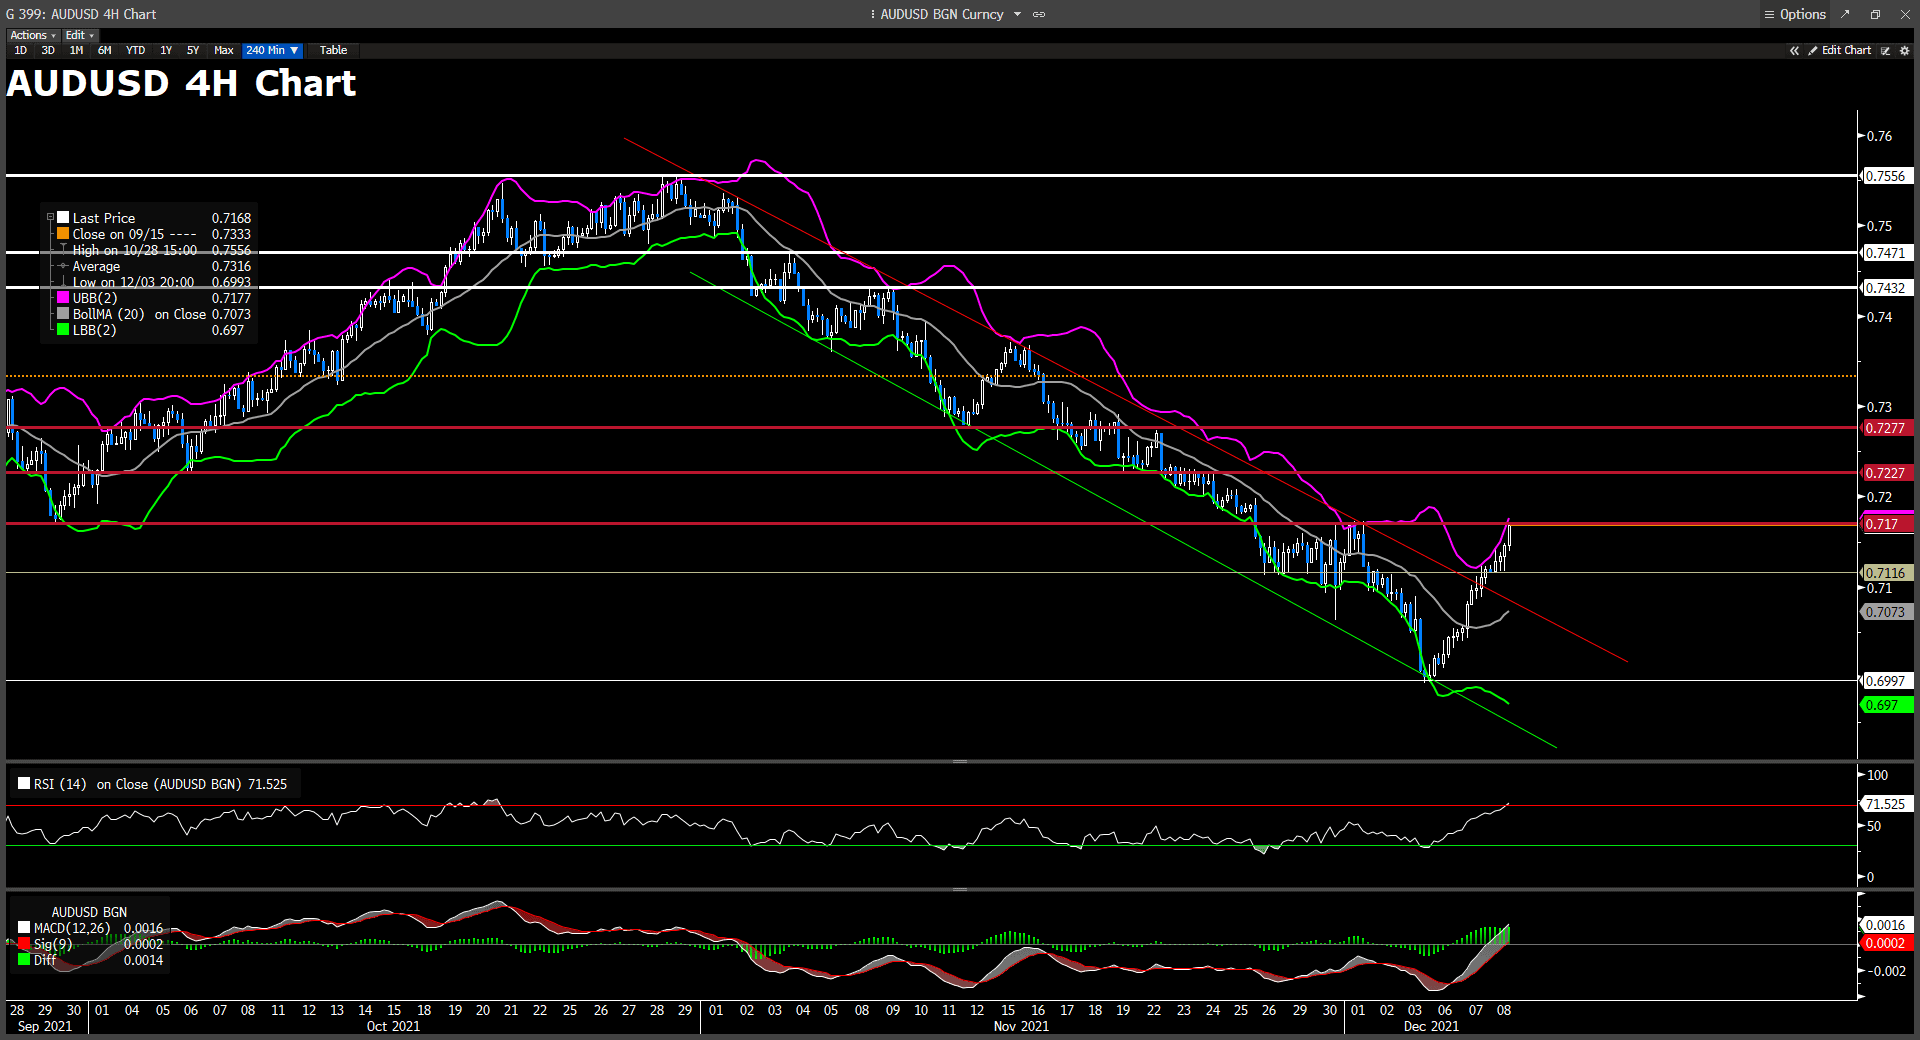
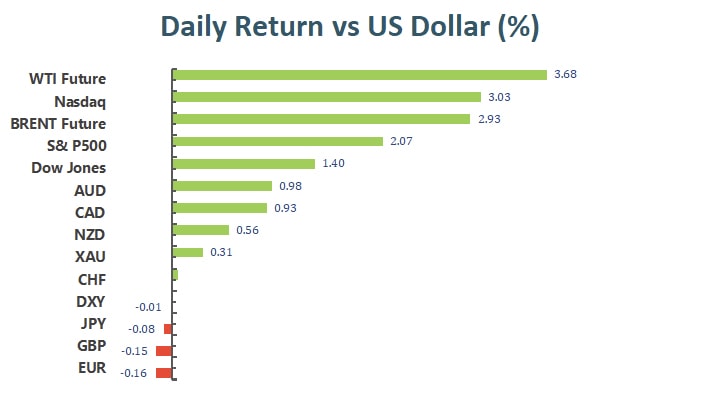
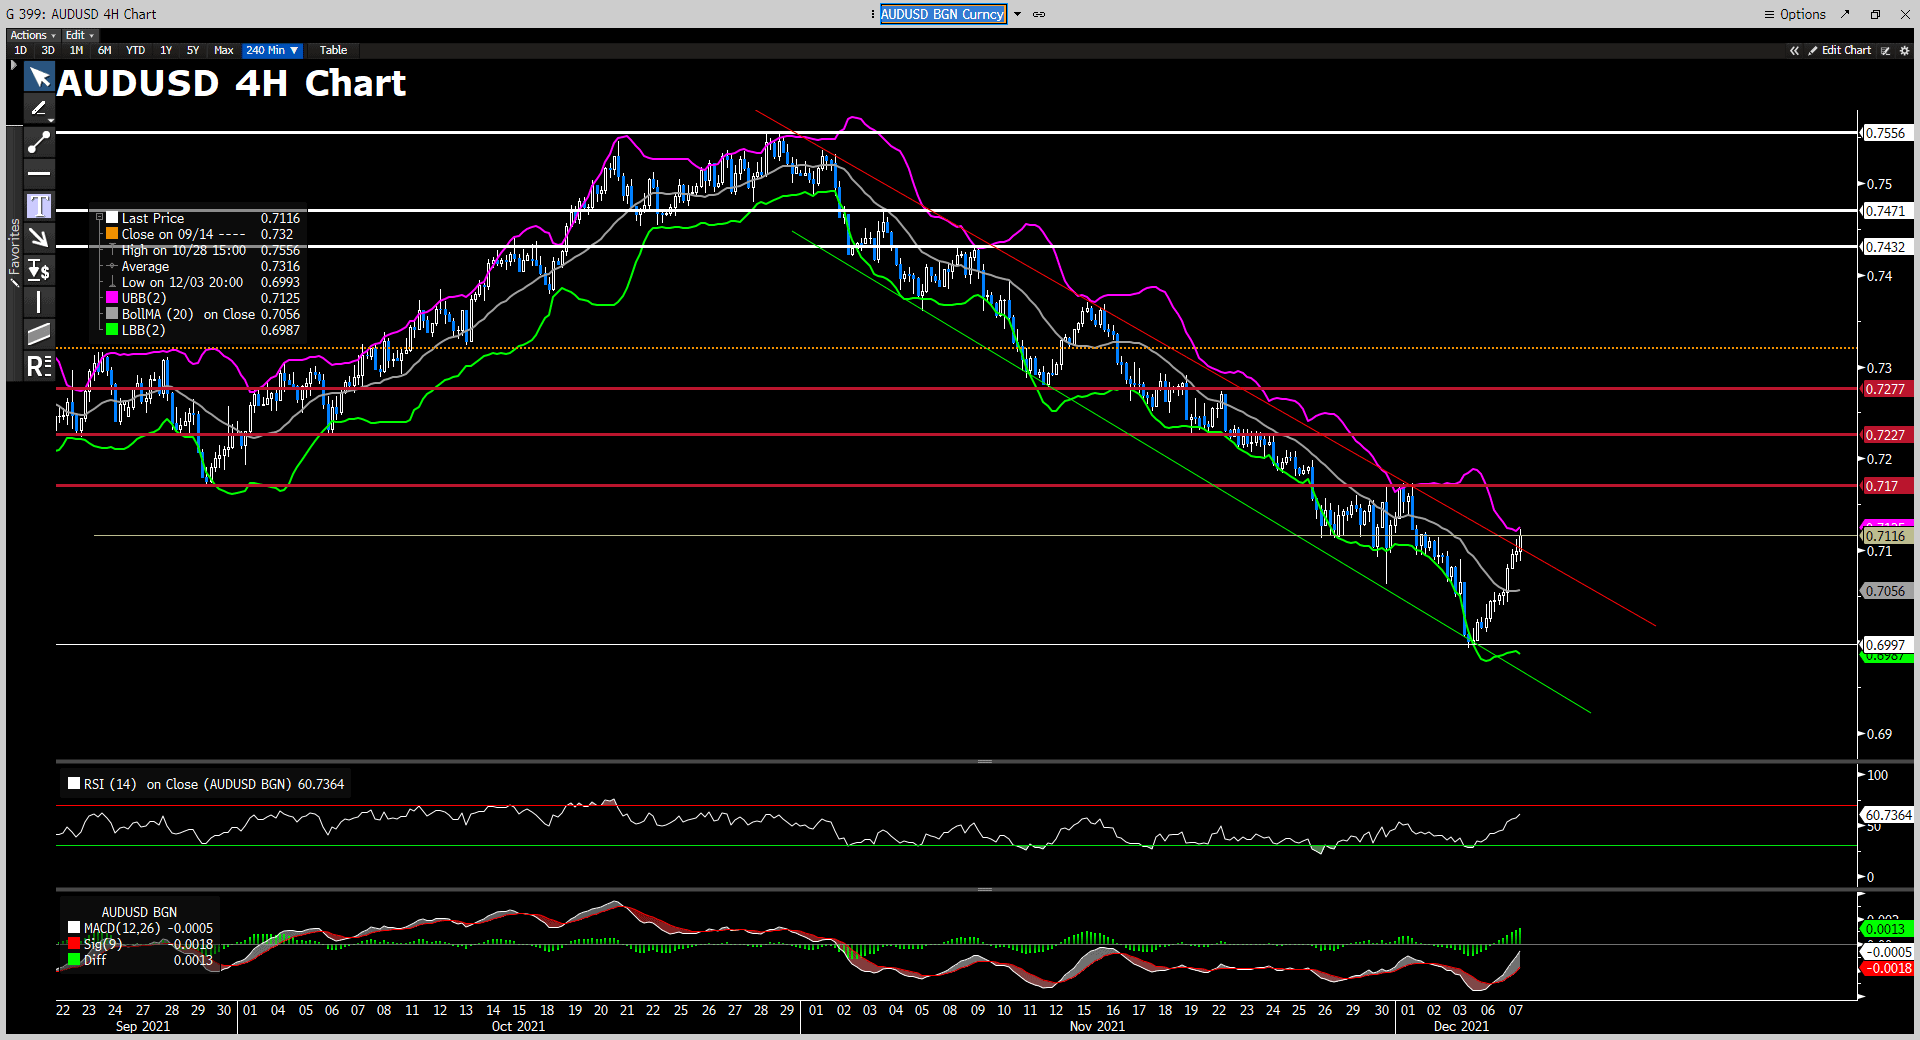
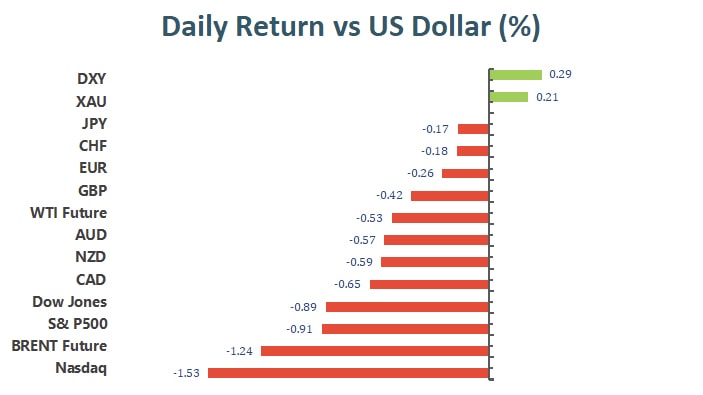
The EUR/USD hovered below 1.1300, while the GBP/USD fell to the 1.3200 area. Due to the slight decline in U.S. stocks, commodity-related currencies faced selling pressure and rebounded slightly before the close. The AUD/USD fell by 0.54%, and the USD/CAD rose by 0.62%. The safe-haven currencies Swiss franc and Japanese yen changed little against the U.S. dollar each day, and both fell 0.19% against the greenback.
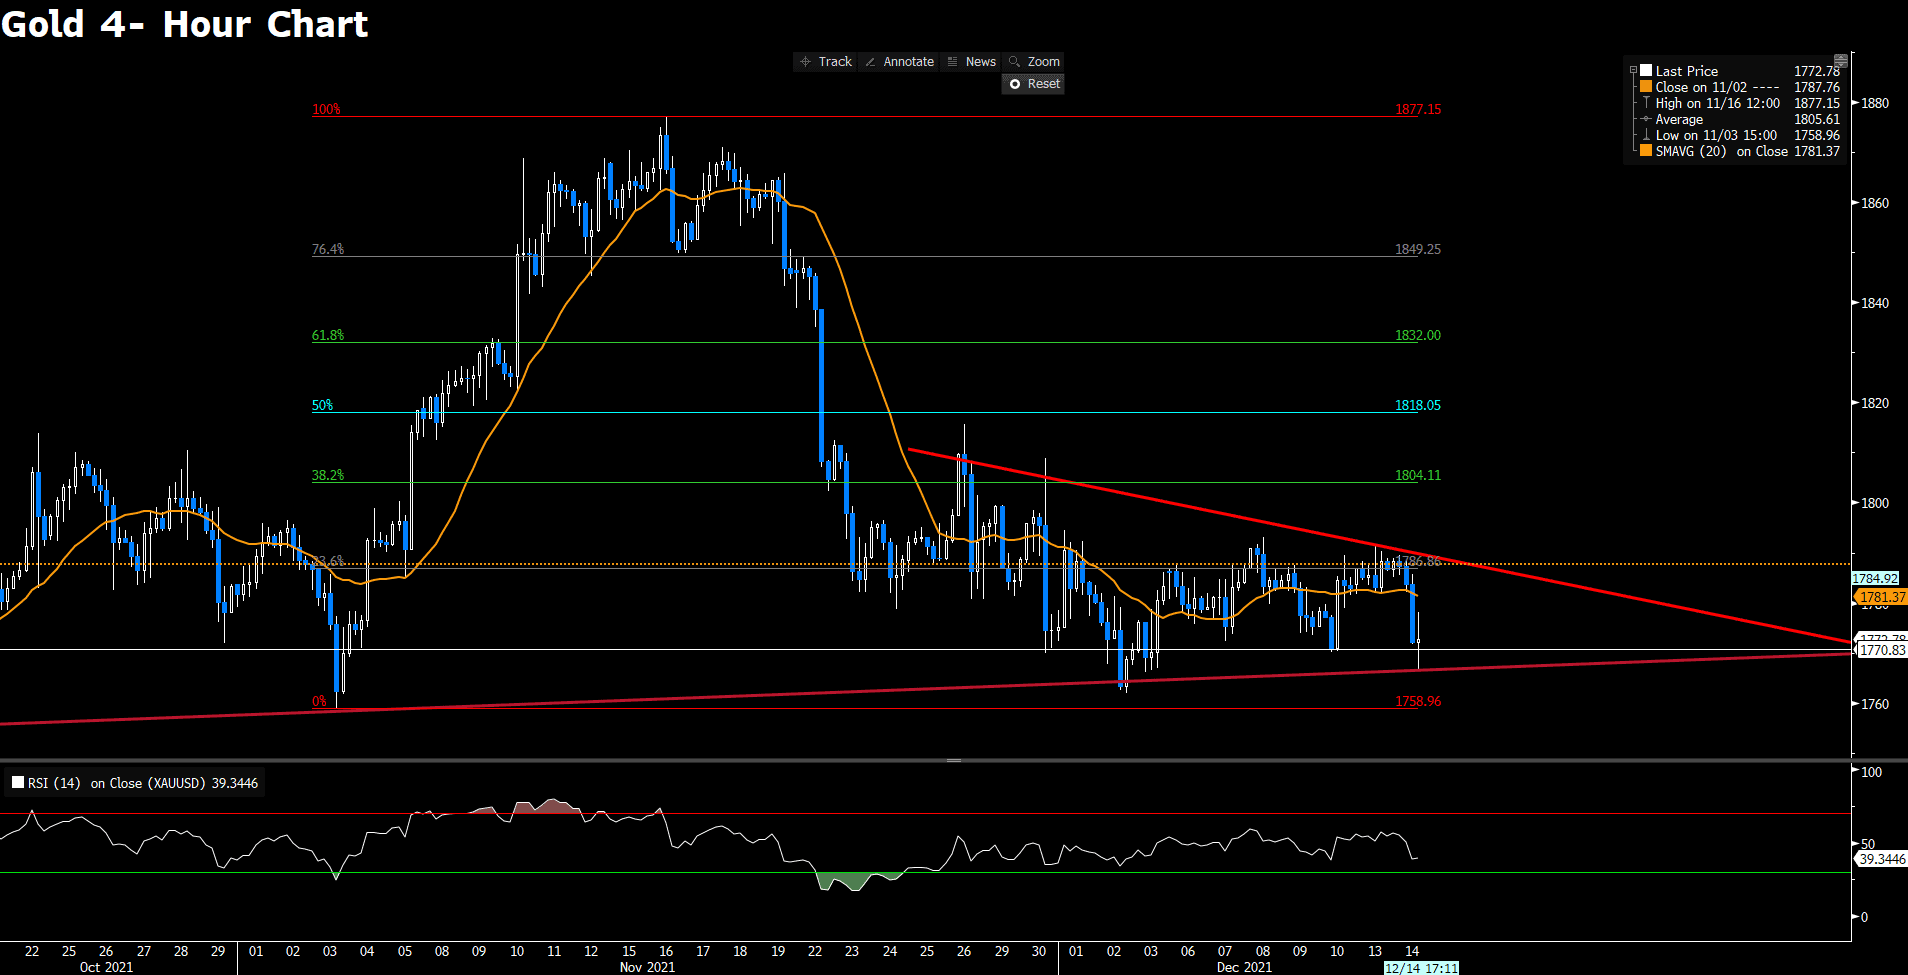
Gold rose 0.21% and hovered at $1786 per ounce area, while WTI oil dropped 1.08% to $71.16 per barrel.
Technical Analysis:
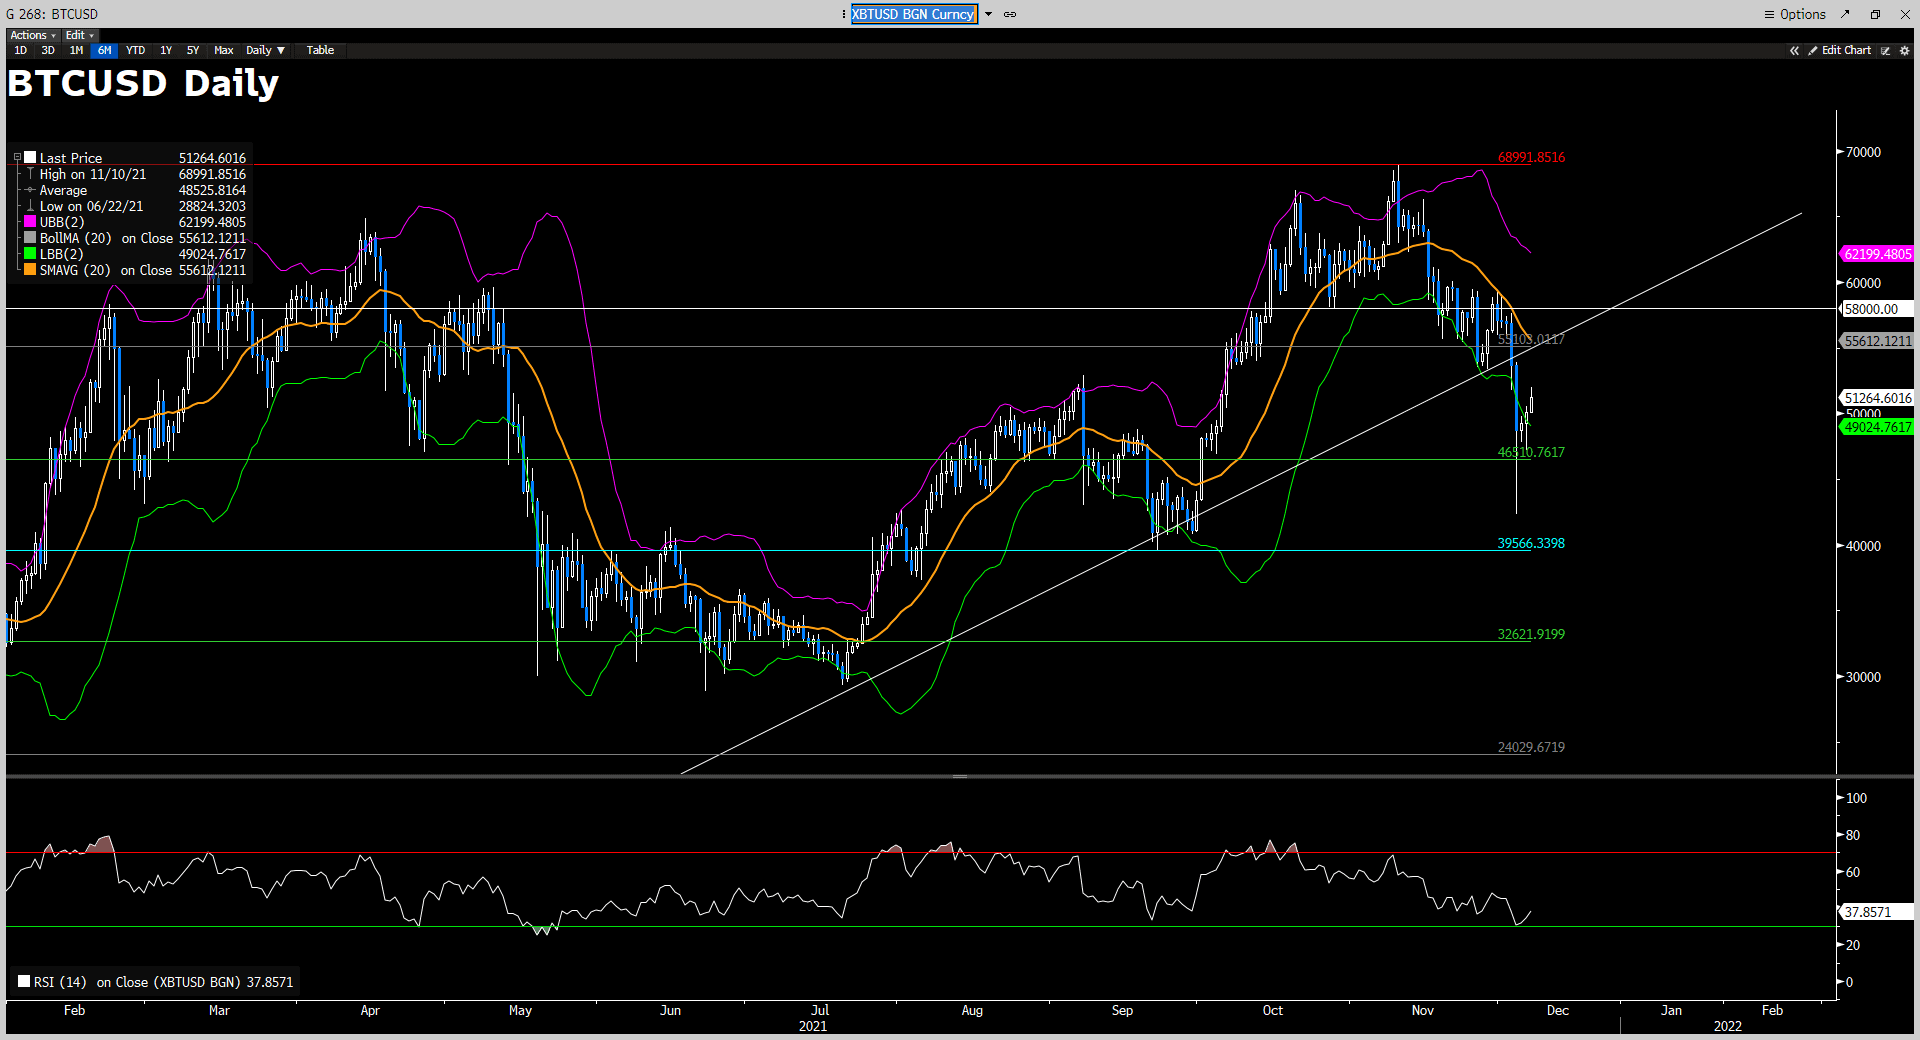
BTCUSD (Daily Chart)
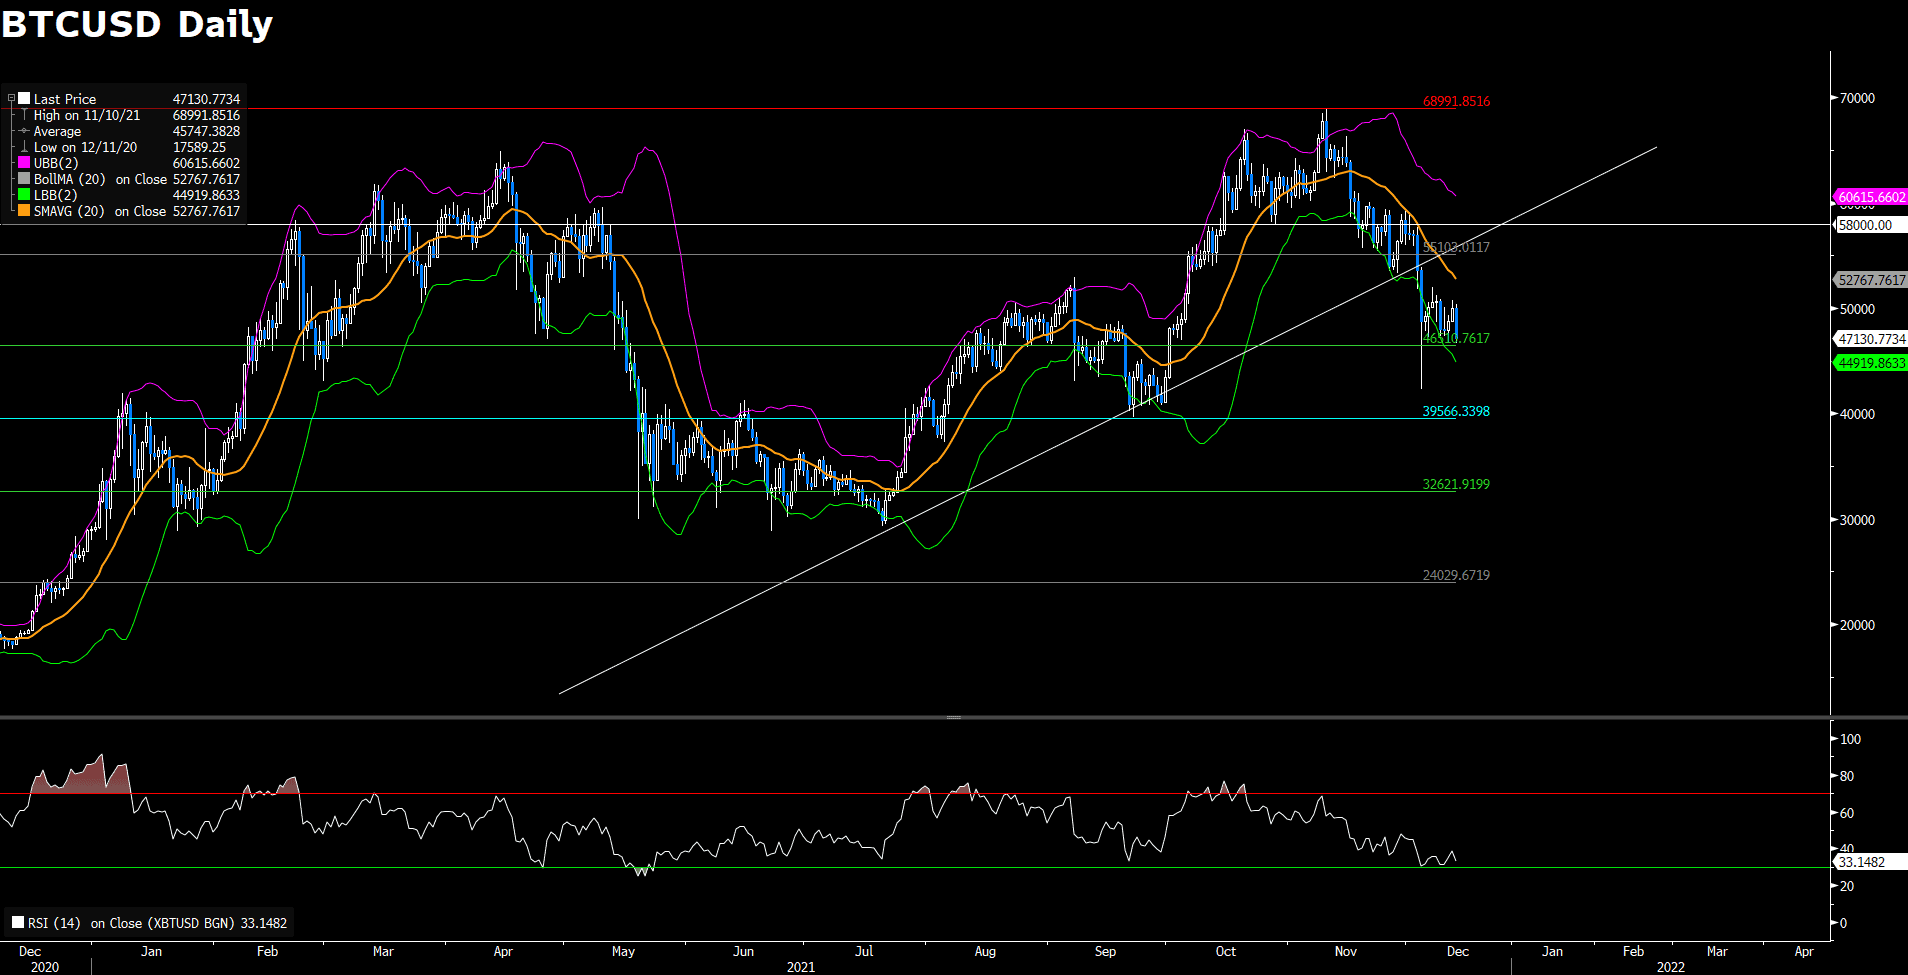
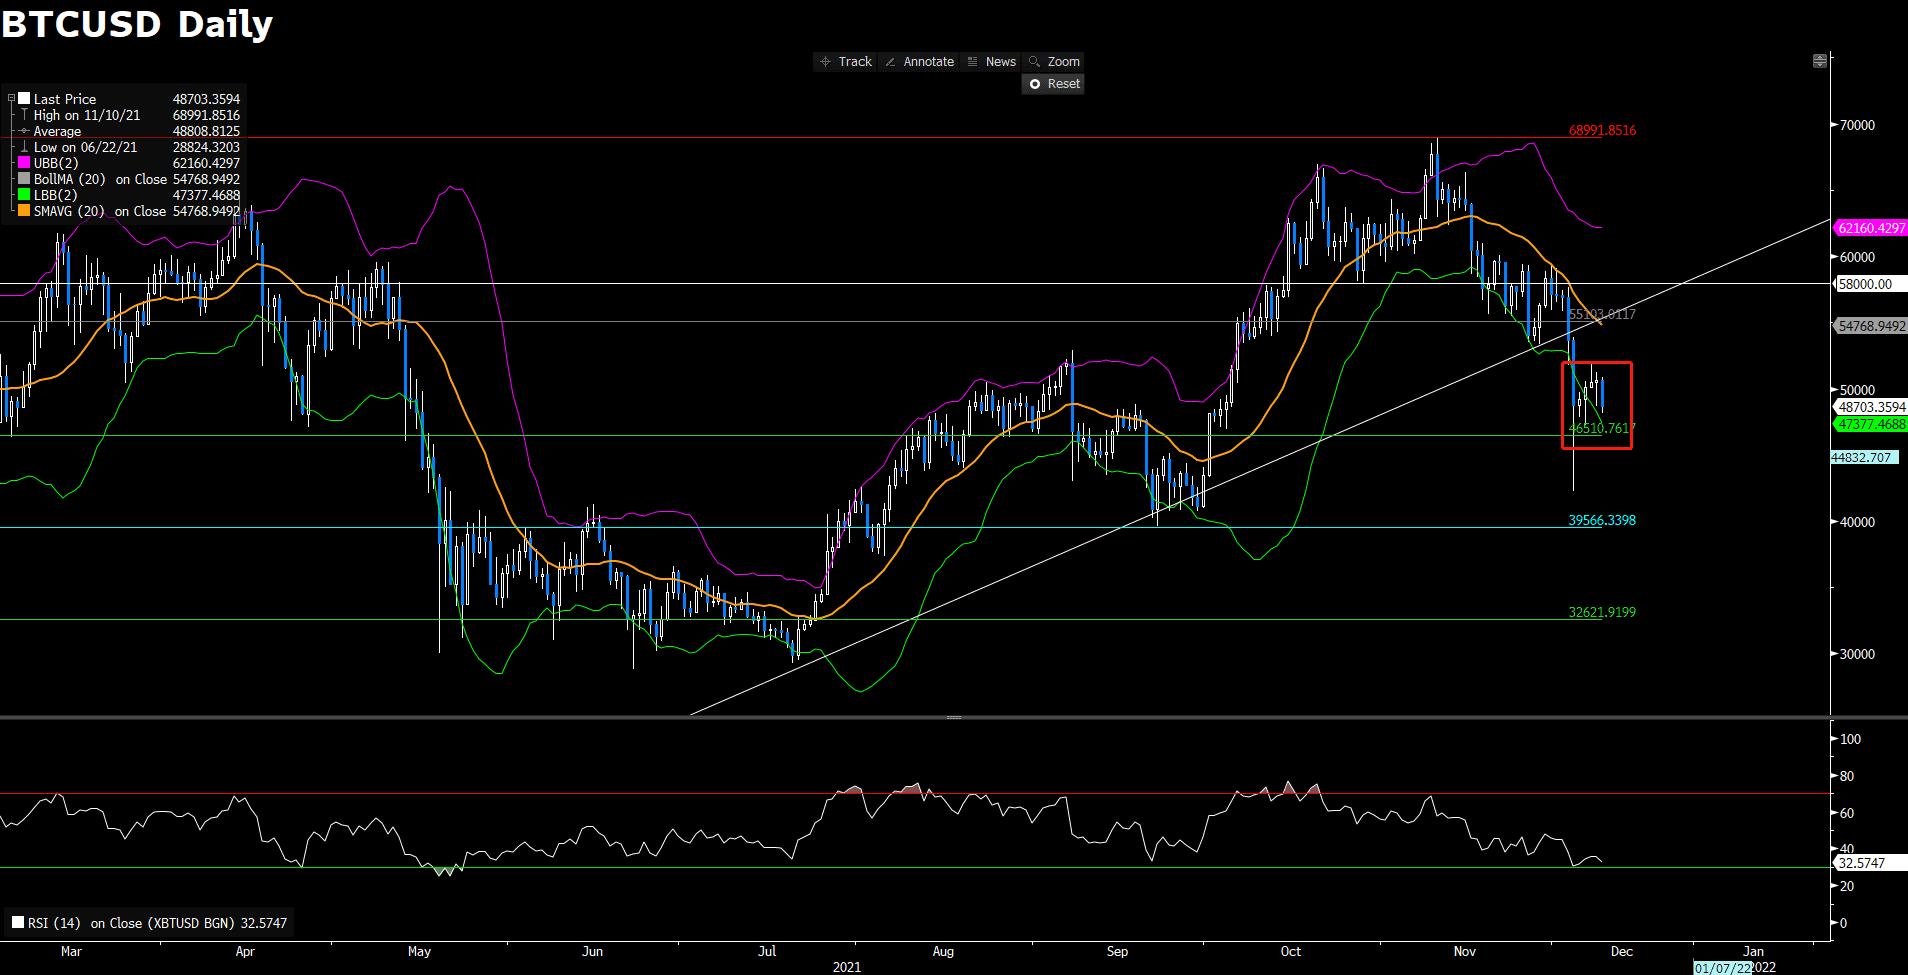
On Monday, 90% of Bitcoin have been mined according to the tracker from Blockchain.com. That being said, 90% of the coin are on the open market. From the technical aspect, Bitcoin falls back from $50,132, a 1.41% rise on Sunday. Bitcoin starts the week by re- testing the support pivot again at $46,510. On the daily chart, Bitcoin needs to move back through $55,103 to initiate the first bullish momentum into play. Failure to move back though the immediate resistance would continue to make Bitcoin downside. If the support at $46,510 cannot hold, then Bitcoin will head toward the next support at $39,566. However, it looks like that the bearish momentum is being weakened as the RSI remains oversold condition, due for a bounce back.
Resistance: 55,103, 58,000, 68,991
Support: 46,510, 39,566, 32,621
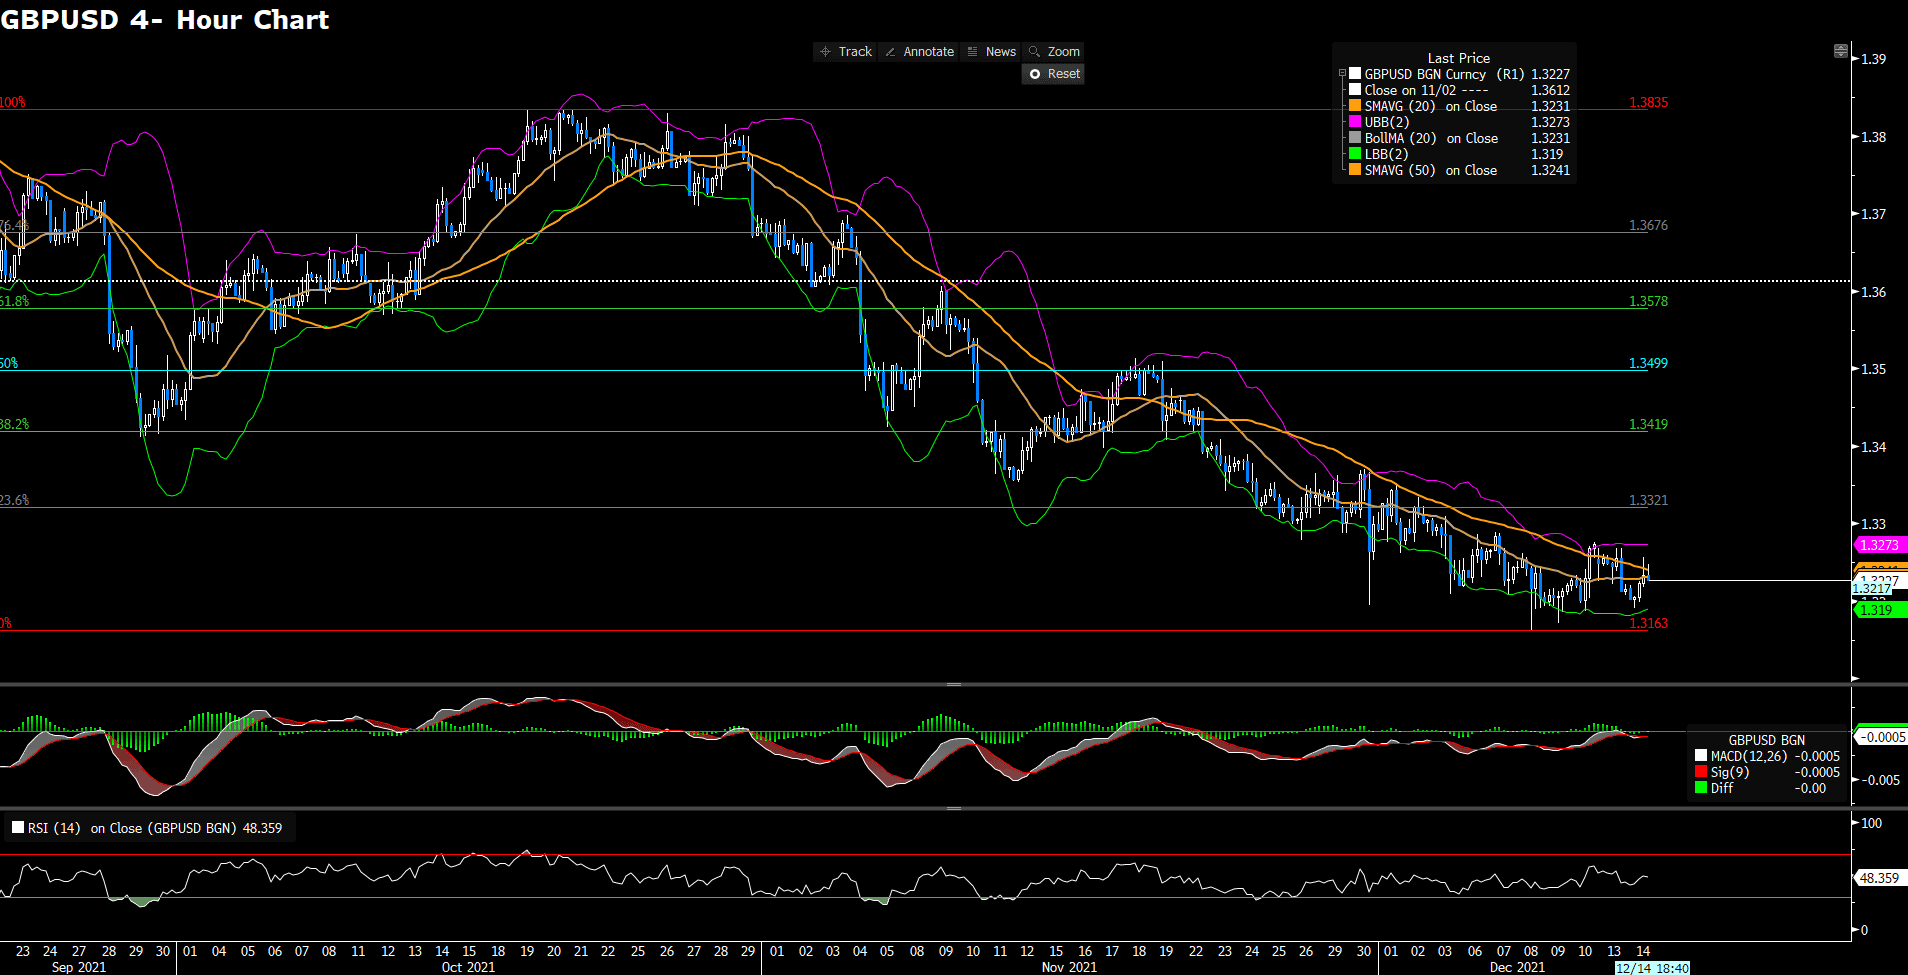
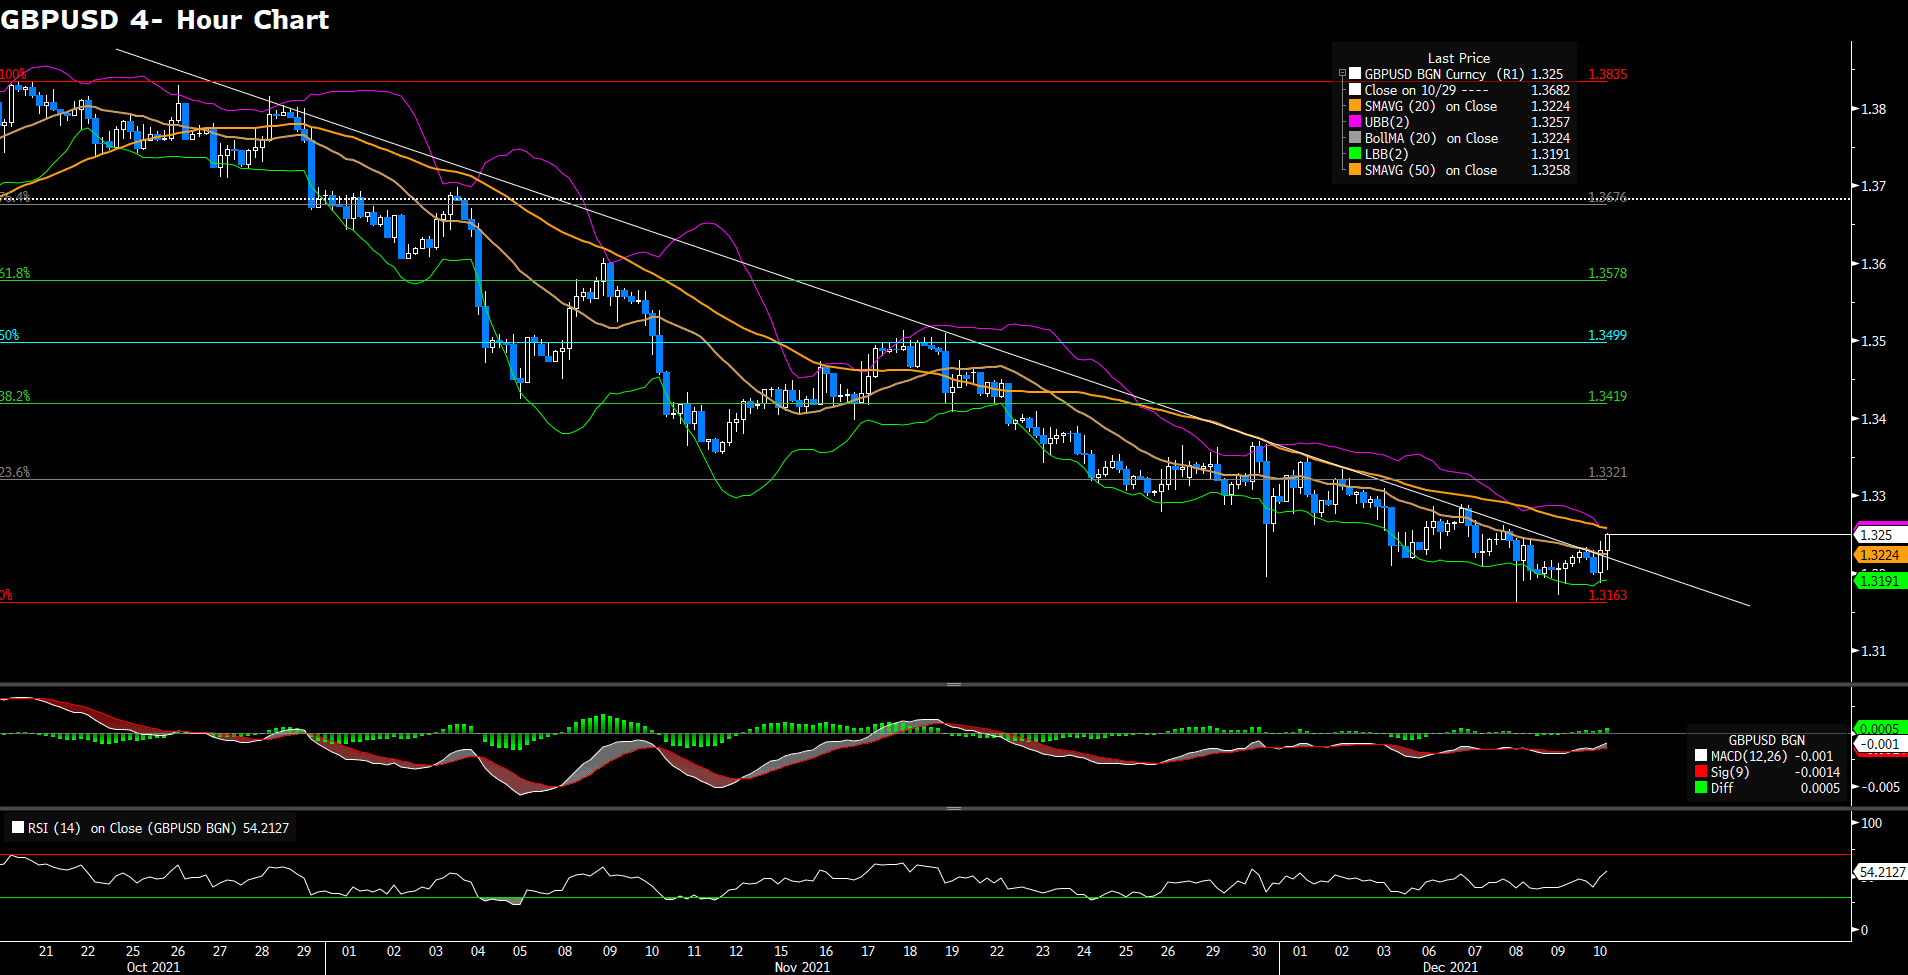
GBPUSD (4- Hour Chart)
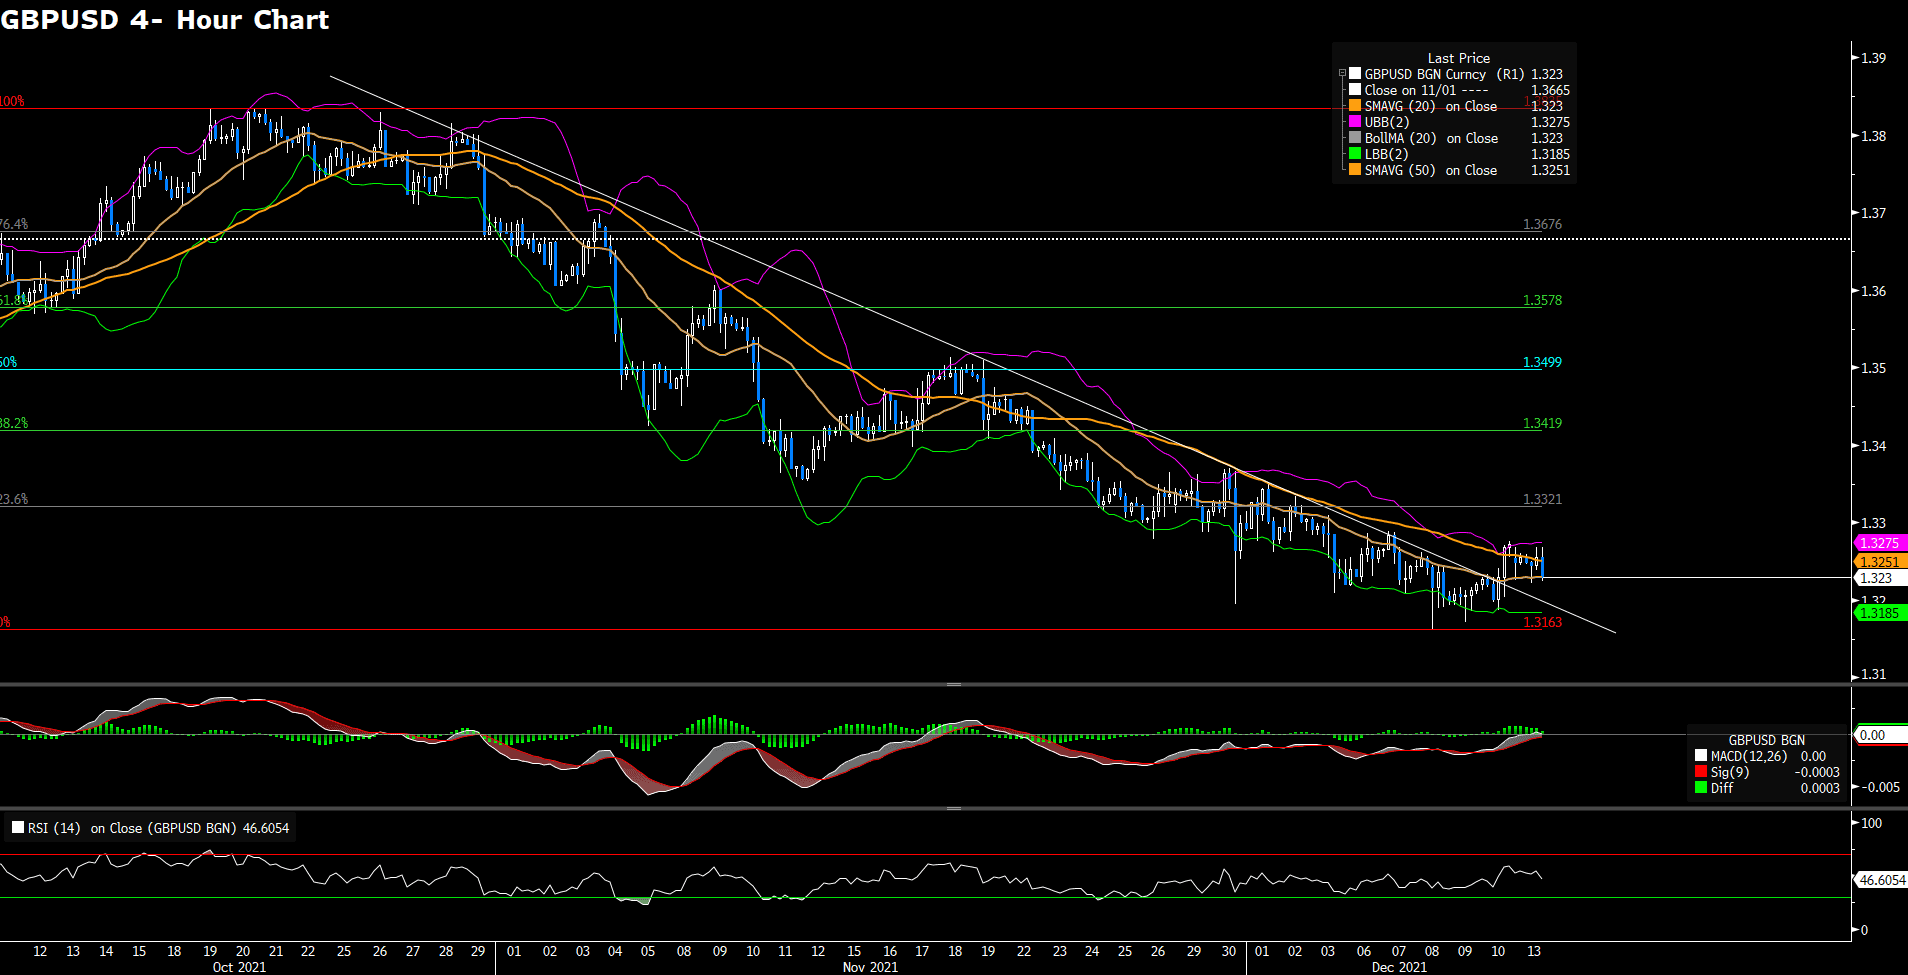
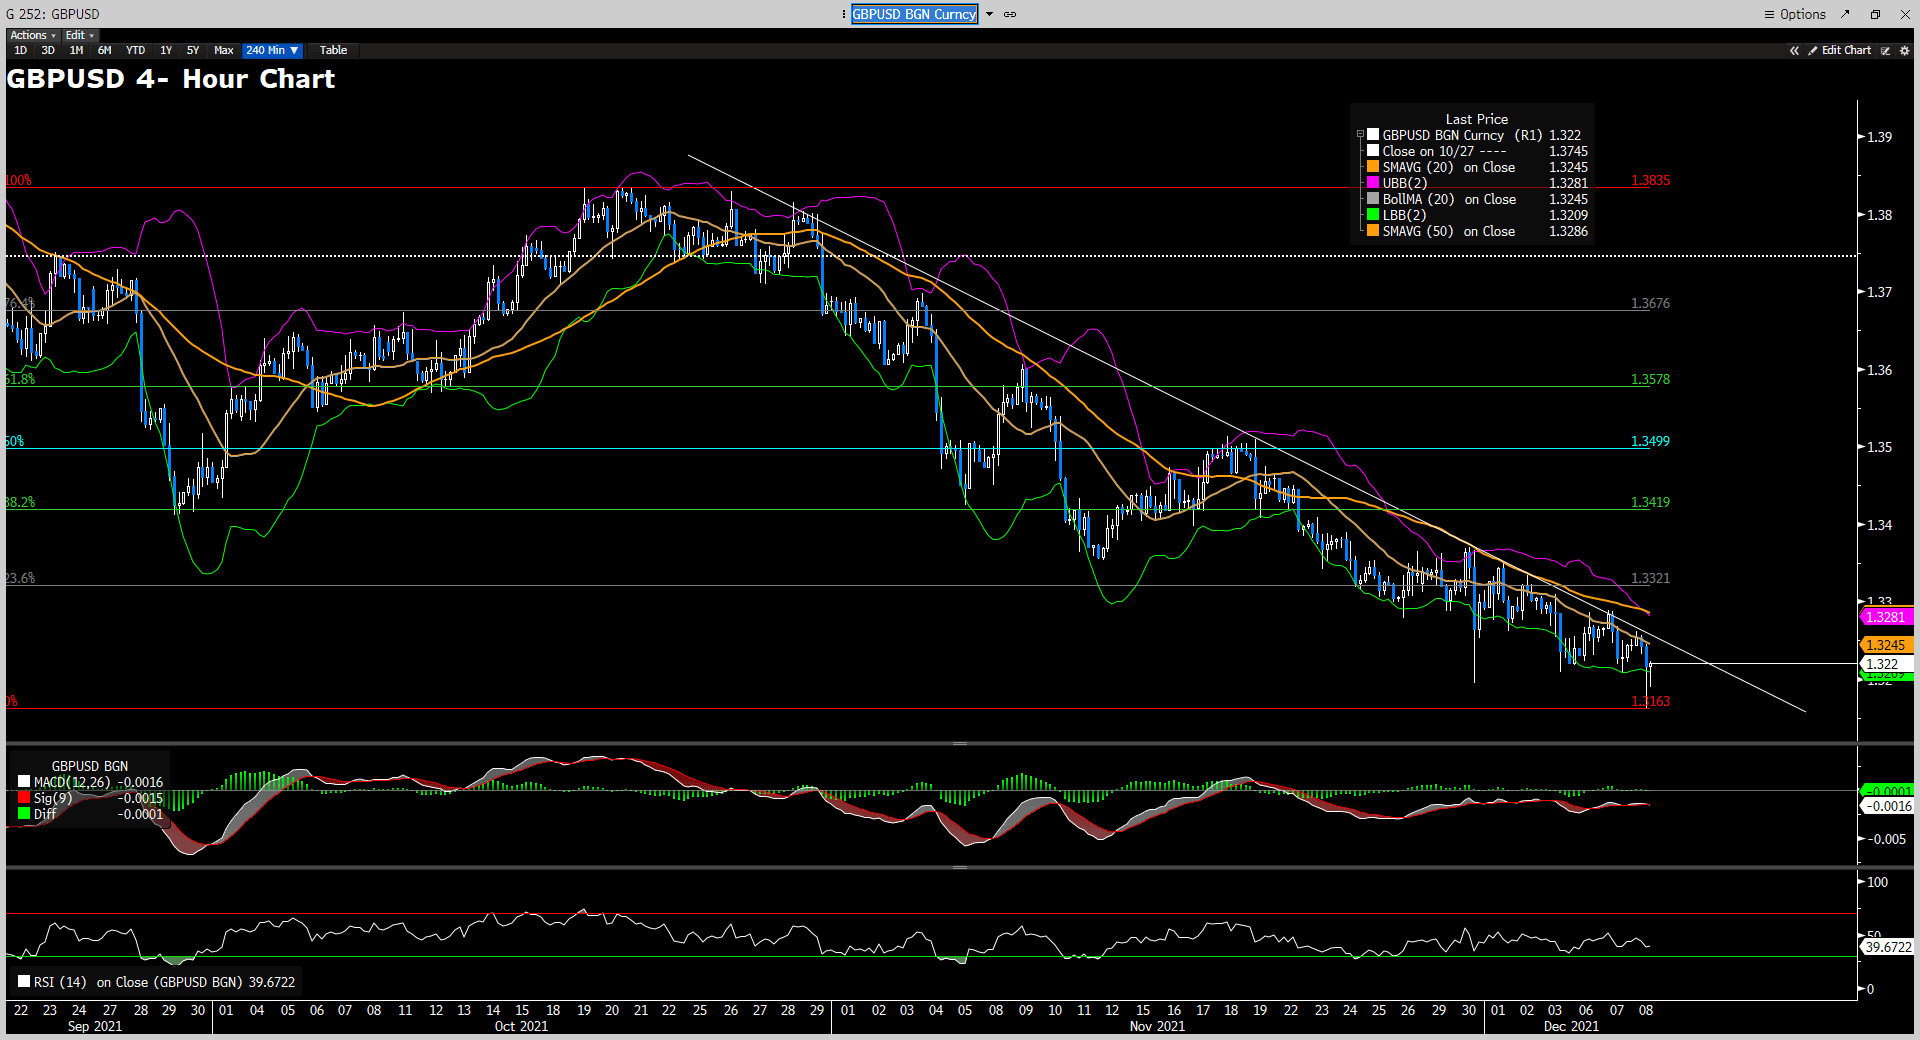
GBPUSD edges higher on Monday as the US dollar struggles to preserve its strength to start the week. From the technical perspective, the outlook of the pair turns upside in the near term as it has breached the descending trendline and is trading above the 50 moving averages. However, the upside momentum seems lack of strength as the currency continues to consolidate in the range from 1.3321 to 1.3163. Moreover, the RSI indicator has hovered around the midline, suggesting that buyers and sellers show less interest in the pair for the time being. On the downside, if the pair falls below the bearish trendline, then it will turn bearish in the near- term and head toward 1.3163. Current resistance awaits at 1.3163 while supports are located at 1.3321, followed by 1.3419.
Resistance: 1.3321, 1.3419, 1.3499
Support: 1.3163
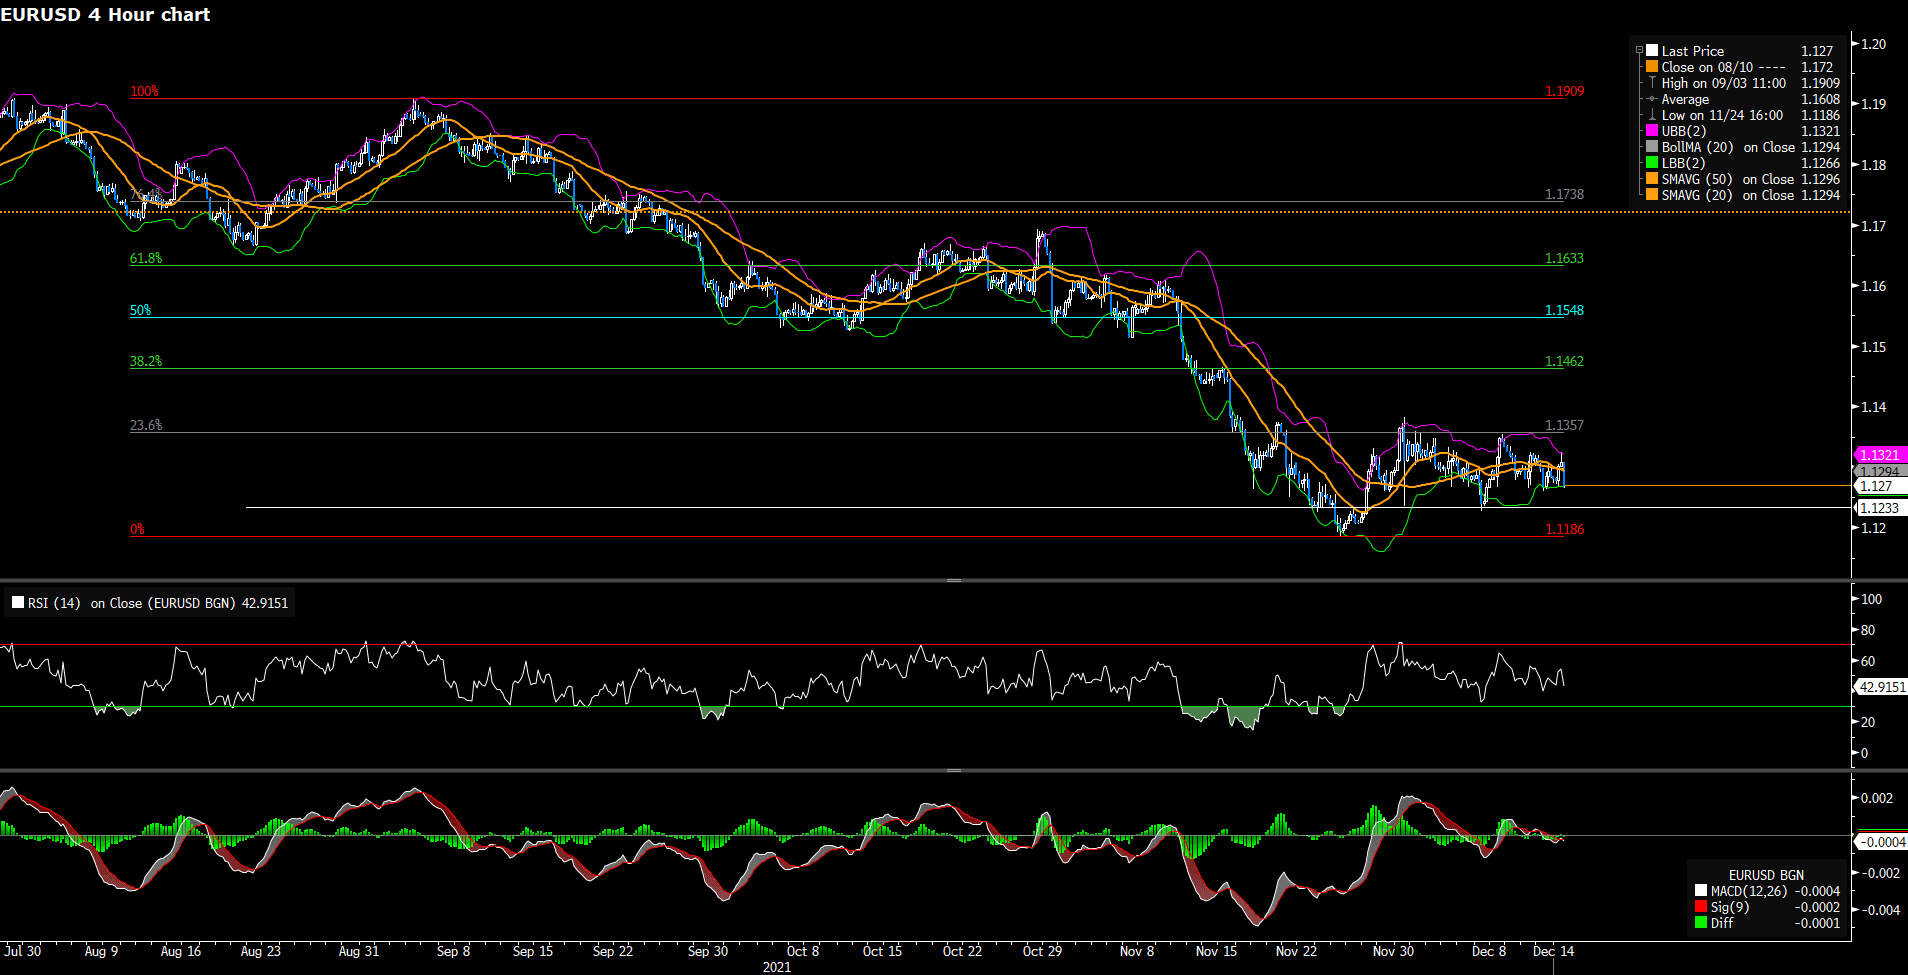
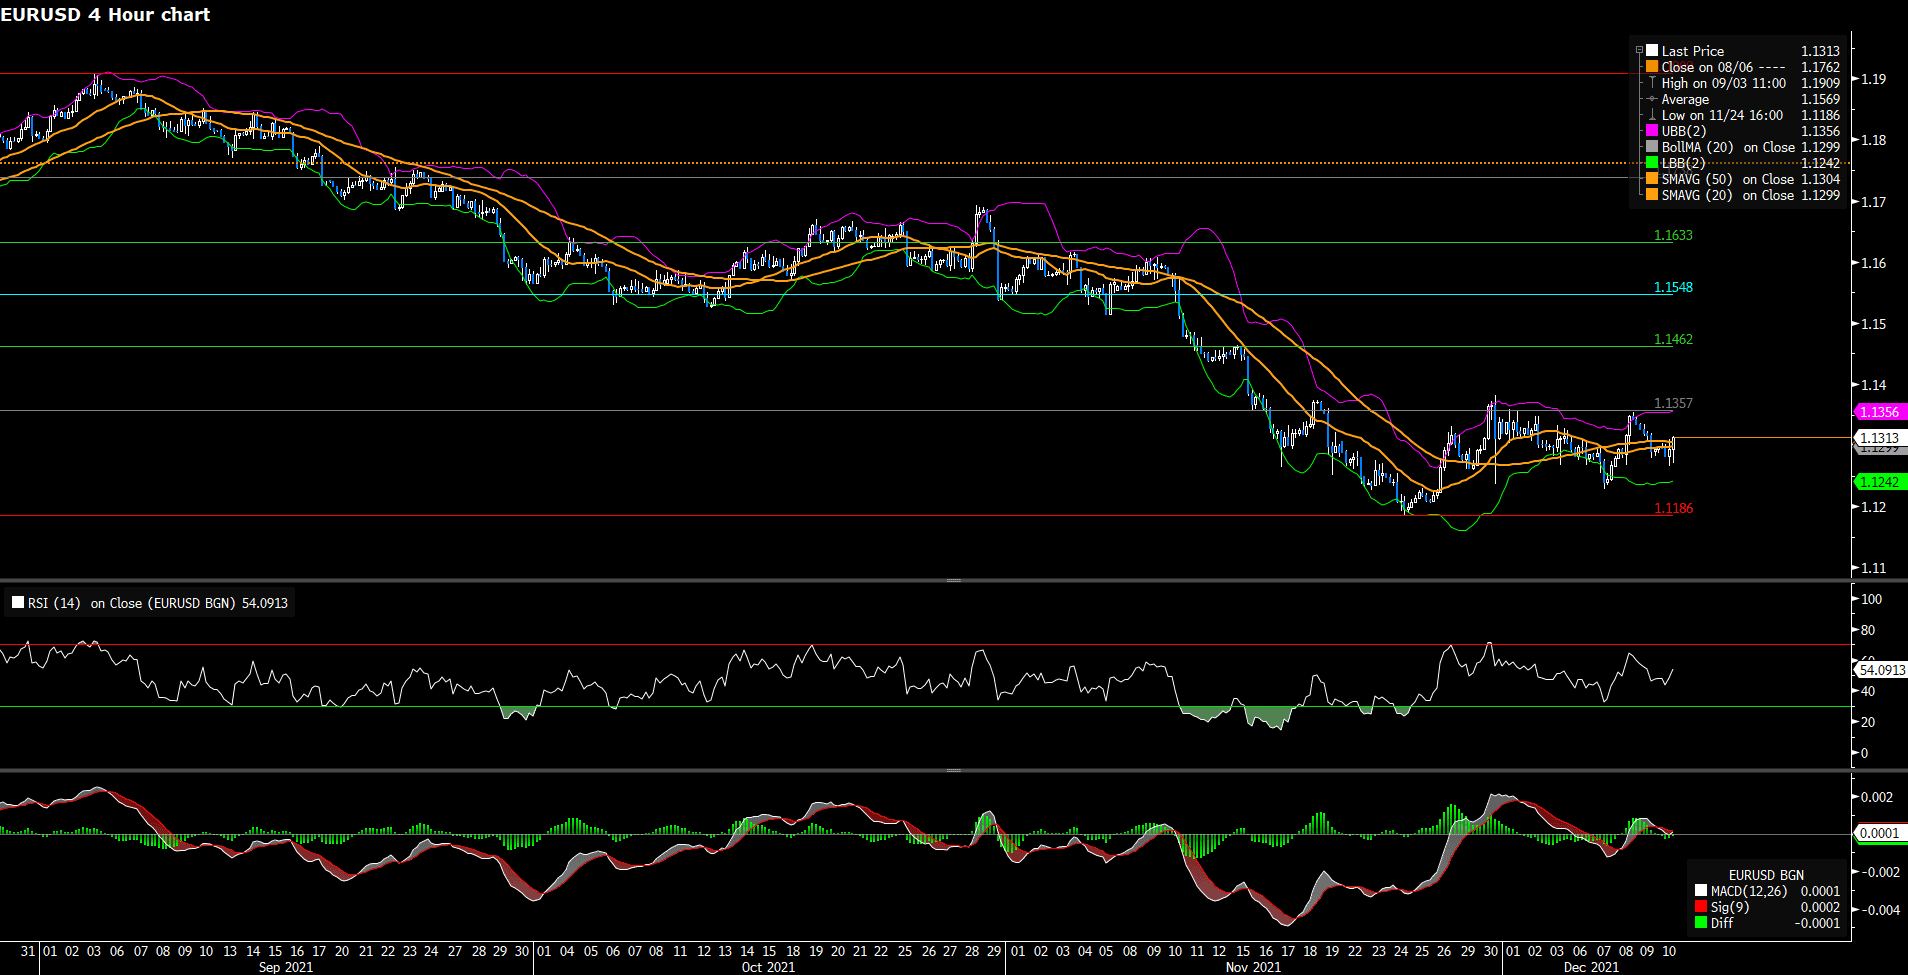
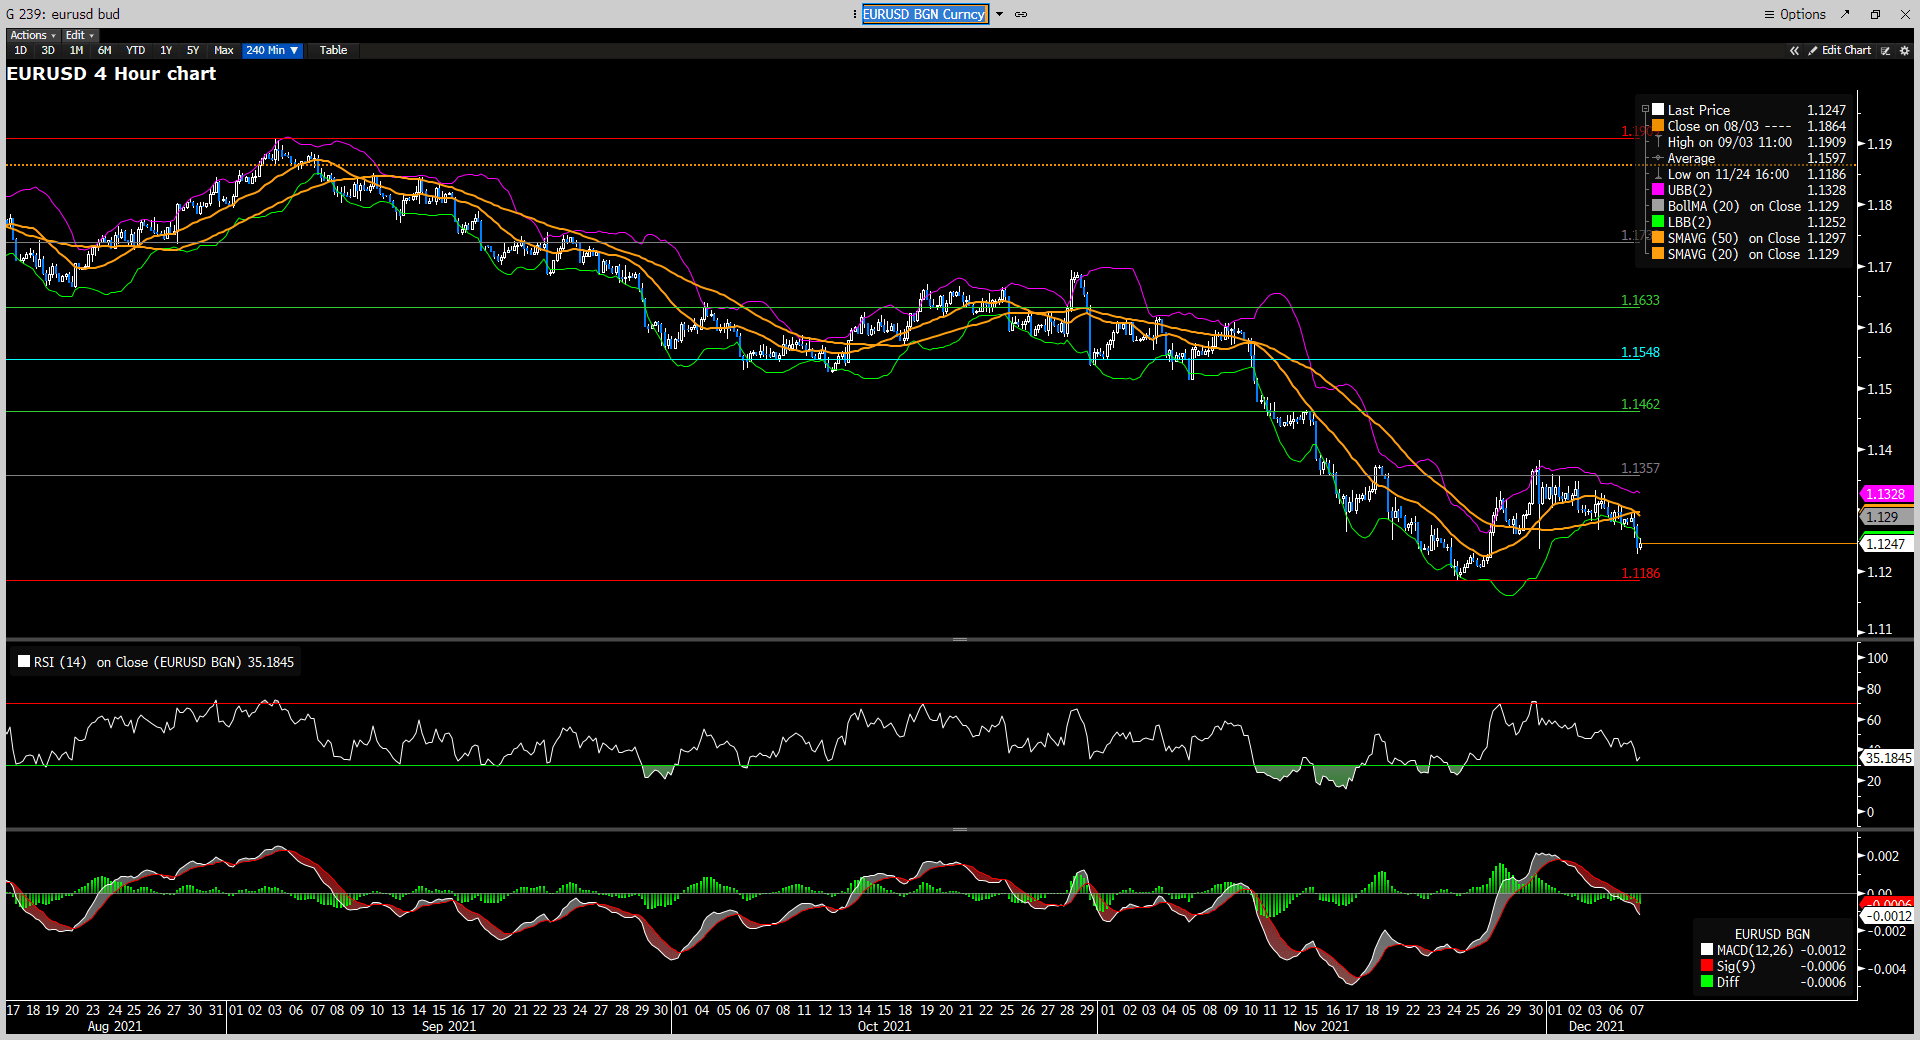
EURUSD (4- Hour Chart)
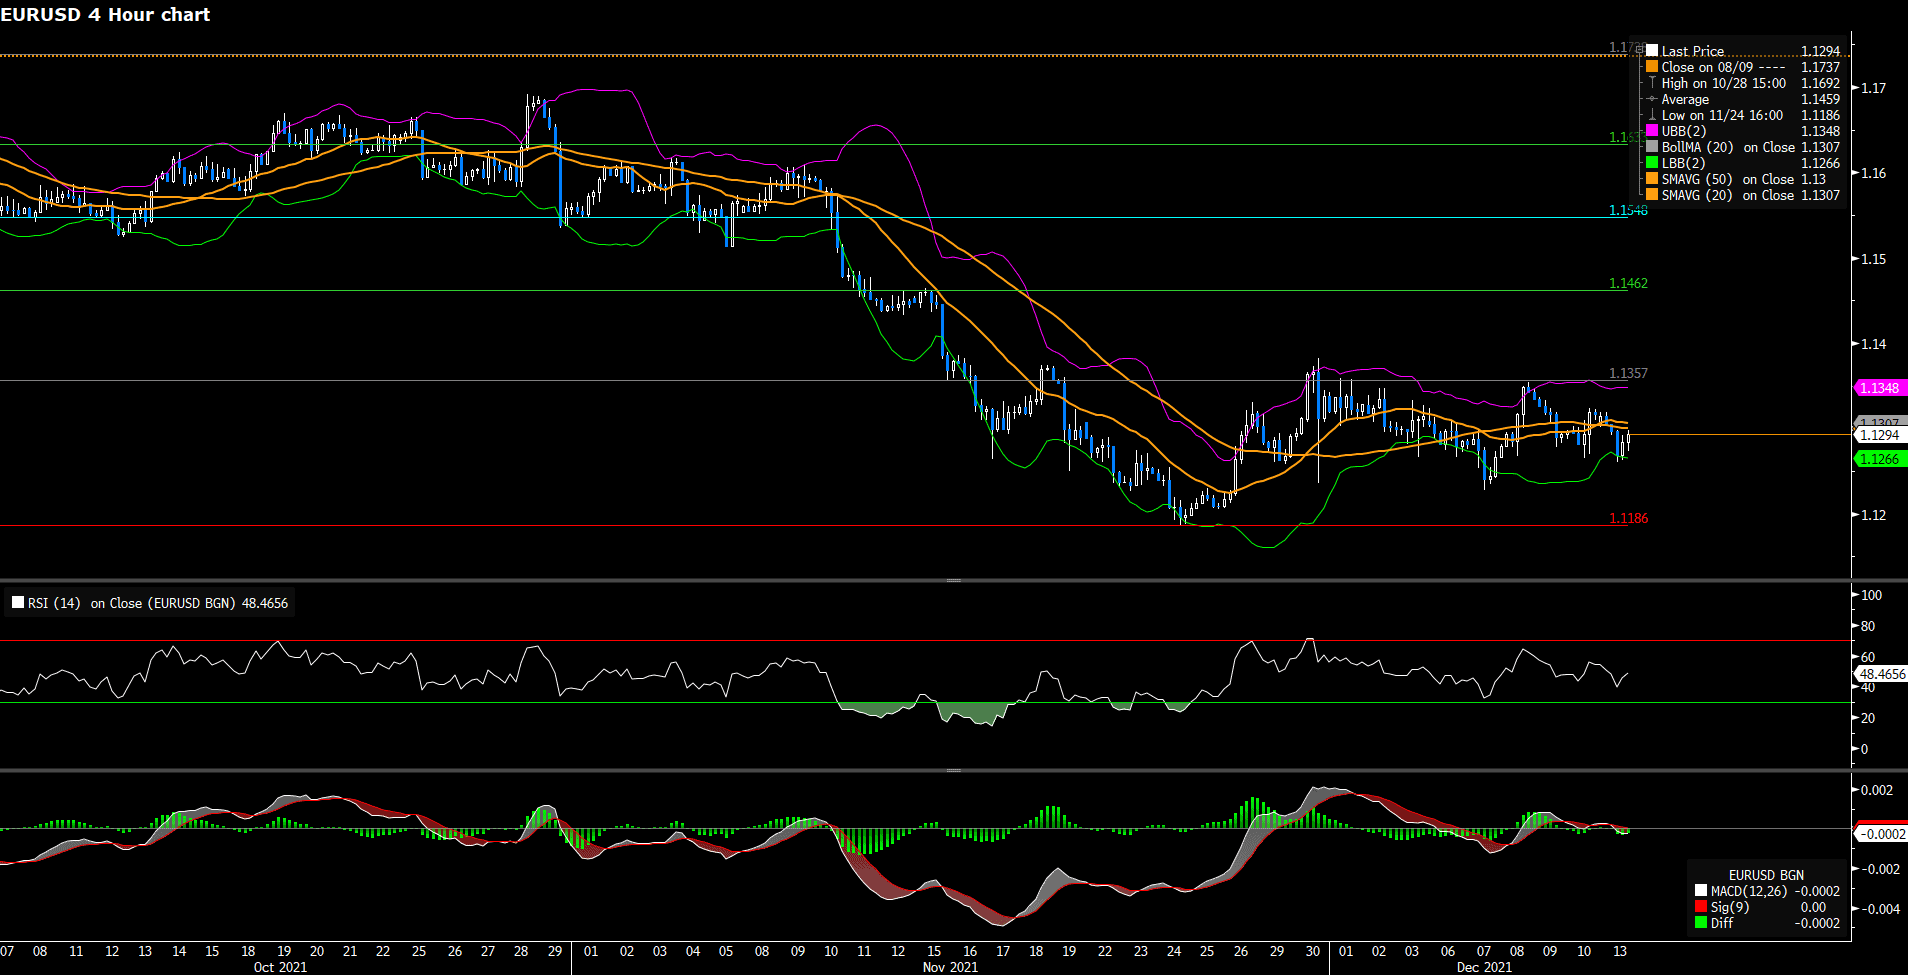
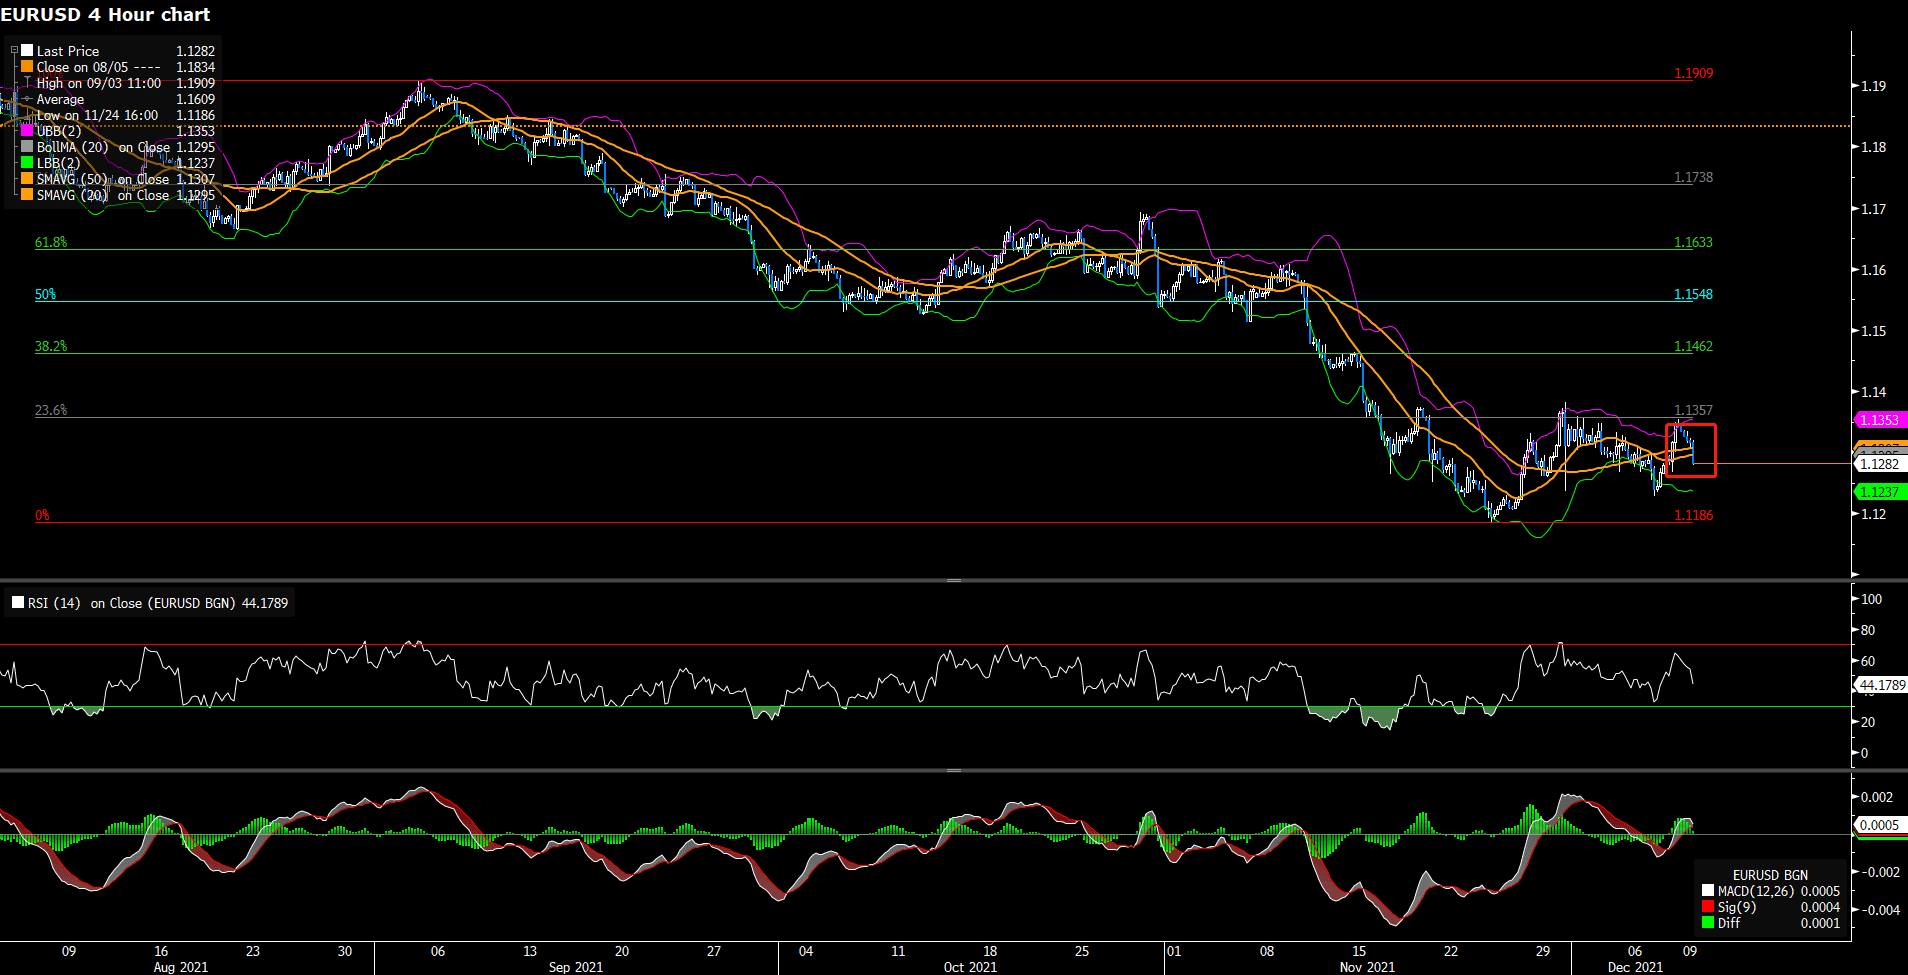
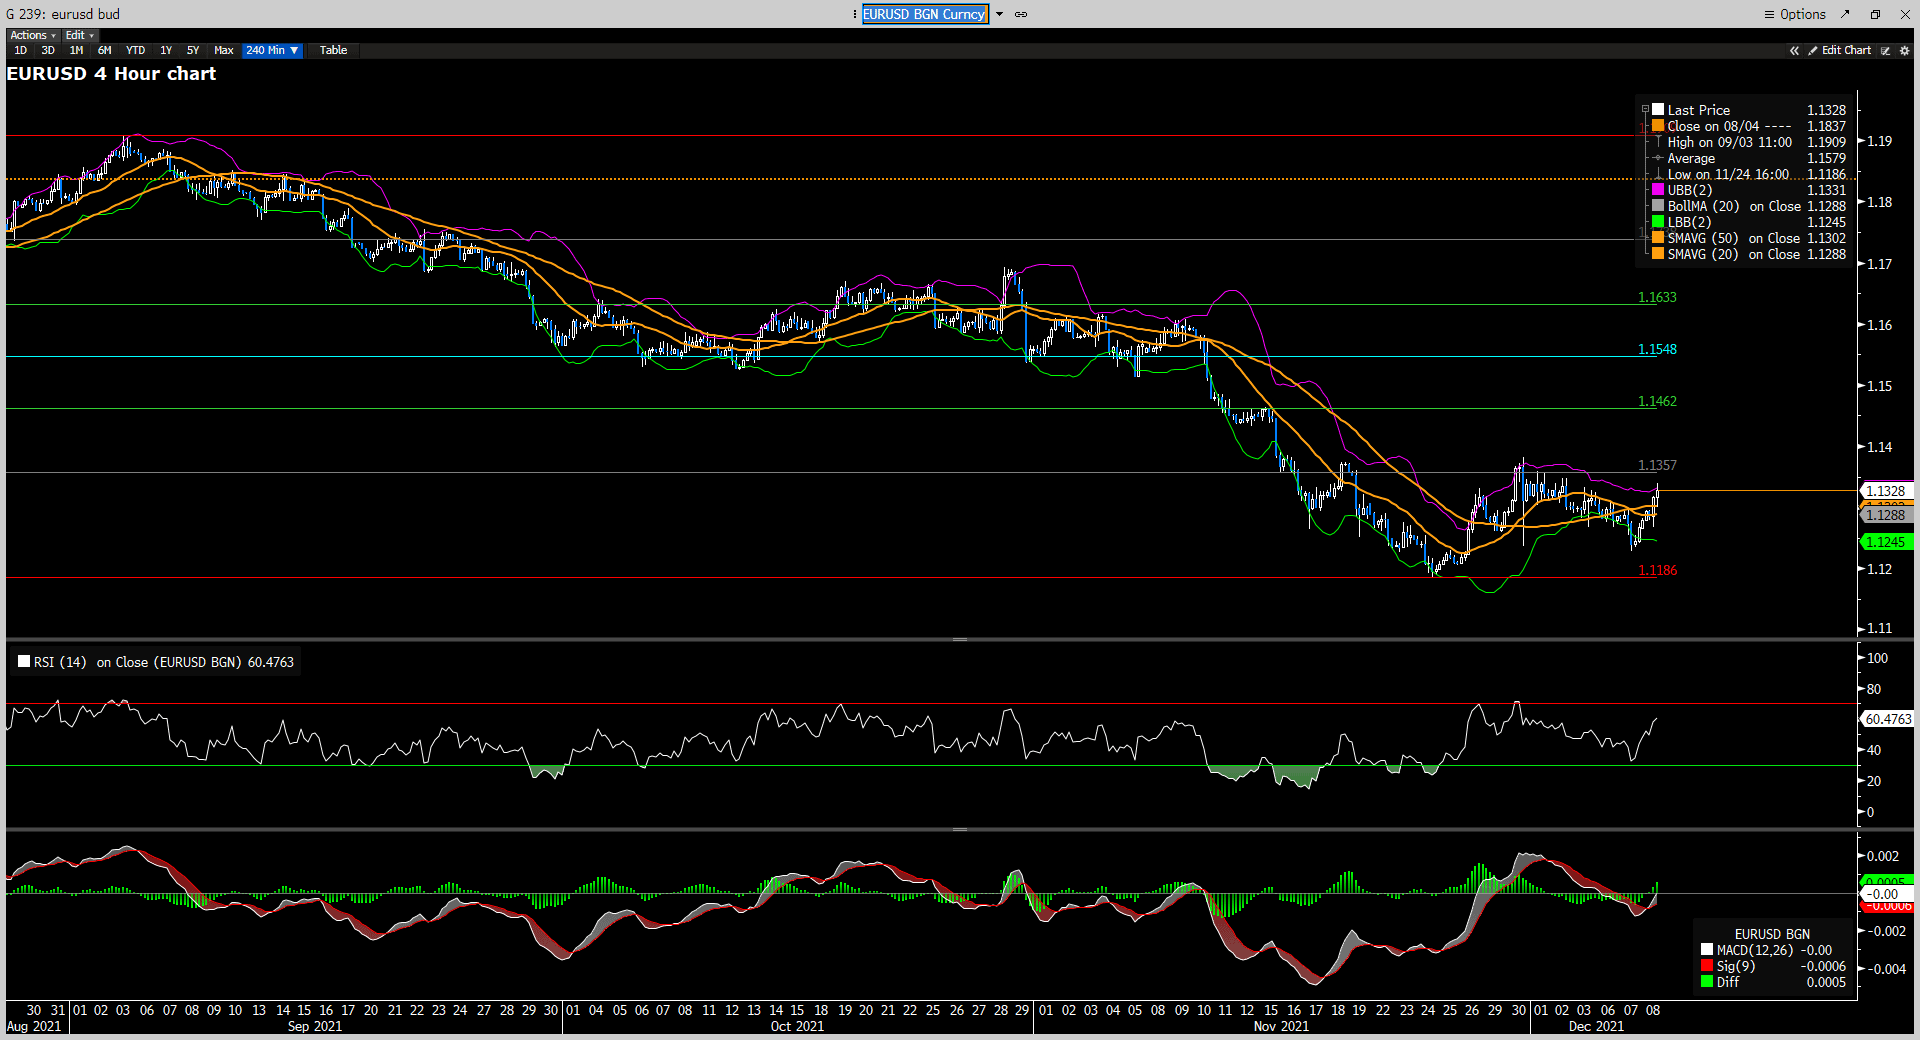
EURUSD rebounds toward 1.1300 to start the new week as the decline of the US bonds makes it difficult for the US dollar to outperform its rival currencies. From the technical perspective, the 4- hour outlook hints that the bullish momentum is still being limited as EURUSD continues to develop below the simple moving averages, currently hovering below the 20 and 50 SMAs. In the meantime, EURUSD keeps trading within the lower bounce of Bollinger Band after bottoming at 1.1259. It is expected to see the pair consolidate below the moving averages as the RSI is currently neutral, hovering around the midline; furthermore, the MACD is flat, neither supporting buyers nor sellers. Further movements of the pair will eye on Tuesday’s US PPI report.
Resistance: 1.1357, 1.1462, 1.1548
Support: 1.1186
Economic Data
|
Currency
|
Data
|
Time (GMT + 8)
|
Forecast
|
|
GBP
|
Average Earnings Index +Bonus (Oct)
|
15:00
|
4.6%
|
|
GBP
|
Claimant Count Change (Nov)
|
15:00
|
N/A
|
|
BRL
|
BCB Copom Meeting Minutes
|
19:00
|
N/A
|
|
USD
|
PPI (MoM) (Nov)
|
21:30
|
0.5%
|
|
|
|
|
|
|
|
|
|
|
|
|
|
|
|
|
|
|
|
|
|
|
|
|
|
|
|
|
|
|
|
|
|
|
|
|