As part of our commitment to provide the best reliability and service to our client, the trading hours of certain products will be adjusted as follows due to the maintenance.
Available trading hours:
2022/02/26 : [Market Closed All day]
2022/02/27 : 00:00 – 10:00 11:15 – 16:00 (Server time)
Kindly be reminded that the following things might be affected during this maintenance period:
1. The functions of funds operations might be disabled during this period.
2. There might be a gap between the original price and the price after maintenance. Pending orders, Stop Loss, and Take Profit settings within the gap will be filled at the market price after maintenance ends.
3. The quotations of products will be paused. Clients might not be able to open new positions or close the held positions.
No action is required by our client. Your service will be back online after the maintenance is completed.
Thank you for your patience and understanding with regard to this important initiative.
If you’d like more information, please don’t hesitate to contact [email protected].
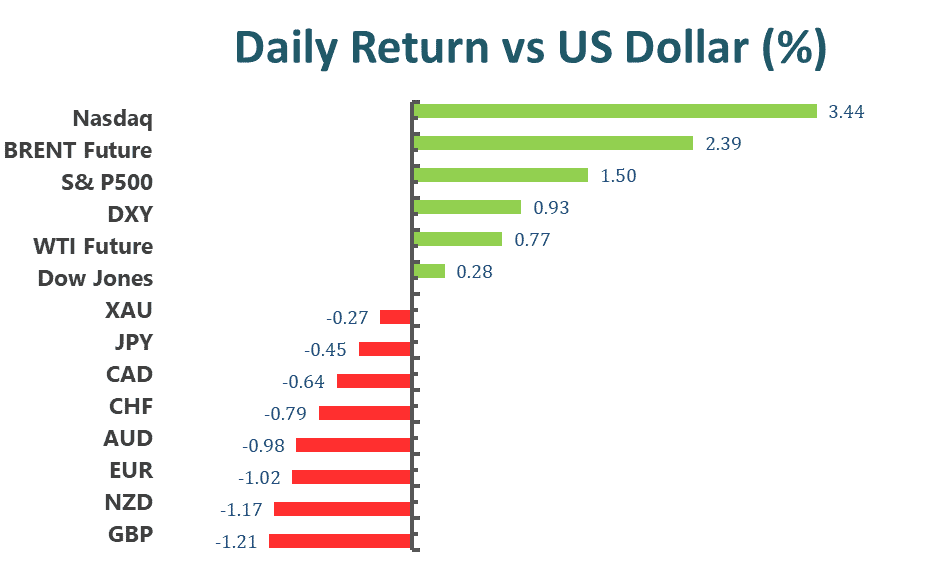
U.S. stocks staged a massive reversal Thursday after Wall Street’s main benchmarks each plunged more than 2% in early trading as Russia’s military invasion of Ukraine roiled financial markets around the globe. Nasdaq Composite rebounded from a morning sell-off that saw the index tumble more than 3% to close 3.4%, or 436 points higher, at 13,473.58 in its best day of 2022. The Dow Jones Industrial Average closed in positive territory after plunging more than 800 points during intraday trading, and the S&P 500 bounced back from a drop of 1.5% to close 1.5% higher at 4,288.69.
President Joe Biden imposed stiff sanctions on Russia over its invasion of Ukraine as Western nations warned that Kyiv could fall. As Russian tanks, troops and aircraft pushed closer to Ukraine’s capital city, Biden, speaking to the nation from the White House, promised to inflict a “severe cost on the Russian economy” that will hamper its ability to do business in foreign currencies.
“This is a dangerous moment for all of Europe,” Biden said, adding that the “next few weeks and months will be hard on the people of Ukraine.” The Russian military effectively eliminated Ukraine’s air defenses and rapidly advanced across the neighboring country, meaning Kyiv could quickly be overrun as well, a senior Western intelligence official said.
After weeks of warnings that an attack would bring about a “massive” economic response, Biden announced that the U.S. would sanction Sberbank — Russia’s largest lender — and four other financial institutions that represent an estimated $1 trillion in assets, as well as a broad swath of Russian elites and their family members. Treasury said the penalties target “nearly 80 percent of all banking assets in Russia.”
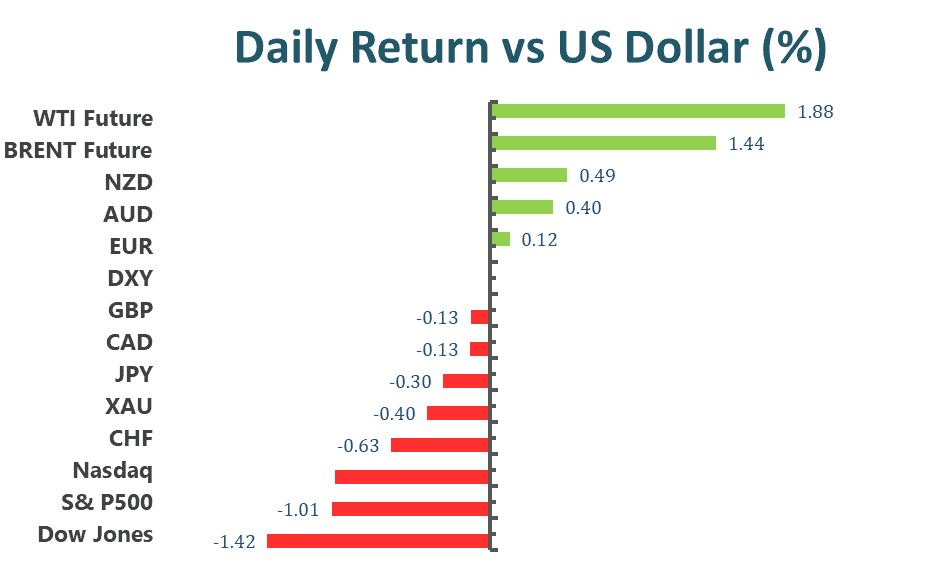
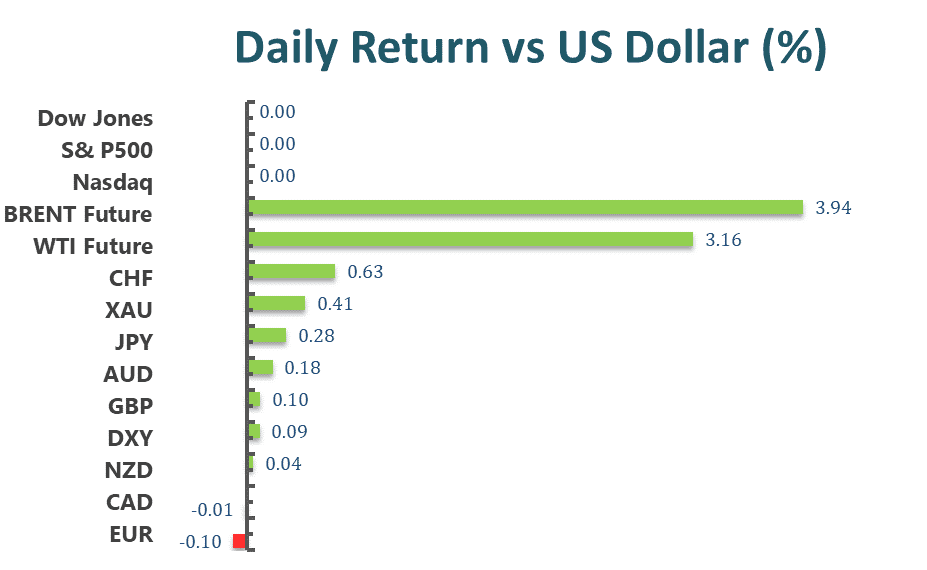
Main Pairs Movement:
Panic took over financial markets as Russia launched a military attack on Ukraine. Moscow attacked not only the Donbas region but got near Kyiv during US trading hours. Russia ignores global sanctions and seems determined to take full control of Ukraine.
Gold soared to $1.974.40 a troy ounce, its highest since September 2020. The yellow metal then retreated and plummeted to the intraday lows at $1,880.00 price zone during US trading hours, as investors unwind fear-related trades following US President Biden’s statement.
Meanwhile, Federal Reserve Raphael Bostic noted that Fed policy is poised to return to a more normalized stance. Among other things, he added that he is “very open” to going for more than 3 rate hikes this year.
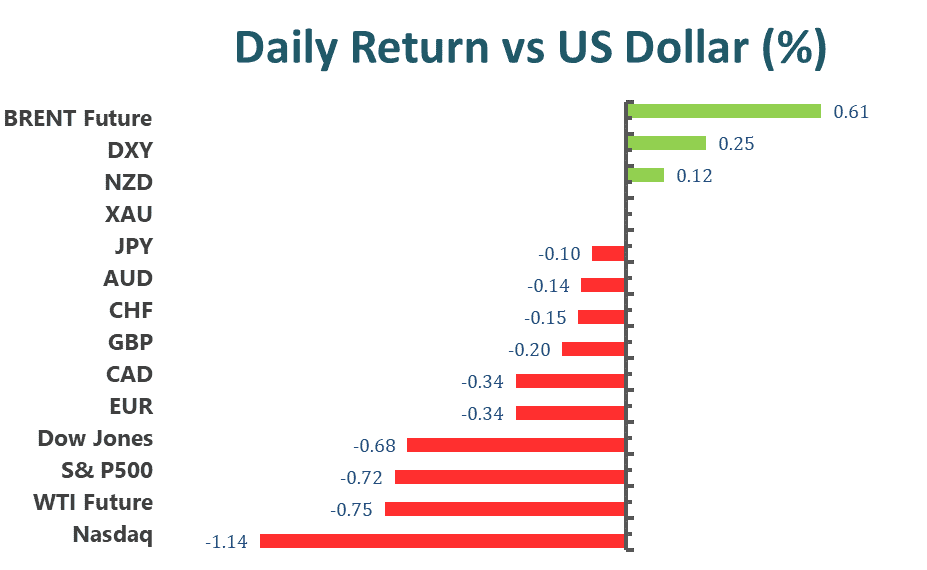
EUR/USD recovered from a fresh 2022 low of 1.1105 to currently trade around 1.1195. The GBP/USD pair stands at around 1.3380, while commodity-linked currencies dropped significantly during Thursday’s trade. Crude oil prices also dipped into negative territory after reaching multi-year highs. WTI traded as high as $100.50 a barrel, now changing hands at around $94.50. Brent trades at $99.50.
Technical Analysis:
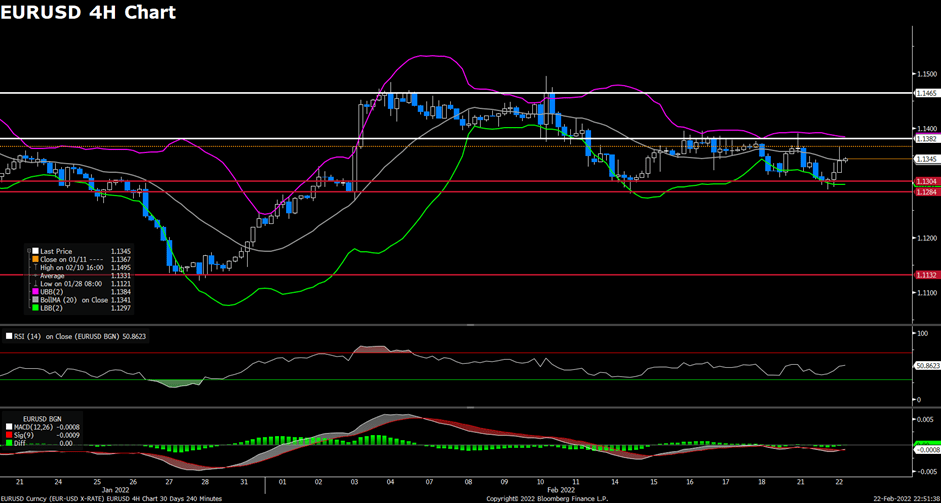
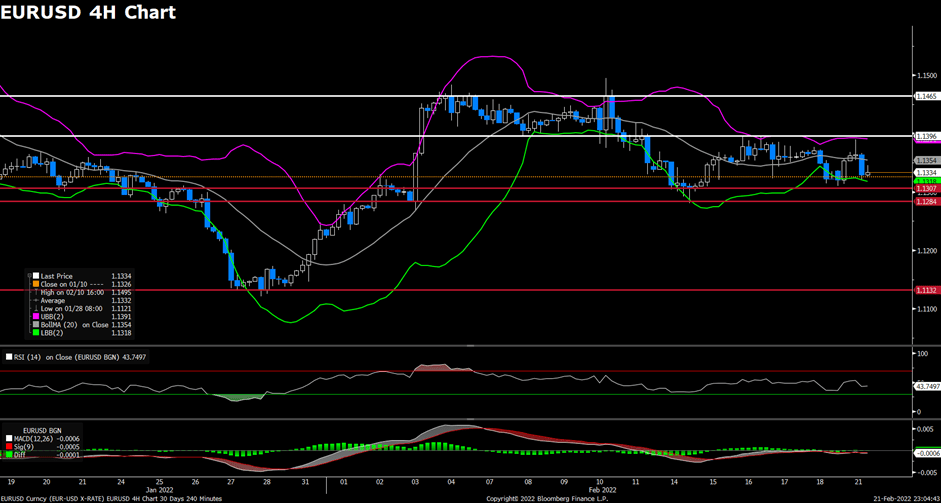
EURUSD (4-Hour Chart)
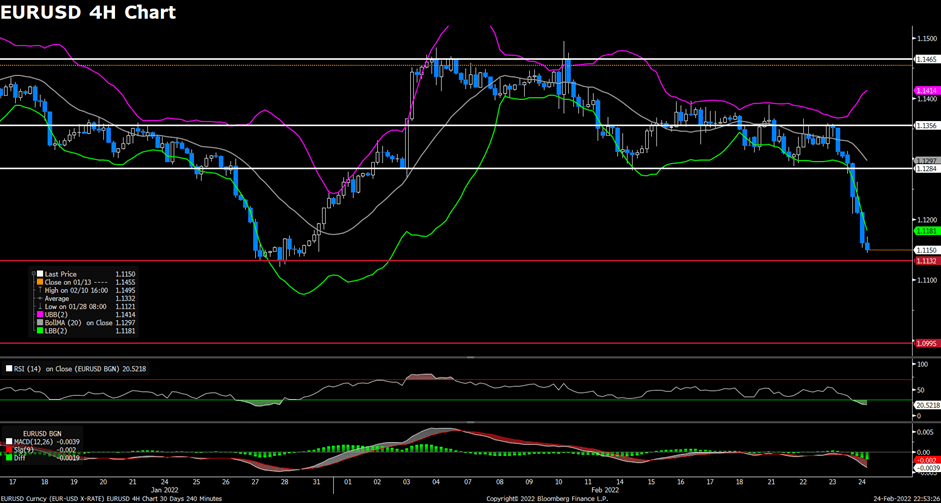
The EUR/USD pair tumbled on Thursday, extending its previous slide from 1.1360 level amid panic through financial markets. The pair was surrounded by heavy bearish momentum most of the day, collapsing to monthly lows below 1.1160 mark in early American session. The pair is now trading at 1.1148, posting a 1.36% loss on a daily basis. EUR/USD stays in the negative territory amid risk-off market sentiment, as Russia launched a full scale of invasion on Ukraine earlier in the day. The fact that Russia started the military assault on Ukraine bolstered the demand for the safer assets like the US dollar, meanwhile acting as a headwind for the EUR/USD pair. For the Euro, the latest geopolitical developments and risk appetite trends will keep deciding near-term direction for the currency, as there are no releases in the Eurozone calendar.
For technical aspect, RSI indicator 20 figures as of writing, suggesting that the pair is in oversold zone now, a trend reversal could be expected. But for the Bollinger Bands, the price is dropping out of the lower band, indicating a strong trend continuation for the pair. In conclusion, we think market will be bearish as the pair is heading to test the 1.1132 support. The pair is clearly bearish in its 4-hour chart, with technical indicators heading firmly lower within negative levels.
Resistance: 1.1284, 1.1356, 1.1465
Support: 1.1132, 1.0995
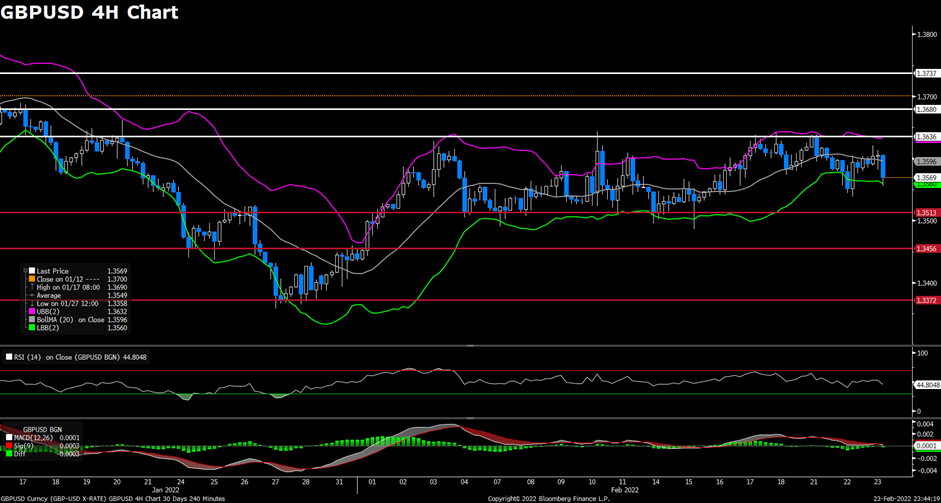
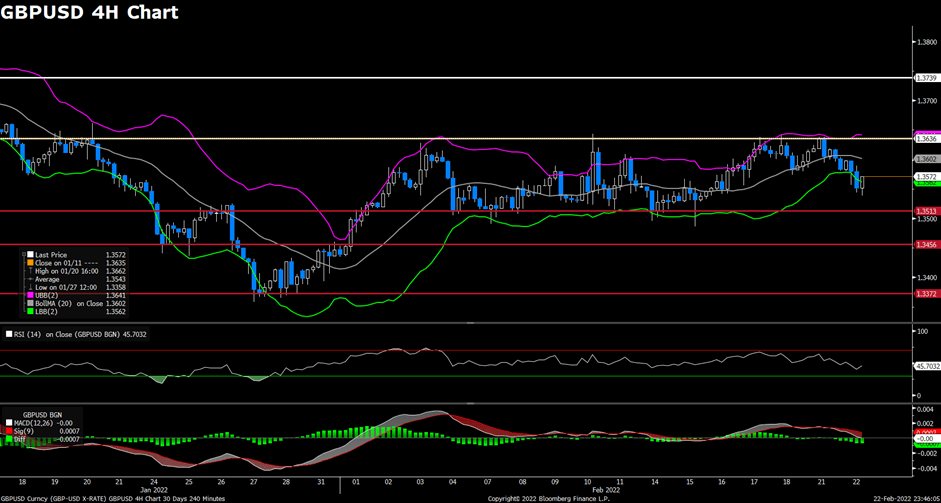
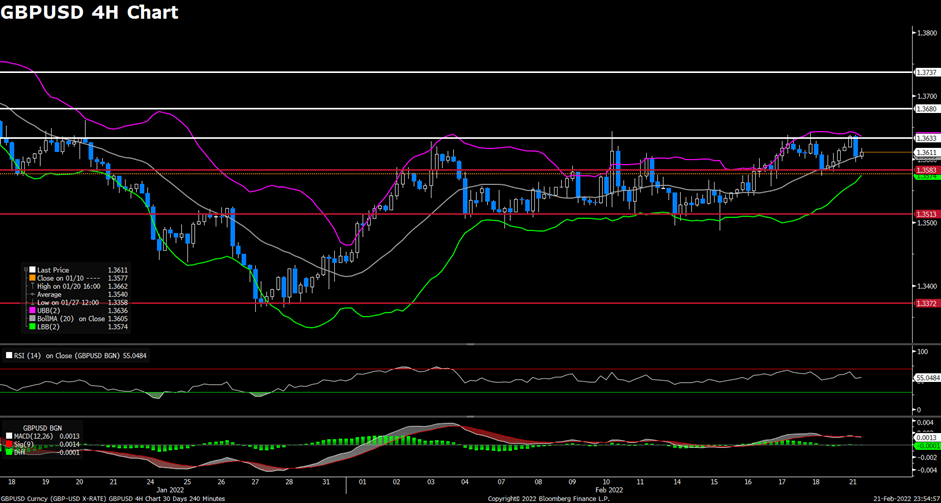
GBPUSD (4-Hour Chart)
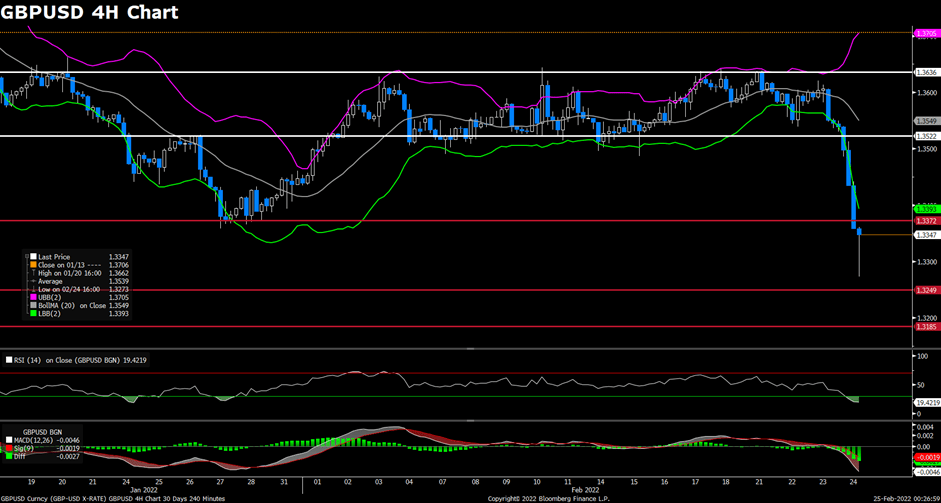
The pair GBP/USD plunged on Thursday, suffering heavy losses and dropping to 1.3300 area after Russia’s invasion of Ukraine. The pair remained under massive selling pressure and refreshed its monthly low near 1.3310 mark, extending its heavy intraday losses heading into American session. At the time of writing, the cable stays in negative territory with a 1.43% loss for the day, preserving its downside traction on renewed US dollar strength. Investors now abandon their riskier assets and turned to safe-haven assets after Russian President Vladimir Putin authorized a special military operation in Donbas earlier in the day. A massive sell-off was also seen in the equity markets. For British pound, the currency is now undermined by the fact that the escalating tensions between Russia and Ukraine could dampen prospects for a 50 bps rate hike by the BoE at its March meeting.
For technical aspect, RSI indicator 19 figures as of writing, suggesting that a trend reversal could be possible as the pair is in oversold zone now. For the Bollinger Bands, the price is moving out of the lower band, indicating a strong trend continuation. In conclusion, we think market will be bearish as the pair just dropped below the previous 1.3372 support. If the bear can find constant strength below that level, short-term additional losses could be expected.
Resistance: 1.3522, 1.3636
Support: 1.3372, 1.3249, 1.3185
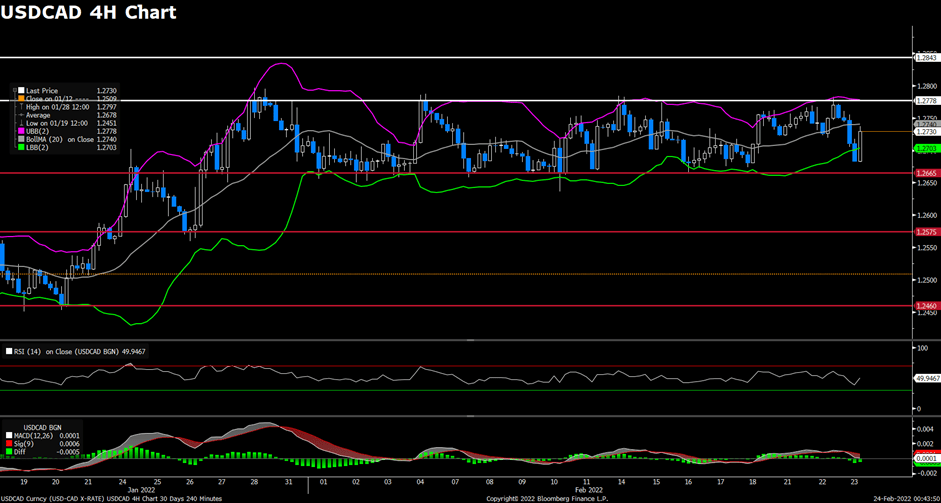
USDCAD (4-Hour Chart)
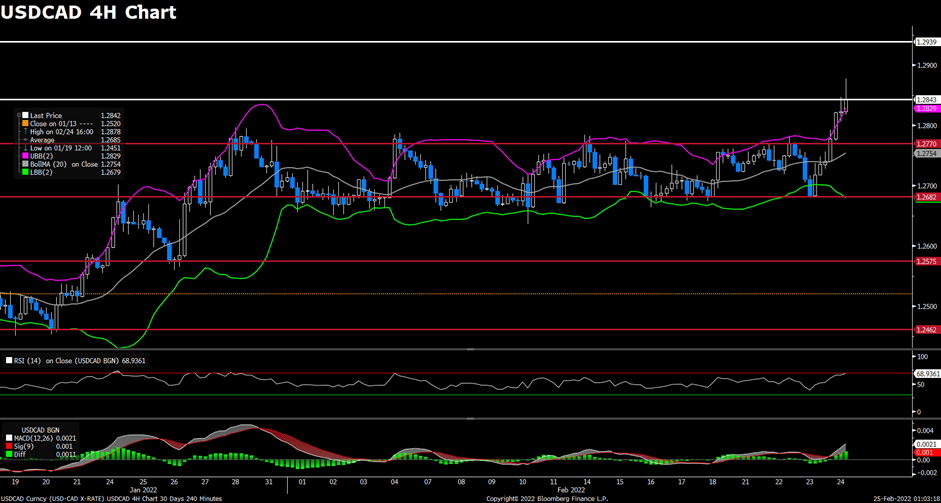
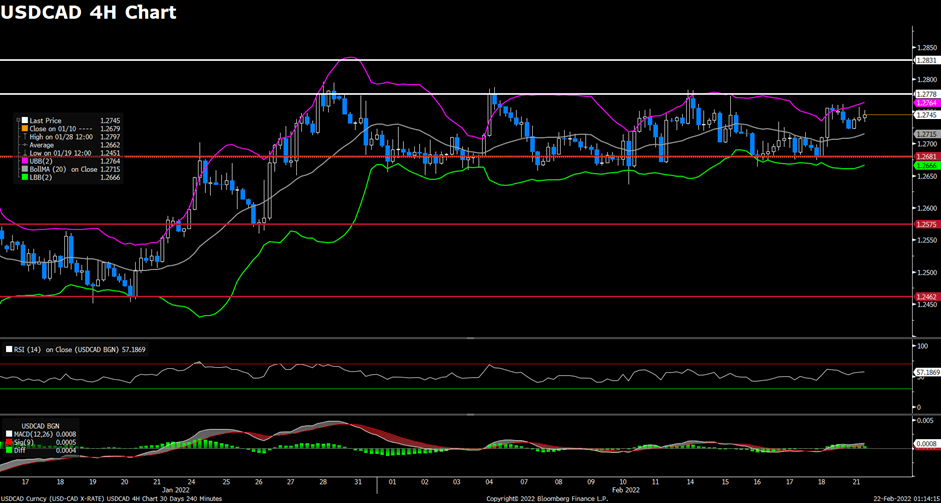
After Russia launched a full scale of invasion on Ukraine today, the pair USD/CAD came under slightly upside momentum amid stronger US dollar across the board. The pair witnessed fresh buying most of the day and reached the highest level since December 2021, now retreated slightly to surrender some of its daily gains. USD/CAD is trading at 1.2841 at the time of writing, rising 0.83% on a daily basis. Russian troops continued to cross the Ukrainian border and have reportedly destroyed Ukrainian military bases. Therefore, the worsening situation in Ukraine help the greenback to find strong demand and pushed USD/CAD higher. However, surging crude oil prices had underpinned the commodity-linked loonie and limit further gains for USD/CAD pair. WTI advanced to around $100 a barrel for the first time in eight years, as concerns about disruptions on global oil supply elevate following the attack from Russia.
For technical aspect, RSI indicator 69 figures as of writing, suggesting that the pair is technically oversold in the near term. As for the Bollinger Bands, the price moved out of the upper band so a trend continuation is possible. In conclusion, we think market will be bullish as the pair is testing the 1.2843 resistance. On the upside, the pair could push lower toward 1.2900 if that resistance fails.
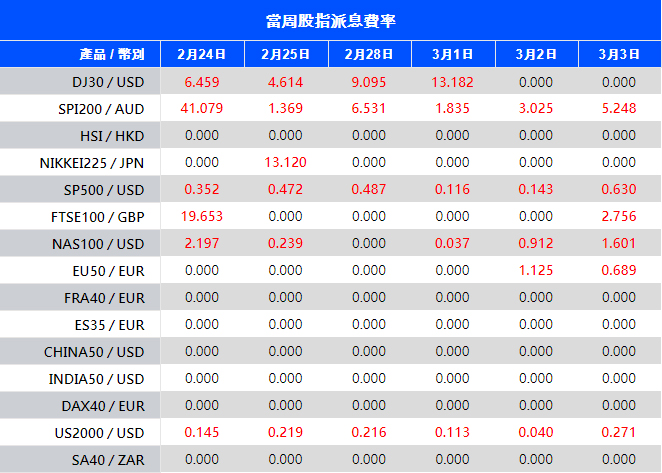
Warmly reminds you that the component stocks in the stock index spot generate dividends. When dividends are distributed, VT Markets will make dividends and deductions for the clients who hold the trading products after the close of the day before the ex-dividend date.
Indices dividends will not be paid/charged as an inclusion along with the swap component. It will be executed separately through a balance statement directly to your trading account, the comment for which will be in the following format “Div & Product Name & Net Volume ”.
Please note the specific adjustments as follows:
Note: The above data is for reference only, the actual execution data may be changed, please refer to the MT4/MT5 software for details.
If you’d like more information, please don’t hesitate to contact [email protected].
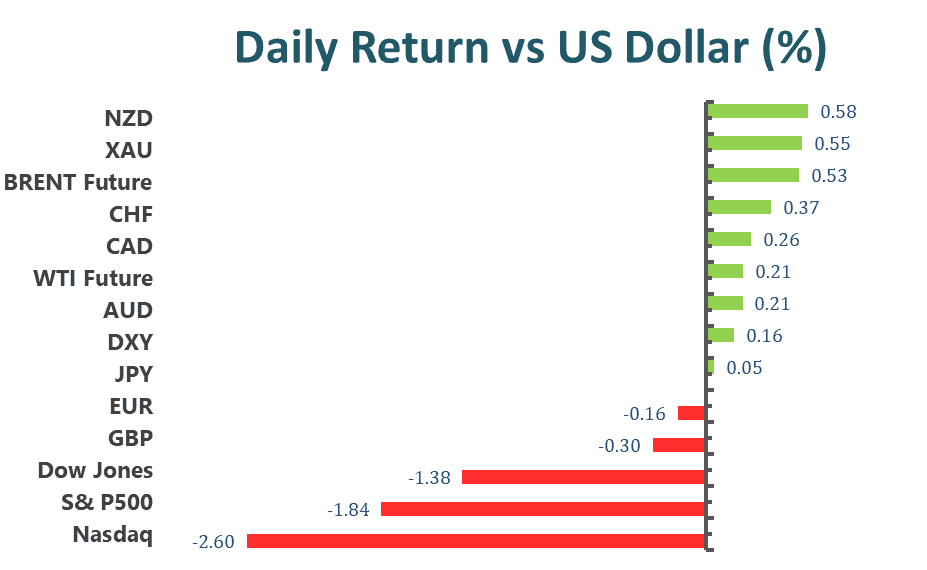
Wall street three major indexes ended sharply lower on Wednesday, extending recent losses as Ukraine declared a state of emergency and the U.S. State Department said the possibility of a Russian invasion of Ukraine remained looming. Hence, as tensions escalate, the Dow is also facing a correction. Despite rising tensions and no sign the Russians will back down, the White House said President Joe Biden has no intention of sending U.S. troops to fight in Ukraine. However, the United States has taken some action, imposing further sanctions on Nord Stream 2 AG, the company responsible for the construction of Russia’s Nord Stream 2 gas pipeline, aimed at limiting Russia’s ability to raise money from the West. Meanwhile, the European Union is scheduled to hold an emergency summit on Thursday to discuss Russia’s next steps after its entry into Ukraine. At the end of the market, the Dow Jones Industrial Average fell 1.38% to 33,131.76 points, the S&P 500 index lost 1.84% to 4,225.50 and the Nasdaq Composite Index dropped 2.57% to 13,037.49 points.
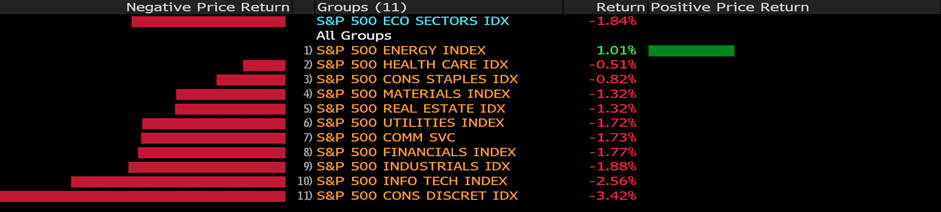
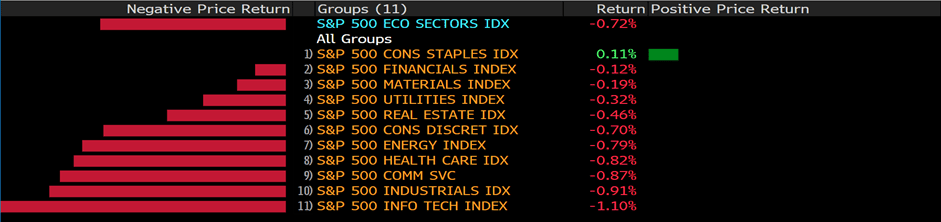
10 sectors in the S&P 500 ended lower, with the consumer discretionary falling the most, down 3.42%, followed by technology and industrials sectors, down 2.56% and 1.88%, respectively. The lone winner was the oil-related sector, energy, which rose 1.01%. Geopolitical tensions aside, a string of quarterly earnings from consumer discretionary companies including TJX Companies, Lowe’s Companies and Caesars Entertainment was in focus. TJX Corporation fell 5% after reporting fourth-quarter results, as higher costs and supply chain disruptions caused by the pandemic weighed on growth. Meanwhile, Lowe’s pared some of its gains as strong demand for home improvement tools and building materials boosted fourth-quarter results, but rose about 1% after issuing better-than-expected guidance. Caesars Entertainment reported a narrower quarterly loss as demand rebounded and revenue surged after pandemic restrictions eased. Its shares rose more than 3%.
Main Pairs Movement:
Investors were upbeat about developments in Eastern Europe on the day, but sentiment soured during U.S. trading hours, sending the greenback stronger against most of its major rivals. Ukraine has declared a state of emergency for 30 days starting on February 24, and U.S. intelligence reports have suggested that Russia could invade within the next 48 hours despite multiple Western sanctions on Russia. Additionally, several Ukrainian government websites went offline after blaming Russia for the DDoS attack.
EUR/USD remained in a consolidating range around 1.1300, slowly heading south to hit weekly lows.
GBP/USD also weakened below 1.35800 and returned to consolidation area. On the other hand, commodity-linked currencies were lower, but maintained their intraday gains. AUD/USD rose for a third day, hitting a daily high of 0.72838, but then pared gains to settle near 0.7230.
The safe-haven Swiss franc and Japanese yen edged higher against the dollar, with gold continuing its gains and holding above the 1900 level.
On the other hand, oil prices closed higher again, with WTI up 0.73% and Brent up 0.66%.
Technical Analysis:
EURUSD (4-Hour Chart)
The EUR/USD pair edged higher on Wednesday, extending its previous rally from a weekly low that touched yesterday amid risk-on market environment. The pair preserved its bearish momentum and touched a daily low in early European session, but then started to rebound back to 1.1350 area to erase all of its daily losses. The pair is now trading at 1.1333, posting a 0.08% gain on a daily basis. EUR/USD stays in the positive territory amid weaker US dollar across the board, as the upbeat market mood make it difficult for the greenback to find demand. However, the US and several European leaders both announced sanctions against Russia, therefore developments in Eastern Europe might limit the losses for the greenback. For the Euro, hawkish comments by ECB’s Board member R.Holtzmann has lent support to the EUR/USD pair, as he said that it’s possible for ECB to hike rates before ending bond purchases.
For technical aspect, RSI indicator 47 figures as of writing, suggesting that bear is preserving strength as the RSI is moving south. As for the Bollinger Bands, the price retreated back to the moving average, which indicates that the downside traction could persist. In conclusion, we think market will be slightly bearish as long as the 1.1382 resistance line holds. Tensions between Russia and Ukraine will remain to be market focus.
Resistance: 1.1382, 1.1465
Support: 1.1284, 1.1196, 1.1132
GBPUSD (4-Hour Chart)
The pair GBP/USD declined on Wednesday, lacking further strength to extend the rally from one-week lows amid dovish BoE comments. The pair was flirting with 1.3580~1.360 area during Asian session, then started to see some selling and dropped towards 1.3570 level heading into American session. At the time of writing, the cable stays in negative territory with a 0.06% loss for the day, remaining under pressure on recovering US dollar. The sanctions announced by the US against Russia were not as harsh as feared by the market, weighing on safe haven assets and favored investors’ sentiment. For British pound, Bank of England Governor Andrew Bailey said that they have two-sided risks to their inflation forecasts and higher interest rates will also raise unemployment and slow growth. Therefore, the hawkish comment acted as a headwind for the cable and capped its upside.
For technical aspect, RSI indicator 43 figures as of writing, suggesting that downside is more favored as the RSI stays below the mid-line. For the Bollinger Bands, the price is moving out of the lower band, indicating a strong trend continuation. In conclusion, we think market will be slightly bearish as the pair failed to test the 1.3636 resistance, but the cable need a break below 1.3513 support to open the road for additional losses.
Resistance: 1.3636, 1.3680, 1.3737
Support: 1.3513, 1.3456, 1.3372
USDCAD (4-Hour Chart)
As the risk-on mood weighed on the safe-haven US dollar today, the pair USD/CAD came under bearish momentum and extended its slide from 1.2780 area. The pair suffered heavy losses most of the day and dropped to a weekly low below 1.2690 level, now bouncing back slightly to recover some of its daily losses. USD/CAD is trading at 1.2730 at the time of writing, losing 0.32% on a daily basis. The new economic sanctions on Russia were not as bad as market’s expectation, easing the concerns about Russia/Ukraine conflict and disfavored the safe-haven greenback. On top of that, surging crude oil prices also lend strong support to the commodity-linked loonie and undermined USD/CAD pair. WTI now bounces back to the $92.00 per barrel area, as concerns about a full-scale Russian invasion of Ukraine remain elevated and put negative pressure on future global oil supply.
For technical aspect, RSI indicator 48 figures as of writing, suggesting that upside is preserving some upside strength as the RSI starts to move north. As for the Bollinger Bands, the price move immediately back inside the lower band after moving out of it, which showed that upside momentum could be expected. In conclusion, we think market will be bullish as the rising RSI reflects bull signals. If the pair crosses above the moving average in Bollinger Bands, the upper band will becomes the profit target.
Wall street three major indexes tumbled on Tuesday, with the S&P 500 confirming a correction, as the Ukraine-Russia crisis unnerved investors after Russian President Vladimir Putin recognized two expanded borders of Luhansk and Donetsk and ordered troops to the area. In addition, the U.S. outlined new sanctions to prevent Russia from opening up more territory in Ukraine, turning hope into despair and fueling a climate of insecurity. Regarding sanctions, Biden said the US has no intention of fighting Russia. He said the sanctions targeted Russian banks and sovereign debt, among others. At the end of the market, the Dow Jones Industrial Average fell 1.42% to 33,596.61 points, the S&P 500 index lost 1.01% to 4,304.76 and the Nasdaq Composite Index dropped 1.23% to 13,381.52 points.
Eleven sectors in the S&P 500 all ended lower, with the consumer discretionary falling the most, down 3.04%, followed by energy and material sectors, down 1.53% and 1.38%, respectively. In the consumer discretionary sectors, Home Depot slumped more than 8% despite better-than-expected fourth-quarter results. Home Depot reported fourth-quarter earnings of $3.21 on revenue of $35.72 billion and comparable sales of 8.1%. The energy sector was dragged down by a drop in oil prices, which retreated from session highs. Pioneer Natural Resources, APA and Devon Energy were the hardest-hit stocks in the energy sector, all down more than 3%. Big tech stocks such as Apple, Amazon, Microsoft, Alphabet and Facebook ended lower, but with smaller losses.
Main Pairs Movement:
The geopolitical tension between Russia and Ukraine continued to ferment, and the three major Wall Street stock indexes continued to fluctuate and fell. Investors paid more attention to defensive sectors and safe-haven products such as bonds and gold.
EUR/USD remains in the consolidated range around 1.1350, so does GBP/USD, and it settles around 1.3560. USD/CAD retreated sharply before the close, closing around 1.2740, while AUD/USD rose for the second day in a row, closing around 07220.
The safe-haven Swiss franc and Japanese yen edged lower against the greenback, while gold prices continued to rise and topped $1,914 an ounce intraday, but then retreated to settle at $1,898.
On the other hand, oil prices faced the selling pressure, with WTI lost 2.49% and closing at $91.60 a barrel and Brent lost 0.6% and closing at $96.84 a barrel.
Technical Analysis:
EURUSD (4-Hour Chart)
The EUR/USD pair advanced on Tuesday, ending its two-day slide that dropped to 1.1290 area amid improving market mood and upbeat economic data. The pair was trading lower and touched a one-week low in early European session, but then advances to 1.1350 area to erase all of its daily losses. The pair is now trading at 1.1344, posting a 0.33% gain on a daily basis. EUR/USD stays in the positive territory amid weaker US dollar across the board, as Ukraine president Volodymyr Zelenskyy’s comment lend some support to market sentiment and disfavored the greenback. He said that he believes there would not be war nor a wider escalation between Russia and Ukraine. For the Euro, the German IFO Business Climate Index came at 98.9 in February, which beat market’s expectations of 96.5 and acted as a tailwind for the EUR/USD pair.
For technical aspect, RSI indicator 50 figures as of writing, suggesting that the pair is lacking directions at the moment. As for the Bollinger Bands, the price rose from the lower band and touched the moving average, which indicates a continuation of upside action. In conclusion, we think market will be slightly bullish as long as the 1.1304 support line holds. Investors will keep eyeing on the Russia/Ukraine tensions.
Resistance: 1.1382, 1.1465
Support: 1.1304, 1.1284, 1.1132
GBPUSD (4-Hour Chart)
The pair GBP/USD declined on Tuesday, coming under selling pressure and extending the slide that start yesterday despite improving market mood. The pair was surrounded by bearish momentum most of the day, failing to stage a rebound in early European session and retreated to 1.3550 area amid renew selling. At the time of writing, the cable stays in negative territory with a 0.18% loss for the day, remaining under pressure on mixed Russia/Ukraine developments. The weaker US dollar failed to pushed the cable higher, as UK PM Boris Johnson formally announce economic sanctions against Russia for a breach of international law. This has made the British pound the worst performing G10 currency on the day. For British pound, Bank of England Deputy Governor Dave Ramsden said that some further policy tightening seems likely to be need in the near term. The hawkish comment might limit the losses for the cable.
For technical aspect, RSI indicator 43 figures as of writing, suggesting that downside is more favored as the RSI stays below the mid-line. For the Bollinger Bands, the price move immediately back inside the lower band after moving out of it, indicating a possible upside traction for cable. In conclusion, we think market will be bullish as the pair might attract some dip-buying, but a break above 1.3636 resistance is needed for the cable to edge higher.
Resistance: 1.3636, 1.3739
Support: 1.3513, 1.3456, 1.3372
USDCAD (4-Hour Chart)
As the market sentiment turned slightly upbeat on Tuesday, the pair USD/CAD witnessed some bearish momentum and failed to extend previous day’s rally amid renewed US dollar weakness. The pair flirted with 1.2750~1.2765 area during Asian session, then started to see fresh selling and refreshed its daily low around 1.2720 level. USD/CAD is trading at 1.2737 at the time of writing, losing 0.13% on a daily basis. Market concerns about the escalating situation in Ukraine had eased after a Kremlin spokesperson said that Russia is still open to diplomacy and has an interest in that. Therefore, the news driving flows away from safe-haven greenback and weighed on USD/CAD pair. However, falling crude oil prices should limit the downside for the pair as WTI retreated to the $91.00 per barrel area. But expectations for a disruption in global oil supply might keep lending support to the black gold.
For technical aspect, RSI indicator 51 figures as of writing, suggesting that upside is gaining some upside strength as the RSI starts to head north. As for the Bollinger Bands, the price bounced back from the moving average, which showed that a trend reversal could be expected. In conclusion, we think market will be bullish as the firmer RSI line keeps buyers hopeful. if the pair manage to conquer the 1.2778 resistance, further upside could be expected.
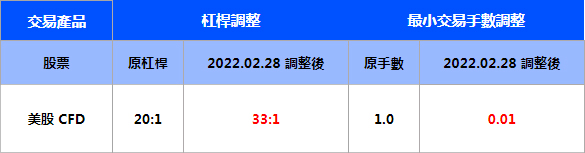
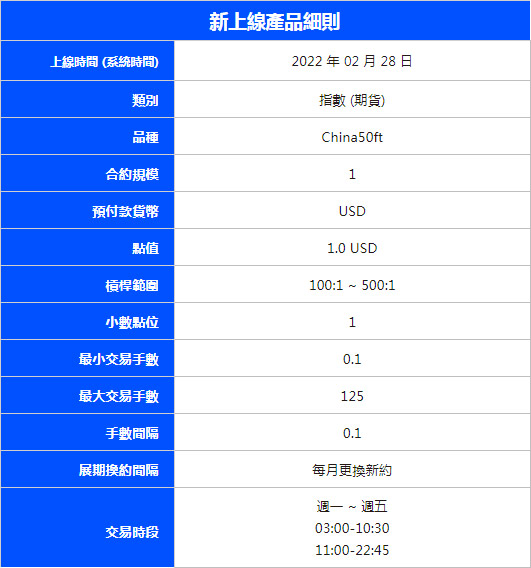
To provide a favorable trading environment to our clients, VT Markets will modify the trading setting of US Shares at the following time:
1. The leverage of US Shares will be changed to 33:1 fixed leverage. 2. The minimum lot of US Shares will be chenged to 0.01.
VT Markets will enforce this new policy at: 00:00 on Feb. 28th, 2022 (GMT+2).
Notes: The figures above are only for reference. The actual execution data should be subject to the numbers on MT4/MT5.
Friendly reminders: 1. All specifications of US Shares stay the same except leverage and minimum lot. 2. $6 commisssion per side on US CFD shares products.
If you’d like more information, please don’t hesitate to contact [email protected].
Stocks declined Tuesday on intensifying tension between the West and Russia over Ukraine, a standoff that leads investors to seek the relative safety of bonds and gold. Equities in Japan, Australia and South Korea fell, while U.S. futures pointed to a lower open when Wall Street trading resumes later following a holiday Monday.
President Vladimir Putin announced he’s recognizing two self-proclaimed separatist republics in eastern Ukraine, a dramatic escalation in Russia’s standoff with the West as the U.S. and its allies continue to warn it could soon invade its neighbor.
Those fears were likely heightened by the detail of the decrees signed by Putin, including an order for the Defense Ministry to send what he called “peacekeeping forces” to the breakaway regions. There were no details so far on how many troops might go in, or when, but Russia has previously accused Ukraine of having a significant deployment of its own soldiers on the line of contact with the separatists.
While Russia will argue that Putin’s recognition of the separatist regions gives a legal basis for the presence of its troops, the move will likely fuel U.S. and European concerns that Moscow is moving to take control of territory internationally recognized as part of Ukraine, and would put his forces closer to direct confrontation with Ukrainian soldiers.
“The question is now whether the U.S. and its partners are ready to pursue dialog in these new conditions,” said Andrey Kortunov, head of the Kremlin-founded Russian International Affairs Council. “We can say the worst hasn’t happened — a major new war hasn’t started, at least for now — but after the recognition we’re likely to see Russian troops deployed up to the border with the rest of Ukraine and this will be seen as an act of aggression with all the consequences.”
Main Pairs Movement:
Risk-off mood took over financial markets at the start of the week amid escalating geopolitical tensions in Eastern Europe. The greenback managed to advance against its high-yielding rivals but lost ground against safe-haven ones.
Mid US-afternoon on Monday, Russian President Vladimir Putin recognized Donetsk and Luhansk in Eastern Ukraine as independent states signed a decree “on friendship and cooperation.” The world sees this decision as the first step towards an invasion, which also invalidates talks with Western nations.
The Euro pair dived below 1.1300 in the early Asian session and now hovers around the 1.1310 levels. Cable fell over 1.3600, now trades at 1.3590. Commodity-linked currencies traded mixed against greenback for another day, as gold pushed past $1,910 a troy ounce amid demand for safety, and crude oil prices continue to climb on disruption fears. WTI now changes hands at $92.40 a barrel, while Brent at $97.30.
Technical Analysis:
EURUSD (4-Hour Chart)
The EUR/USD pair advanced on Monday, rebounding from 1.1310 area amid recovering market mood. The pair saw fresh buying and touched a daily high near 1.1390 mark in early European session, but failed to preserve its bullish strength while surrendering most of its intraday gains. The pair is now trading at 1.1333, posting a 0.13% gain on a daily basis. EUR/USD stays in the positive territory amid weaker US dollar across the board, as the news reported that French President has arranged a meeting between US President Joe Biden and Russian president Vladimir Putin this week boosted market sentiment and weighed on the greenback. For the Euro, the better-than-expected Eurozone PMI data released today acted as a tailwind for EUR/USD pair, showing a rebound in service sector sentiment and falling Omicron infection rates.
For technical aspect, RSI indicator 43 figures as of writing, suggesting bear movement ahead. As for the Bollinger Bands, the price is now struggling around the lower band, which indicates that the pair remain directionless. In conclusion, we think market will be slightly bearish as the pair might test the 1.1307 support. The continuing escalation in violence in Ukraine’s Donbass region could keep weighing on EUR/USD, and the pair could extend its slide toward 1.1300 after breaking that support.
Resistance: 1.1396, 1.1465
Support: 1.1307, 1.1284, 1.1132
GBPUSD (4-Hour Chart)
The pair GBP/USD edged higher on Friday, retreating toward 1.3600 level and lost its upside traction amid renewed concerns about tensions between Russia and Ukraine. The pair was pushed higher to near 1.3640 mark by the positive shift witnessed in risk sentiment, but then dropped to 1.3600 area amid renew selling. At the time of writing, the cable stays in positive territory with a 0.22% gain for the day, lacking upside momentum. The weaker US dollar lend support to the cable, but the news that US received information suggesting that Russia was preparing for military action against Ukraine might limit the losses for greenback. For British pound, the UK Preliminary Services PMI jumps to 60.8 in February, which surpassed market expectations of 55.5 and underpinned the GBP/USD pair.
For technical aspect, RSI indicator 56 figures as of writing, suggesting that upside is more favored as the RSI stays above the mid-line. For the Bollinger Bands, the price is now rising towards the upper band again after touching moving average, indicating a possible upside traction for cable. In conclusion, we think market will be bullish as the pair might re-test the 1.3633 resistance. A break above that level could open the road for near-term gains.
Resistance: 1.3633, 1.3680, 1.3737
Support: 1.3583, 1.3513, 1.3372
USDCAD (4-Hour Chart)
As the concerns about conflicts between Russia and Ukraine eased earlier today, the pair USD/CAD witnessed some selling and remained under pressure on US dollar weakness. The pair dropped to a daily low below 1.2730 level in early European session, then rebounded towards 1.2760 area to recover most of its daily losses. USD/CAD is trading at 1.2745 at the time of writing, losing 0.07% on a daily basis. Positive news on Ukraine-Russia fears has favored the market mood, as US President Biden agreed to participate the meeting with Russia President Putin later this week if an invasion hasn’t happened. On top of that, rising crude oil prices also undermined the USD/CAD pair, now WTI is trading flat in the $92.00 per barrel area. But traders continue to weigh ongoing escalation in the Russia/Ukraine crisis, which might disrupt global oil supply.
For technical aspect, RSI indicator 57 figures as of writing, suggesting that upside is preserving strength as the RSI is approaching 60. As for the Bollinger Bands, the price is now climbing towards the upper band, which showed that upside momentum could be expected. In conclusion, we think market will be bullish as the short-term technical outlook for USD/CAD remains bullish with the RSI indicator on the four-hour chart holding above 50.
Stocks extended declines Friday to close a second straight week in negative territory with geopolitical tensions intensifying to contribute to a further risk-off tone in markets. Dow Jones closed down 0.68% to 34,079.12 after erasing 1.8% Thursday for its worst day in nearly three months, and it also closed at its lowest level since September. The Nasdaq Composite shed 1.23% to 13,548.07 — its lowest level since January. Meanwhile, the CBOE Volatility Index (VIX), or “fear gauge,” spiked back to hover near January 28th highs.
Just 7 weeks ago, Zhenro Properties Group Ltd had announced plans to redeem a perpetual bond and claimed that one of its units had secured a 9.14 billion yuan ($1.44 billion) credit line from state-owned Bank of China Ltd. Zhenro’s short-dated bonds were trading near 80 cents on the dollar, compared with 17 cents for embattled property giant China Evergrande Group.
Now Zhenro has become the latest developer to warn it may not meet its obligations, an U-turn that’s extreme even by the standards of an industry where negative surprises have multiplied over the past year.
The company’s sudden and mysterious slide into distress is raising investors’ concerns toward many of its peers, overshadowing efforts by the Chinese government to curb financial contagion in a real estate sector that generates nearly 30% of economic output. Speculation about a piotential default at Zhenro helped spark a broad slump in Chinese developer bonds last week, driving up financing costs for companies that need to repay almost $100 billion of debt this year.
Main Pairs Movement:
The dollar traded within tight ranges versus major currencies as a holiday-muted week got underway in the Asia-Pacific on Monday, with little sign of risk-off sentiment amid geopolitical tensions over Ukraine. The greenback trades at familiar levels with most of its major peers, while the Aussie was quoted lower, following a local naval spat with China.
EUR/USD opened Monday at 1.1315, around 4 pips lower than its Friday close but soon bounced back to around 1.1320. GBP/USD started the week with a 10-pip rally in the first hour, trading at 1.3591 as of writing. AUD/USD eases 0.2% to 0.7164; pair finished last week 0.6% higher for its third weekly advance. USD/JPY falls 0.1% to 114.92 after finishing last week 0.4% lower
Gold surged a significant $7 per troy ounce in few minutes after its open due to the rising military conflict possibility between Ukraine and Russia. Crude oil prices as well surged strongly, with WTI traded at $92.60 a barrel, up 0.65% than Friday’s close, and Brent at $94.80 a barrel, up 1.24%.
Technical Analysis:
EURUSD (4-Hour Chart)
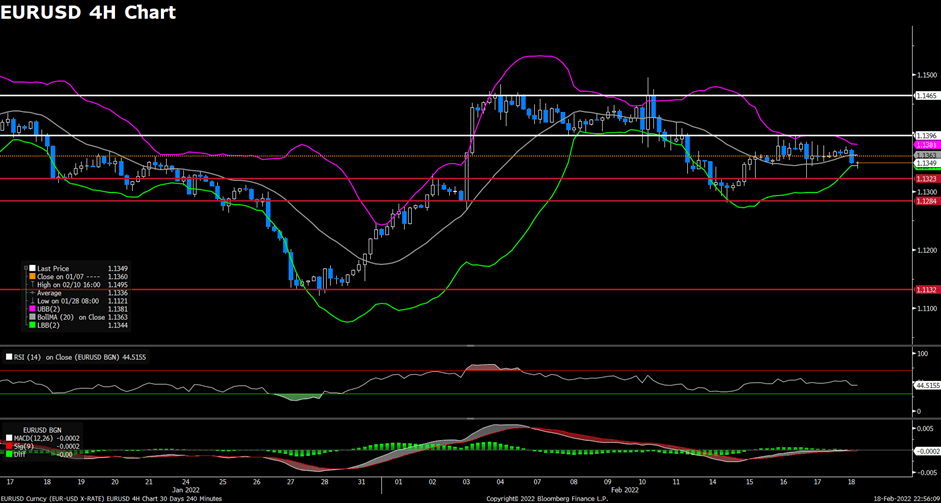
The EUR/USD pair declined on Friday, retreating to 1.1350 area amid the mixed headlines surrounding the tensions between Russia and Ukraine. The pair flirted with 1.1365~1.1375 area during first half of the day, then started to see fresh selling after European session started and dropped to a daily low near 1.1340 mark. The pair is now trading at 1.1349, posting a 0.08% loss on a daily basis. EUR/USD stays in the negative territory amid risk-off market mood, as Russia claimed Ukraine for committing war crimes in Donbas meanwhile US Secretary of State told the UN Security Council that Russia was using it as an excuse to start an attack on Ukraine. But the falling US Treasury bond yields should cap the upside for the greenback. For the Euro, hawkish comments from ECB policymaker Peter Kazimir should limit the losses for EUR/USD pair, as he supported an axing of QE in August and immediate rate hike thereafter.
For technical aspect, RSI indicator 43 figures as of writing, suggesting bear movement ahead. As for the Bollinger Bands, the price is now hovering around the lower band, which indicates that the downside traction should persist. In conclusion, we think market will be slightly bearish as the pair is heading to test the 1.1323 support. The pair could extend its slide toward 1.1300 below that level.
Resistance: 1.1396, 1.1465
Support: 1.1323, 1.1284, 1.1132
GBPUSD (4-Hour Chart)
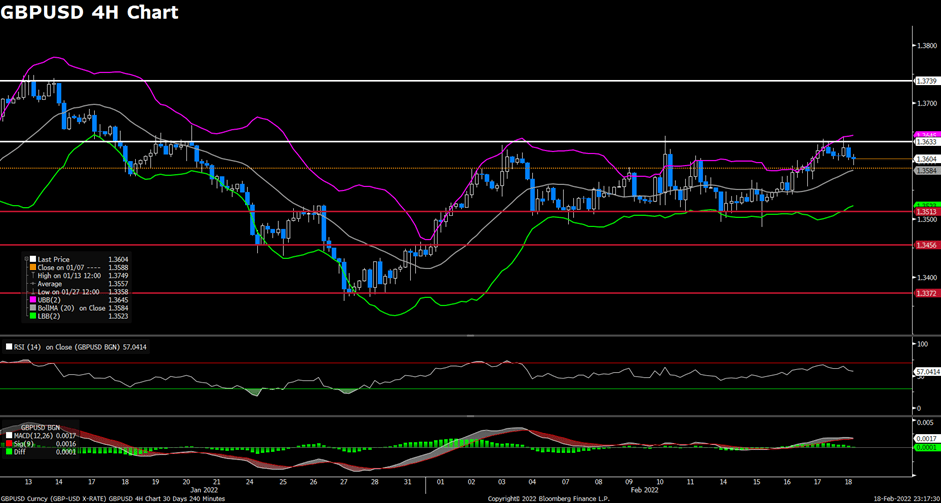
The pair GBP/USD edged lower on Friday, lacking bullish strength after supporting by upbeat UK Retail Sales data in early European session. The pair climbed higher to a one-week high above 1.3640 mark, but failed to preserve its upside momentum and dropped towards 1.3600 level during American session. At the time of writing, the cable stays in negative territory with a 0.08% loss for the day, rebounding slightly from a daily low. The stronger US dollar weighed on the cable as safe-haven flows dominated the financial markets today, meanwhile investors keep digesting the latest developments surrounding the Russia-Ukraine conflict. For British pound, the stronger-than-expected UK January Retail Sales showed sales were up 1.9% in January, which surpassed market expectations of 1.0% and lend some support to the GBP/USD pair.
For technical aspect, RSI indicator 57 figures as of writing, suggesting that upside is more favored as the RSI stays above the mid-line. But for the Bollinger Bands, the price is now dropping towards the moving average, indicating a continuation of bearish trend. In conclusion, we think market will be bearish as long as the 1.3633 resistance line holds. the pair already broke above the previous resistance at 1.3612, the pair will need to rise above that level and starts using it as support for some short-term gains.
Resistance: 1.3633, 1.3739
Support: 1.3513, 1.3456, 1.3372
USDCAD (4-Hour Chart)
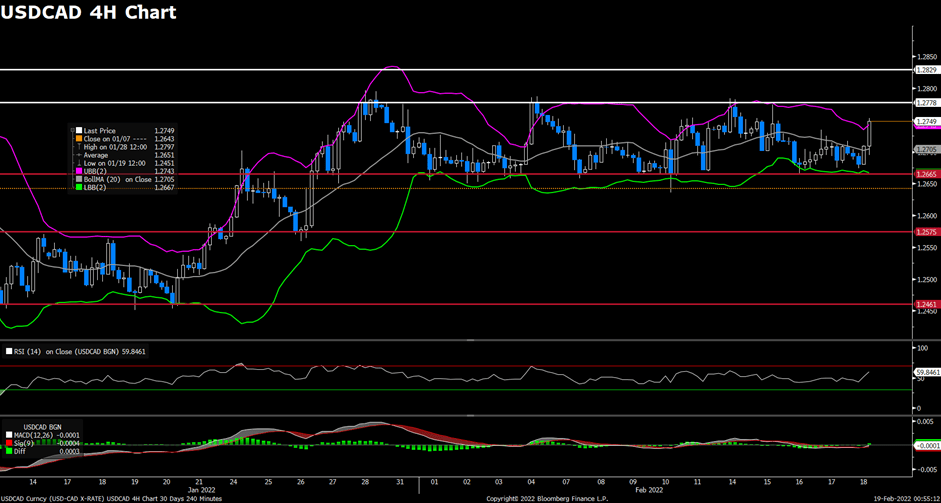
As the safe-haven flows dominated the financial market on Friday, the pair USD/CAD witnessed some some dip-buying and capitalize on renewed US dollar strength. The pair dropped to a daily low near 1.2675 mark during European session, then staged a goodish rebound to recover most of its daily losses. USD/CAD is trading at 1.2749 at the time of writing, rising 0.32% on a daily basis. Signs of escalating fighting in Easter Ukraine and FOMC member Charles Evan’s comment both lifted the pair higher, he said that Fed could do a substantial repositioning of its policy to deal with high inflation. On top of that, falling crude oil prices also weighed on the commodity-linked loonie and acting as a tailwind for USD/CAD, as hope for a diplomatic solution to Ukraine conflict and an agreement for the Iran/US deal both add pressure on the black gold.
For technical aspect, RSI indicator 59 figures as of writing, suggesting that upside is preserving strength as the RSI is approaching 60. As for the Bollinger Bands, the price is now moving out of the upper band, which showed that a strong trend continuation could be expected. In conclusion, we think market will be bullish as the pair bounces from three-week-old support and heads to test the 1.2778 resistance.
As part of our commitment to provide the best reliability and service to our client, the trading hours of certain products will be adjusted as follows due to the maintenance.
Kindly be reminded that the following things might be affected during this maintenance period:
1. The functions of funds operations might be disabled during this period.
2. There might be a gap between the original price and the price after maintenance. Pending orders, Stop Loss, and Take Profit settings within the gap will be filled at the market price after maintenance ends.
3. The quotations of products will be paused. Clients might not be able to open new positions or close the held positions.
No action is required by our client. Your service will be back online after the maintenance is completed.
Thank you for your patience and understanding with regard to this important initiative.
If you’d like more information, please don’t hesitate to contact [email protected].