Market Focus
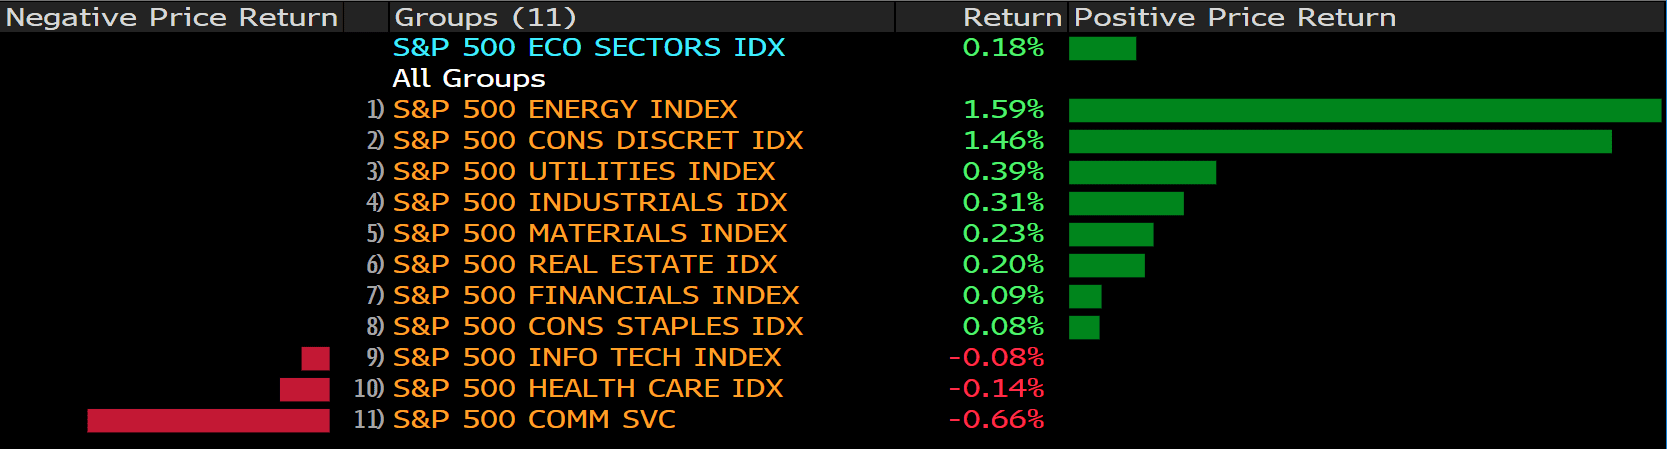
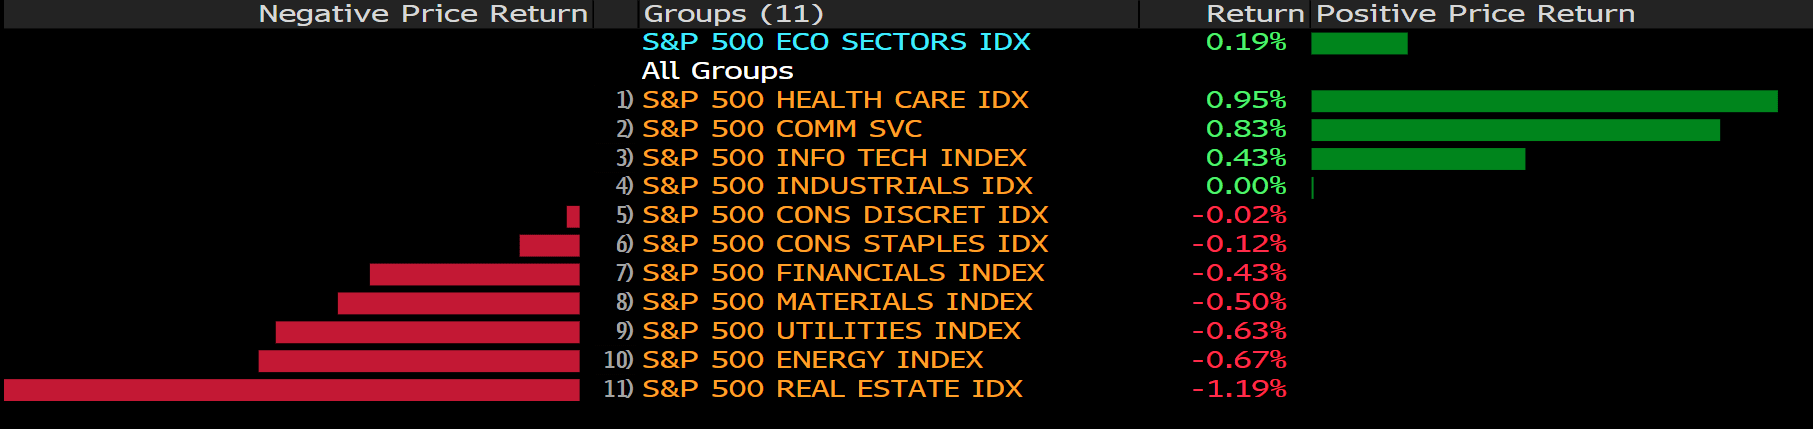
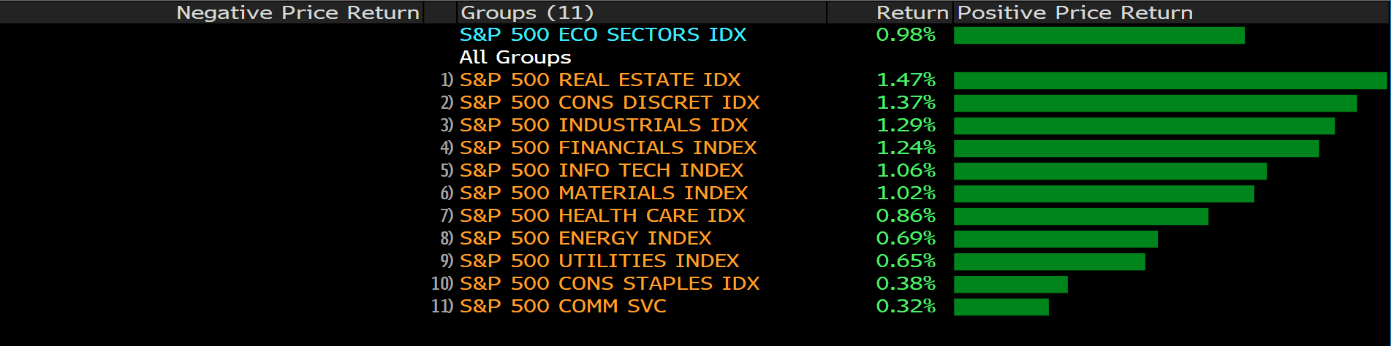
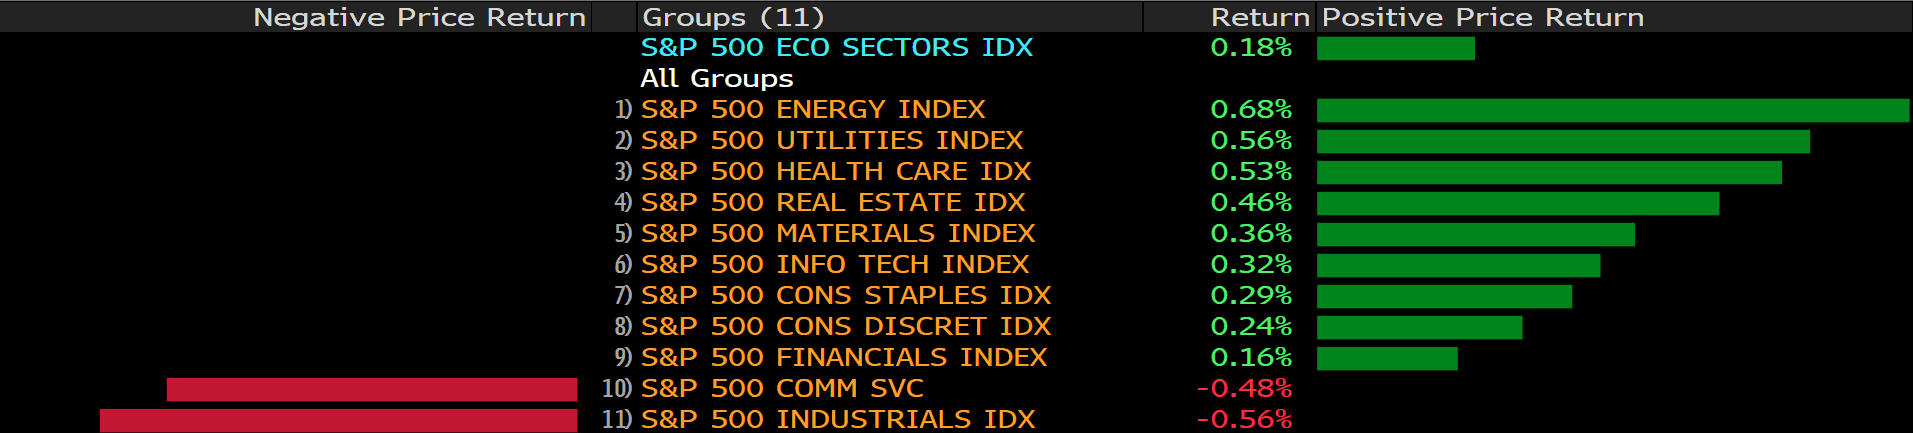
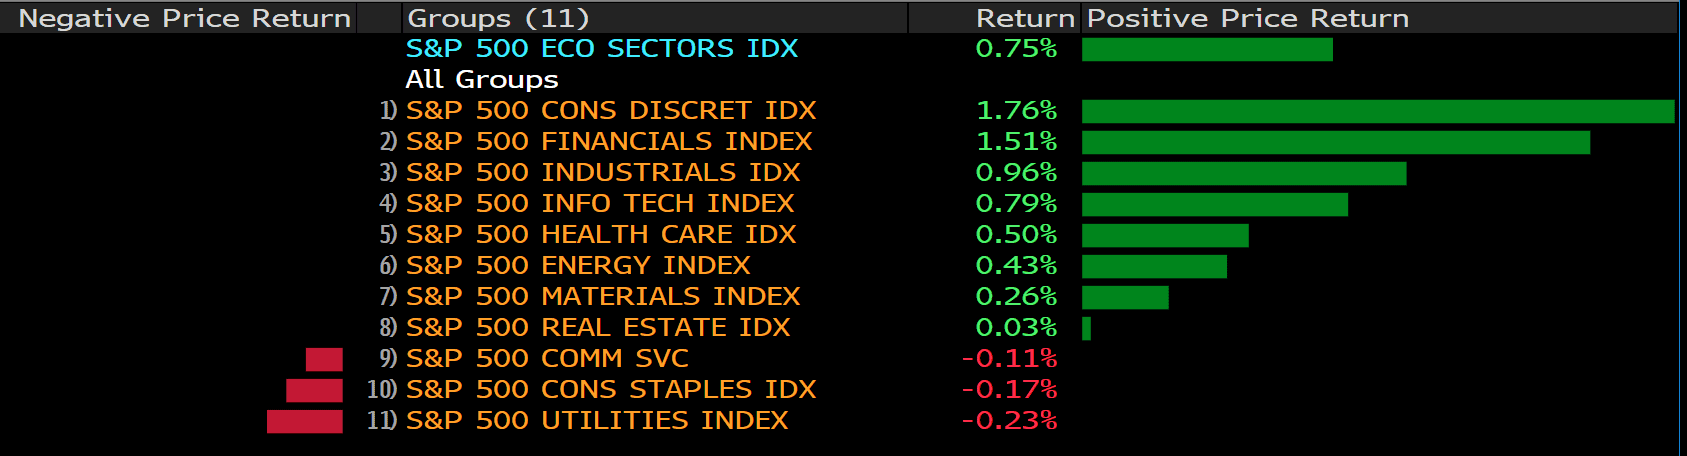
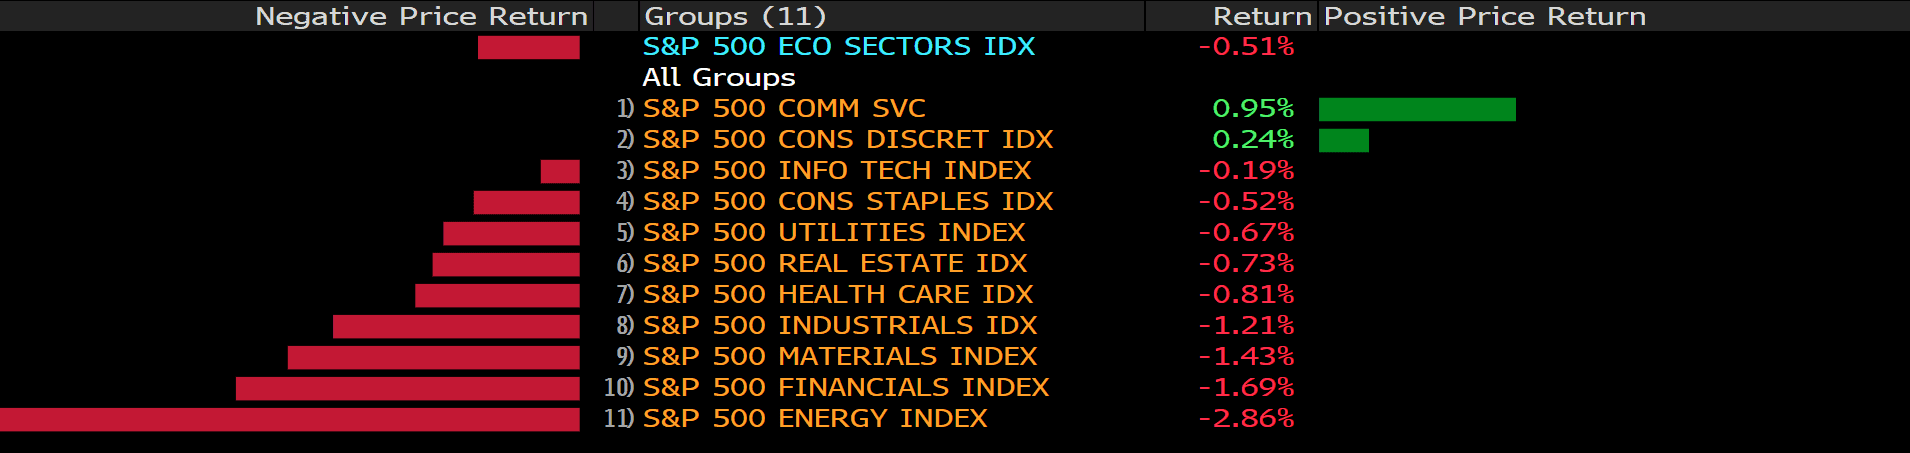
The broad U.S. equity markets retreated on Wednesday’s trading. Indices fell from their previous record closes. The S&P 500 lost 0.51% to close at 4551.68, the Dow lost 0.74% to close at 35490.69, and the Nasdaq traded sideways to close at 15235.84.
Wednesday’s market retreat was led by the energy sector as oil prices saw its largest single day decline in more than two months. The WTI December future dropped 0.56% as the U.S. reported a larger than expected rise in oil inventory; on the other hand, the Brent Crude December future dropped 0.45%, as well.
The U.S. 10 year treasury yield dropped to 1.54%, while the 30 year treasury yield settled at 1.948%.
Apple Inc, Amazon Inc, and Samsung are due to report their quarterly earnings on the 28th.
The bank of Canada announced major changed to the quantitative easing measures. The BoC announced the end its bond buying program and an accelerated time table for rate hikes as the Bank expresses its fear of continued inflation amid supply chain disruptions.
Main Pairs Movement:
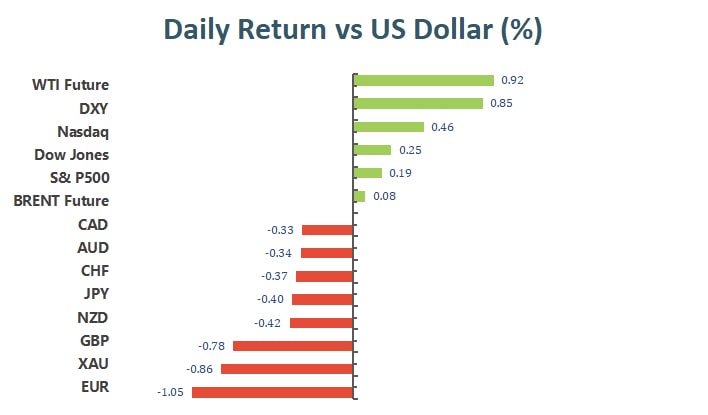
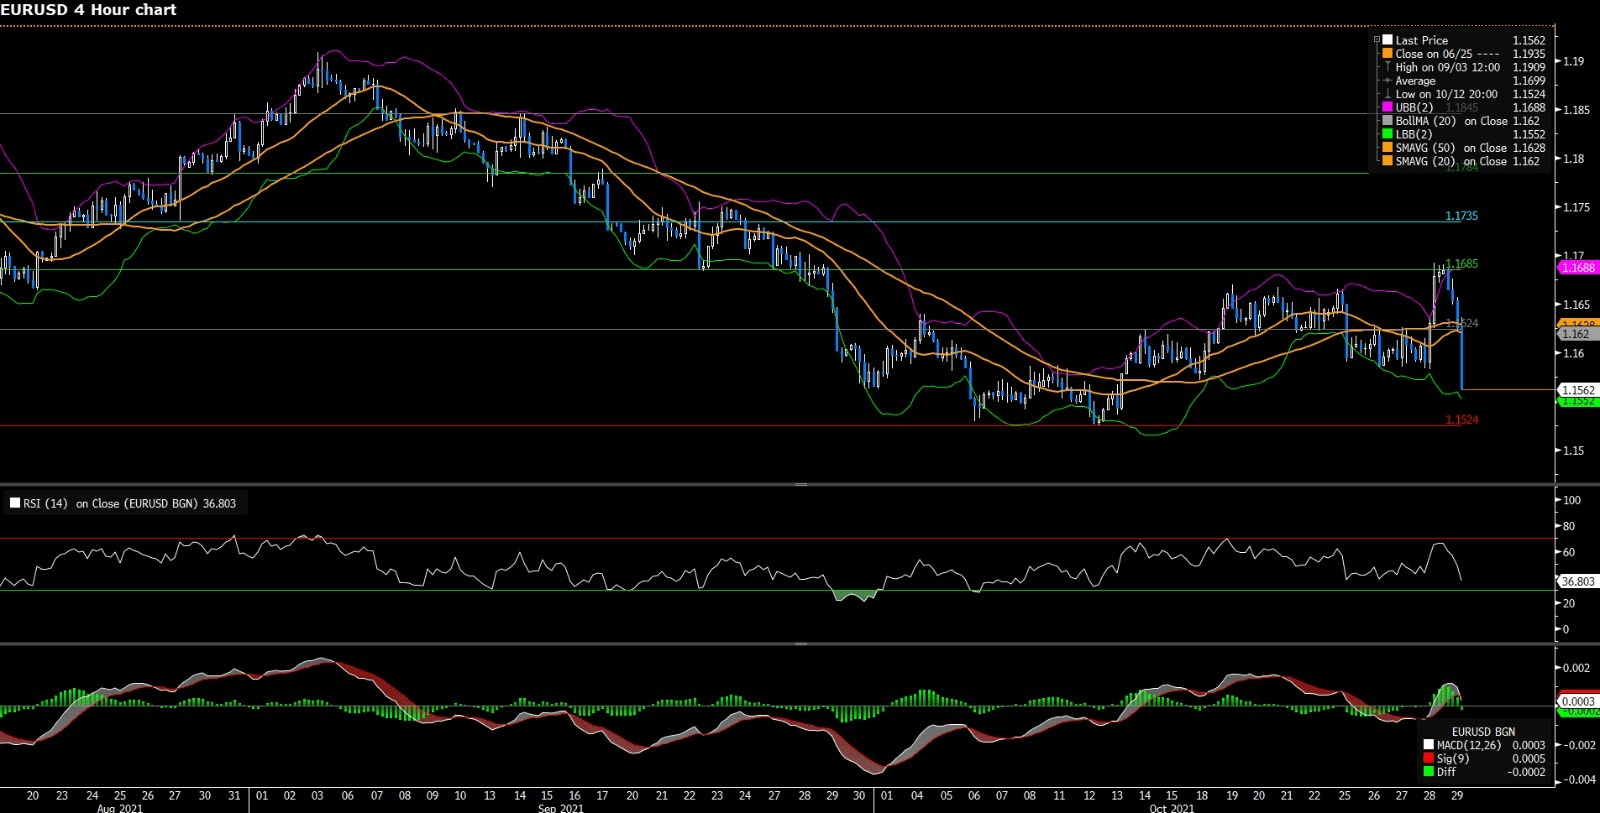
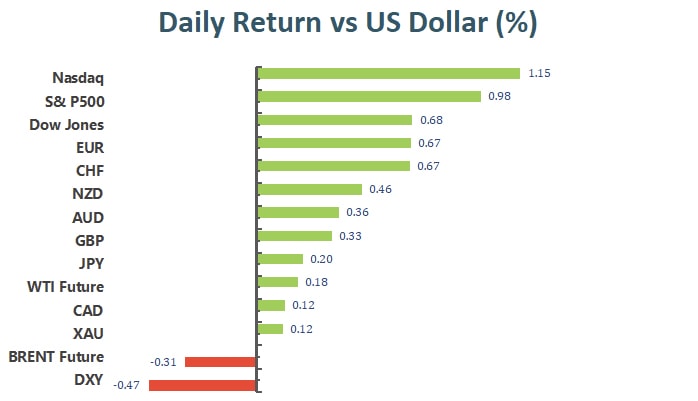
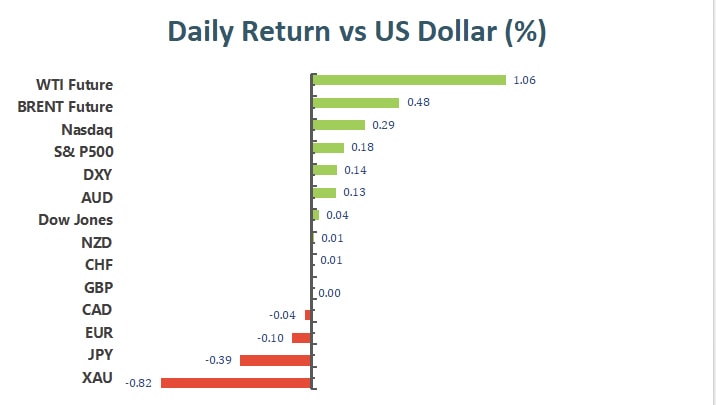
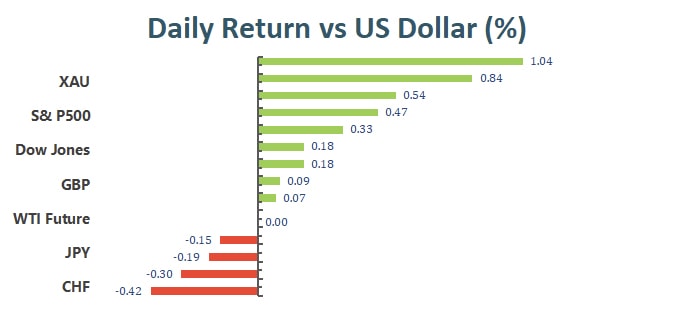
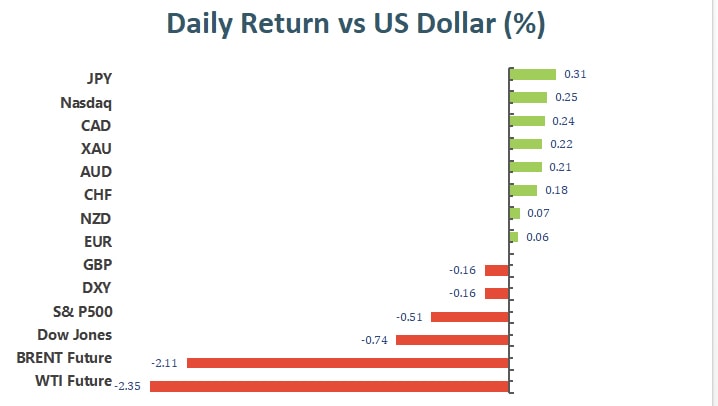
The Greenback depreciated slightly against other currencies as the Dollar Index closed 0.11% lower. Speculators will now turn their attention to the key economic data, the ECB monetary policy decision and the U.S. initial jobless claim report, which are due on the 28th.
The Yen continued to decline against the Dollar, but the BoJ is due to provide monetary policy updates, on the 28th, which will provide price actions for the pair. The Aussie dollar continued its second straight day of gains against the Euro as global energy continues to rise and upbeat inflation figures from the Australian central bank. The BoC’s firm hawkish stance, as it announced the end to quantitative easing, fueled the Loonie to gain 0.24% against the Dollar.
Technical Analysis:
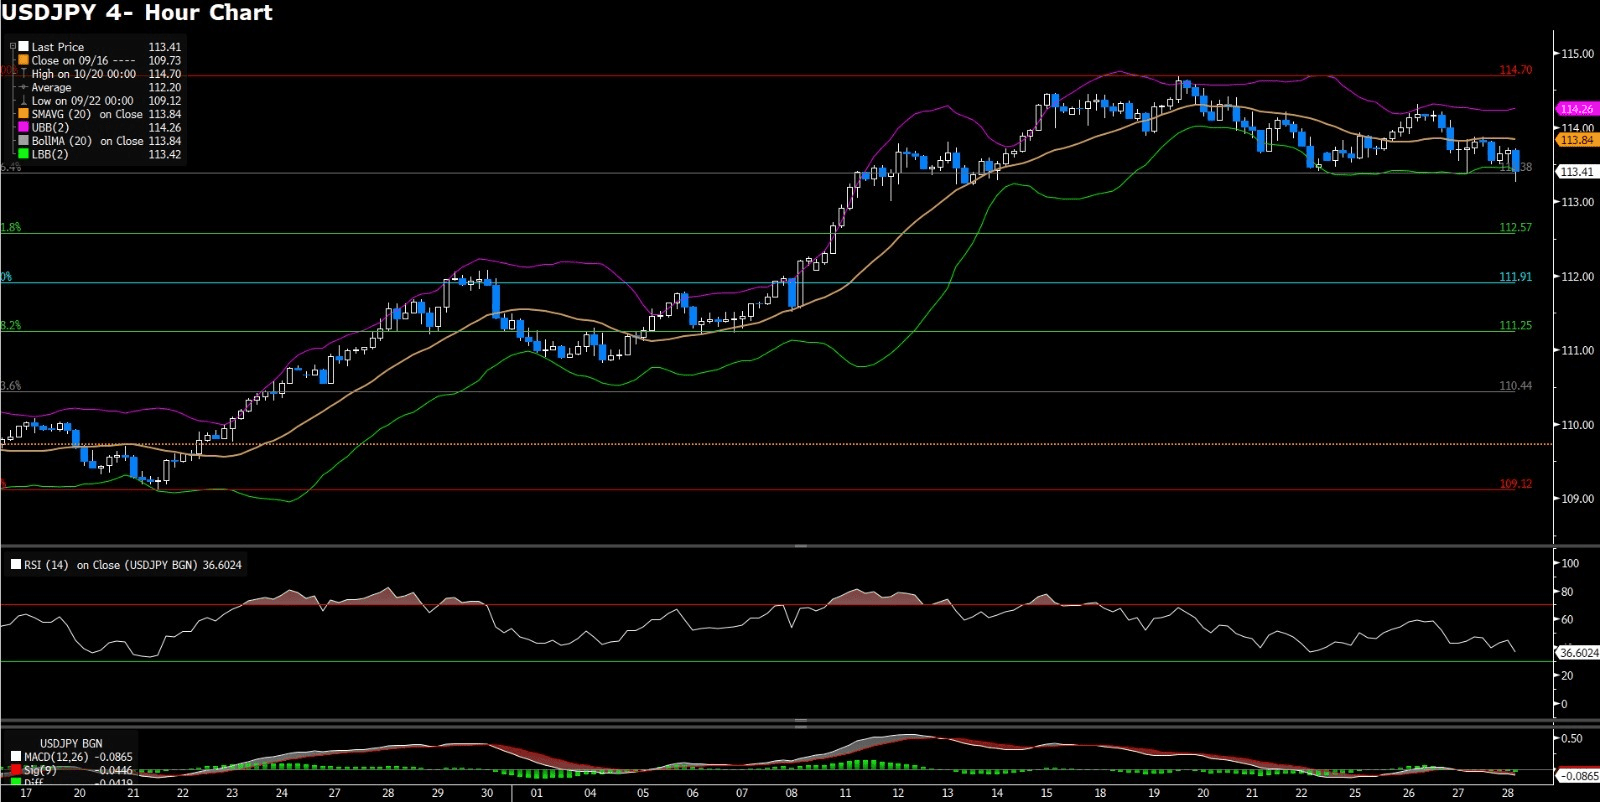
USDJPY (Daily Chart)
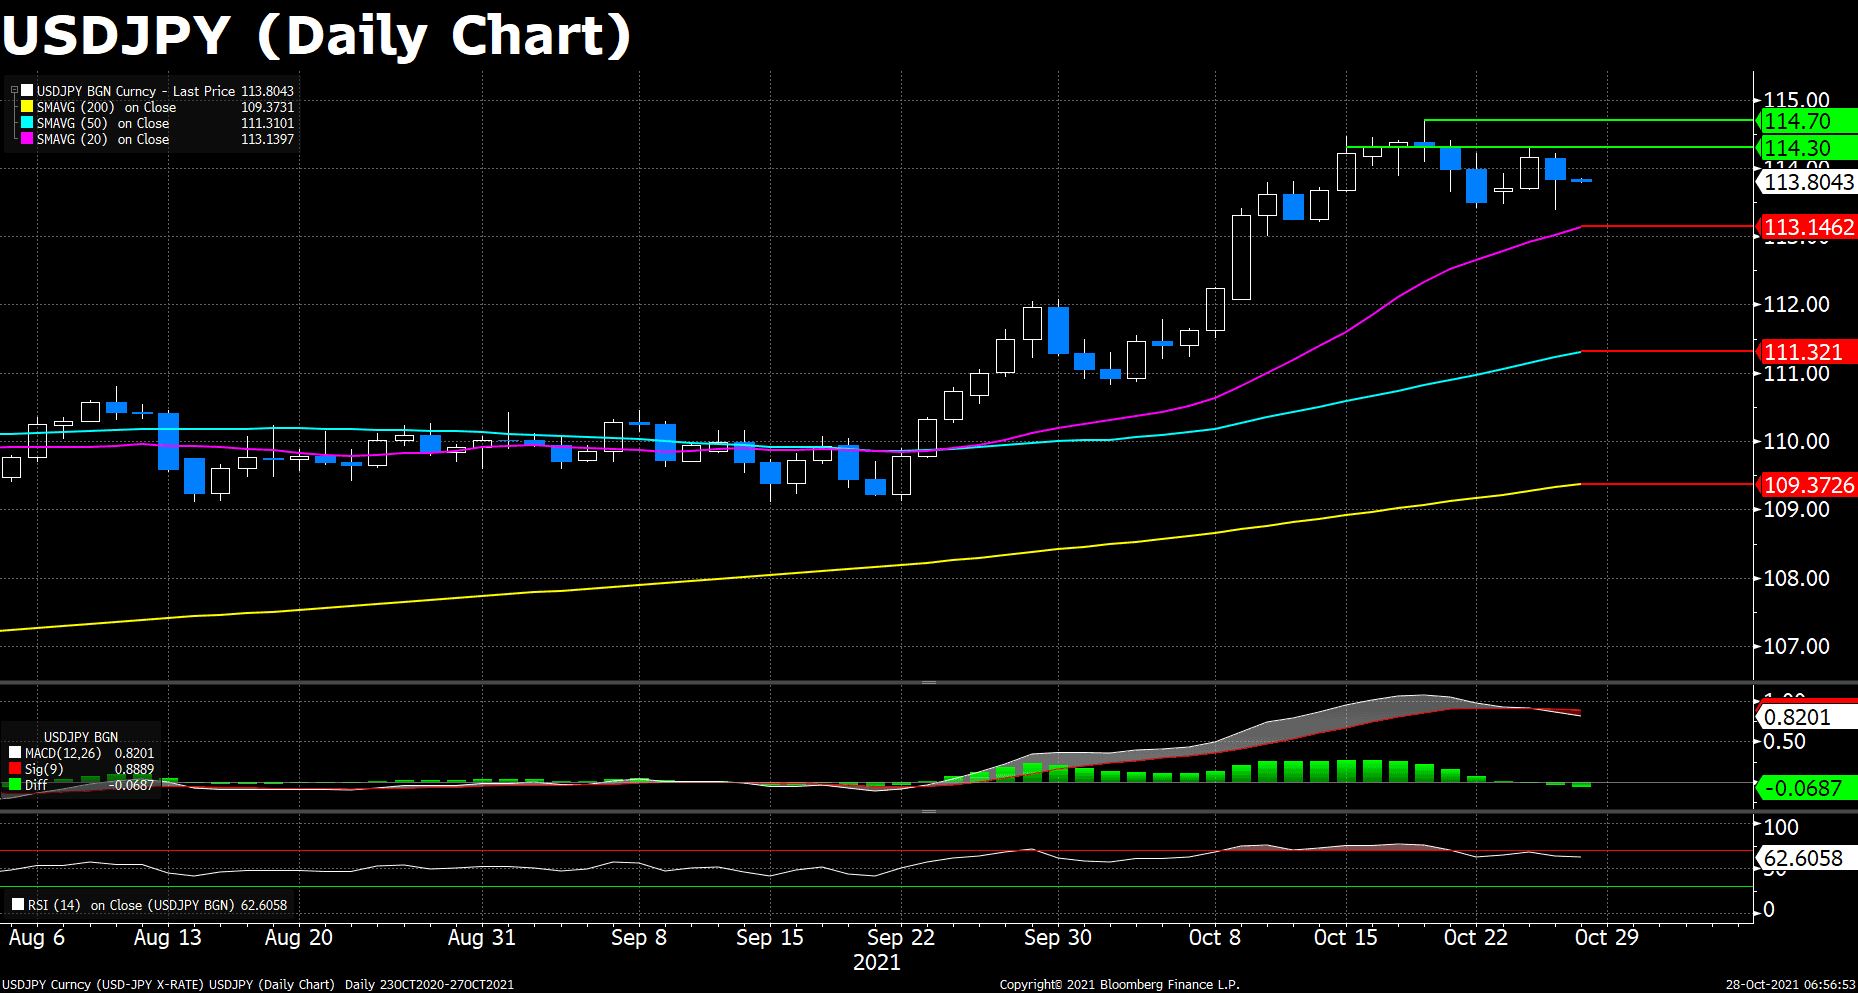
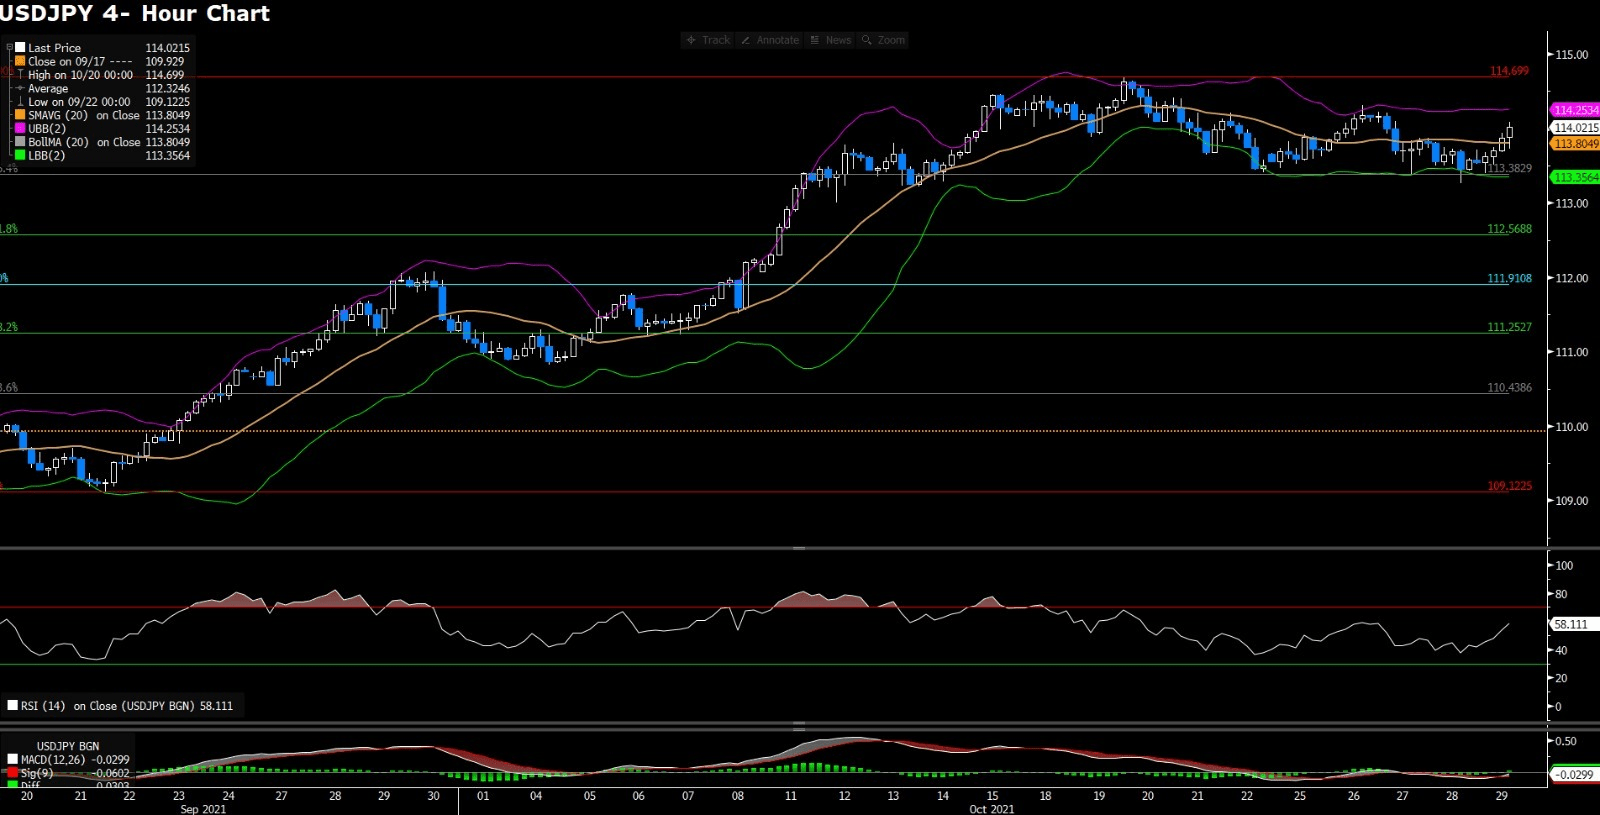
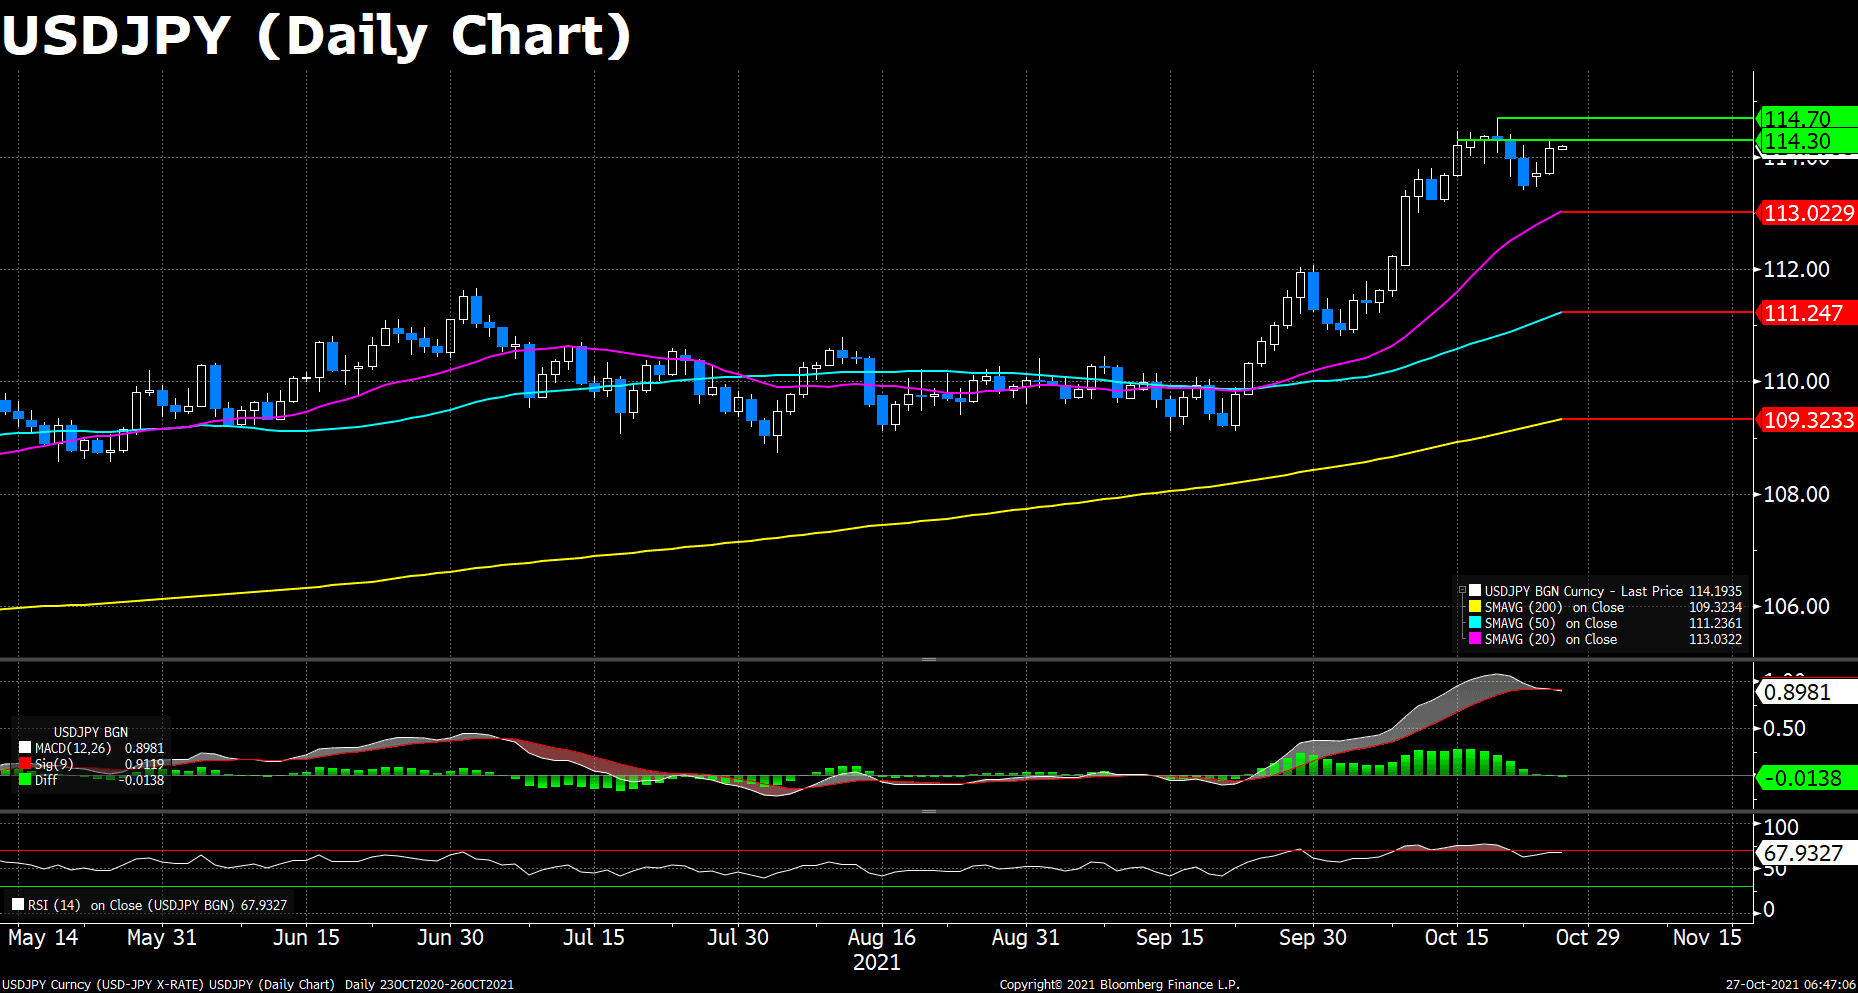
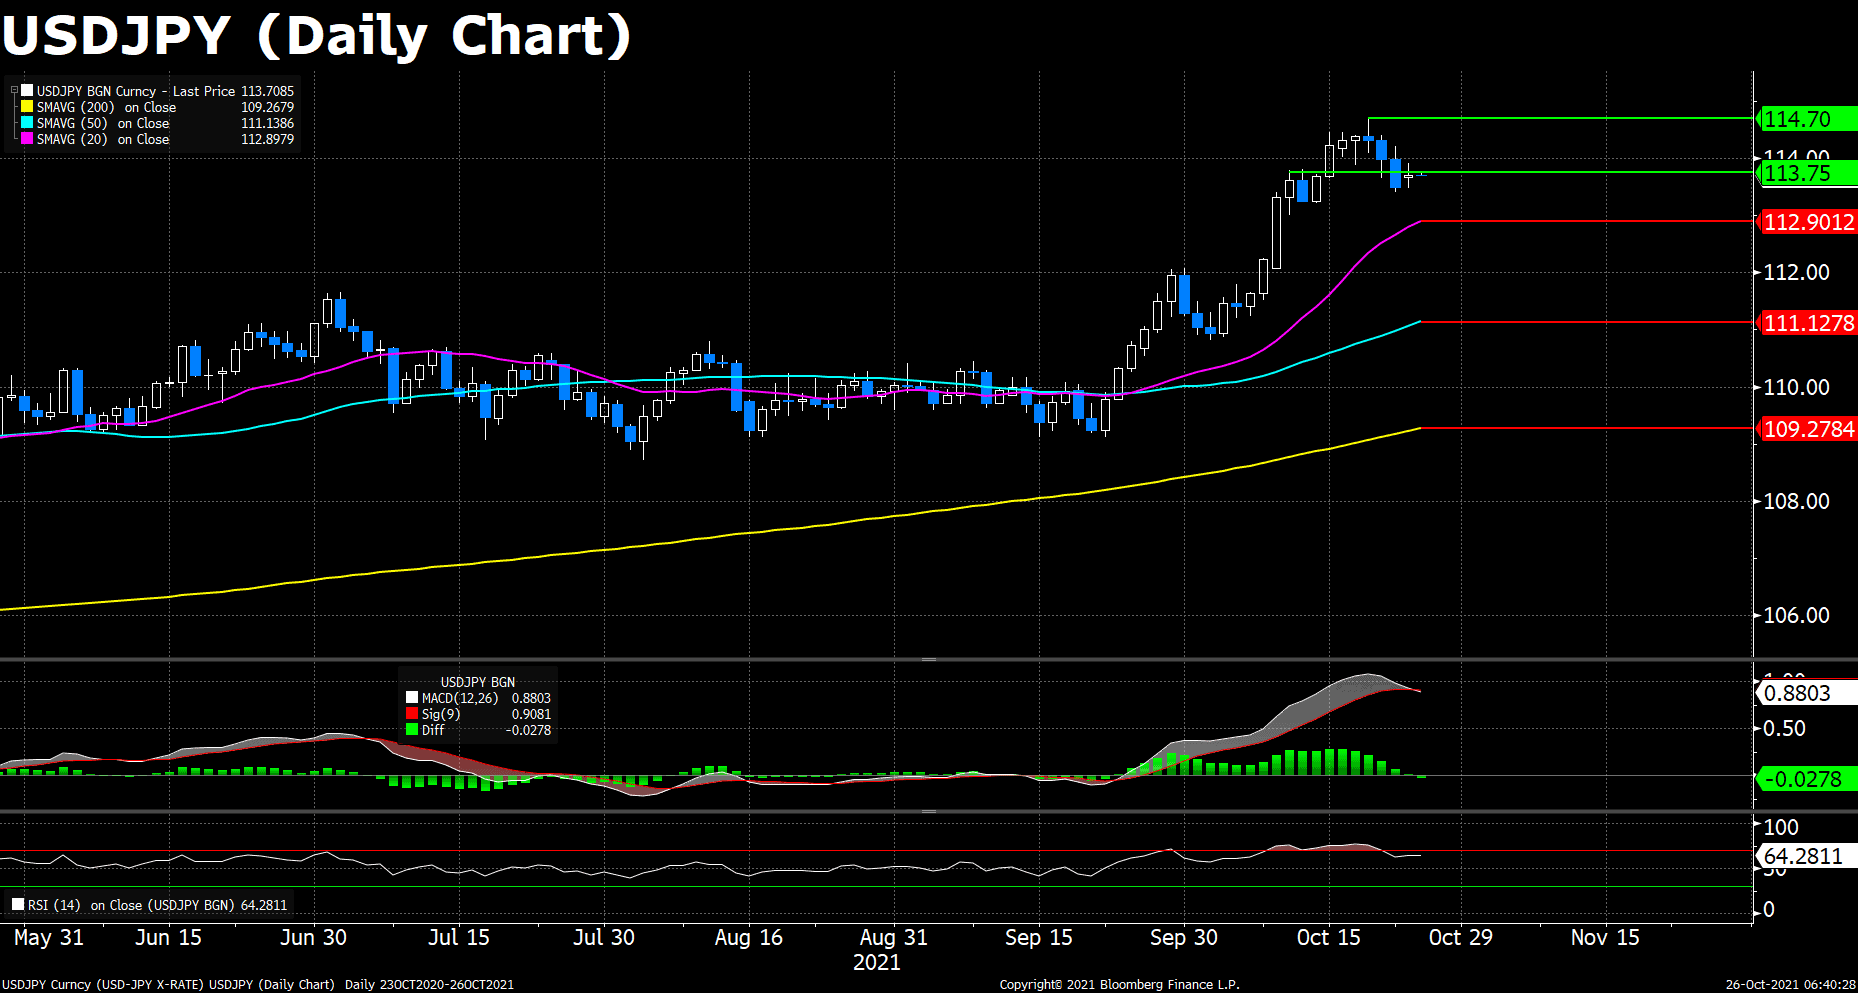
The USD/JPY pair underwent a sudden selling pressure on Wednesday amid the dollar’s weakness, as the US treasury yields plummeted during the day. The pair dived below the 114.00 threshold since the start of the European session, and bottomed at 113.39, the lowest level of the week. However, after the decision of the Bank of Canada to end its QE program released, the US bond yields surged and triggered a spike in USD/JPY to 113.83.
After the prolonged risk-on mood, the concerns about the central banks’ contraction moves have finally been bubbling up across the market. The rally of the equities slows down, and even in some regions their equity prices start to fall, benefiting the save-haven Japanese Yen. However, as long as the Bank of Japan remain silent about its monetary policy on Thursday’s meetings, the depreciation of the yen should proceed, as the Fed’s taper is on the schedule, which will keep lifting the value of the USD in the short future.
On the technical front, the daily MACD histogram turned slightly negative on Wednesday, and the RSI indicator still lingers below the overbought territory, suggesting the upward tractions are still under pressure. The 114.00 threshold again comes to our eyes, and the key resistance level for further uptrend at 114.30 is the next barricade to pass. If breached, then a fresh yearly high could be anticipated.
Resistance: 114.00, 114.30, 114.70
Support: 113.15, 111.32, 109.37
EURAUD (Daily Chart)
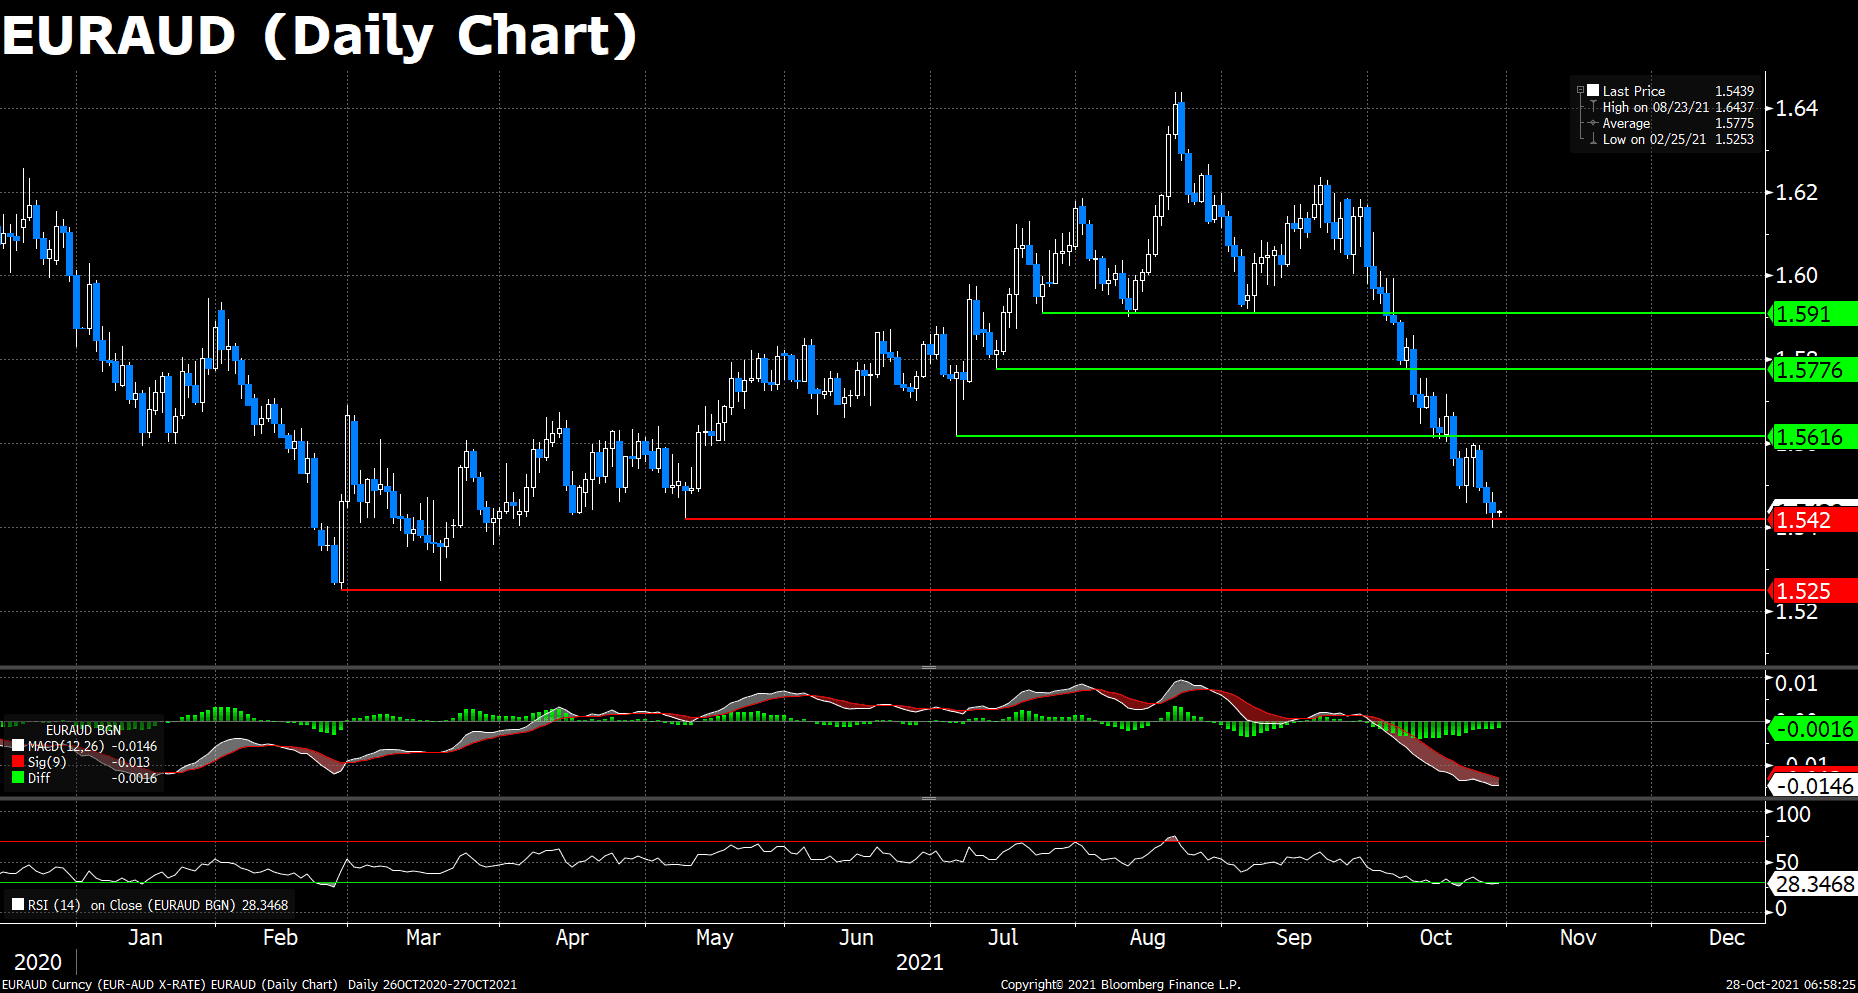
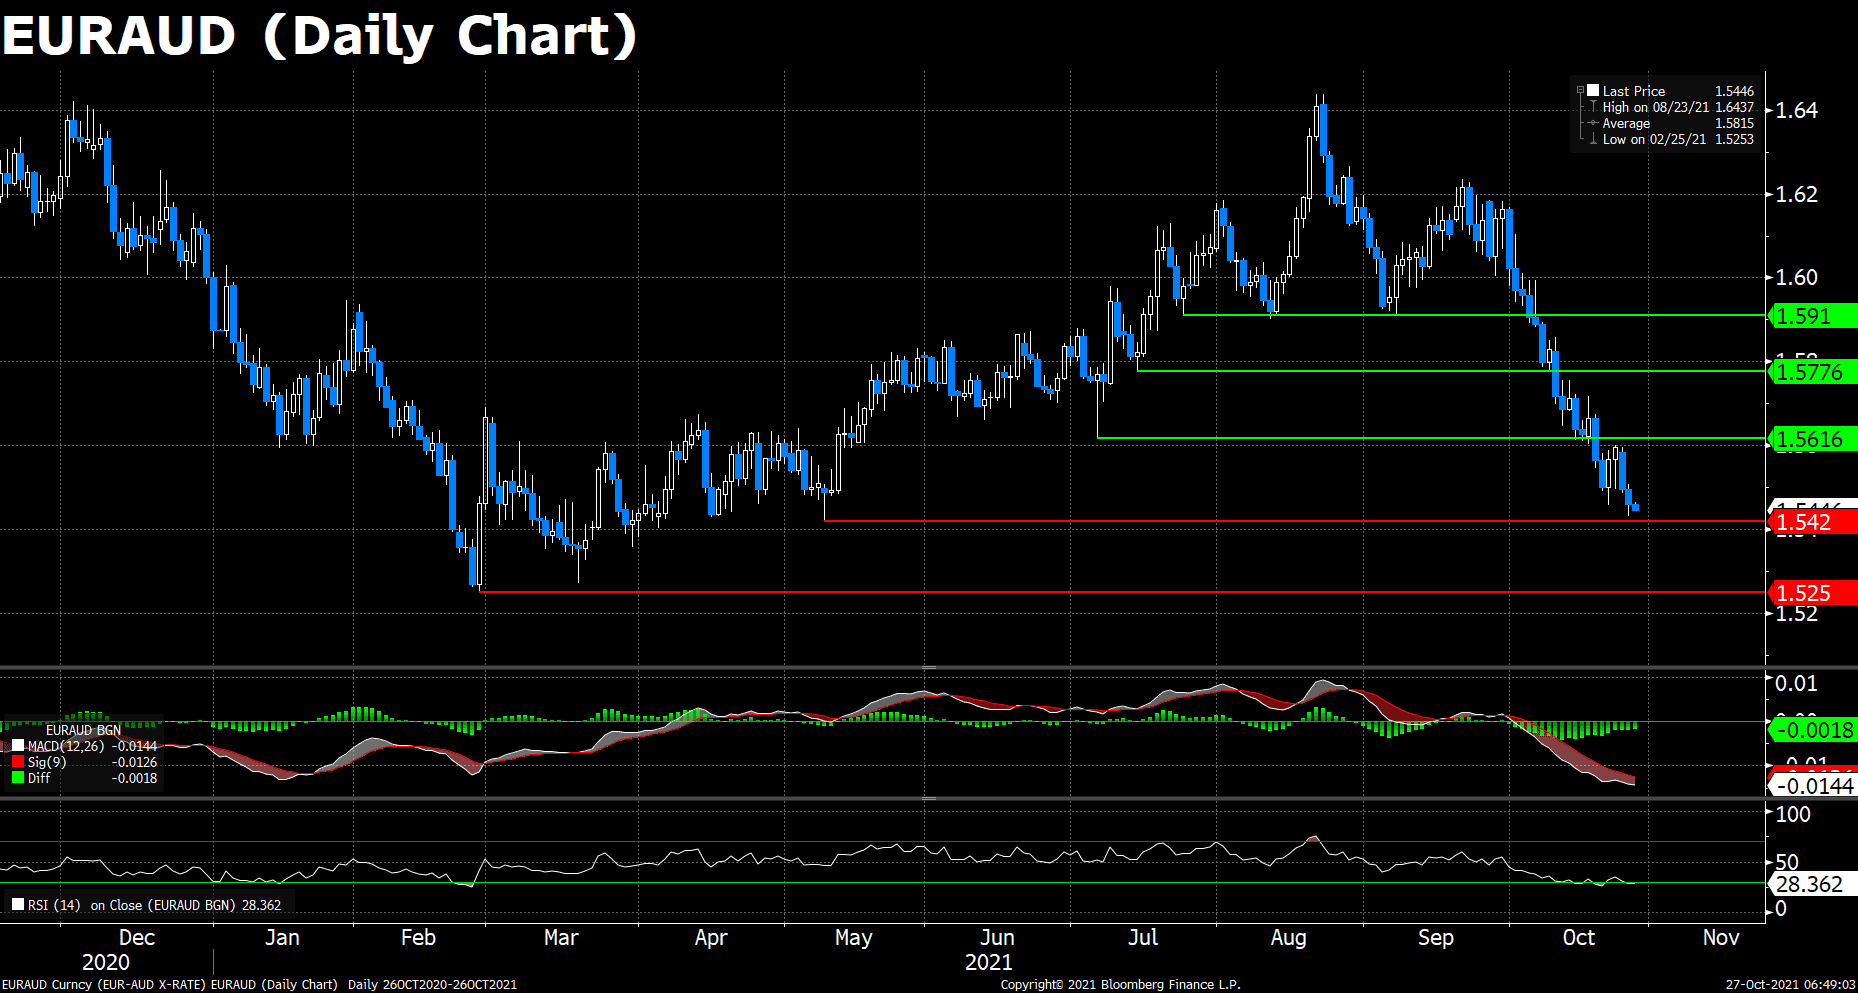
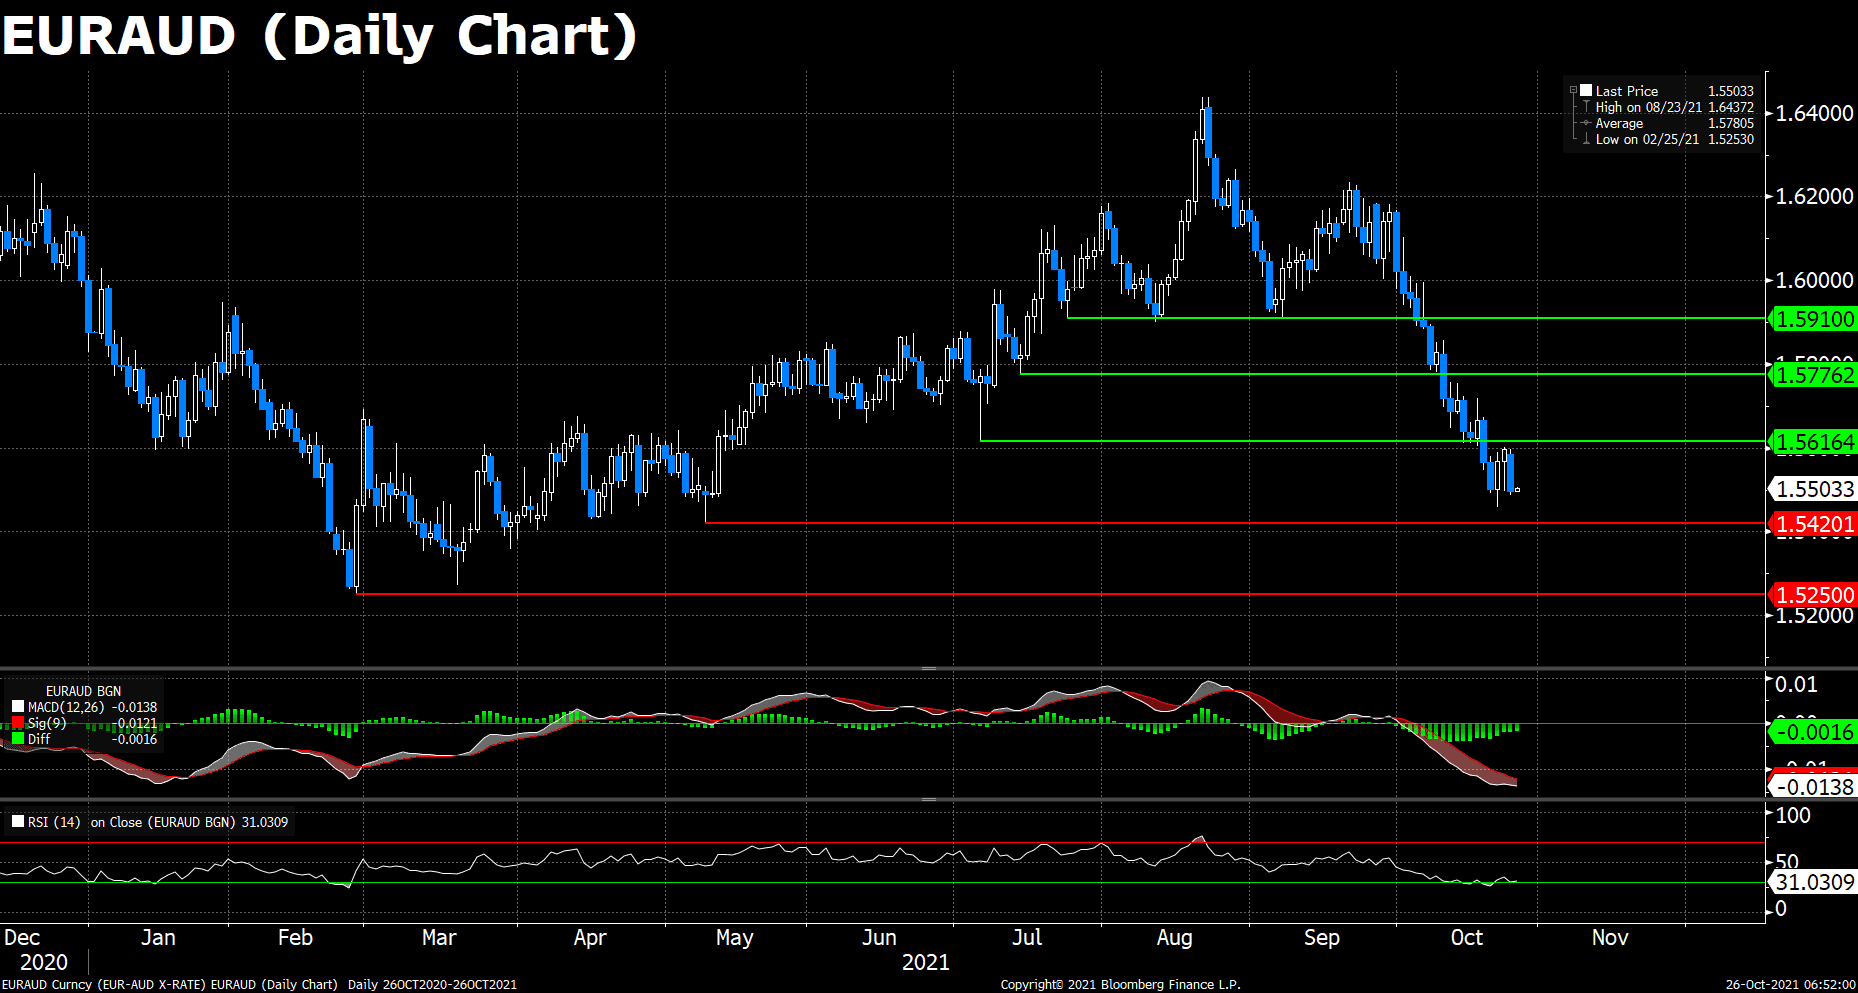
The EUR/AUD pair declined for a third consecutive day on Wednesday amid the flat EUR and the strong AUD, and now hovers around the key support level 1.5420, where the lows last seen in May sit.
The market mood got cautious on Wednesday. Mineral prices closed mixed, trimming the strength of the commodity-linked AUD. The investors are looking for direction with all eyes on the ECB’s monetary policy decision, though it is expected to maintain its bond-purchasing plan unchanged and the interest rate near zero despite the persistently high inflation, to avoid tensions in some peripheral markets.
On the technical aspect, the MACD histogram remains in the bearish territory, suggesting the selling stream of the cross may proceed. However, the RSI indicator dived deeper into the oversold region, the growing pressure for sellers may trigger a short-term correction in the very near term, especially if ECB pops up some surprise during the upcoming meetings. On the downside, the May’s low 1.5420 would be a strong support against the bears, followed by 1.5250, the yearly low.
Resistance: 1.5616, 1.5776, 1.5910
Support: 1.5420, 1.5250
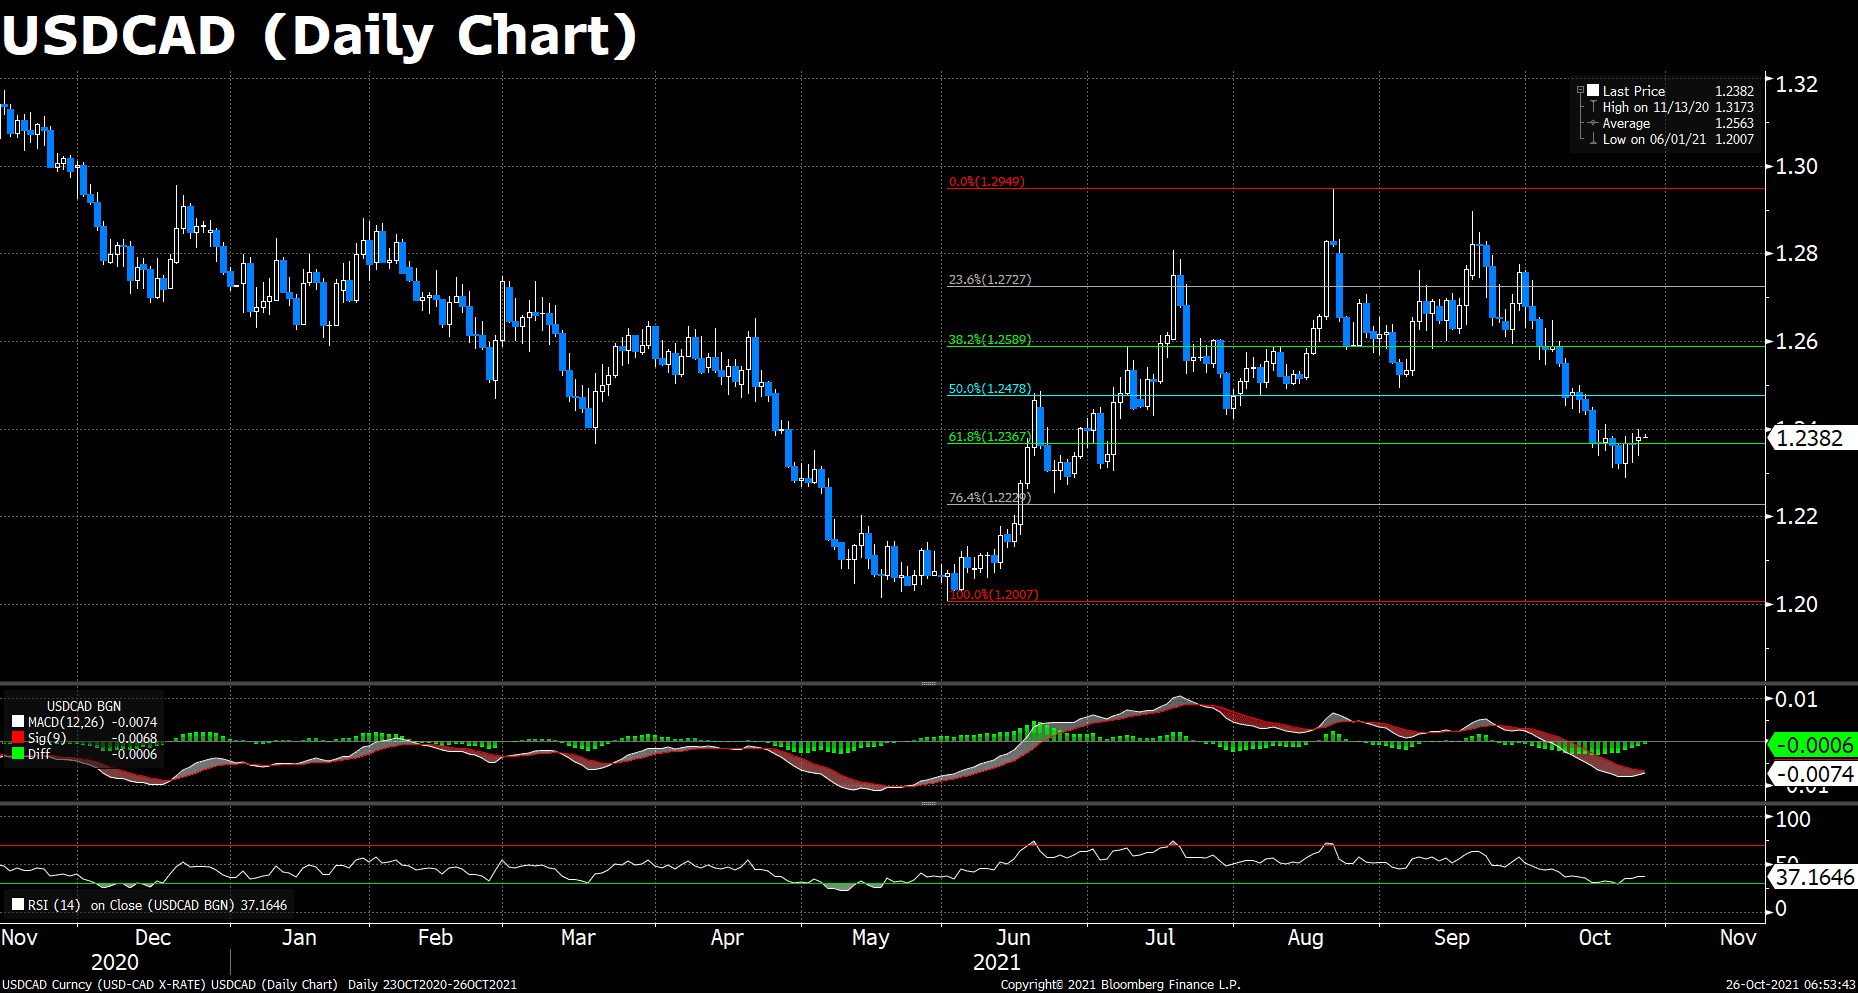
USDCAD (Daily Chart)
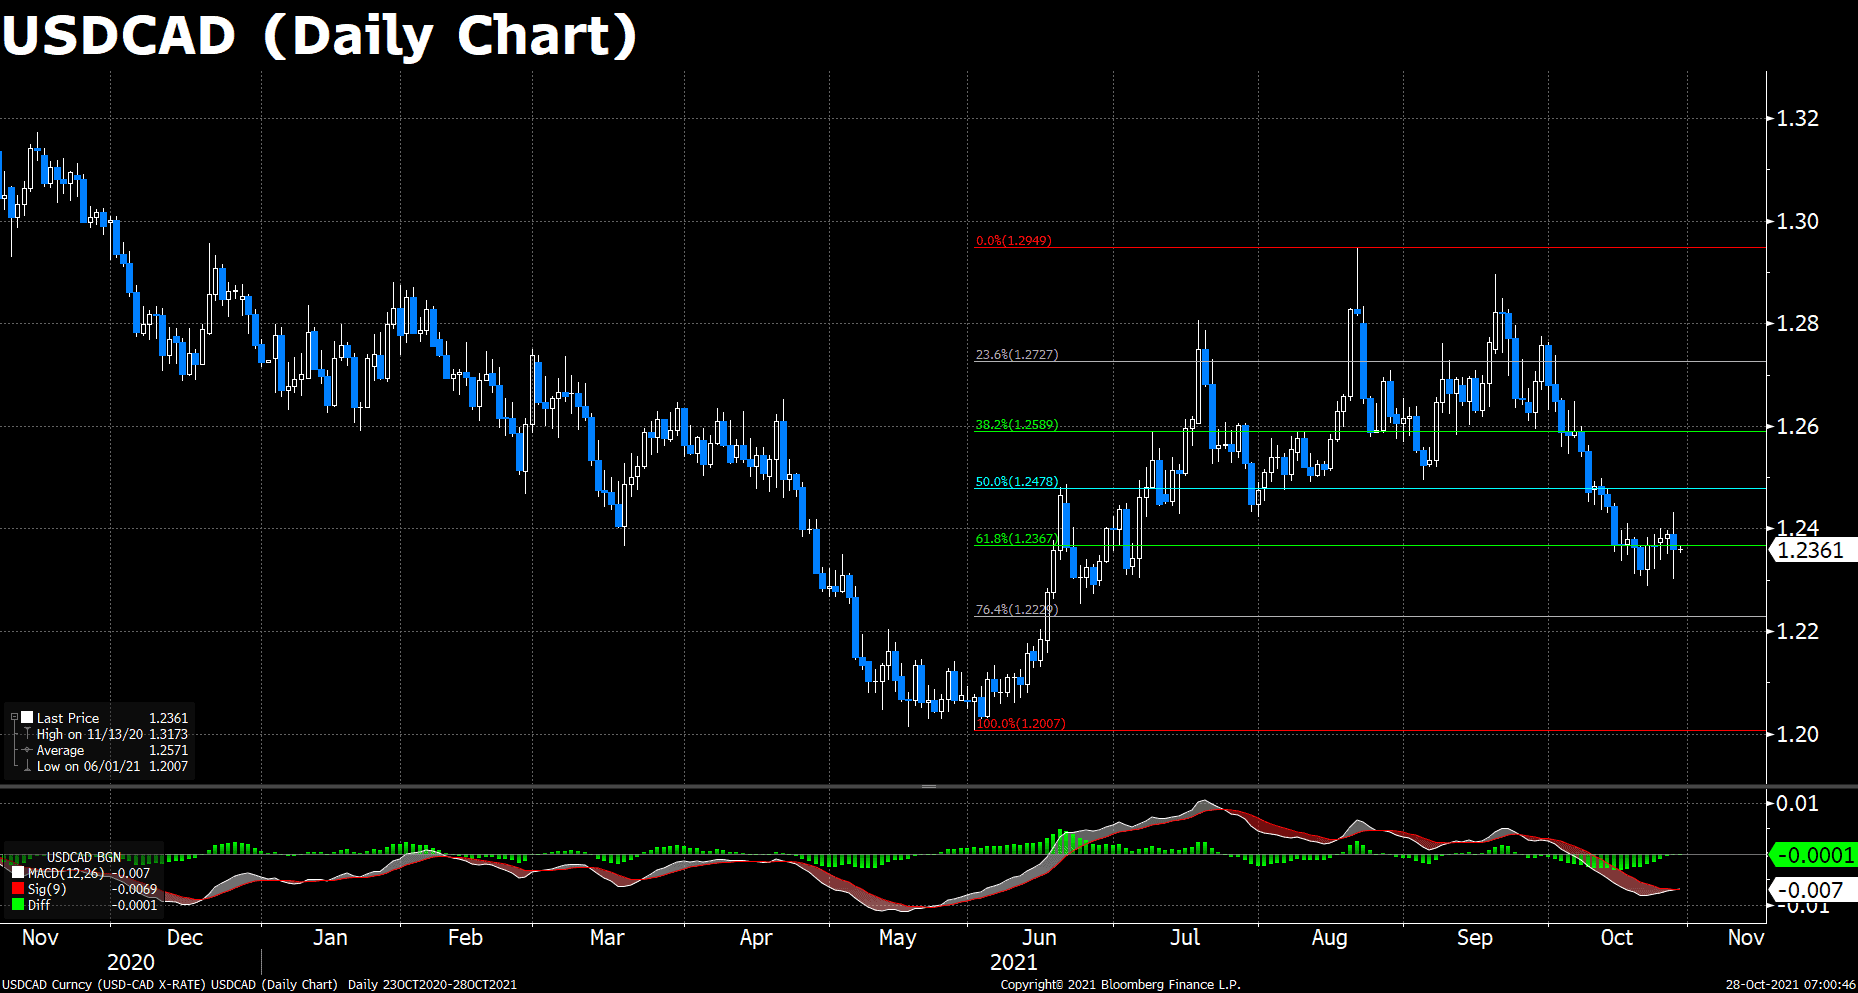
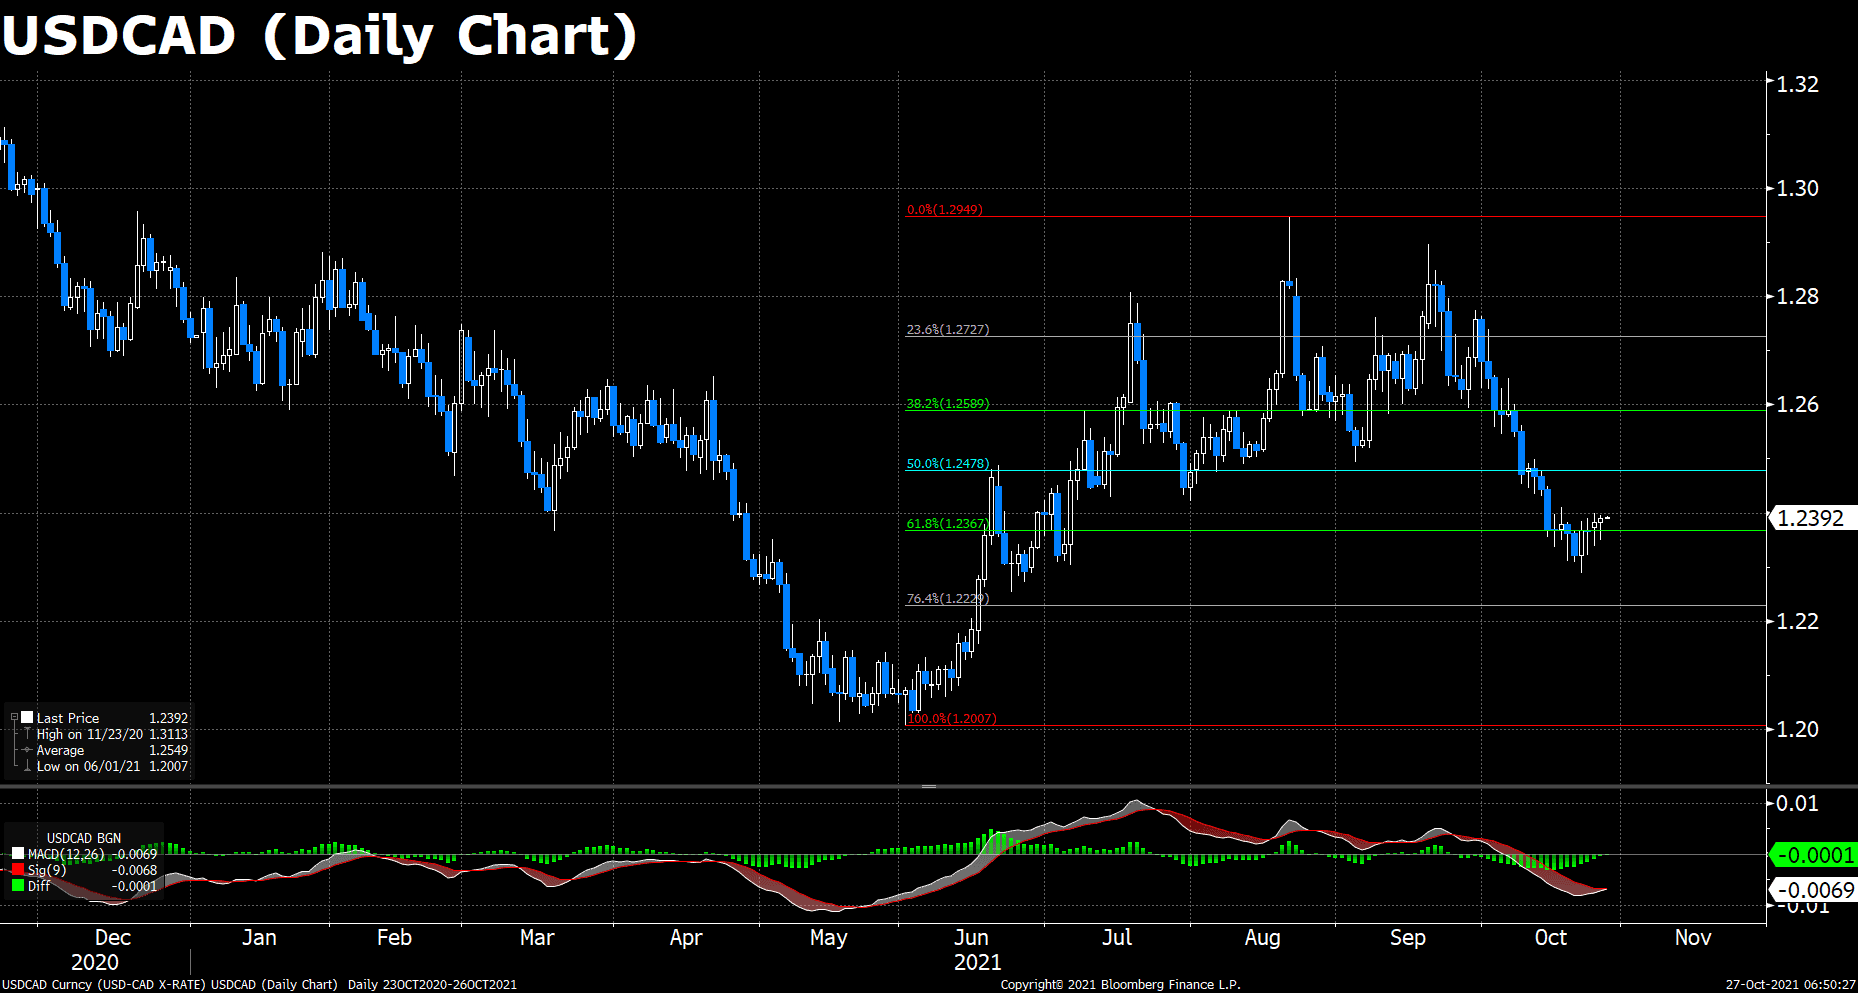
The USD/CAD slumps for the first time in the week, down 0.25%, trading at 1.2360 during the late New York session at the time of writing. Earlier 30-minutes into the Wall Street opening, the Bank of Canada released its monetary policy decisions announcing the ending of its QE program, which was well expected to be a reduction instead of a halt.
Before the announcement, the pair climbed above the 114.00 threshold and settled around the 1.2430 level, but soon plummeted over 130 pips after the release of the report, marking a daily low at 1.2300. However, the pair was soon back to its upward trajectory, posting a 60 pip recovery at the moment.
On the technical front, the daily MACD histogram is almost going to form a golden cross, while the RSI indicator is still under the bearish levels, though improving. The price actions are still hovering around the 61.8% Fibonacci. Looking forward, the US GDP reports is going to release within hours. The pair may regains 114.00 with a boost by the upbeat news of the US.
Resistance: 1.2478, 1.2727, 1.2949
Support: 1.2229, 1.2007
Economic Data
|
Currency
|
Data
|
Time (GMT + 8)
|
Forecast
|
|
JPY
|
BoJ Monetary Policy Statement
|
11:00
|
|
|
JPY
|
BoJ Outlook Report (YoY)
|
11:00
|
|
|
JPY
|
BoJ Press Conference
|
14:30
|
|
|
EUR
|
German Unemployment Change (Oct)
|
15:55
|
-20K
|
|
EUR
|
Deposit Facility Rate (Oct)
|
19:45
|
-0.5%
|
|
EUR
|
ECB Marginal Lending Facility
|
19:45
|
|
|
EUR
|
ECB Monetary Policy Statement
|
19:45
|
|
|
EUR
|
ECB Interest Rate Decision (Oct)
|
19:45
|
|
|
|
|
|
|
USD
|
GDP (QoQ) (Q3)
|
20:30
|
2.7%
|
|
|
|
|
|
USD
|
Initial Jobless Claims
|
20:30
|
290K
|
|
|
|
|
|
EUR
|
ECB Press Conference
|
20:30
|
|
|
|
|
|
|
USD
|
Pending Home Sales (MoM) (Sep)
|
22:00
|
0.5%
|
|
|
|
|