Market Focus
The US indices edged higher on Wednesday, and technology stocks rebounded due to the slowdown in the rise in bond yields. The recent increase in yields is due to the decision of President Joe Biden, who re-nominated Jerome Powell as chairman of the Federal Reserve on Monday. After the 10-year US Treasury bond yield closed at 1.55% on last Friday, it traded above 1.68% this week. However, the ratio fell to about 1.64% on Wednesday.
At the end of the market, the S&P 500 Index rose 0.23% to close at 4,701.46, the Nasdaq Composite Index rose 0.44% to 15,845.23, and the Dow Jones Industrial Average fell only 9.42 points to close at 35,804.38. The Nasdaq Composite Index, which is dominated by technology stocks, outperformed the broader market, mainly due to the 1.1% increase in the stock price of Facebook’s parent company Meta, the increase in Apple’s stock price by 0.33% and the TSLA increase by 0.63%.
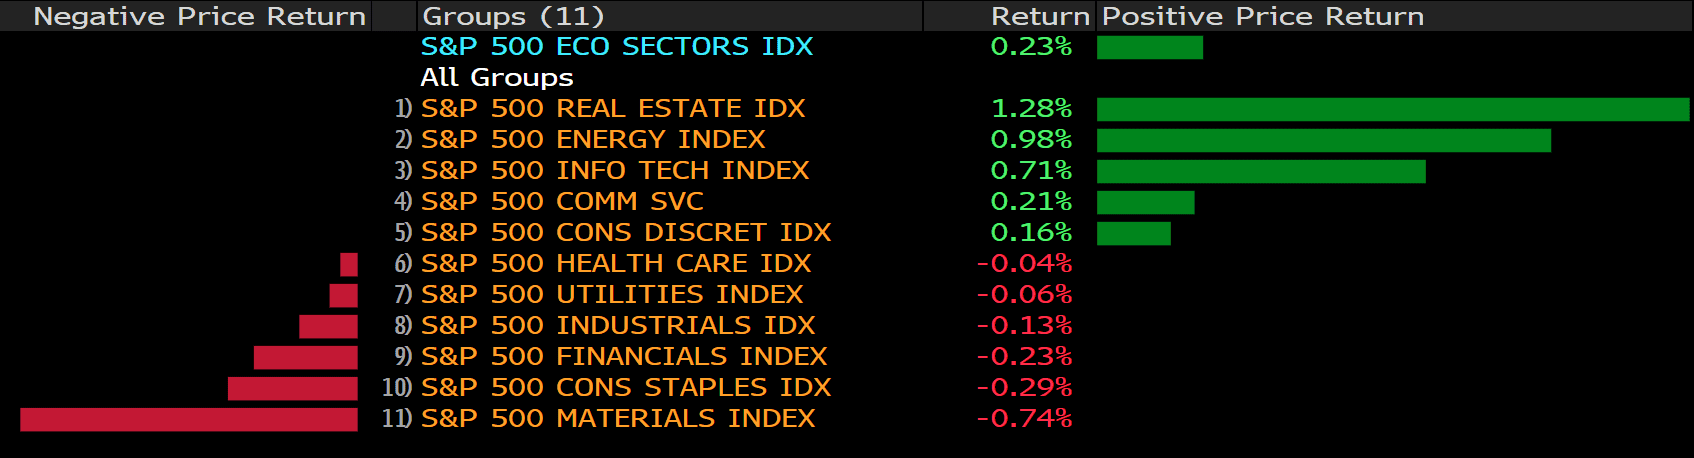
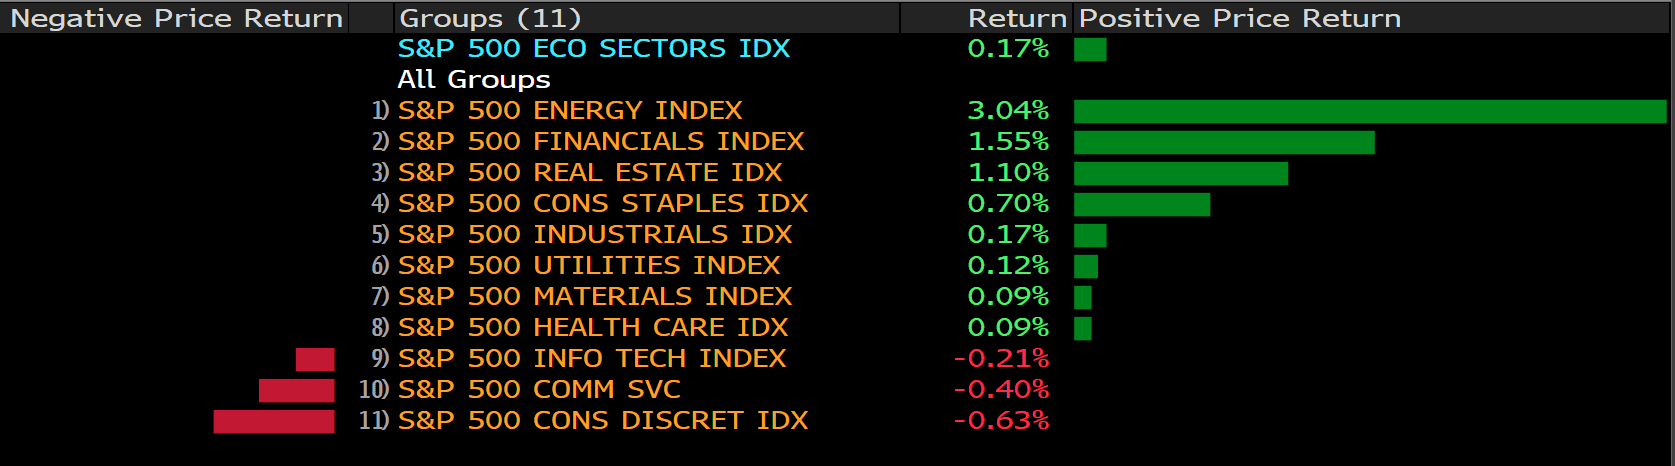
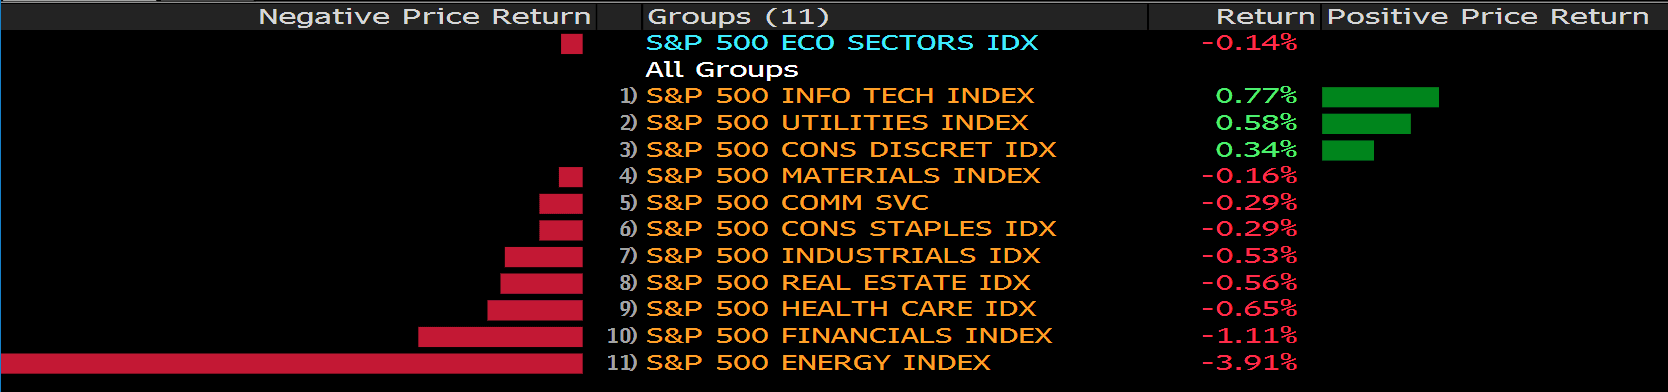
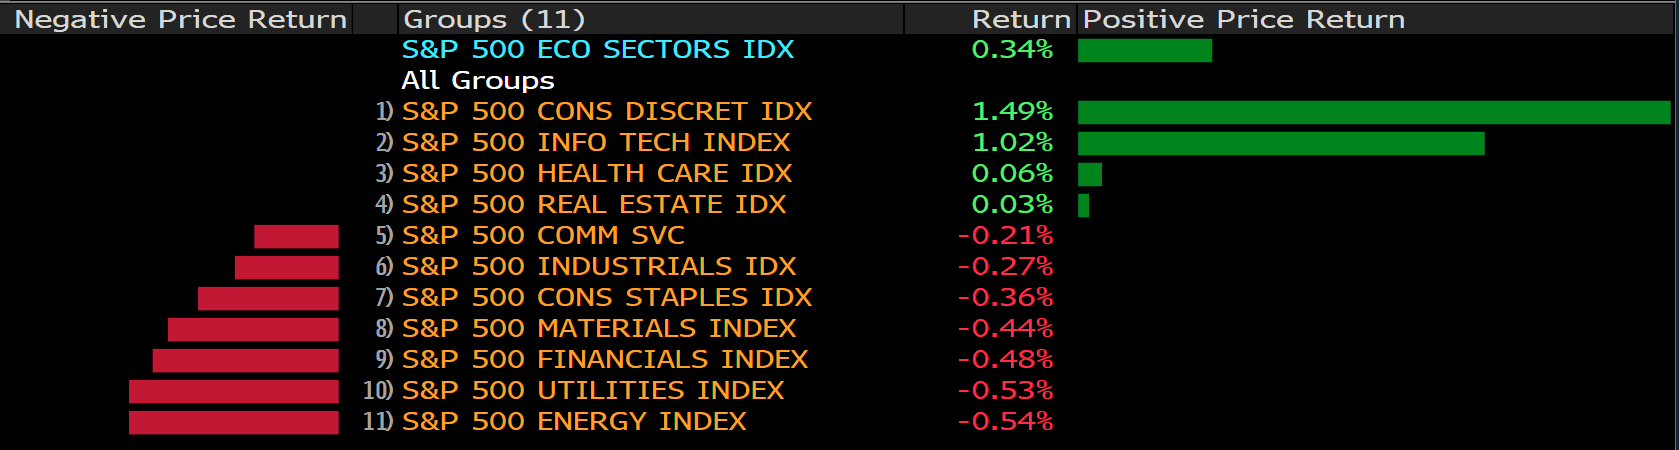
There are slightly more falling stocks in the S&P 500 index than rising stocks. The gains in technology, real estate and energy stocks outpaced declines in banks, materials companies and other parts of the market. Currently, there are several company will released latest quarterly report. Computer manufacturer HP rose 10.10% after announcing solid financial results, Autodesk shares fell 15.5% after the design software company warned investors that its pace of recovery is being affected by supply chain issues and inflationary pressures. As crude oil prices remained relatively stable and natural gas prices rose, energy stocks rose. Devon Energy rose 3.8%.
Main Pairs Movement:
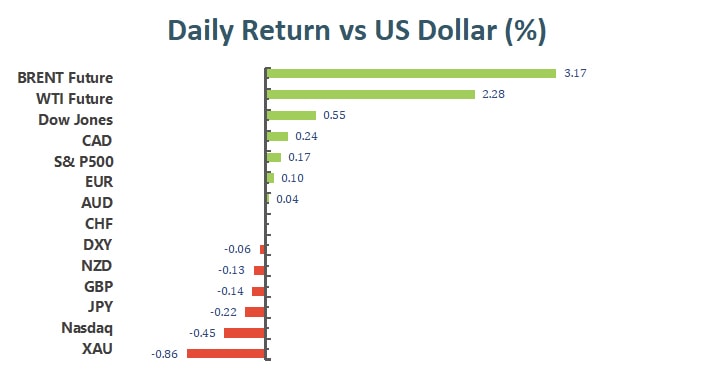
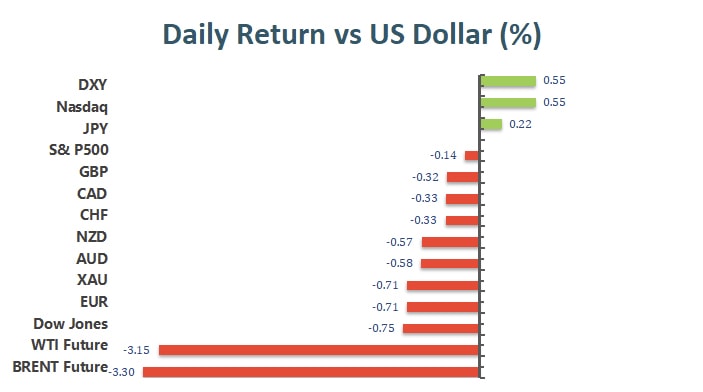
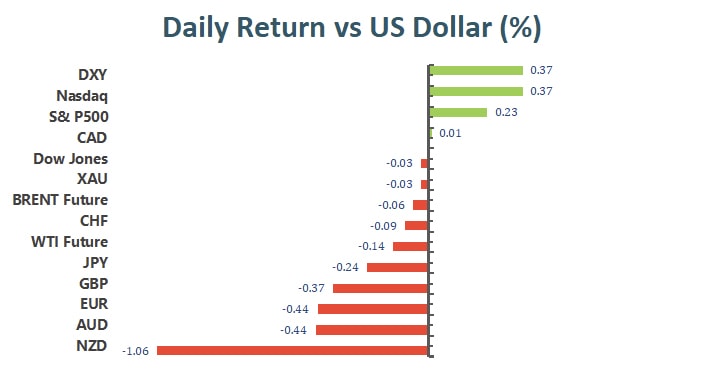
After a series of U.S. data suggest that inflationary pressures remain high and the Fed is about to take action to deal with its impact on the economy, demand for the U.S. dollar continues.
According to the CPI report, U.S. inflation surged to its highest level in 30 years in October. In addition, at the FOMC meeting held yesterday, the statement showed that if inflation continues to heat up, they will be prepared to adjust the pace of production cuts and raise the target range of the federal funds rate in advance. However, since the announcement was not unexpected, the market response was very limited.
Affected by local data and the European Central Bank’s inaction, the EUR/USD fell below the pivot support level of 1.1200 and failed to hold. In addition to market sentiment, another factor affecting the euro is the re-spread of the coronavirus in Europe.
GBP/USD is facing bearish pressure again and is currently in the 1.33362 area. The USD/JPY reached a new high of 115.51 in 2021 and remained stable near the close. AUD/USD is currently trading below 0.7200, and USD/CAD is trading near 1.2670.
Technical Analysis:
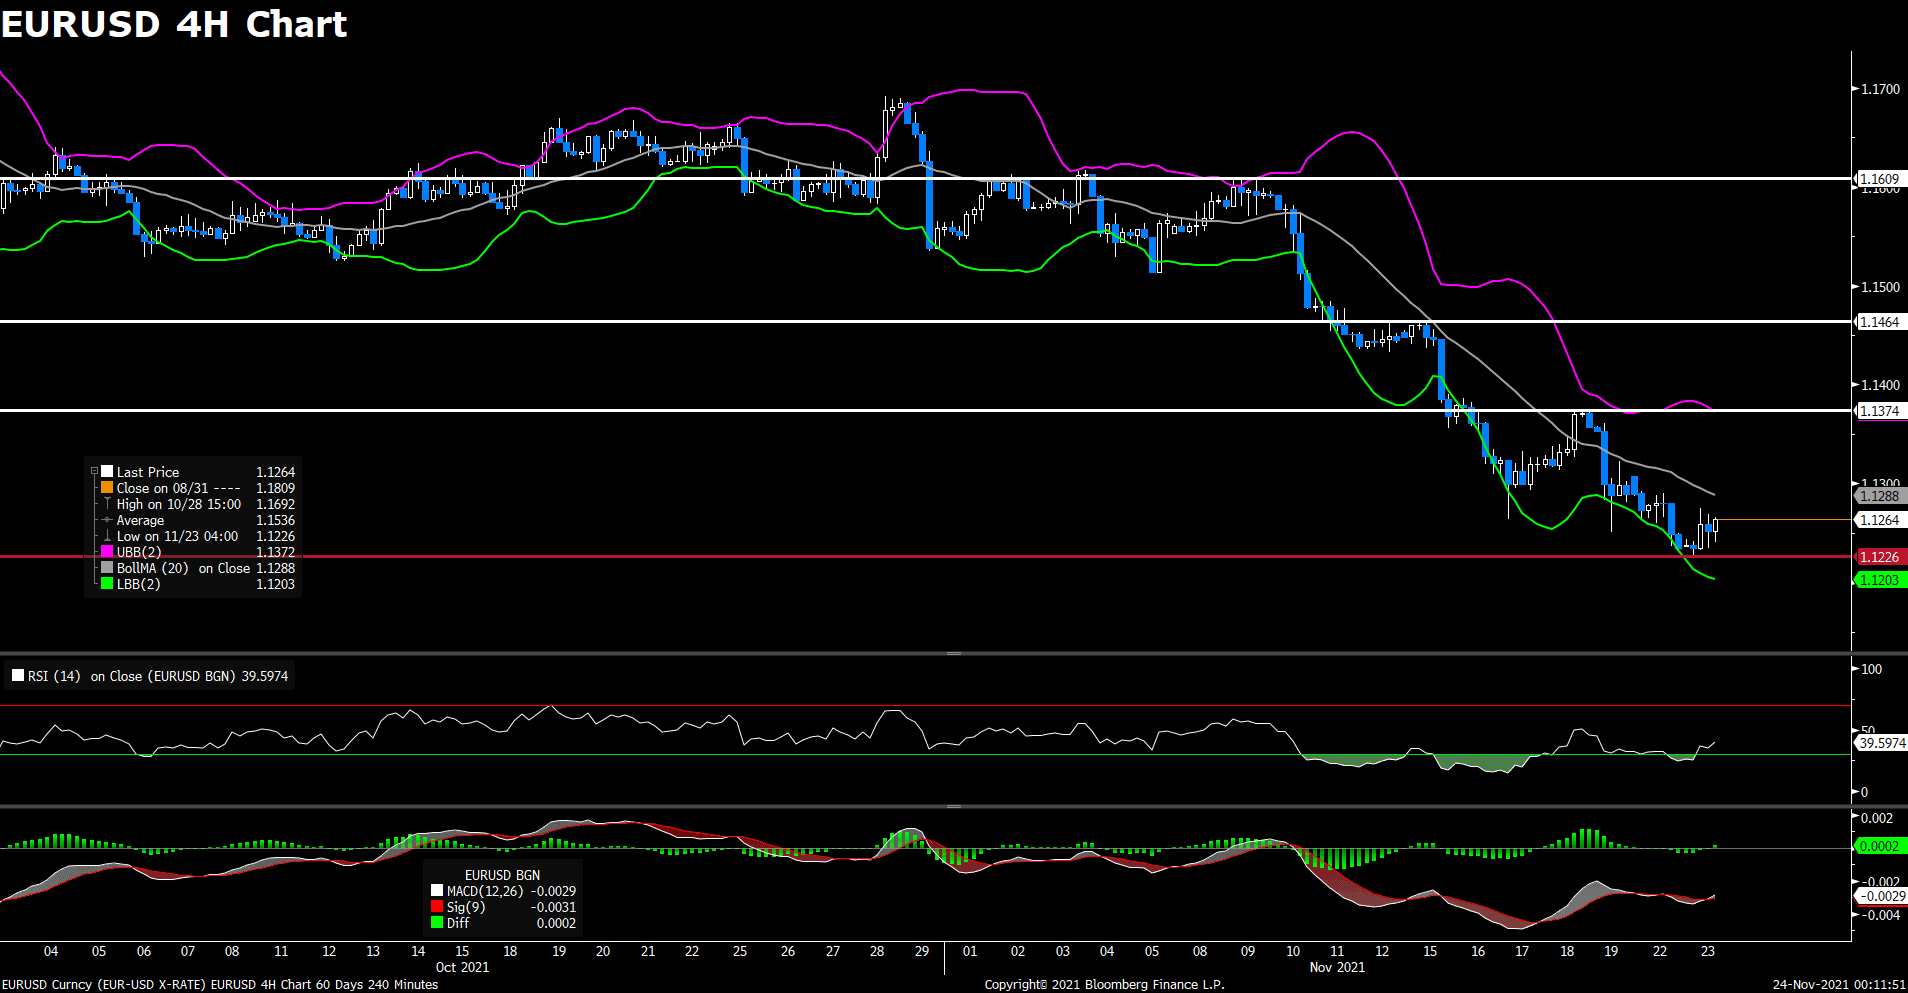
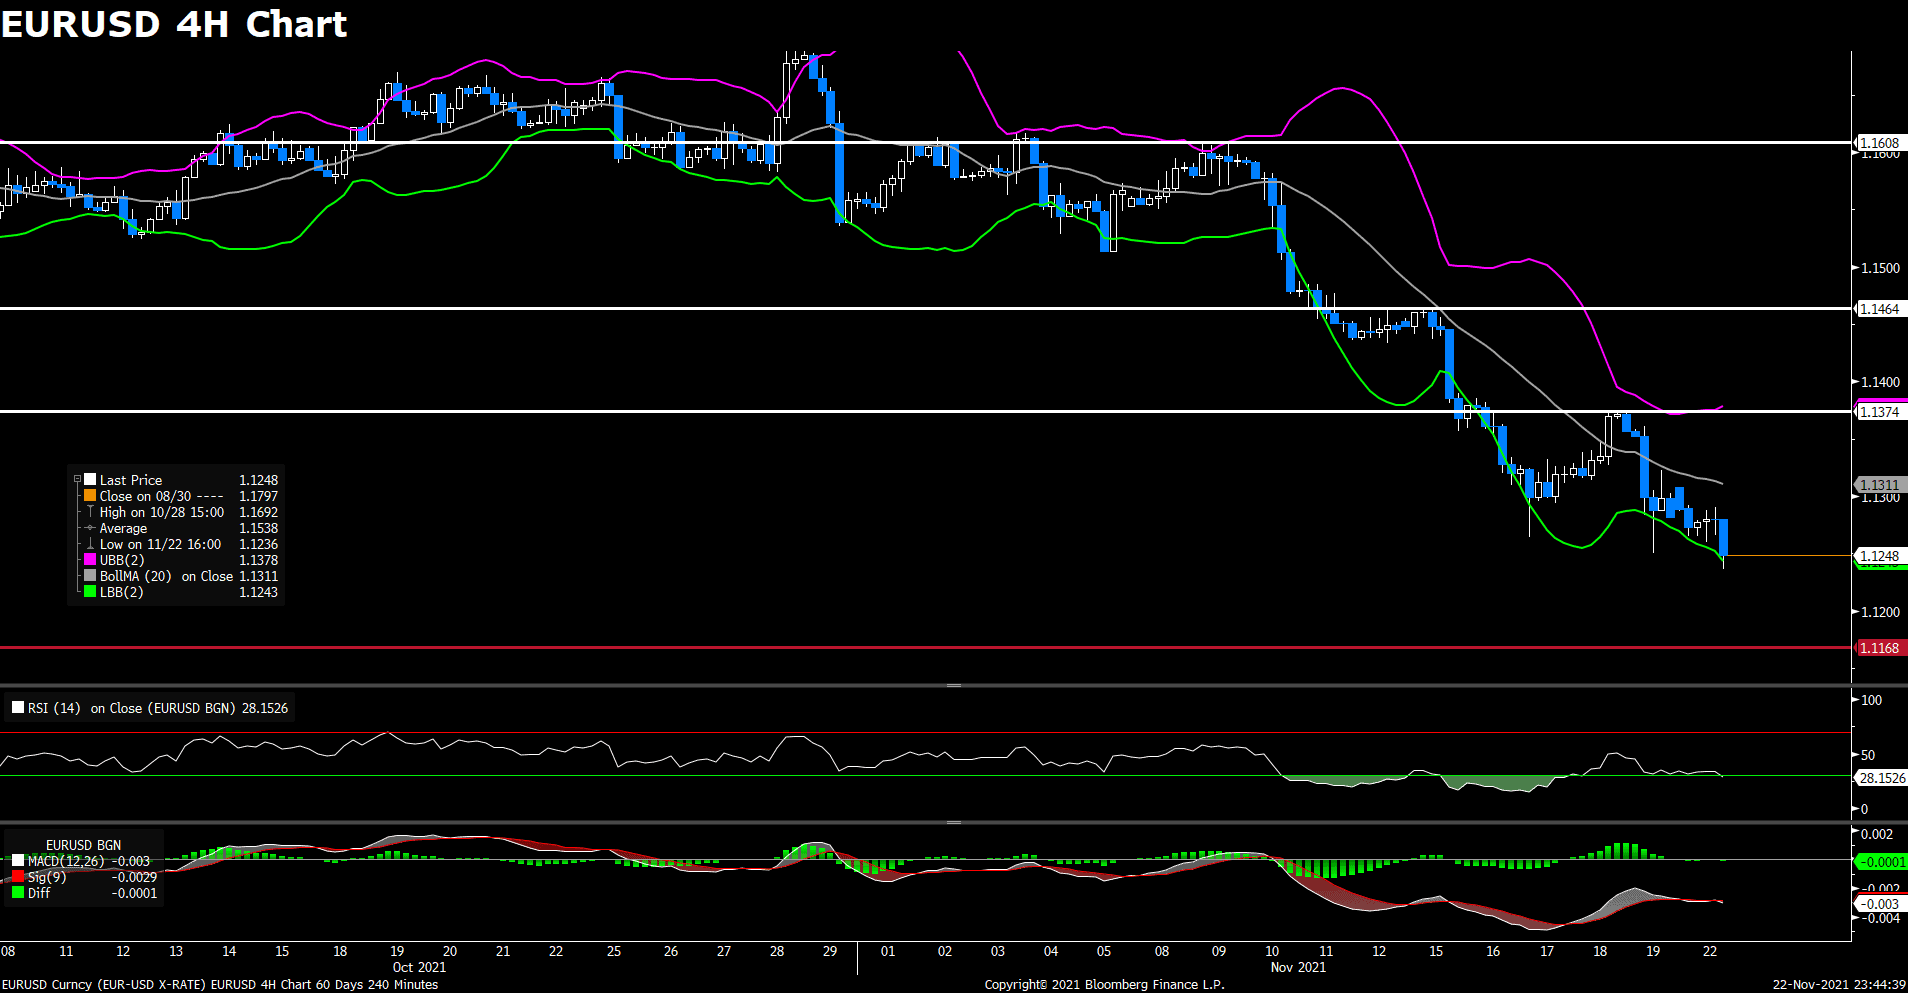
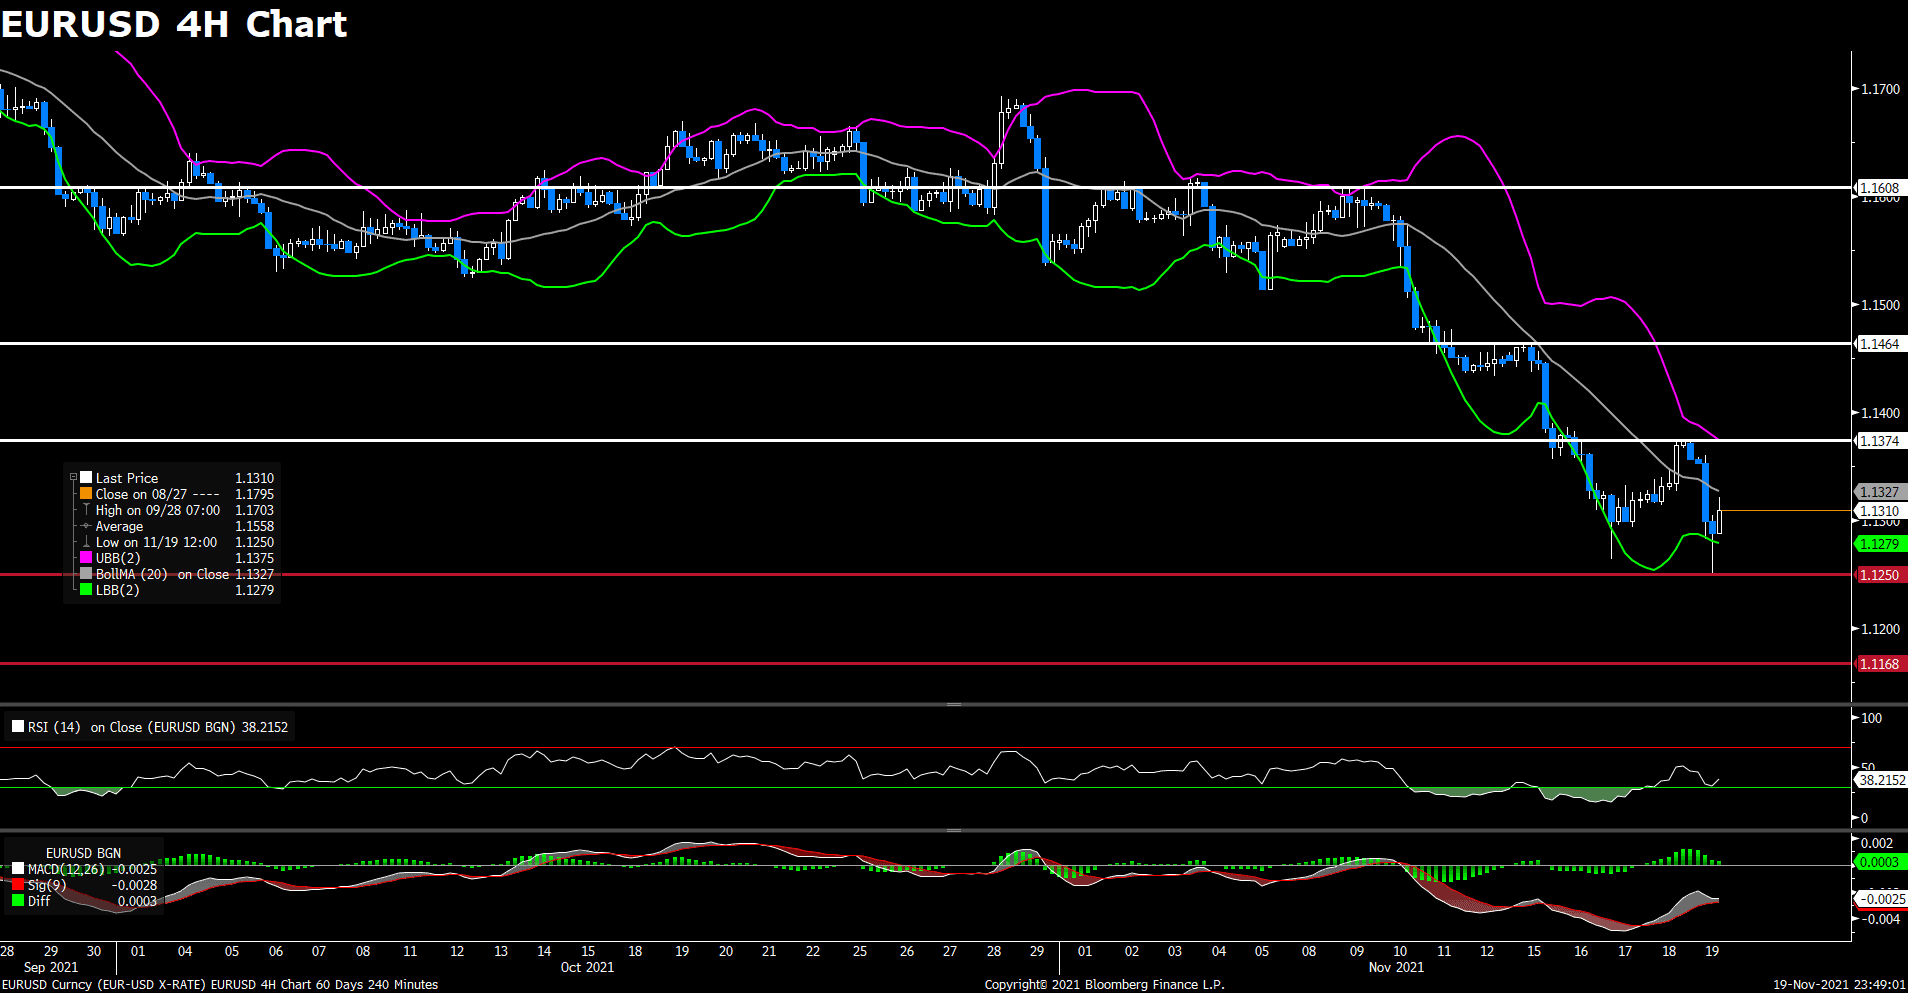
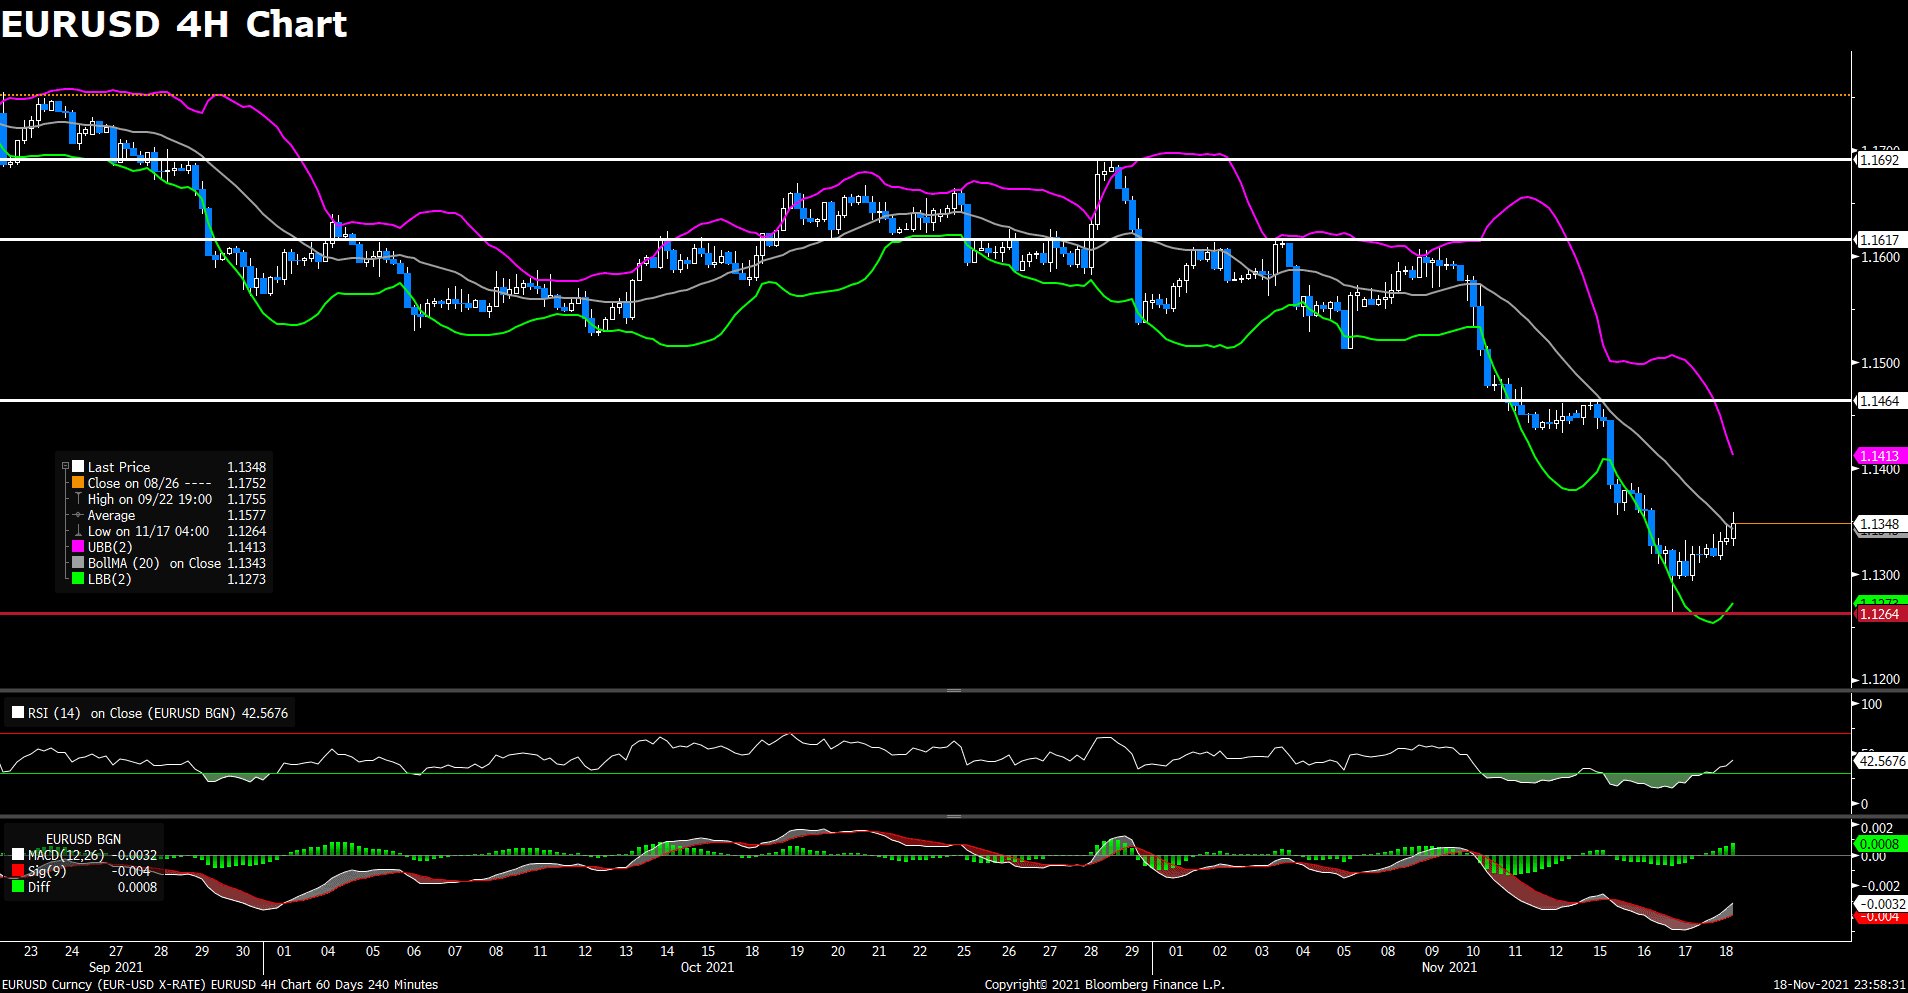
EURUSD (4- Hour Chart)
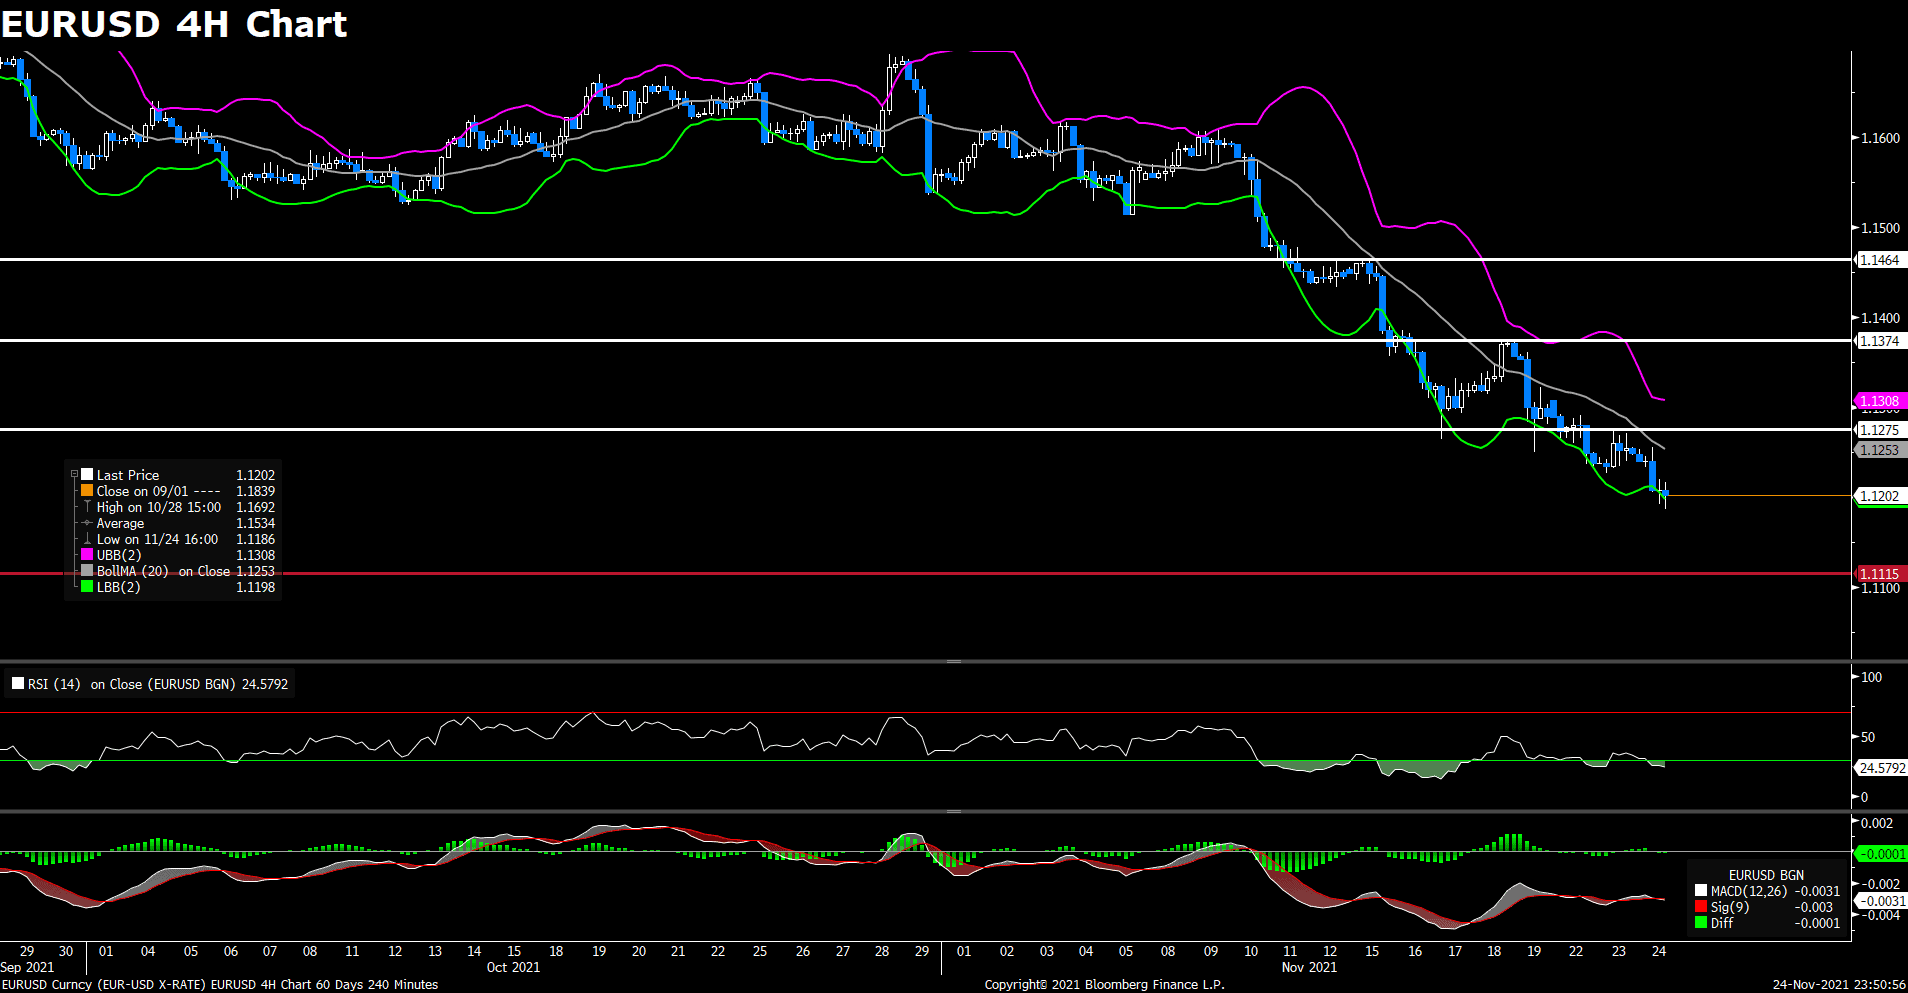
After previous day’s slightly rebound from a sixteen-month lows, the pair EUR/USD was surrounded by heavy selling pressure again on Wednesday. The pair was flirting with 1.124 area to start the day and touched a daily top in early European session, but then dropped to under 1.120 level amid US dollar strength. EUR/USD now remained under pressure, currently losing 0.41% on a daily basis at the time of writing. The US Weekly Initial Jobless Claims released today decline to 199K, which is better than the market expectation of 260k. The upbeat data supported the greenback and push the DXY index higher above 96.8. In Europe, the Germany IFO Business Climate easing to 96.5 in November, therefore the dismal report weighed on the EUR/USD pair.
For technical aspect, RSI indicator 23 figures as of writing, suggesting that the pair is in oversold zone, a trend reversal could be expected. As for the MACD indicator, a death cross just formed on the histogram, which means a short-term downward trend for the pair. Looking at the Bollinger Bands, the price is moving alongside the lower band, therefore the downward trend is likely to persist. In conclusion, we think market will be bearish as the pair already broke below the previous 1.1226 support, now eyeing a test of the 1.1115 support that touched in June 2020.
Resistance: 1.1275, 1.1374, 1.1464
Support: 1.1115
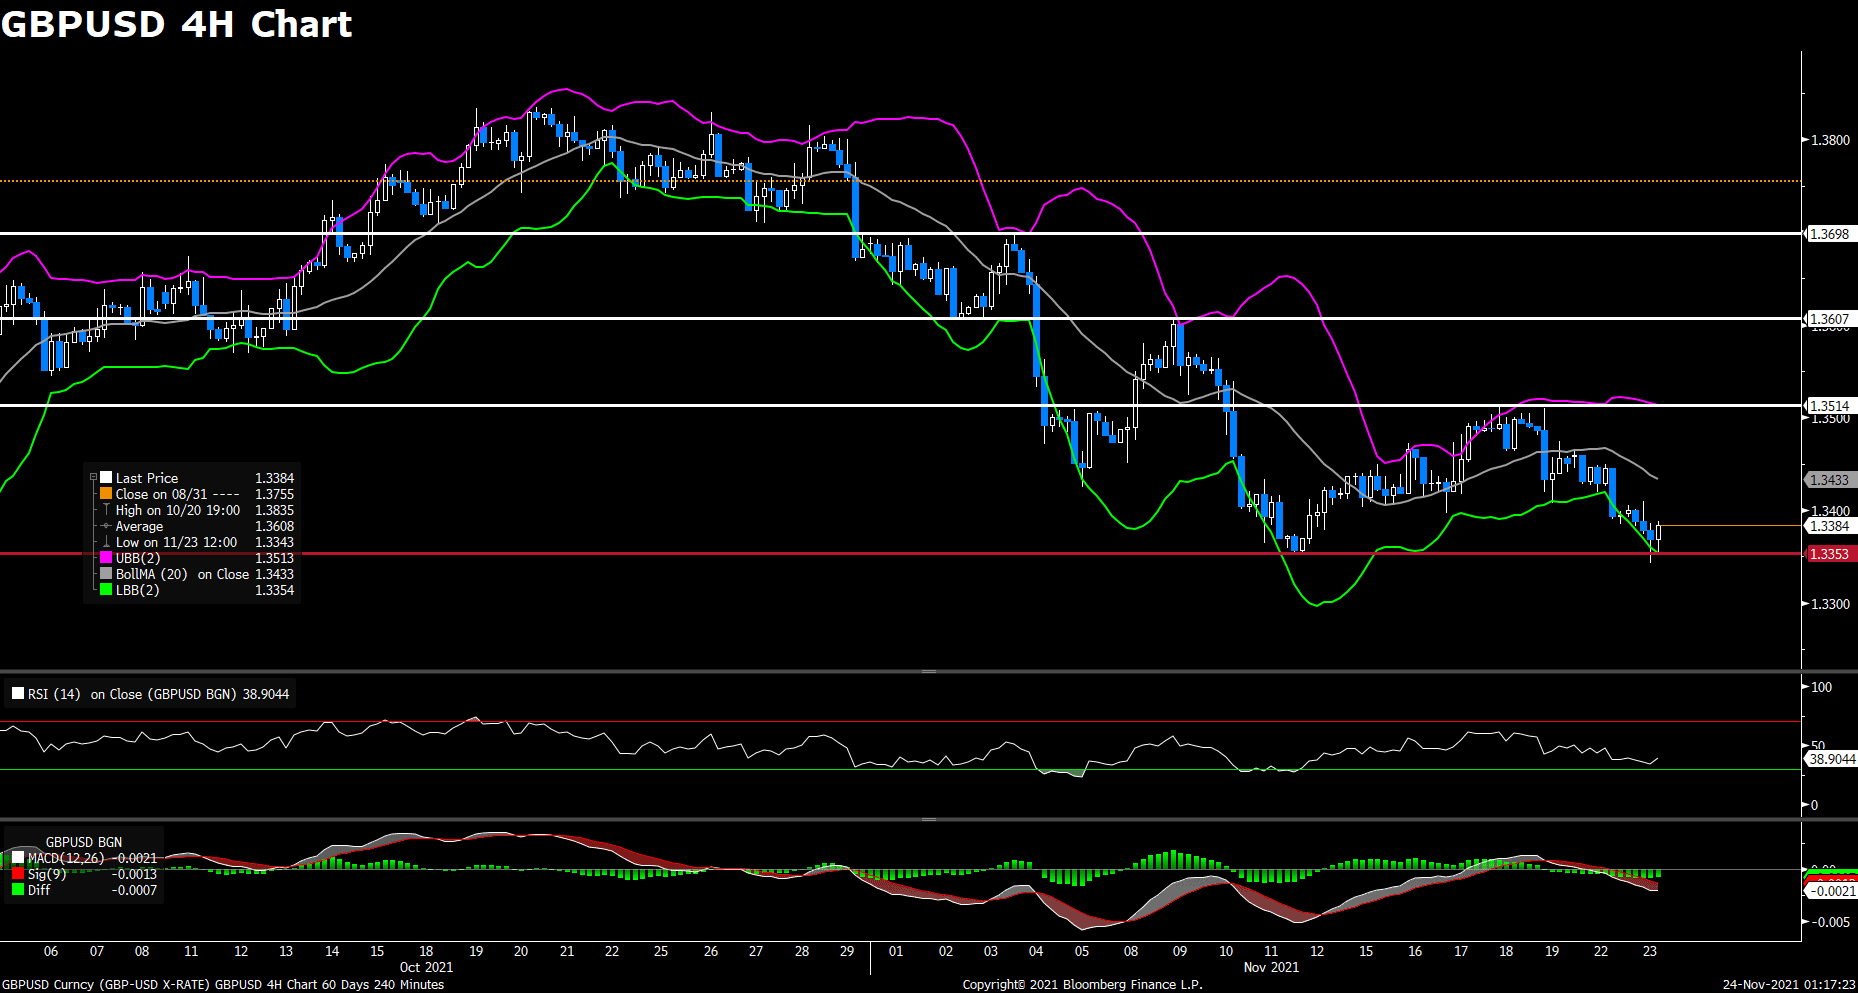
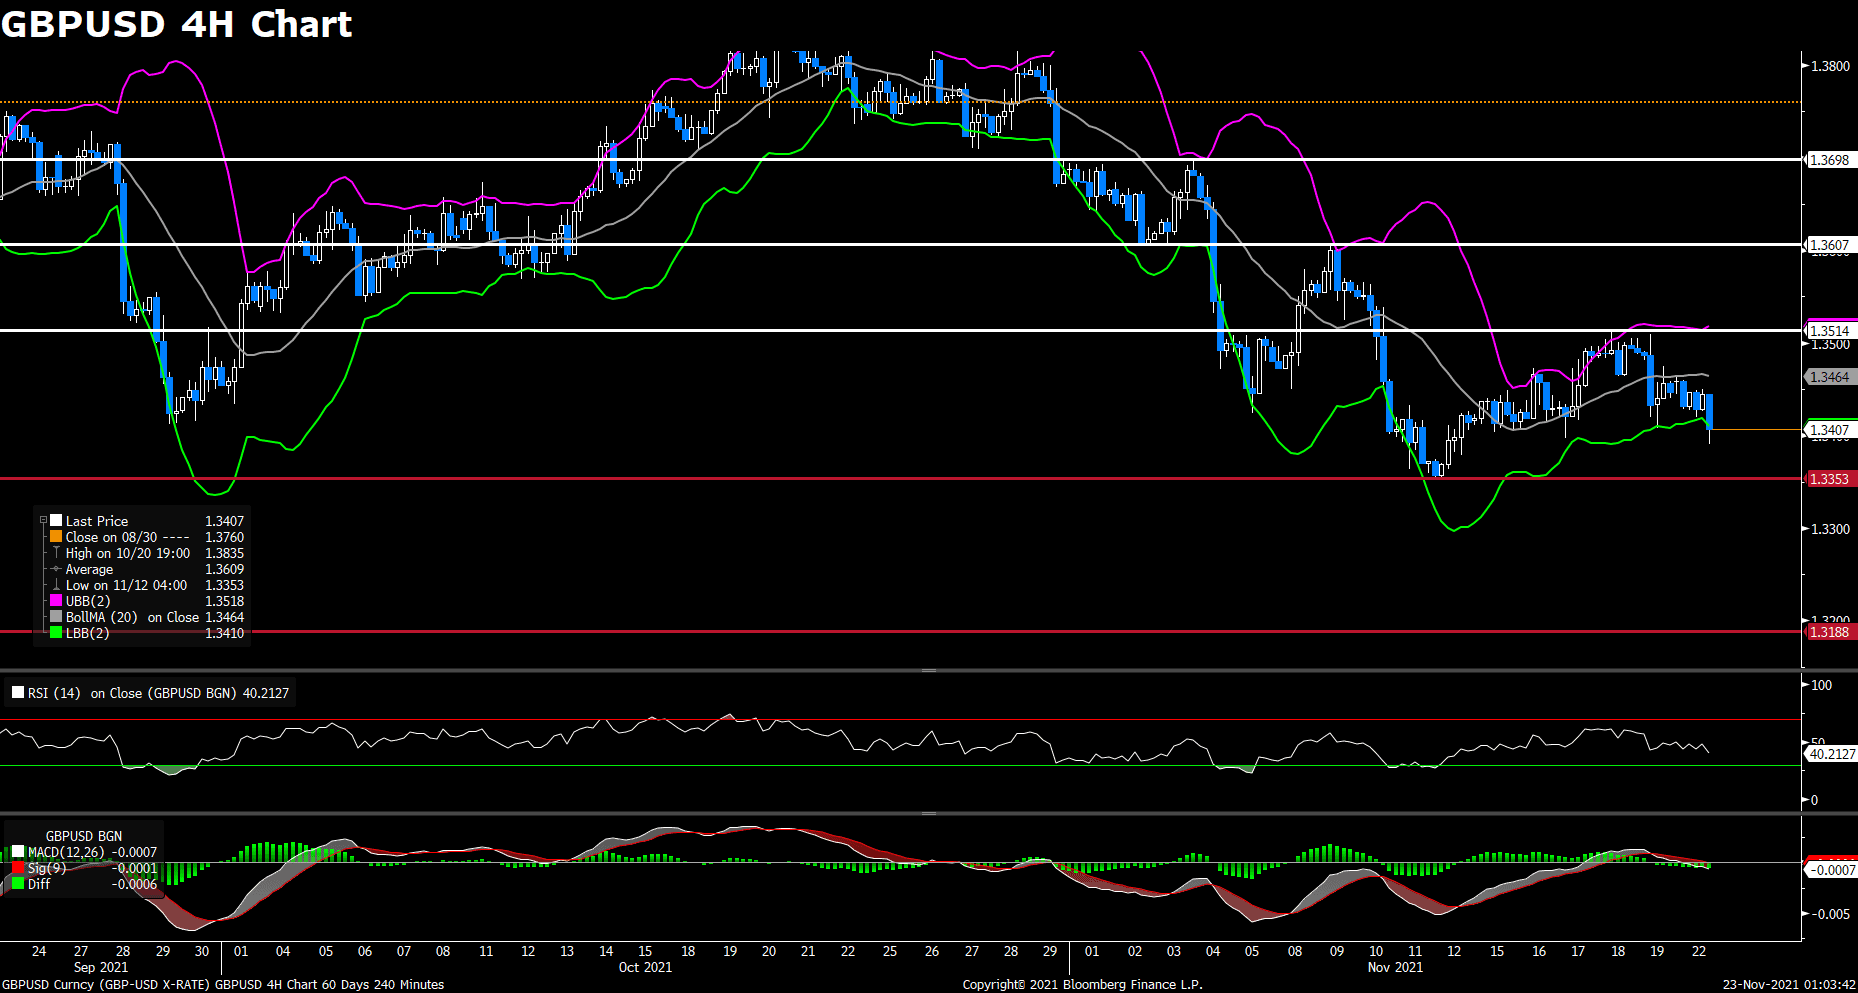
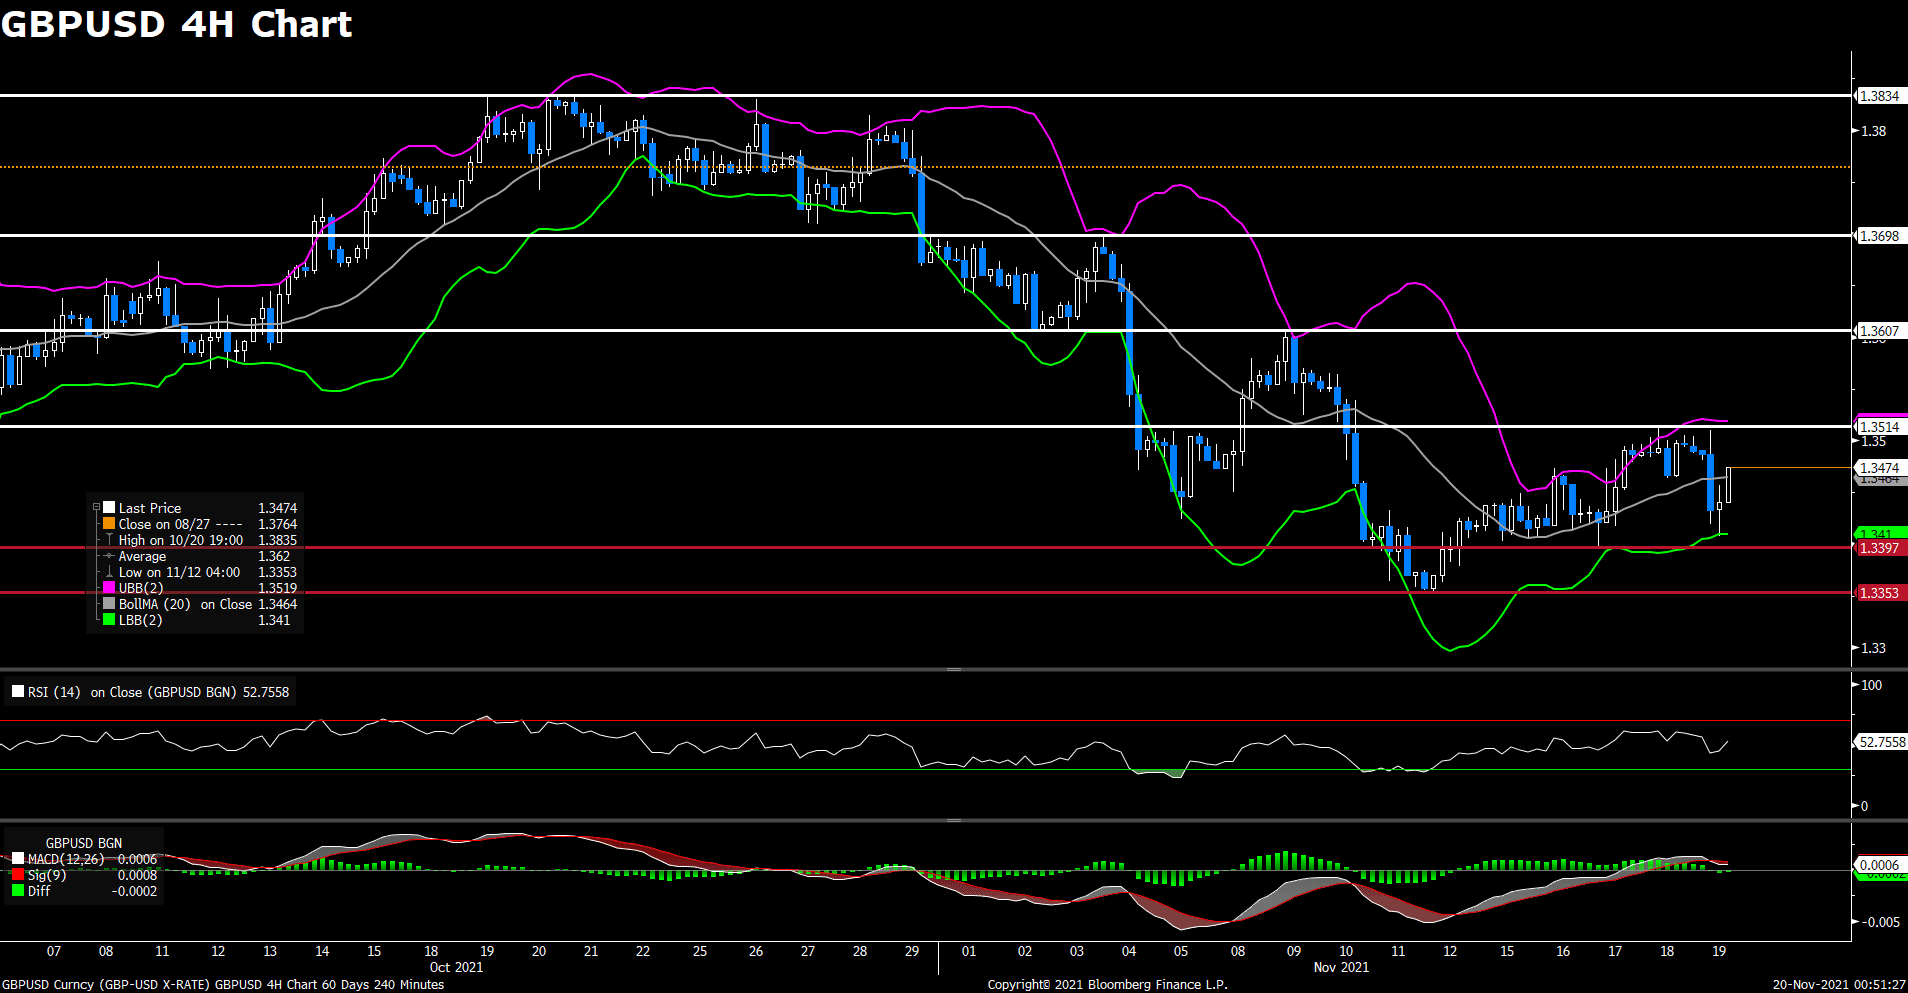
GBPUSD (4- Hour Chart)
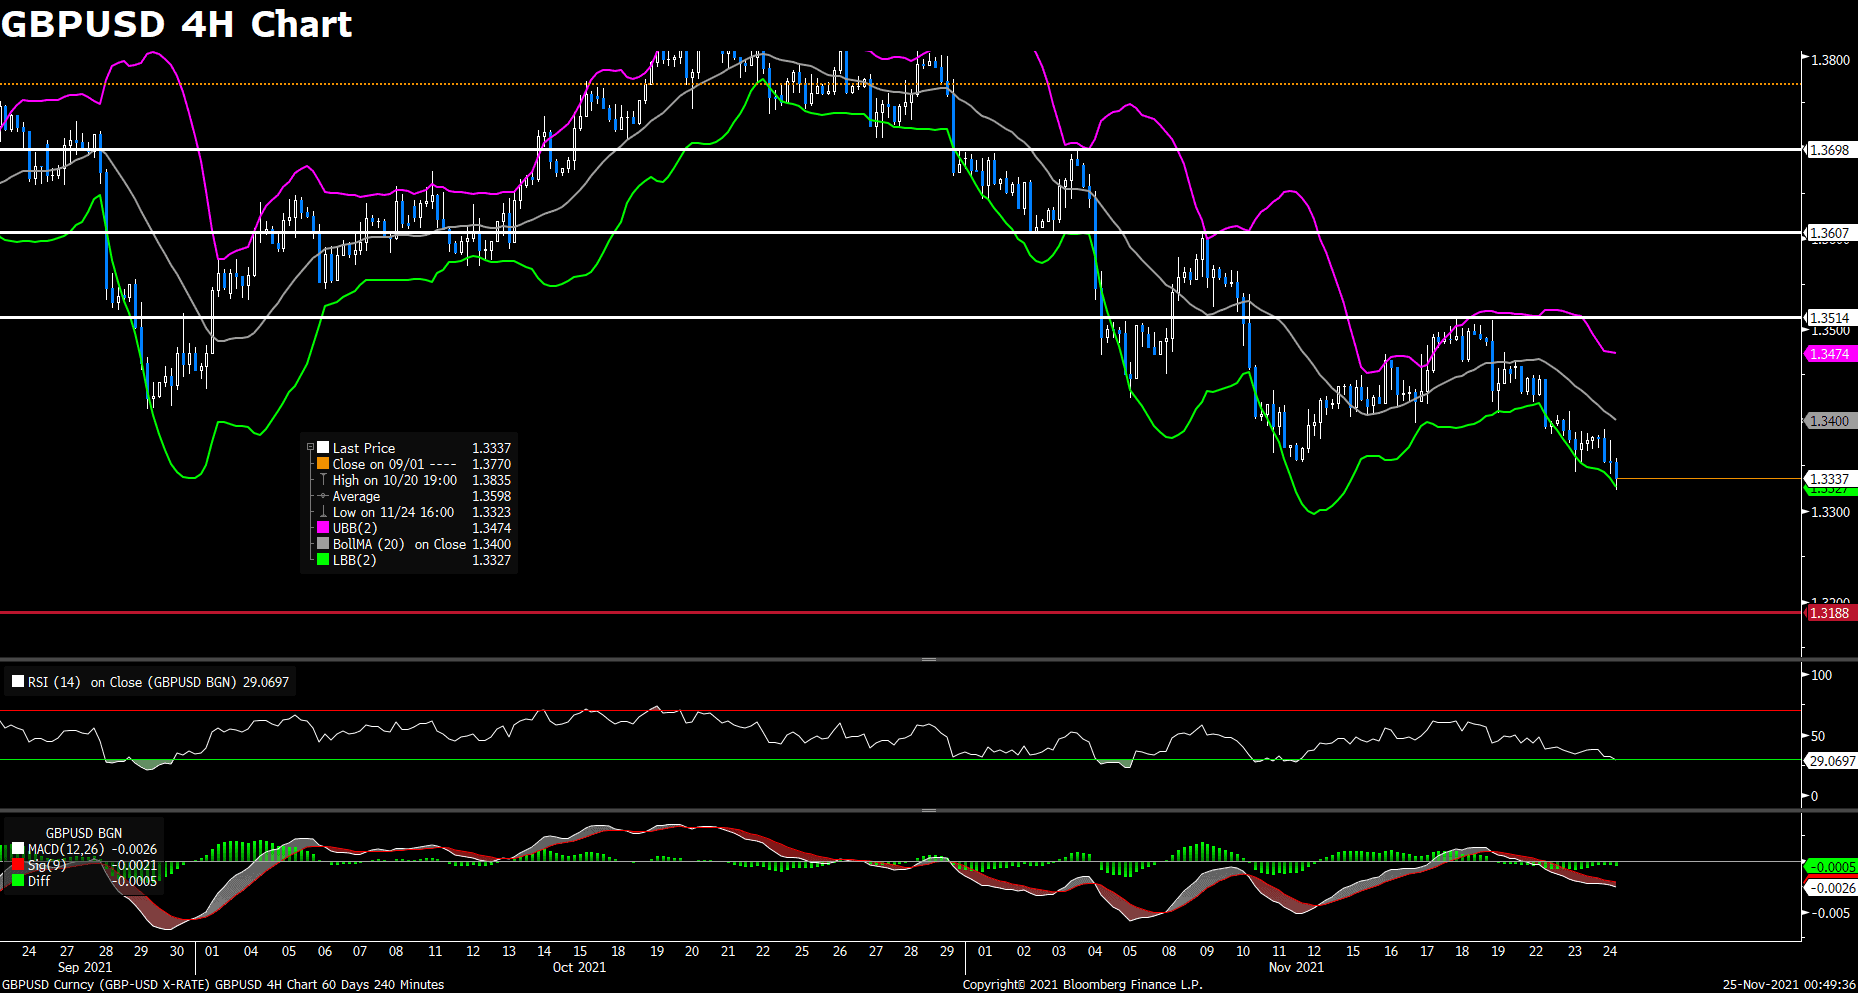
The pair GBP/USD declined on Wednesday, continuing to maintain its bearish tone for the fourth day. The pair started to see fresh selling in early European session, now trading at the lowest level since December 2020 and posting a 0.31% loss for the day. The stronger US dollar across the board keep acting as a headwind for the cable, as the upbeat US economic data and hawkish Fed expectations both lend support to the greenback. Meanwhile, the deadlock over the post-Brexit arrangement in Northern Ireland and fishing rights still weighed on the GBP/USD pair, but France will continue discussions with the UK over post-Brexit fishing access before any retaliatory measures taken.
For technical aspect, RSI indicator 29 figures as of writing, suggesting that the pair is in oversold zone, a trend reversal could be expected. Looking at the MACD indicator, the MACD is now sitting below the signal line, which means a downward trend for the pair. As for the Bollinger Bands, the price just touched the lower band, the bearish tone will be intensified if the price move out of the band. In conclusion, we think market will be bearish as the recent downward momentum might still be far from being over, and the next 1.3188 support awaits.
Resistance: 1.3514, 1.3607, 1.3698
Support: 1.3188
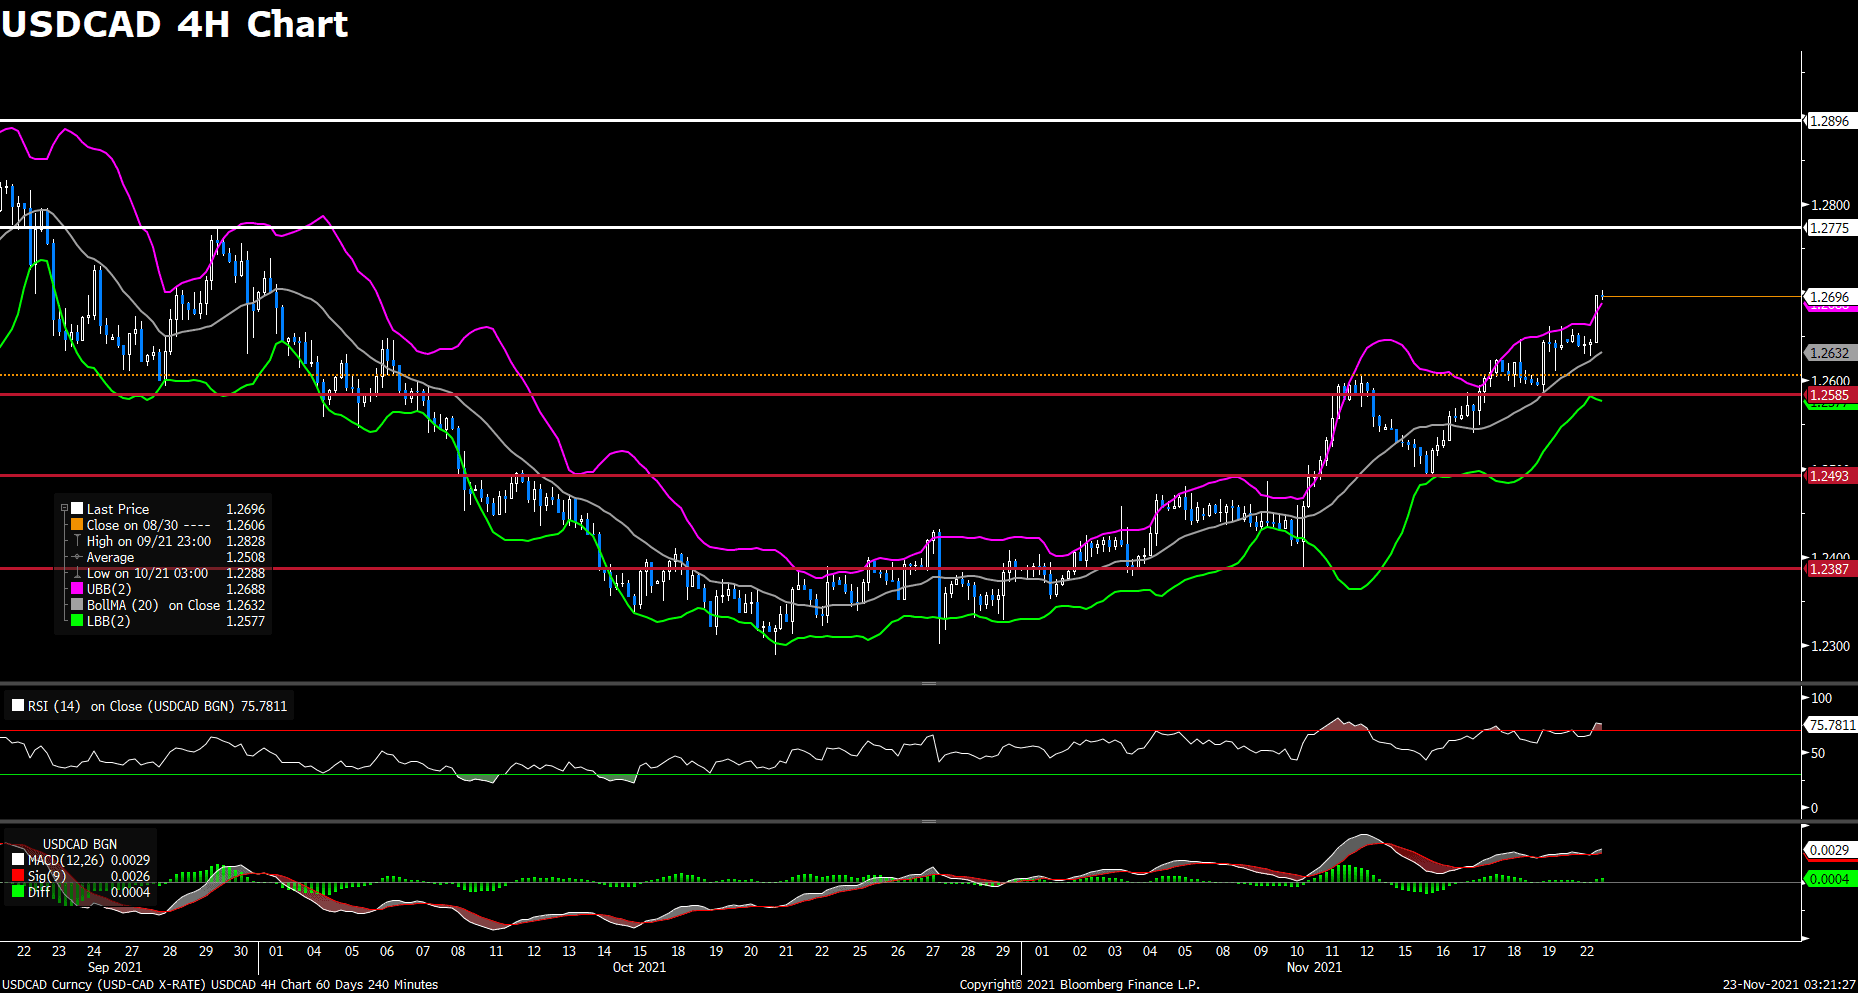
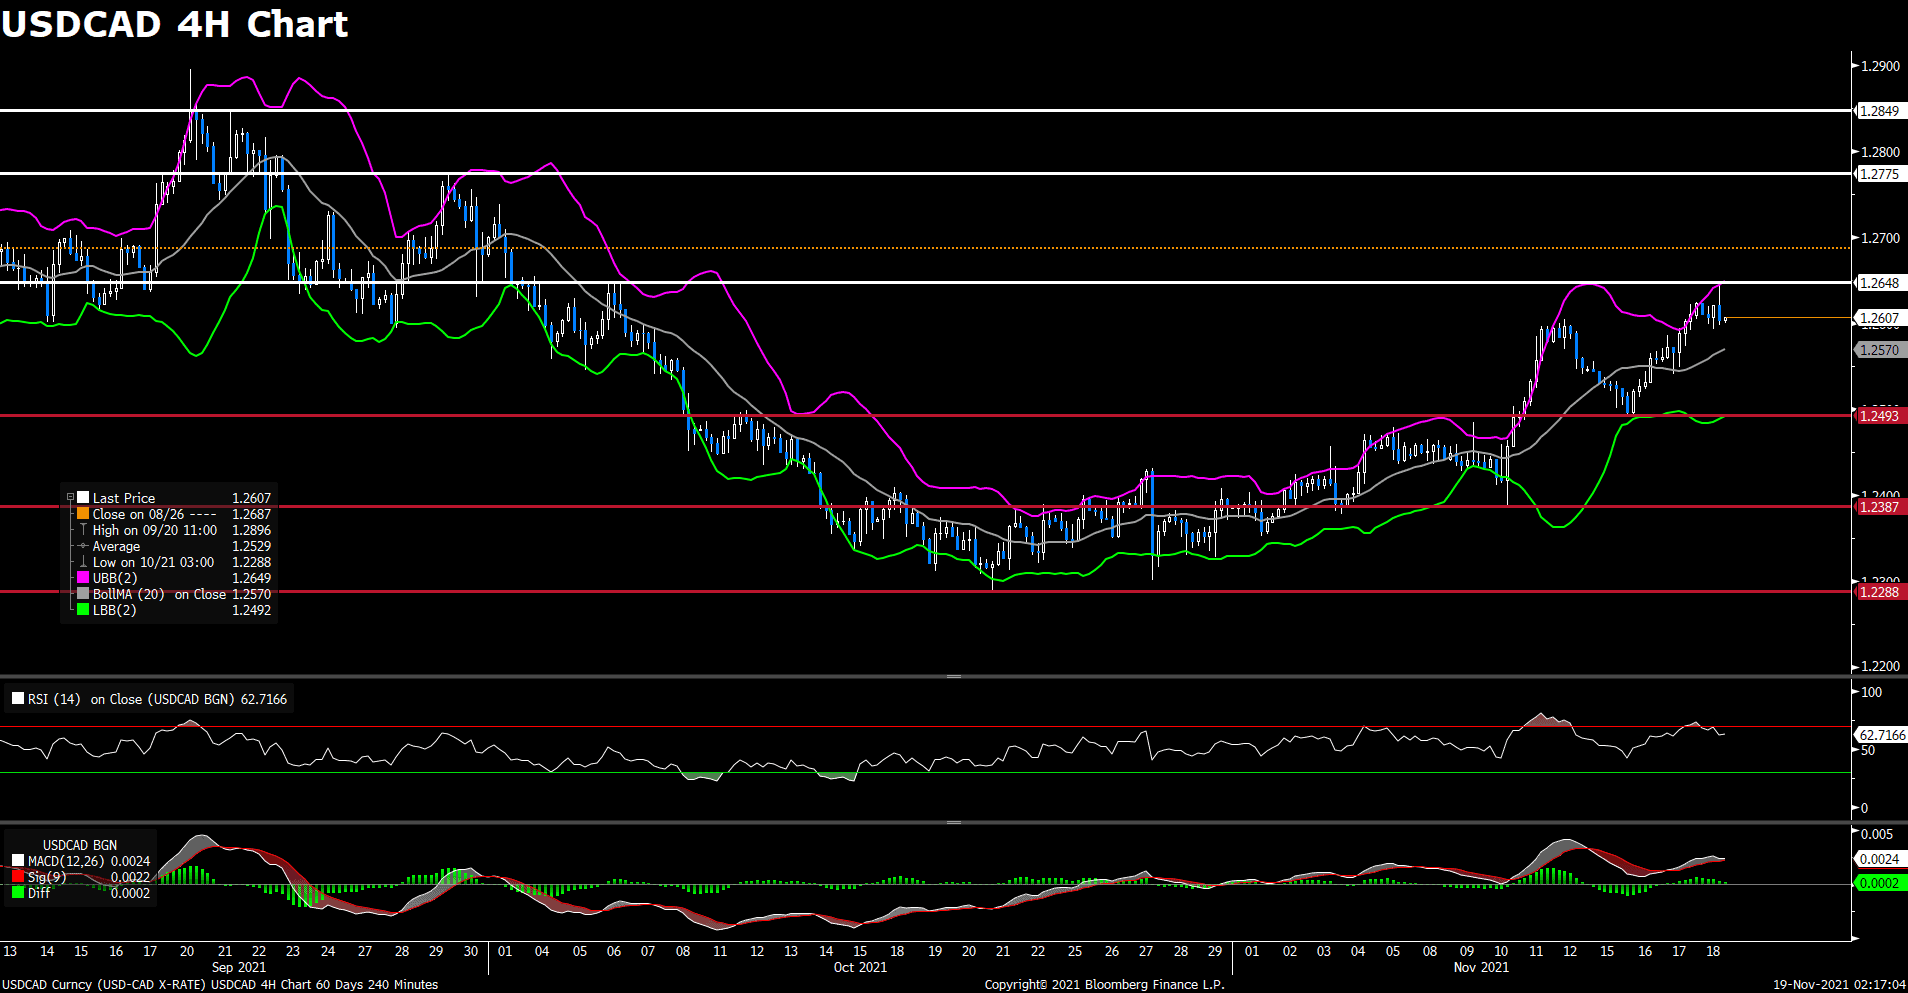
USDCAD (4- Hour Chart)
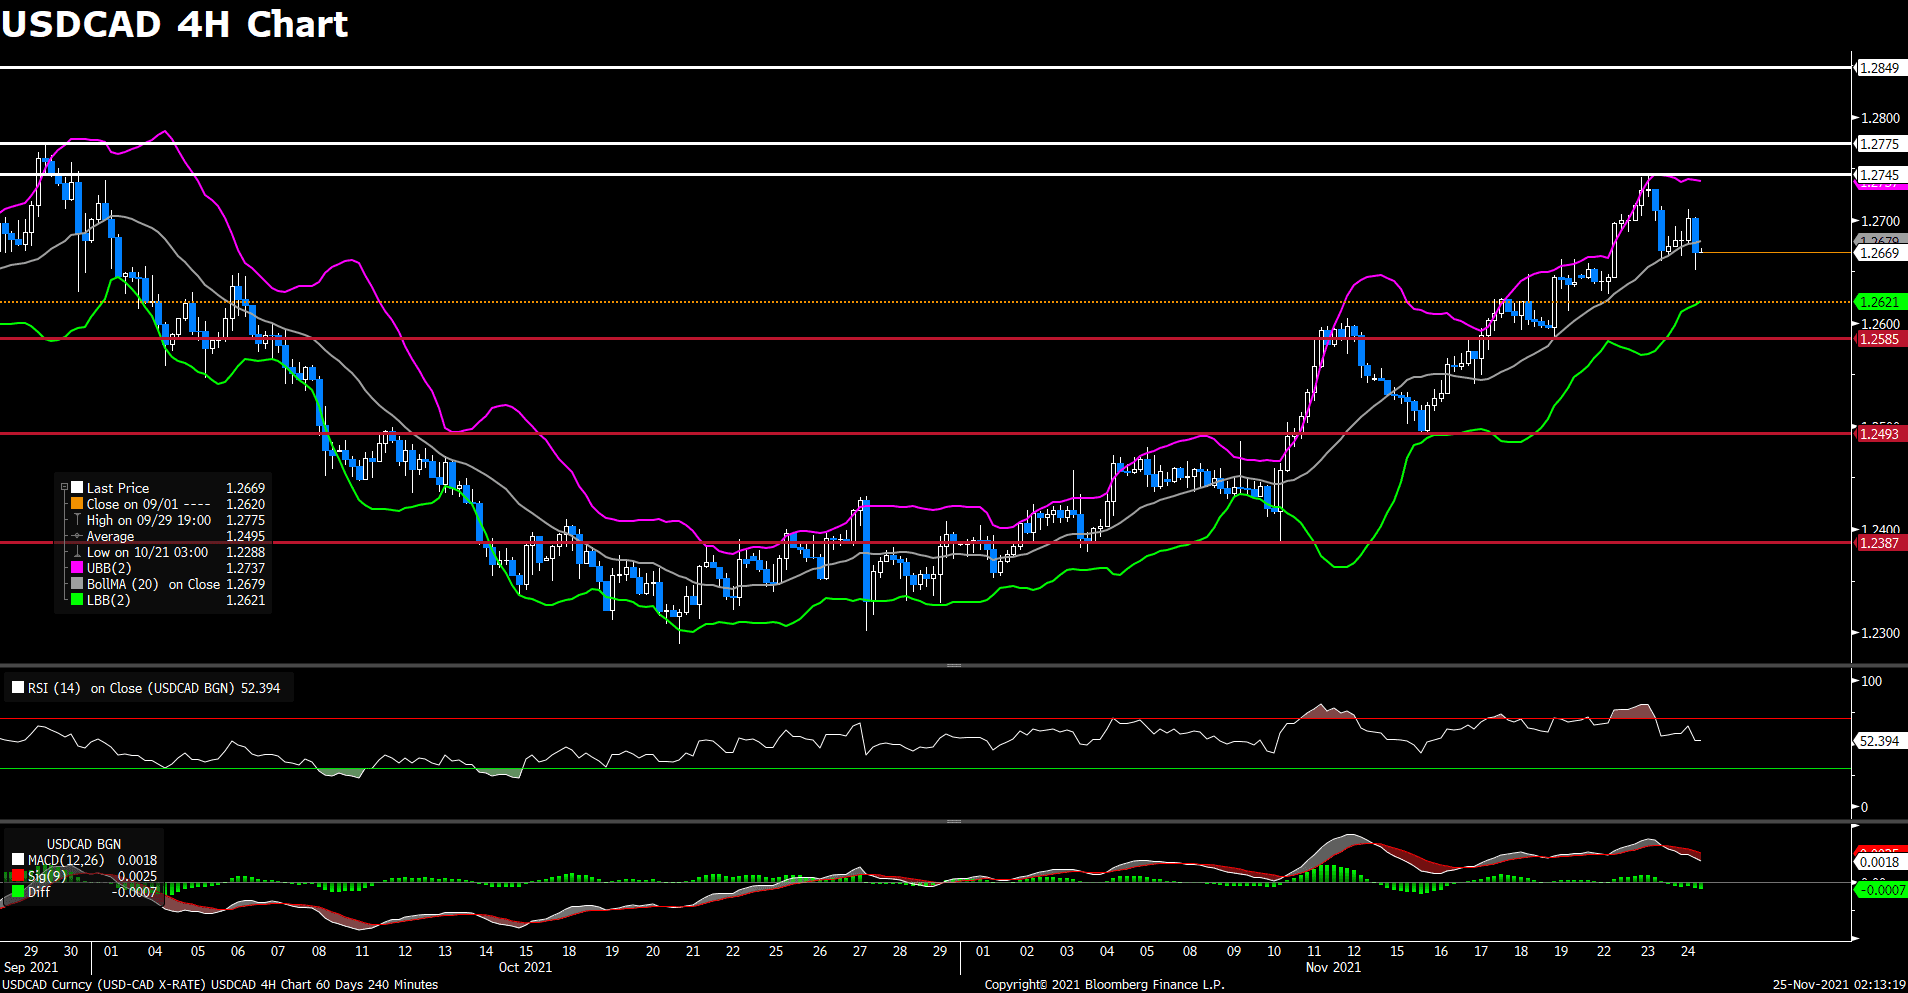
After falling from a monthly high near 1.275 area yesterday, the pair USD/CAD edged higher on Wednesday amid renewed US dollar strength. During American session, the pair pulled back from a daily top touched earlier in the day and surrendered its modest intraday gains. USD/CAD was last seen trading at 1.2672, currently posting a 0.01% gain on a daily basis. The risk-off market sentiment and better-than-expected US job data both spurred demand for the greenback, which is sitting at the highest level since July 2020. On top of that, falling oil prices put pressure on the commodity-linked loonie and pushed the USD/CAD pair higher.
For technical aspect, RSI indicator 53 figures as of writing, suggesting tepid bull movement ahead. But looking at the MACD indicator, the MACD is now sitting below the signal line, which means a downward trend for the pair. As for the Bollinger Bands, the price dropped off the upper band and then crosses below the moving average, the lower band then becomes the loss target. In conclusion, we think market will be bearish as the pair is eyeing a test of the 1.2585 support.
Resistance: 1.2475, 1.2775, 1.2849
Support: 1.2585, 1.2493, 1.2387
Economic Data
|
Currency
|
Data
|
Time (GMT + 8)
|
Forecast
|
|
EUR
|
German GDP (QoQ) (Q3)
|
15:00
|
1.8%
|
|
EUR
|
ECB Publishes Account of Monetary Policy Meeting
|
20:30
|
|
|
EUR
|
ECB President Lagarde Speaks
|
21:30
|
|
|
|
|
|
|
|
|
|
|
|
|
|
|
|
|
|
|
|
|
|
|
|
|
|
|
|
|
|
|
|
|
|
|
|
|
|
|
|
|
|