VT Markets Modification of Symbol name (DAX30 to DAX40)

Dear Client,

Please kindly note that one of the Indices of CFDs symbol named DAX30 will be updated to DAX40 on our platform, which will be effective from December 13th, 2021.

Please contact [email protected] if you would like more information regarding to this.

Market Focus

After the White House’s chief medical adviser, Dr. Anthony Fauci, eased concerns about the severity of the new Covid-19 virus, Wall Street decided to put aside omicron’s concerns on Monday. Besides, there are reports that China is considering easing its monetary policy. In terms of Fed policy, the latest report indicates that the central bank may announce its plan at the next meeting to withdraw from the bond purchase plan more quickly.

The Dow Jones Industrial Average rose 646.95 points to 35,227.04 points, the S&P 500 index rose 1.17% to 4,591.68. The Nasdaq Composite Index, which is dominated by technology stocks, rose 0.9% to 15,225.15 points.

一張含有 文字 的圖片

自動產生的描述

With the news that the epidemic has eased, the aviation industry finally rebounded on Monday.

The American Airlines Group rose 7.9%, US Global Jets exchange-traded fund rose 5.3% and United Airlines Holdings rose 8.3%. Moreover, the post-pandemic reopening stocks have also achieved good results, the Carnival and Royal Caribbean Cruises rose 8.0% and 8.3%, respectively. Marriott International rose 4.5%, Live Nation Entertainment rose 6.1%, and Cinemark Holdings rose 7.7%. However, in the technology sector, not as strong as other sectors, Apple rose more than 2% on Monday, while Microsoft fell 0.3%, and the leader in electric vehicles, Tesla, fell more than 5%.


Main Pairs Movement:

The U.S. dollar closed mixed on Monday. On Friday, the United States released a Nonfarm Payrolls report, which was lower than market expectations and raised doubts about further aggressive reductions in the US.

Regarding the Omicron coronavirus variant, although the virus is still spreading in many countries and communities, at the same time, there have been no deaths related to this variant so far, which raises people’s hopes for a milder illness to prevent lockdowns and restrictions, and this also avoid an economic slowdown.

The euro is one of the weakest opponents of the US dollar, closed at 1.1265 against the greenback on Monday. High-yield currencies rose slightly, with GBP/USD rising 0.23% to close at 1.32624. On the other hand, commodity-related currencies rose the most, Aussie up 0.8% and CAD went up 0.62% against the dollar. The yen and Swiss franc fell slightly due to weakening concerns, but all major currency pairs remained within familiar levels.

Gold fell slightly and closed at $1,778 per troy ounce. On the other hand, crude oil prices rose sharply with the stock market, and WTI closed at $69.70 per barrel and Brent oil closed at 73.64, both up 5%.


Technical Analysis:

XAUUSD (4- Hour Chart)

The outlook of the precious metal, Gold, remains subdued as it continues to fall within the descending channel. However, today’s bulls seems to push gold upside, toward its immediate hurdle at $1,789 and the edge of the descending trendline. Gold looks to hover around $1,780 recently as the RSI is currently neutral, setting at the 50th mark. To the upside, gold needs to breach the descending line and the 60 days- simple moving average in order to regain bullish momentum. On the contrary, if gold fails to break through the barrier, then it is expected to head toward the next support at $1,770.

Resistance: 1,780, 1,797, 1,808

Support: 1,770, 1,761


BTCUSD (Daily Chart)

Bitcoin bounces back and stands nearly $50,000 after a devastating weekend, tumbling more than 17%. From the technical perspective, the support around $49,000 looks steady and robust, Bitcoin’s bearish momentum stops here as the time of writing. The outlook of Bitcoin turns bearish on the daily chart as it has breached the ascending trendline. To the upside, Bitcoin needs to climb above the acceptance level of $55,103 to regain strength. As the time of writing, Bitcoin looks to rebound as the RSI has reached the oversold territory, which is due to a pullback. To the dowside, if the current support at $46,530 fails to hold, then Bitcoin is expected to head toward the next support at $39,566.

Resistance: 55,103, 58,000, 68,991

Support: 46,530, 39,566, 32,621


EURUSD (4- Hour Chart)

EURUSD trades below 1.1300 as the US dollar is comparably stronger. From the technical aspect, the outlook of EURUSD remains bearish on the 4- hour chart after meeting sellers around the resistance level at 1.1357. In the meantime, EURUSD continues to fall within the descending channel while it falls below its simple moving averages. It is expected to see the pair consolidates in the range from 1.1357 and 1.1.1186 as the RSI is currently in the midline, suggesting a directionless within negative levels and maintaining the risk skewed to the downside.

Resistance: 1.1357, 1.1462, 1.1548

Support: 1.1186


Economic Data

Currency

Data

Time (GMT + 8)

Forecast

GBP

BRC Retail Sales Monitor (YoY) (Nov)

08:01

N/A

GBP

Halifax House Price Index (MoM) (Nov)

15:00

N/A

GBP

Halifax House Price Index (YoY)

15:00

0.8%

USD

Exports

21:30

N/A

USD

Imports

21:30

N/A

USD

Nonfarm Productivity (QoQ) (Q3)

21:30

-4.9%

USD

Trade Balance (Oct)

21:30

-66.80B

USD

Unit Labor Costs (QoQ) (Q3)

21:30

8.3%

VT Markets Dec futures rollover announcement

Dear Client,

New contracts will automatically rolled-over as follows:

Please note:

• The rollover will be automatic, and any existing open positions will remain open.

• Positions that are open on the expiration date will be adjusted via a rollover charge or credit to reflect the price difference between the expiring and new contracts.

• To avoid CFD rollovers, clients can choose to close any open CFD positions prior to the expiration date.

• Clients should ensure that take profits and stop losses are adjusted before this rollover occurs.

If you’d like more information, please don’t hesitate to contact [email protected].

Market Focus

US stock fall last Friday amid a sharp selloff witnessed in huge technology companies, extending their weekly slide. The concerns about the new Omicron variant remained, as investors worry about that an outbreak could slowdown the recovery in global economy. Moreover, US Nonfarm Payrolls released last Friday rose by 210K in November, which is lower than market’s expectation of 550K. But the Federal Reserve is likely to follow through with faster tapering despite the dismal jod data, as the pressure of elevated inflation continues to rise.

The benchmarks, S&P 500, Dow Jones and Nasdaq both declined last Friday as the mixed US jod report increased the volatility of equity markets. S&P 500 was down 0.8% on a daily basis and the Dow Jones edged lower with a 0.2% loss for the day. Eight out of eleven sectors stayed in negative territory as the consumer discretionary and information technology sectors are the worst performing among all groups, dropped 1.84% and 1.65%, respectively. Consumer staples and utilities were the only major groups to climb higher on the day. The Dow Jones lost the most with 1.7%.

一張含有 文字 的圖片

自動產生的描述

In Asia, shares of Chinese companies traded in the US tumbled on Friday, as the The Chinese ride-hailing company, DiDi, decides to delist its American depositary shares from the New York Stock Exchange and pursue a listing in Hong Kong. The announcement adds even more uncertainty to the prospects for other US-listed Chinese firms.


Main Pairs Movement:

The US dollar edged higher last Friday, gathering some pace and retests the daily highs around 96.45 at the end of the week. After touching a fresh three-day high, the DXY index retreated to 96 level during mid American session and posted a 0.02 gain on a daily basis. The hawkish tone from Fed chair Powell continued to acted as a tailwind for the greenback, as he suggested that the Fed will discuss adopting a quicker tapering pace at the December meeting, all pointing to a rates lift-off at some point in mid-2022.

GBP/USD declined last Friday, dropping below 1.324 level amid rebounding US dollar. The pair reached a daily top in late European session but failed to preserve its bullish momentum. EUR/USD rebounded slightly amid the decline in US yields, rising 0.06% on a daily basis.

USD/JPY touched a fresh daily top after the release of US job reports, but then started to see heavy selling and dropped below 112.6 area. The pair is now trading at 112.88, rising 0.11% for the day.

Gold gained upside traction and rebounded above $1782, as the downbeat market sentiment lend some supports to the precious metal. Gold is now rising 0.02% on a daily basis. WTI stayed in negative territory and slumped 1.65% for the day.


Technical Analysis:

EURUSD (4- Hour Chart)

After previous day’s slide to 1.129 area, the pair EUR/USD consolidated in a range between 1.128 and 1.131 on Friday. The pair was flirting with 1.130 level during the Asian Session, then touched a daily high above 1.133 after US Nonfarm Payrolls released. However, the recovery witnessed in US dollar weighed on the pair, which surrendered most of its intraday gains and currently losing 0.17% on a daily basis. Nonfarm Payrolls rose by 210K in November, which is lower than market’s expectation of 550K and dragged the US dollar below 96 level right after the release. Despite the dismal data, the greenback has rebounded and posted a 0.22% gain at the moment. In Europe, European Central Bank President Christine Lagarde said that it is very unlikely to see rate hikes in 2022, therefore the dovish comments acted as a headwind for EUR/USD.

For technical aspect, RSI indicator 44 figures as of writing, suggesting tepid bear movement ahead. Looking at the MACD indicator, the MACD is now sitting below the signal line, which means a downward trend for the pair. As for the Bollinger Bands, the price is dropping out of lower band, therefore a trend continuation could be expected. In conclusion, we think market will be bearish as long as the 1.1383 resistance line holds.

Resistance: 1.1383, 1.1464, 1.1606

Support: 1.1236, 1.1186


GBPUSD (4- Hour Chart)

The pair GBP/USD declined sharply and refreshed 2021 low on Friday, staying under pressure amid renewed US dollar strength. The pair flirted with 1.329 level in early trades and edged lower during European session. After the release of US Nonfarm Payrolls, the cable touched the lowest level since December 2020 below 1.322, currently staying in negative territory with a 0.60% loss for the day. The US dollar remained its bullish traction despite downbeat NFP report, as the hawkish Fed continued to lend support to the greenback with the aspects of a rate hike in 2022. In the UK, UK Final Services PMI downwardly revised to 58.5 in November. On top of that, the UK-EU impasse over the Northern Ireland Protocol and the worsening row over the post-Brexit fishing rights both acted as a headwind for the British pound.

For technical aspect, RSI indicator 32 figures as of writing, reflecting that the bearish momentum should persist for a while before there’s a trend reversal. As for the Bollinger Bands, the price moved out of the lower band, therefore a strong downward trend continuation could be expected. In conclusion, we think market will be bearish as the pair is eyeing a test of the 1.3195 support. The next target on the downside aligns at 1.3106.

Resistance: 1.3370, 1.3514, 1.3607

Support: 1.3195, 1.3106


USDCAD (4- Hour Chart)

The pair USD/CAD advanced amid falling oil prices on Friday, rebounding back from daily lows that touched earlier in the session. The pair saw some buying and touched a daily top in mid European session, but then dropped to below 1.275 level amid dismal NFP report. USD/CAD now climbs towards 1.284 area and stays in positive territory, currently rising 0.22% on a daily basis. At the time of writing, WTI crude oil is losing 0.54% on a daily basis, as the OPEC+ decided to follow through on their plan to increase production by 400kb/d in January. The bearish news from oil market weighed on the commodity-linked loonie and pushed USD/CAD higher. In Canada, the Employment Change showed that the economy added 153.7K new jobs for November, which is a lot better than economists’ expectations of 35K.

For technical aspect, RSI indicator 57 figures as of writing, suggesting that the upside appears more favored as the RSI sits above the midline. As for the Bollinger Bands, the price rose sharply towards the upper band, therefore the bullish momentum could persist. In conclusion, we think market will be bullish as the pair is testing the 1.2849 resistance, and the next resistance sits at 1.2949.

Resistance: 1.2849, 1.2949

Support: 1.2714, 1.2645, 1.2493


Economic Data

Currency

Data

Time (GMT + 8)

Forecast

GBP

Construction PMI (Nov)

17:30

52.0

Market Focus

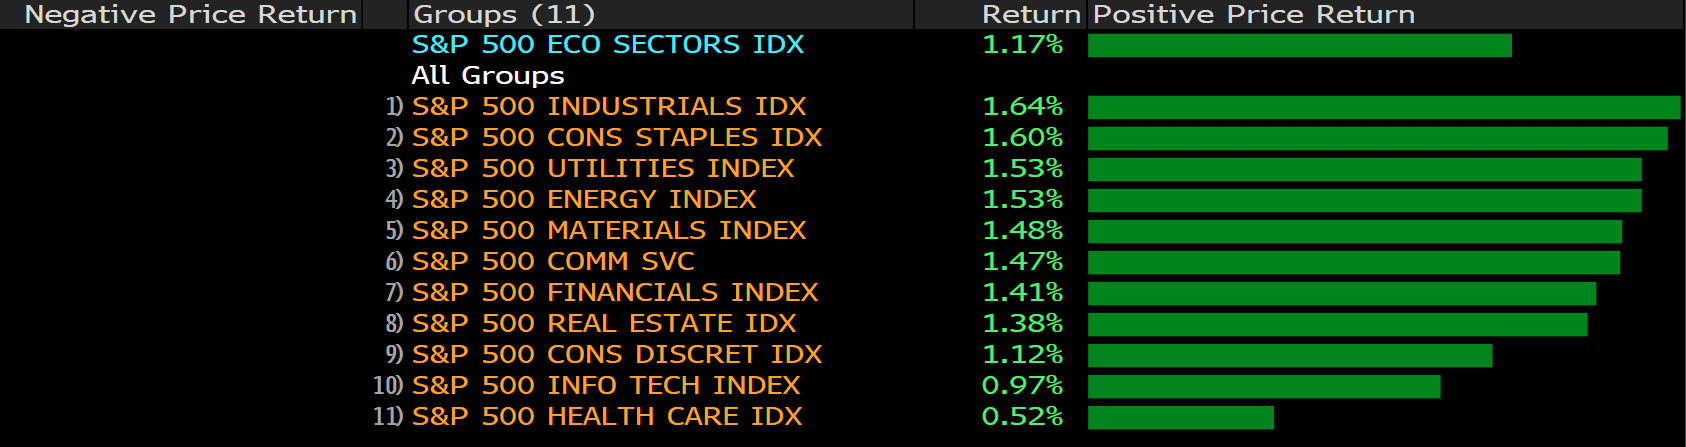
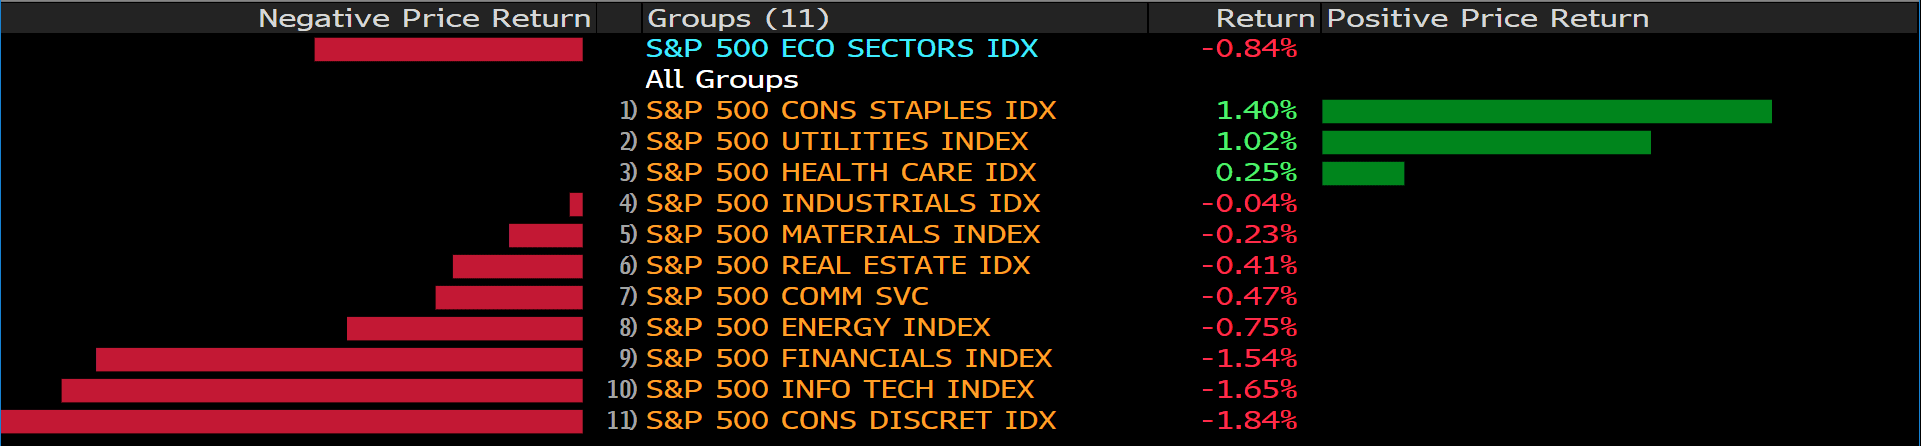
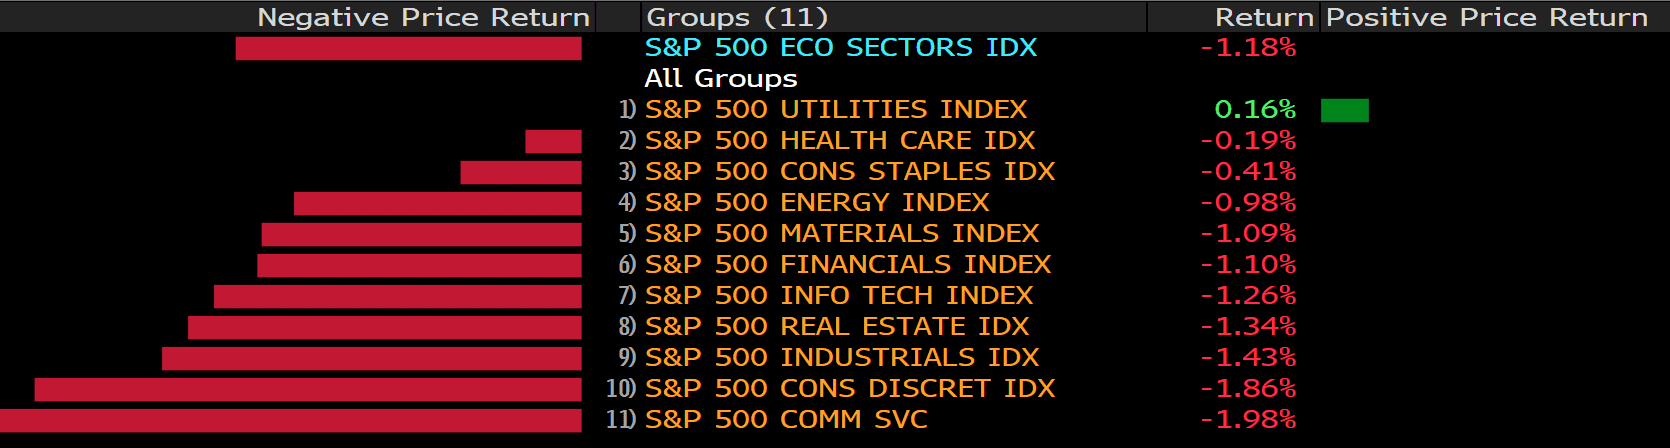
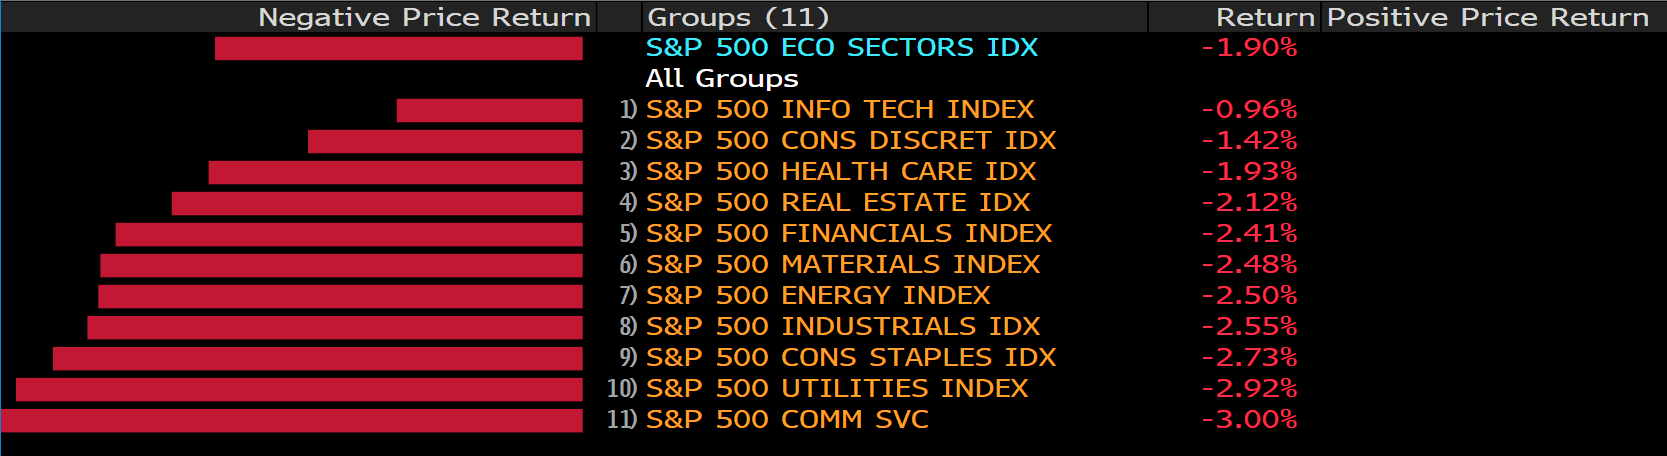
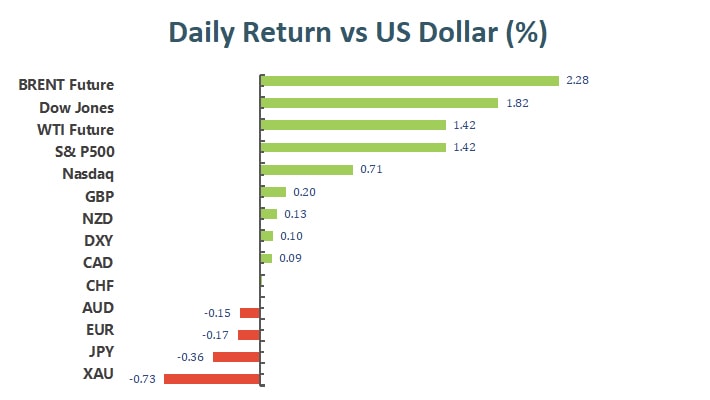
After falling sharply for two consecutive days, the three major stock indexes finally rebounded strongly on Thursday. Main reason comes from the cyclical stocks have recovered some of their recent declines. The Dow Jones Industrial Average rose 617.75 points to 34,639.79 points, the S&P 500 index rose 1.42% to 4,577.10. The Nasdaq Composite Index, which is dominated by technology stocks, rose 0.8% to 15,381.32 points. However, the market is still facing doubts about the latest variant of COVID-19, Omicron, and the risk that the US government may shut down. In terms of data, as of the week of November 27, a total of 222,000 people had applied for initial jobless claims, which was better than expected, implying labor shortages, and employers’ willingness to lay off employees is getting lower and lower.

As price levels rise, labor shortages, and supply chains are blocked, the Fed no longer uses the term “temporary” to describe inflation, suggesting that the Fed may accelerate the pace of interest rate hikes.

一張含有 文字 的圖片

自動產生的描述

In terms of stocks, after the Chinese aviation authority issued the 737 MAX airworthiness directive, Boeing rose 3.5%, which will pave the way for the aircraft to resume service in China. Kroger Co rose 9.9% after the retailer raised its full-year sales and profit forecasts due to continued demand for groceries. In addition, Okta’s encouraging earnings increased by 11.66%, and retail company Duluth Holdings also rose 18.40% due to its outstanding revenue.


Main Pairs Movement:

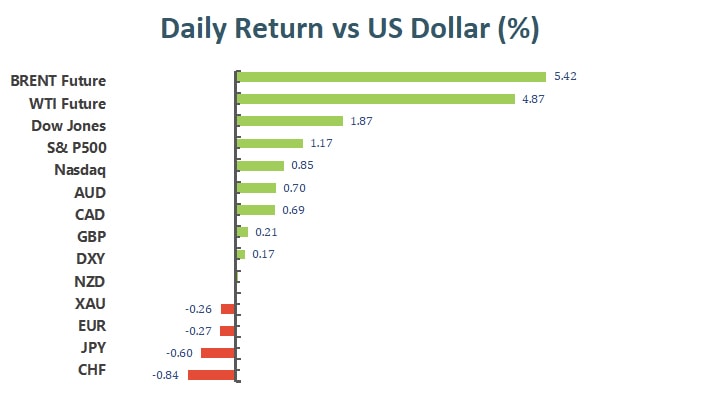
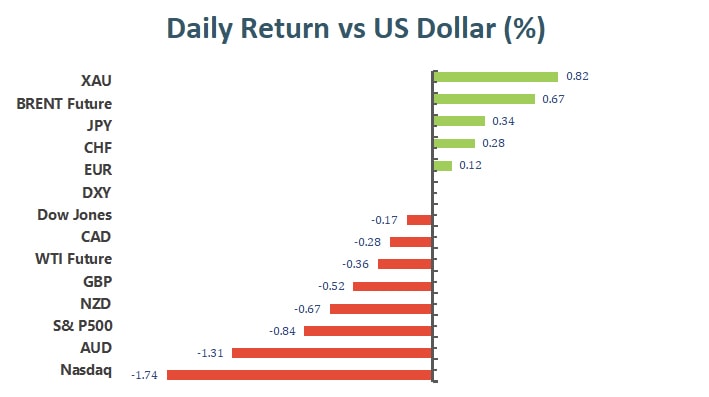
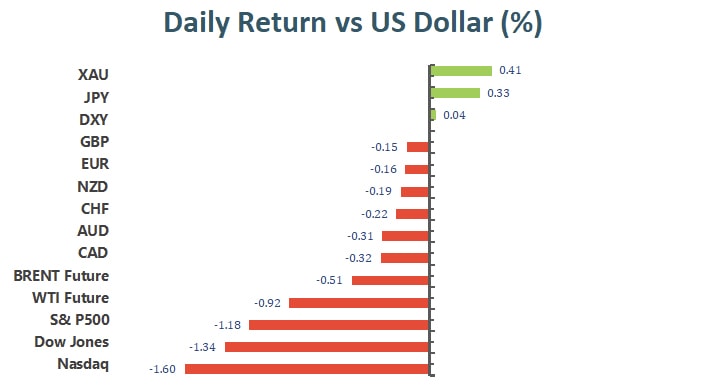
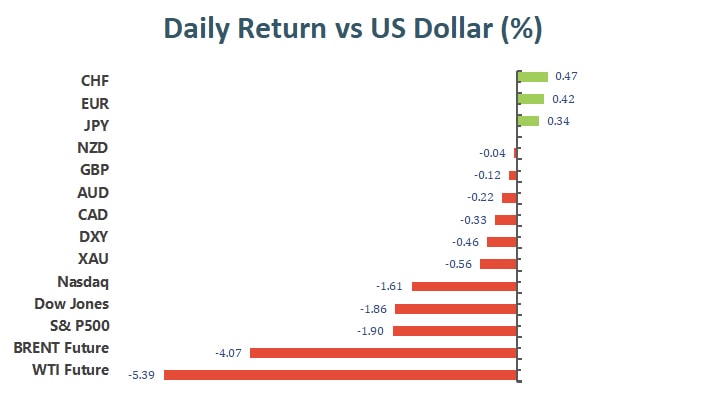
The U.S. dollar gained some momentum on Thursday, thanks to optimistic data and the rise in the US government bond yields, putting concerns on hold for the time being. In addition, there is news that the Fed may need to reduce the scale of asset purchases faster than expected. Due to the virus, vaccines and financial support, inflation is rising faster than expected. On the other hand, ECB policymaker Fabio Panetta stated that inflation and the new pandemic wave are endangering the EU’s early recovery, although earlier this week he pointed out that there is no need to tighten monetary policy to control inflation because all this is “temporary”. Last but not least, the United States will release a Nonfarm Payrolls report on Friday, and investors should pay close attention.

The EUR/USD continued to stay above the 1.13000 level, but fell for two consecutive trading days. Basically, the currency pair is still in a downward trend. If the European Central Bank maintains a loose monetary policy, it will be difficult for the euro to rebound. After testing the 1.32210 level on Tuesday, the GBP/USD is currently hovering around 1.1330, but like the euro, it is in a weak and sharp downward trend, but it rose by 0.17% on Thursday.

Gold fell to a new one-month low of 1,761.87 and rebounded moderately before the close. Crude oil prices fell to a new low in several months but rebounded. WTI is currently trading at $66.10 per barrel.


Technical Analysis:

EURUSD (4- Hour Chart)

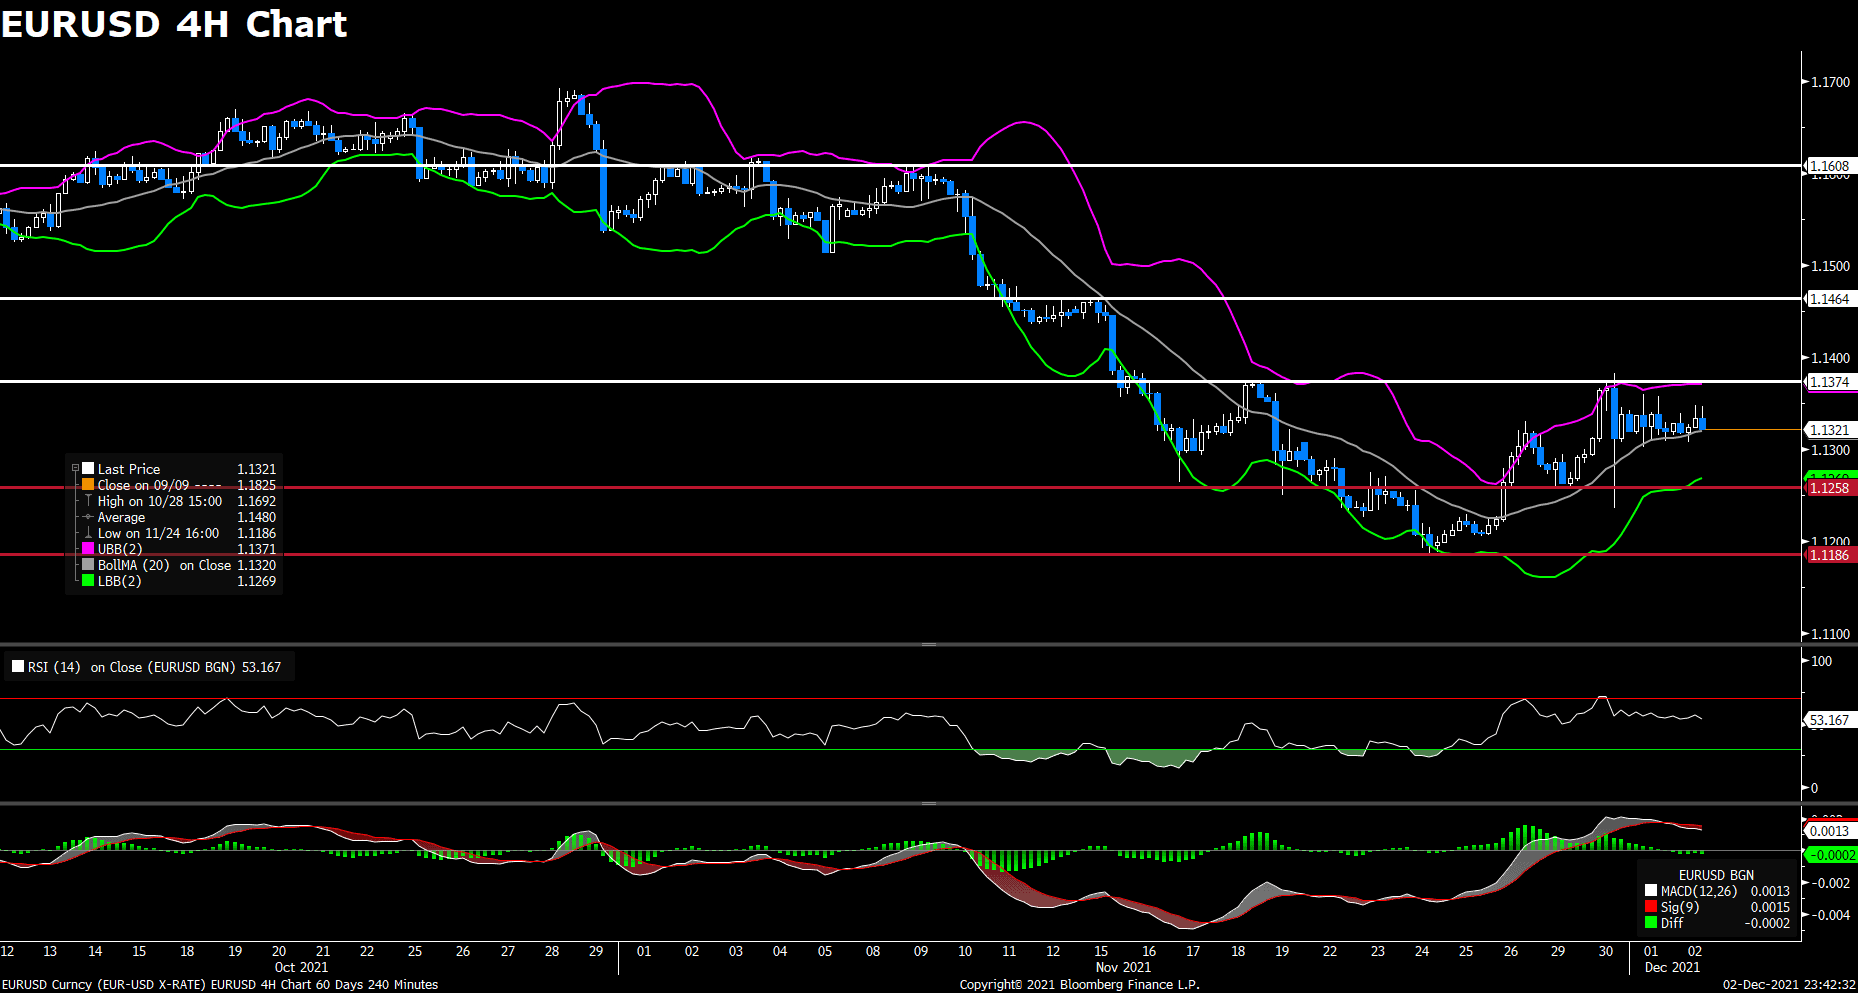
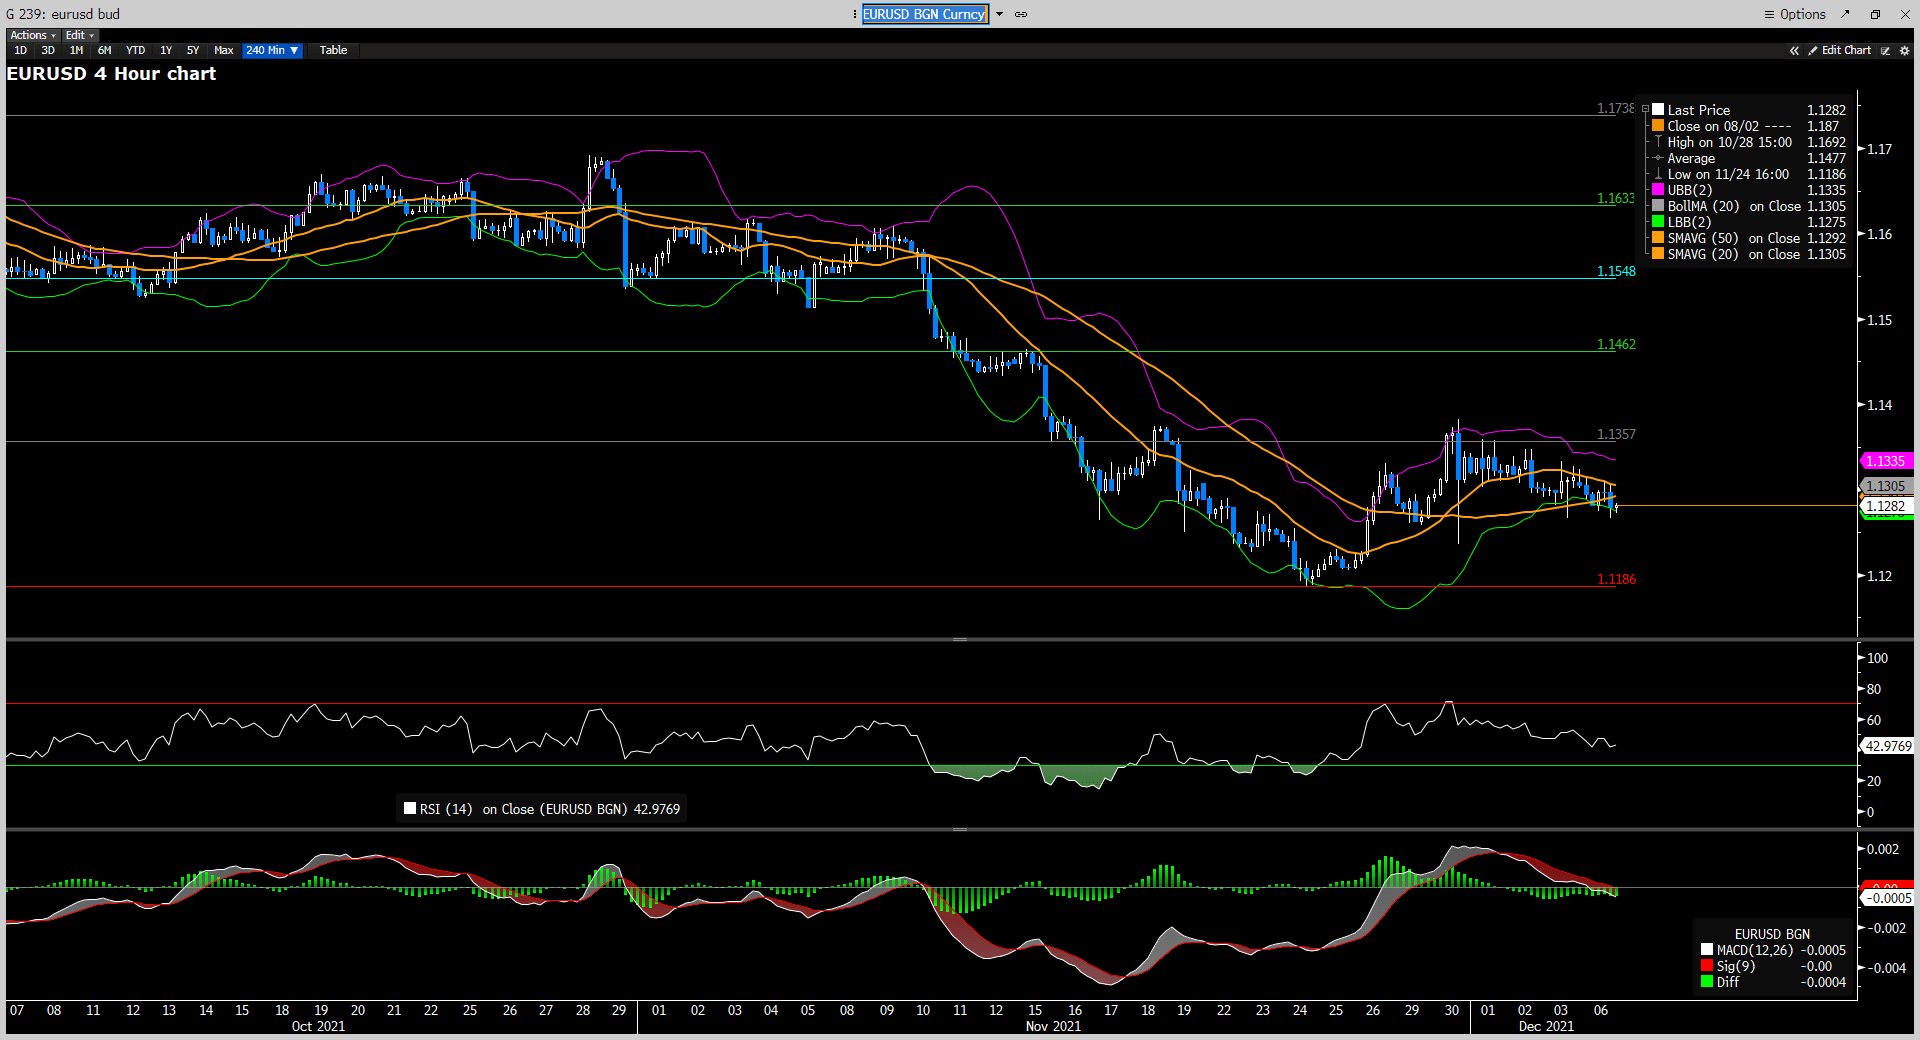
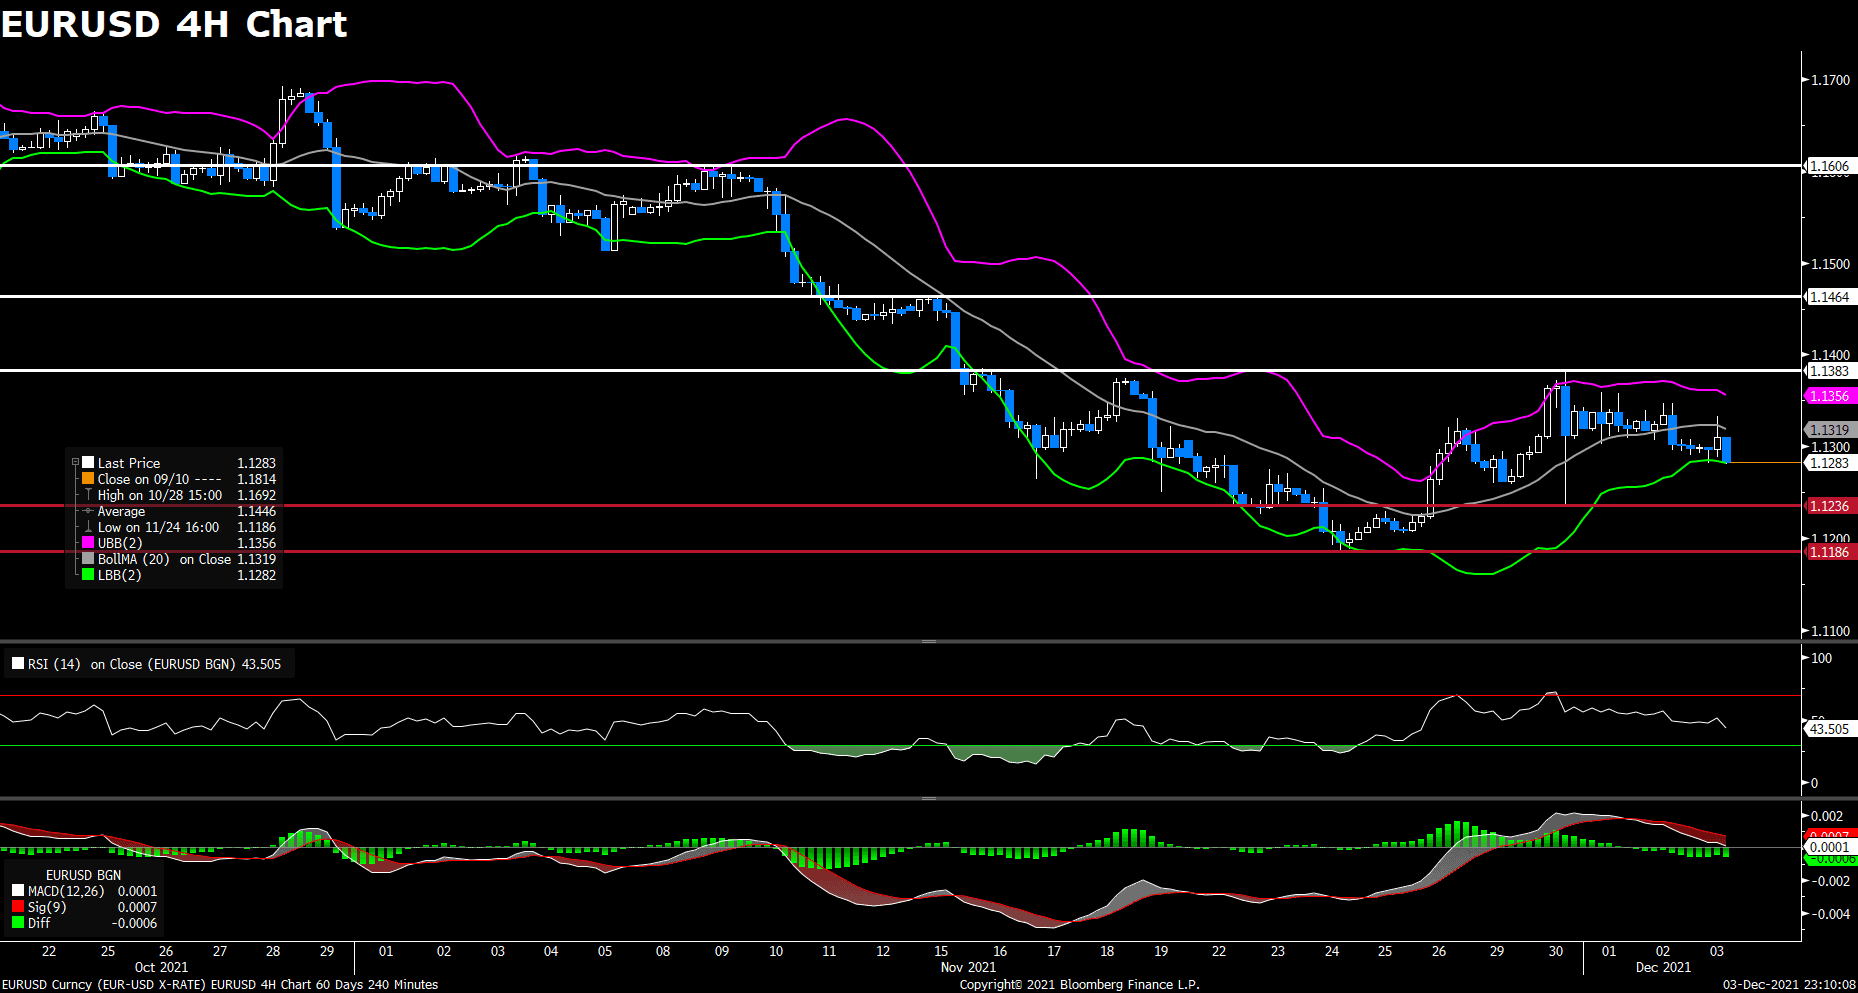
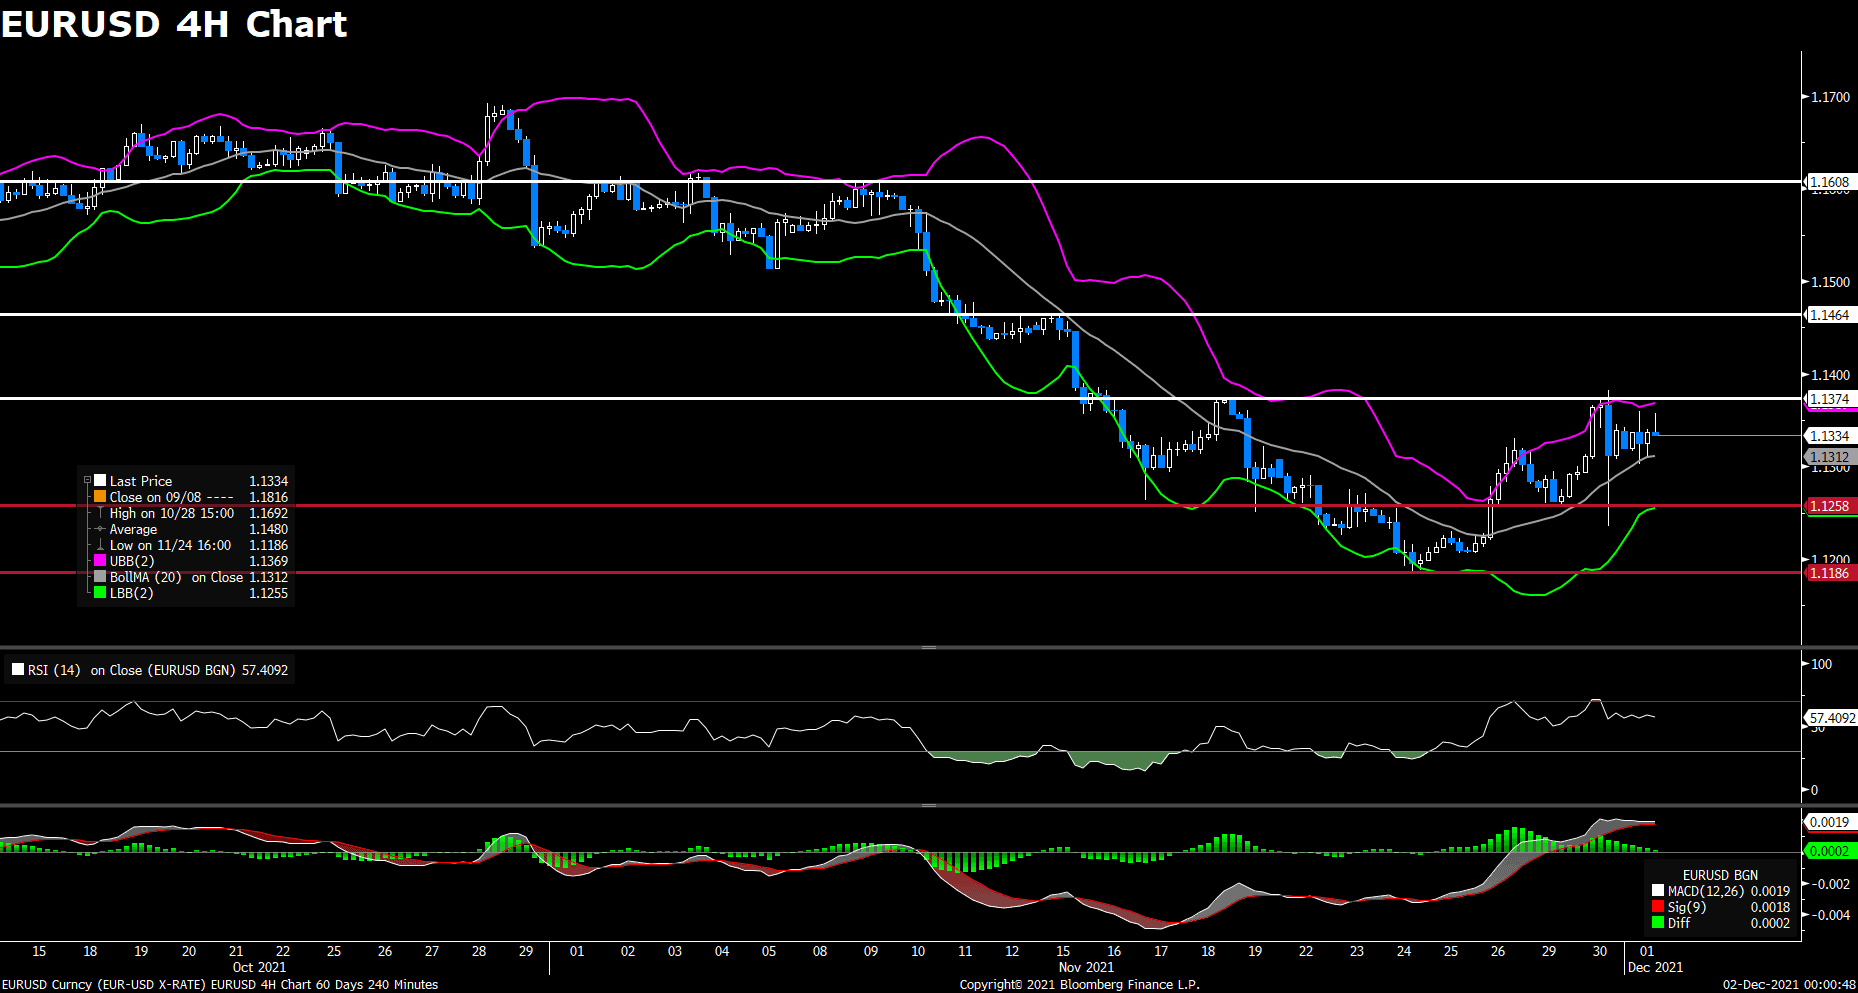
After previous day’s tepid slide to 1.130 level, the pair EUR/USD regained upside traction and rebounded above 1.133 area on Thursday. The pair was trading higher before pulling back to a daily low in early European session. During the American session, the pair saw fresh buying and continued to climb higher. The renewed US dollar weakness lend support to EUR/USD, which currently rising 0.02% on a daily basis. For the greenback, investors seems to have already digested Powell’s hawkish testimony on Wednesday, as the DXY index drops 0.15% despite a further strong US macro data. The Weekly Initial Jobless Claims showed a better-than-expected reading with 222K, but failed to support the greenback. In Europe, October’s Unemployment Rate in the euro area eased to 7.3%.

For technical aspect, RSI indicator 54 figures as of writing, suggesting tepid bull movement ahead. But looking at the MACD indicator, the MACD is now sitting below the signal line, which means a downward trend for the pair. As for the Bollinger Bands, the price dropping slowly from the upper band to moving average, therefore the bearish traction could persist for a while. In conclusion, we think market will be slightly bearish as long as the 1.1374 resistance line holds.

Resistance: 1.1374, 1.1464, 1.1608

Support: 1.1258, 1.1186


GBPUSD (4- Hour Chart)

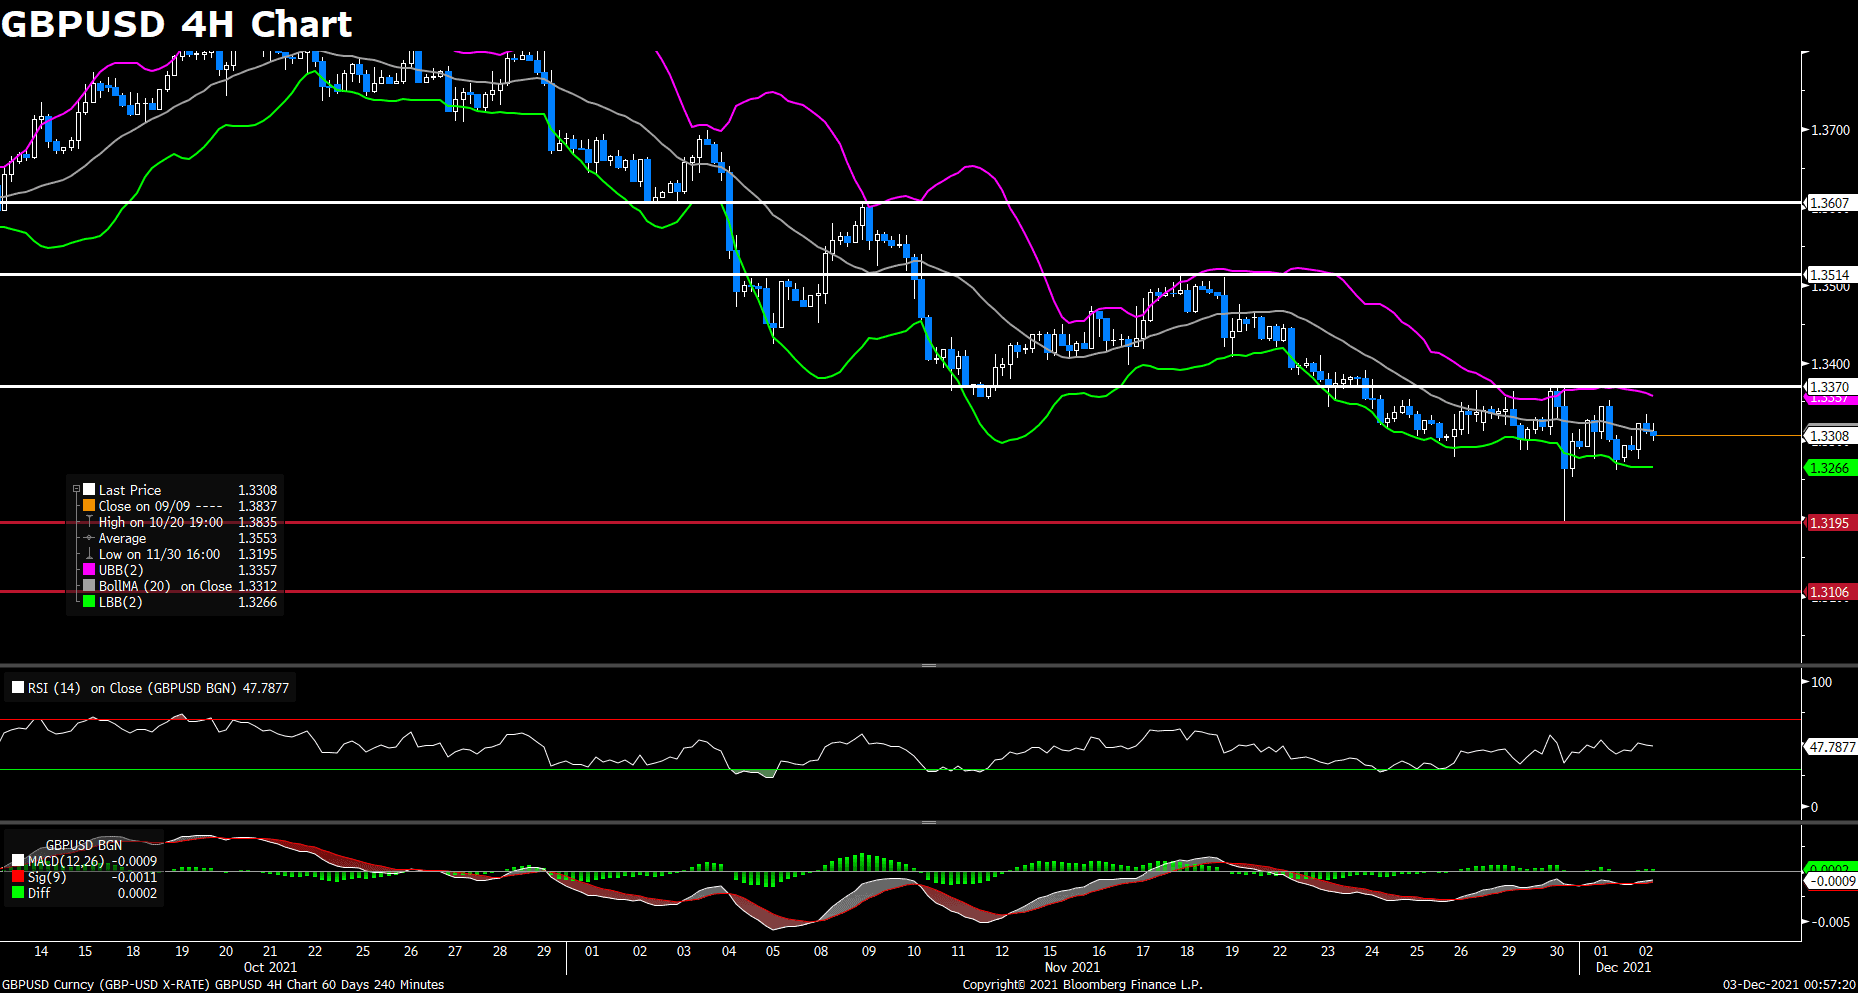
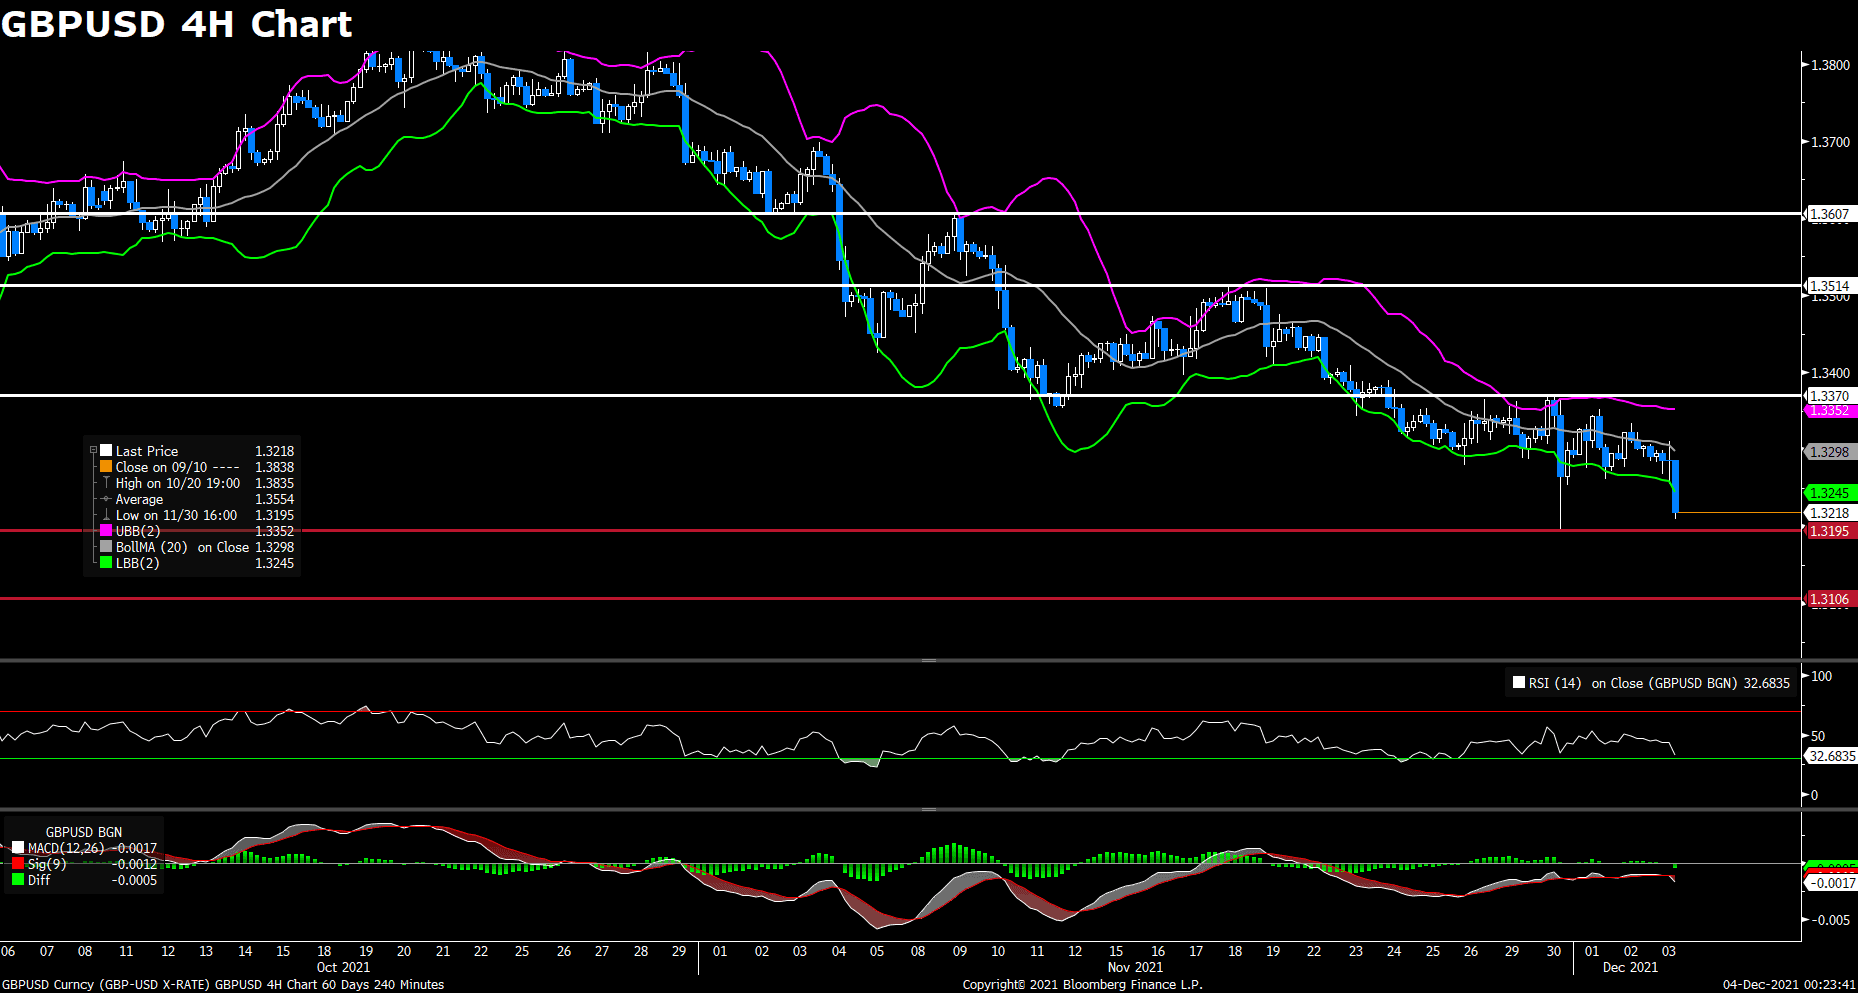
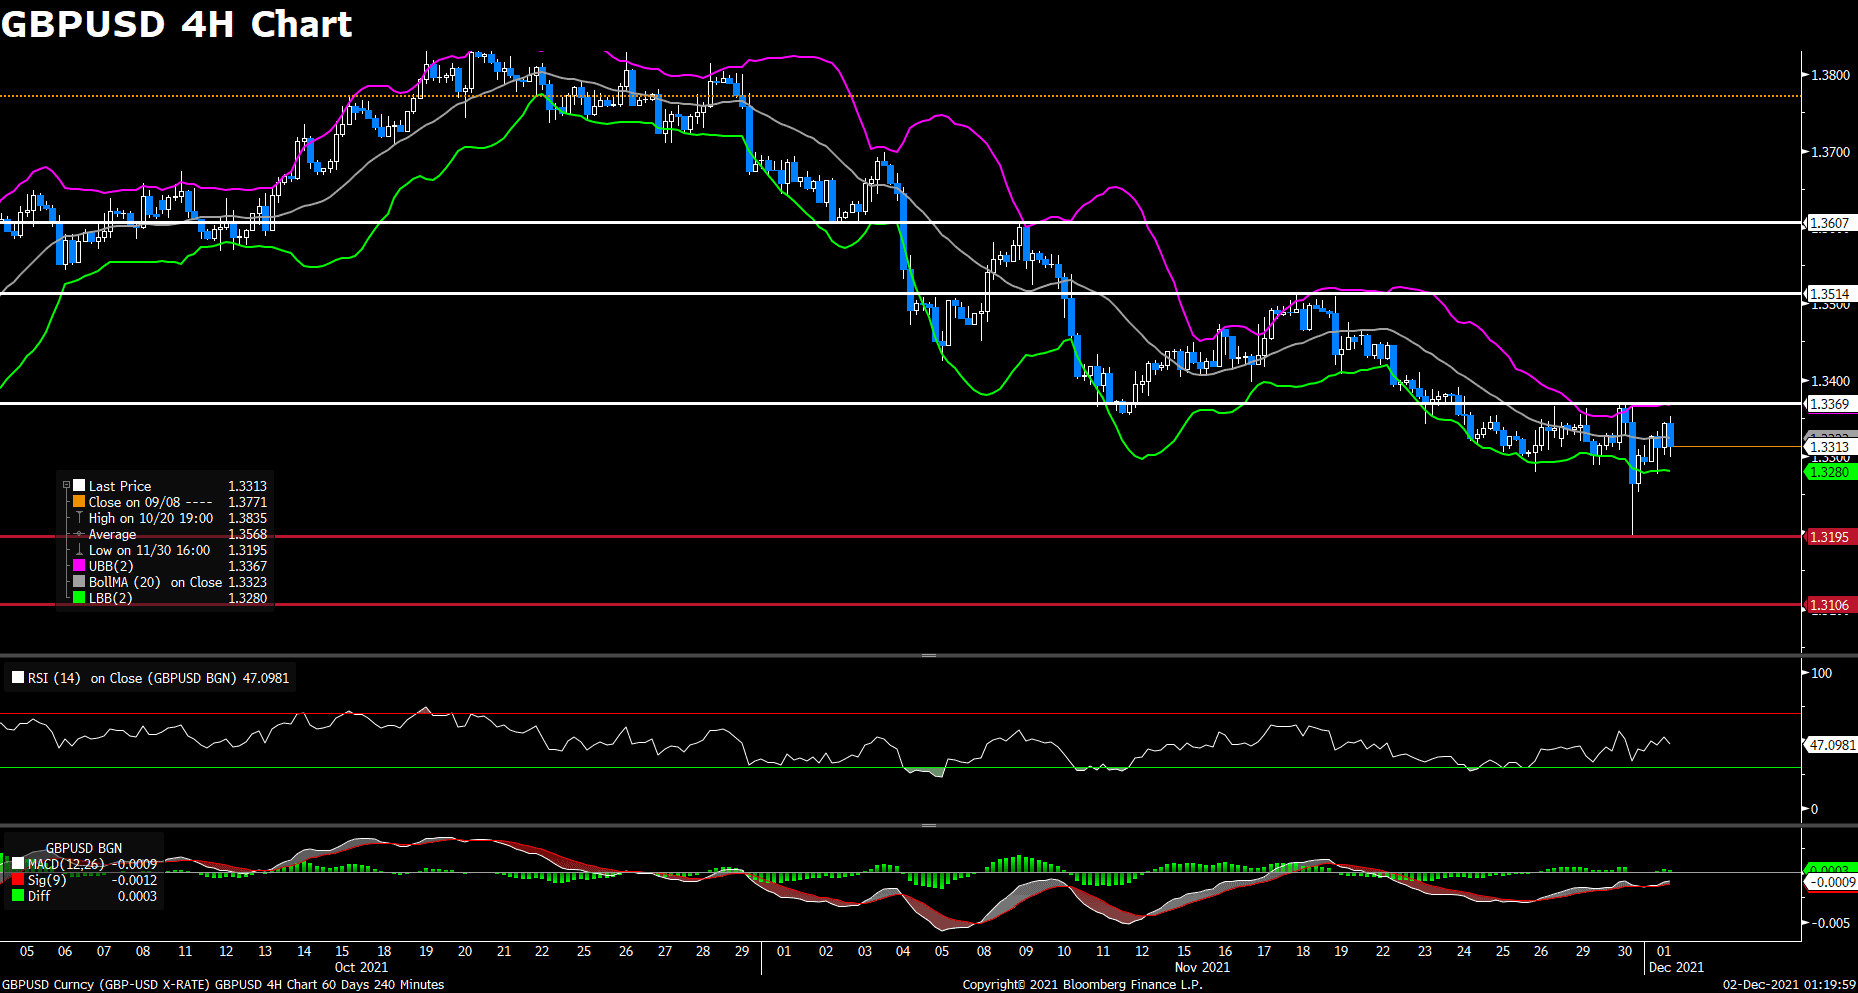
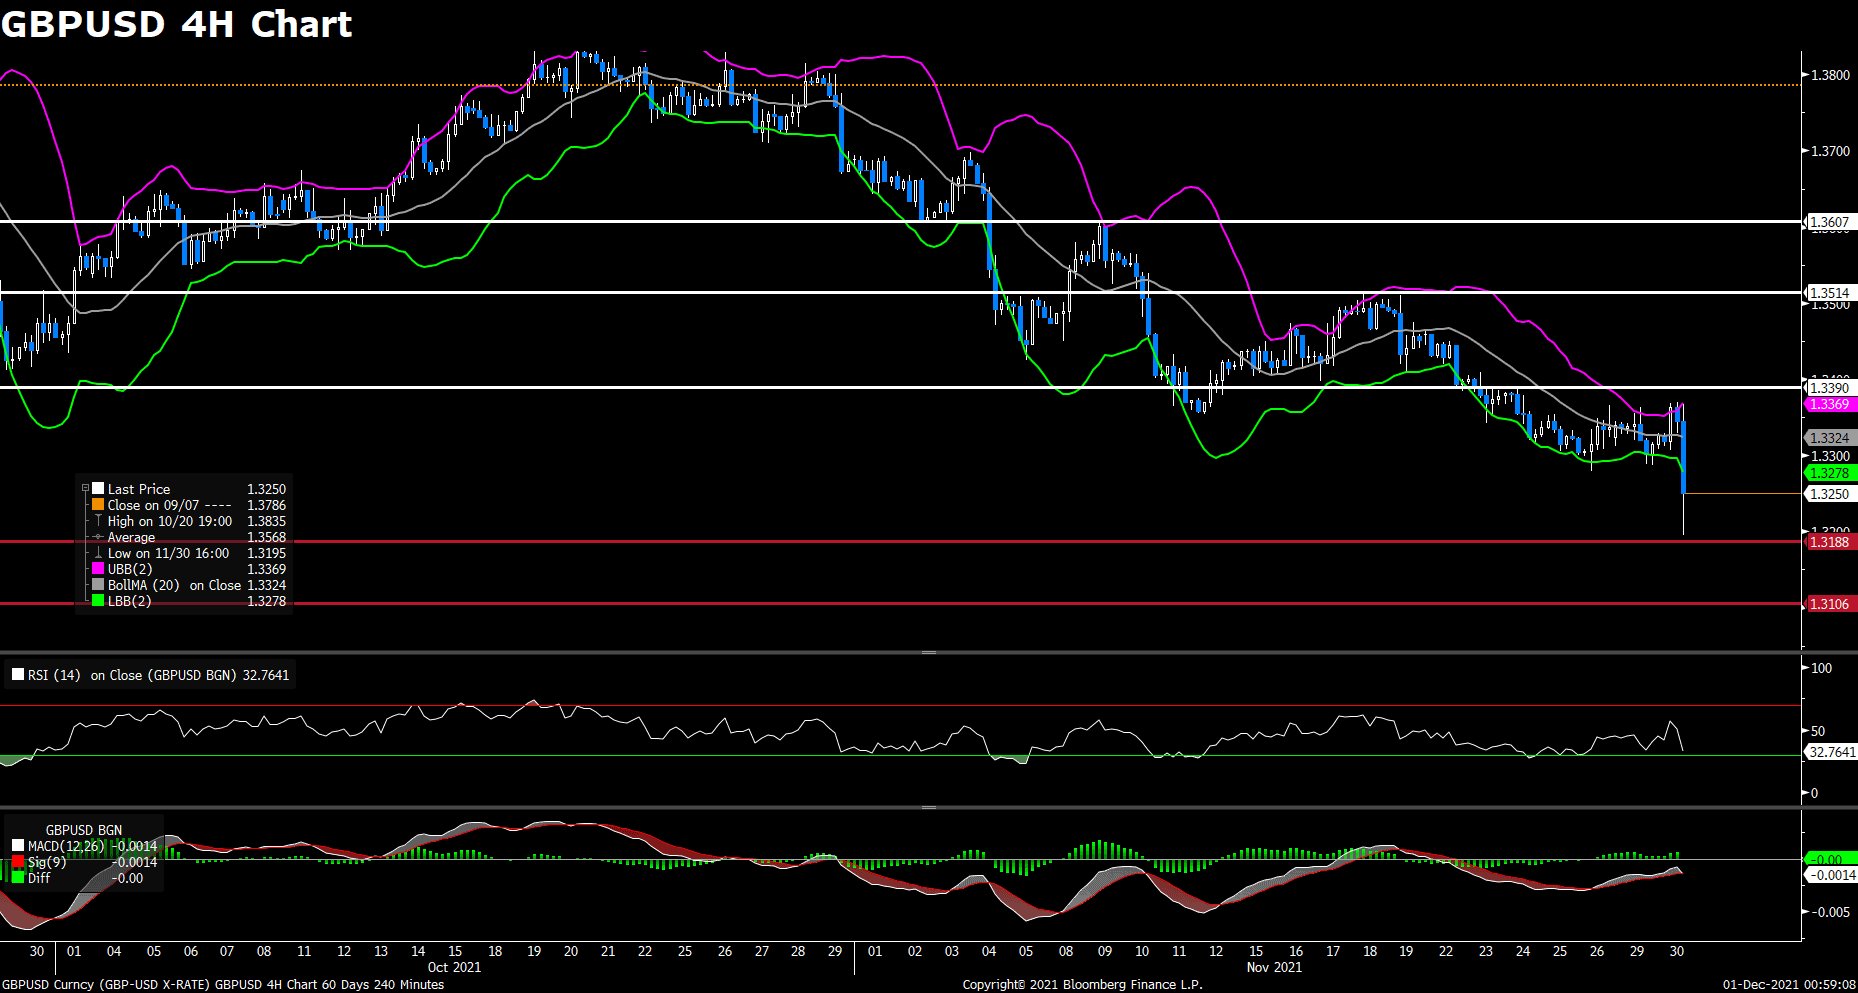
Following the rebound from the lowest level since December 2020 under 1.320 level, the pair GBP/USD hold steady above 1.330 area amid mixed market sentiment on Thursday. The pair reached a daily top above 1.33 during European session, but it has pulled back and surrendered some of its intraday gains since then. At the time of writing, the cable stays in positive territory with a 0.25% gain for the day. The weaker US dollar across the board acted as a tailwind for the cable, as concerns about new Omicron variant seems to ease after WHO official said that some of the early indications showed that most cases are mild. Therefore market mood moderately improved and favored the risk-sensitive Sterling. On top of that, Brexit woes still remained as there are real gaps between the UK and European Union in their disagreement over the Northern Ireland Protocol.

For technical aspect, RSI indicator 48 figures as of writing, reflecting the pair’s indecisiveness in the near term. As for the Bollinger Bands, the price is falling from the moving average, indicating that the pair may experience some bearish momentum. In conclusion, we think market will be slightly bearish as long as the 1.3370 resistance line holds. Technical indicators for cable have lost directional strength, bears may have a chance if the pair break below the next support at 1.3195.

Resistance: 1.3370, 1.3514, 1.3607

Support: 1.3195, 1.3106


USDCAD (4- Hour Chart)

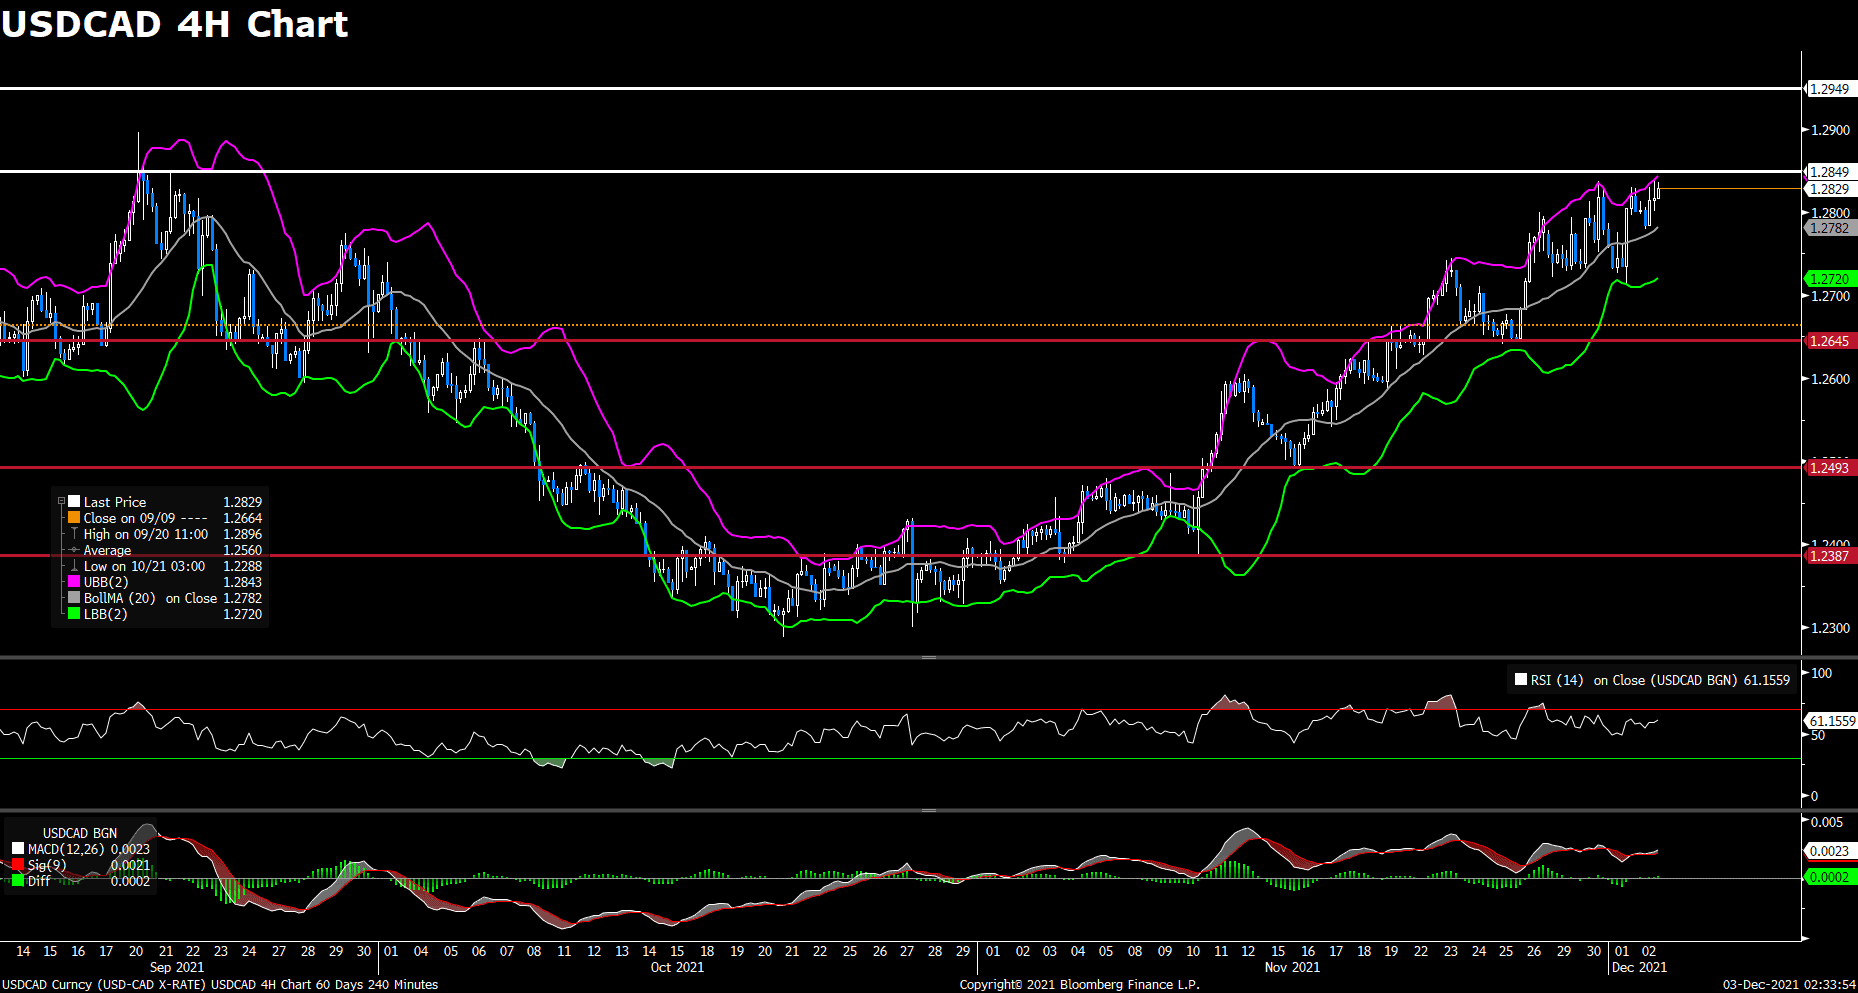
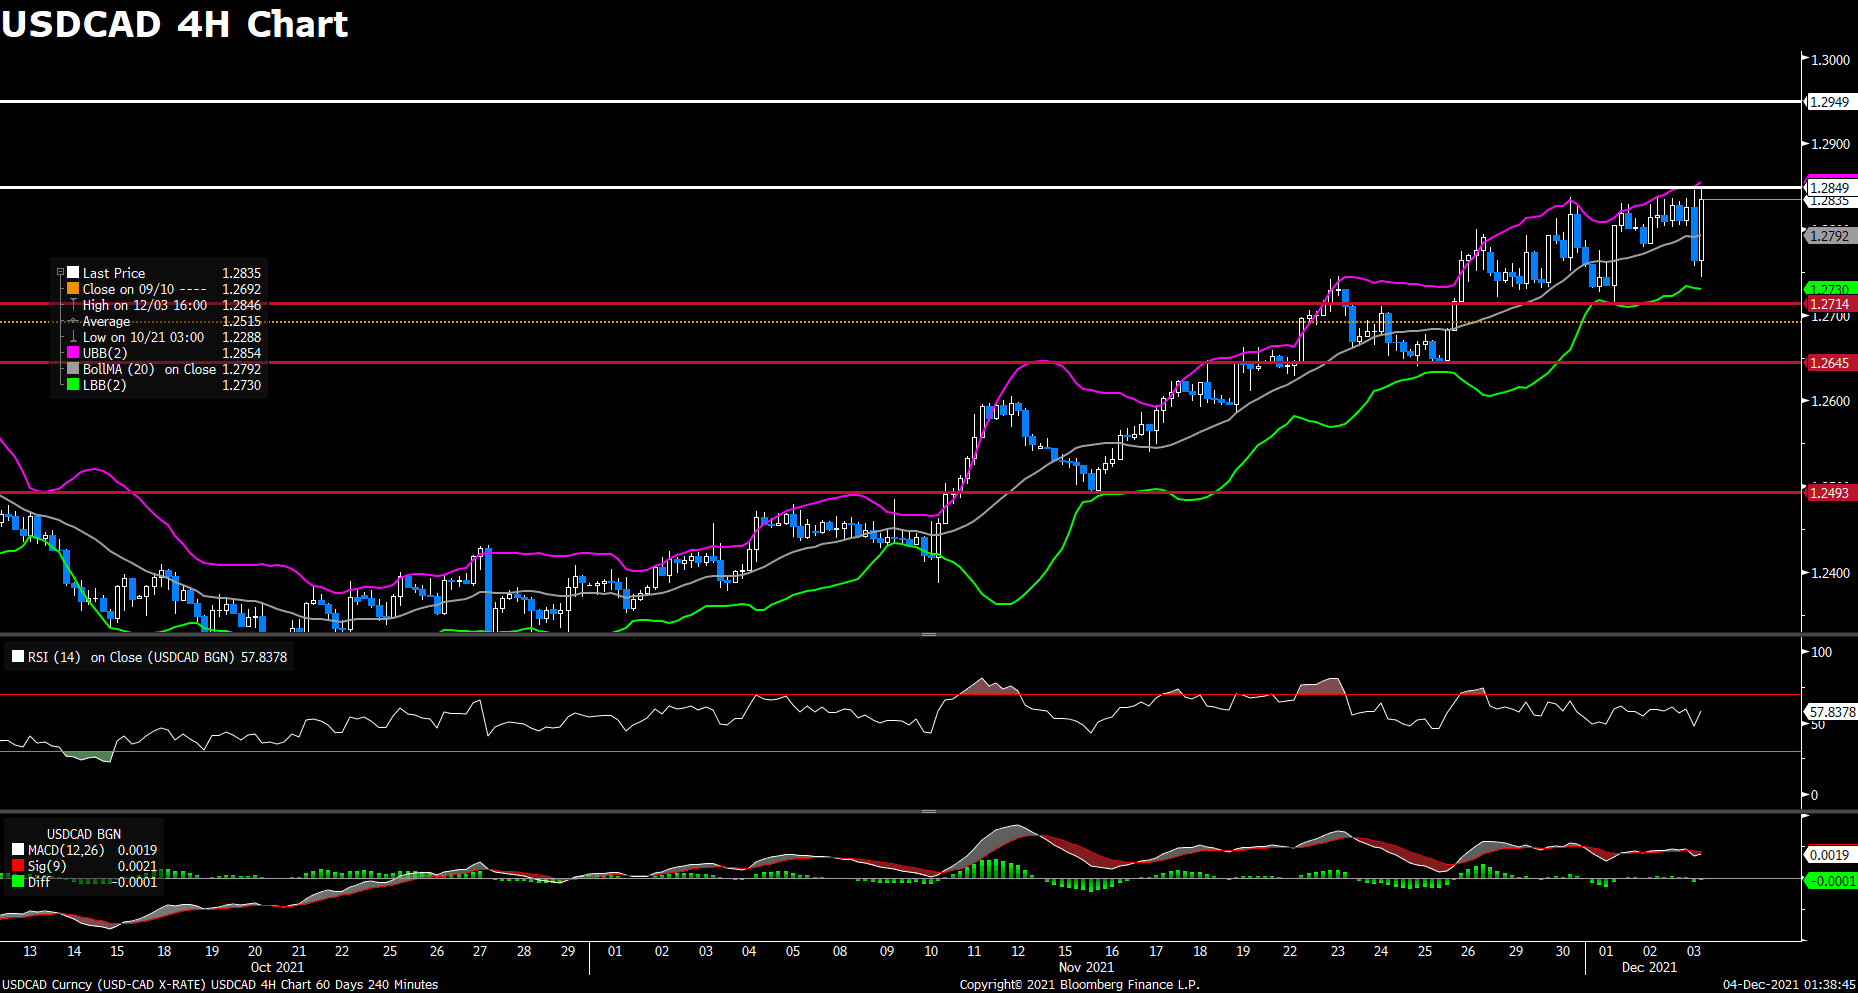
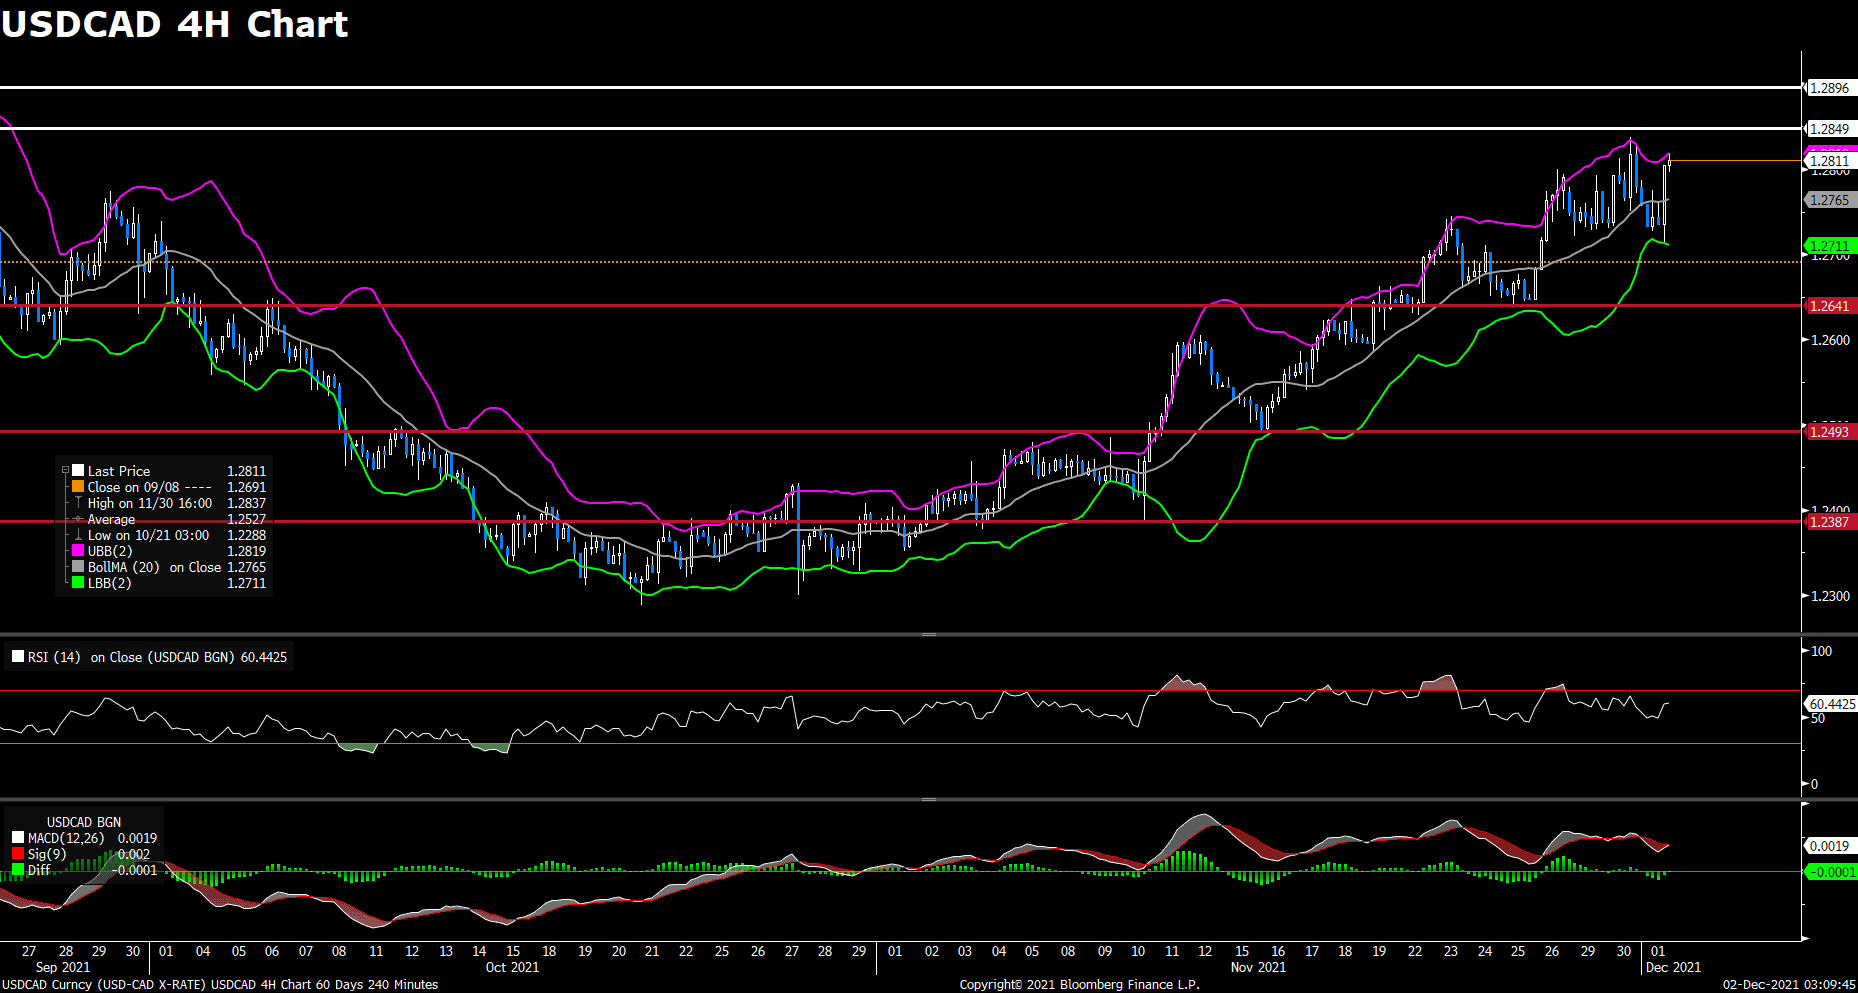
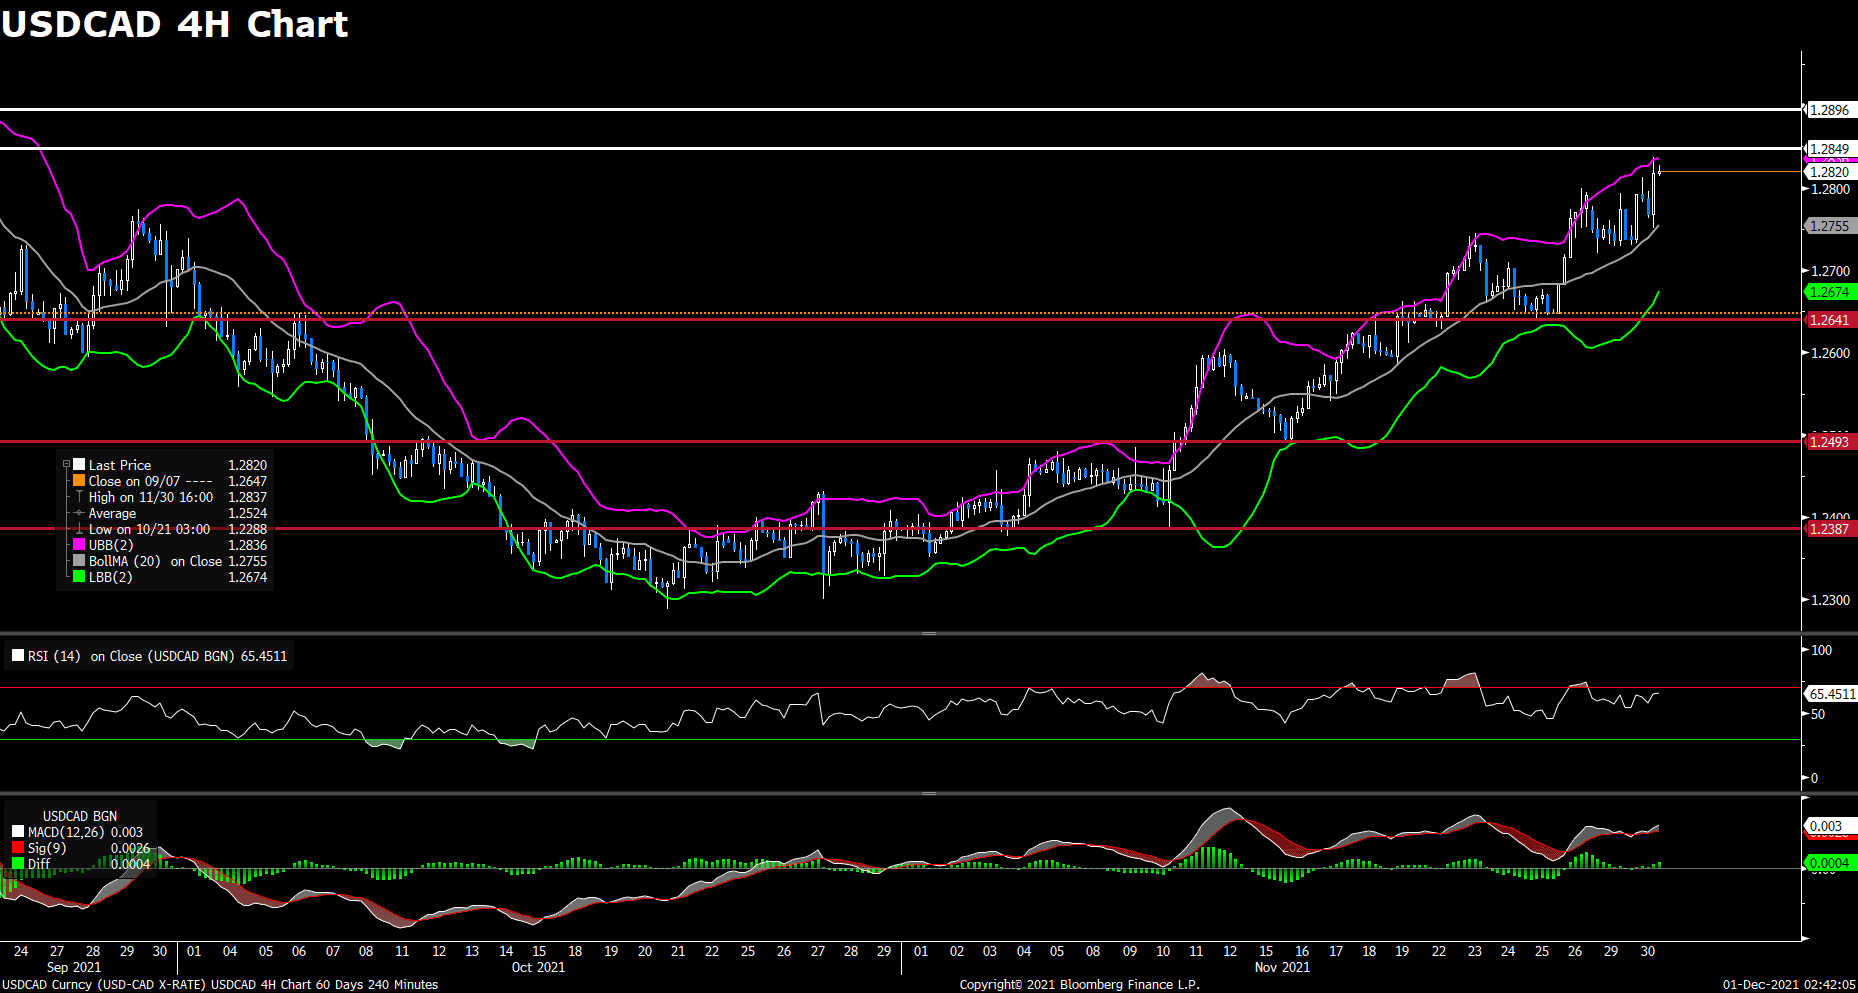
The pair USD/CAD advanced amid falling oil prices on Thursday, continuing its previous day’s rally to 1.283 area. The pair was trading lower during Asian session, but then rebounded moderately to a daily top in early American session. USD/CAD now remains steady under the 1.283 area amid improving risk appetite, currently rising 0.11% on a daily basis. The rebound witnessed in US dollar pushed the pair higher, as more Fed policymakers now favoring a faster taper and added to the hawkish list. Meanwhile, WTI Crude Oil posts a 0.01% loss today after OPEC+ agreed to go ahead with its planned 400K barrel per day output hike in January, acting as a headwind for the commodity-linked loonie.

For technical aspect, RSI indicator 61 figures as of writing, suggesting that the upside appears more favored as the RSI still above the midline. Looking at the MACD indicator, a golden cross just formed on the histogram, which indicated upward trend for the pair. As for the Bollinger Bands, the price is rising from the moving average to upper band, therefore the upside traction could persist. In conclusion, we think market will be bullish as the pair is eyeing a test of the 1.2849 resistance, and the next resistance sits at 1.2949.

Resistance: 1.2849, 1.2949

Support: 1.2645, 1.2493, 1.2387


Economic Data

Currency

Data

Time (GMT + 8)

Forecast

EUR

ECB President Lagarde Speaks

16:30

GBP

Composite PMI (Nov)

17:30

57.7

GBP

Services PMI (Nov)

17:30

58.6

USD

Nonfarm Payrolls (Nov)

21:30

550K

USD

Unemployment Rate (Nov)

21:30

4.5%

CAD

Employment Change (Nov)

21:30

35.0K

USD

ISM Non-Manufacturing PMI (Nov)

23:00

65.0

VT Markets Modification of MVRS Symbol name

Dear Client,

Please kindly note that the ticker change is being delayed until the first quarter of 2022 by Facebook CEO Mark Zuckerberg.

The Shares CFDs Meta Inc. (MVRS) will change its corporate name back to Facebook Inc. (FB) on our platform, effective from December 6th, 2021.

Please contact [email protected] if you would like more information regarding to this.

VT Markets The Adjustment Of Weekly Dividend Notification

Dear Client,

Warmly reminds you that the component stocks in the stock index spot generate dividends. When dividends are distributed, VT Markets will make dividends and deductions for the clients who hold the trading products after the close of the day before the ex-dividend date.

Indices dividends will not be paid/charged as an inclusion along with the swap component. It will be executed separately through a balance statement directly to your trading account, the comment for which will be in the following format “Div & Product Name & Net Volume ” .

Please note the specific adjustments as follows:

Note: The above data is for reference only, the actual execution data may be changed, please refer to the MT4/MT5 software for details.

If you’d like more information, please don’t hesitate to contact [email protected].

Market Focus

US equities underwent their worst back-to-back collapse since October 2020 as Fed Chair Jerome Powell reiterated his pivot to inflation vigilance and the omicron variant continued to spread, with the U.S. confirming its first case on Wednesday. In a very volatile session, the S&P 500 erased gains after climbing almost 2% in the first half of the Wall Street hours. Dow Jones slid 1.34% to 34022.07, and Nasdaq Composite plummeted 1.83% to 15,254.05. Airlines, cruise operators and hotels also slumped. Investors flocked to the relative safety of Treasuries, with the yield on the 10-year note down to 1.404%.

一張含有 文字 的圖片

自動產生的描述

On the market front, professional traders bailing from stocks as anxiety over the omicron variant and monetary policy roil markets. Hedge funds have gone risk-off in a major way just as the S&P 500 endured a massive two-day pullback. Net leverage, a measure of industry risk appetite that takes into account long versus short positions, fell to a one-year low this week, according to data compiled by Goldman Sachs’ prime brokerage.

The move is in contrast to retail traders, who renewed their manic dip buying after Tuesday’s rout, pushing stocks higher by almost 2% earlier in Wednesday’s session. Then Jerome Powell reinforced his message that the Federal Reserve would keep inflation in check and officials confirmed the first case of the omicron variant in the U.S. That sparked an afternoon selloff that left the S&P 500 with its biggest reversal since April 2020.

Few corners of the market were spared, as small caps gave up a 2.5% surge to end lower by more than 2%. Bitcoin dropped below $57,000, oil hit $65 a barrel and Treasuries rallied on demand for safety. The S&P 500 is now down 3.1% in two sessions and more than 4% from its last record on Nov. 18.


Main Pairs Movement:

Unlike the dismal stock markets, fears seem to cool down a bit for forex on Wednesday, resulting in major pairs holding into familiar levels. The greenback ended the day mixed, firmer against commodity-linked peers but down against other safe-haven currencies.

The cautious optimism came from the World Health Organization, as it said that current vaccines could still offer protection against the new Omicron coronavirus variant, preventing severe illness. Also, the WHO reported that so far, the new strain seems to be causing milder symptoms and illness. However, risk of Fed’s earlier taper remains, as Chief Powell said they need to remove the word “transitory” while describing the U.S. inflation issue.

The EUR/USD pair trades around 1.1320, while GBP/USD stands at 1.3280, both at risk of falling further. The AUD/USD pair trades at around 0.7110, while USD/CAD is pressuring daily highs in the 1.2830 price zone. USD/JPY and USD/CHF posted mild gains, up 0.15% and 0.21% respectively.

Gold remains under pressure, currently trading at $1,780 a troy ounce. Crude oil prices edged lower, with WTI now at around $65.75 a barrel, and Brent at $68.50.


Technical Analysis:

EURUSD (4- Hour Chart)

After dropping to a weekly low around 1.124 area, the pair EUR/USD saw some buying and rebounded slightly on Wednesday. The pair was flirting with 1.133 area most of the day, now sitting in negative territory and holding above 1.132 level. The renewed strength witnessed in the greenback weighed on EUR/USD, which currently losing 0.06% on a daily basis. Stronger US dollar across the board today dragged the pair lower, as the DXY index rose 0.02% amid upbeat market sentiment. The US ADP Employment Change for November showed that private payrolls rose by 534K, which is more than market’s expectations. In Europe, concerns about the new omicron variant and the likeliness of lockdown in many countries may dampen the near-term outlook for the European currency and cap the upside for the EUR/USD pair.

For technical aspect, RSI indicator 59 figures as of writing, suggesting that the upside appears more favored as the RSI still above the midline. As for the Bollinger Bands, the price is consolidating between the moving average and upper band, therefore the bullish traction could persist for a while. In conclusion, we think market will be slightly bullish as the pair is heading to re-test the 1.1374 resistance. A break above that level would target 1.1464.

Resistance: 1.1374, 1.1464, 1.1608

Support: 1.1258, 1.1186


GBPUSD (4- Hour Chart)

The pair GBP/USD edged higher on Wednesday, ending its previous slide to the lowest level since December 2020. The pair stayed steady to the north of the 1.330 level for most of the day and touched a daily top in American session. At the time of writing, the cable stays in positive territory with a 0.08% gain for the day. The recovery in sentiment for global equity and commodity markets acted as a tailwind for the British pound, which is one of the risk-sensitive currencies. On the economic data side, the UK Manufacturing PMI came at 58.1 for November, which is slightly lower than estimates but did little impact to the cable. Meanwhile during the testimony earlier in the session, Fed Chair Jerome Powell also reiterates that it is appropriate to consider a faster QE taper before the House Financial Services Committee.

For technical aspect, RSI indicator 46 figures as of writing, suggesting that sellers remain in control of the pair’s action in the near term. As for the Bollinger Bands, the price is sitting between the moving average and lower band, therefore the downside momentum should be stronger. In conclusion, we think market will be bearish as long as the 1.3369 resistance line holds. The hawkish tone from Powell could limit any further gains for the cable.

Resistance: 1.3369, 1.3514, 1.3607

Support: 1.3195, 1.3106


USDCAD (4- Hour Chart)

After previous day’s rally to a two-month high near 1.284 level, the pair USD/CAD preserved its upside traction and edged higher on Wednesday. The pair was surrounded by bearish momentum during Asian session, but then rebounded back above 1.278 area amid renewed US dollar strength. USD/CAD now continues to climb higher, currently rising 0.26% on a daily basis. Rising expectations for a Fed rate hike continue to lend support to the greenback and USD/CAD, as Powell said that Fed will have a discussion about accelerating taper by a few months at their next meeting. On top of that, the pullback in crude oil prices from earlier session peaks weighed on the commodity-linked loonie and pushed USD/CAD higher, as WTI oil dropping 1.43% for the day.

For technical aspect, RSI indicator 60 figures as of writing, suggesting that the upside appears more favored as the RSI still above the midline. Looking at the MACD indicator, a golden cross is forming on the histogram, which indicated upward trend for the pair. As for the Bollinger Bands, the price is from the moving average to upper band, therefore the upside traction could persist. In conclusion, we think market will be bullish as the pair is eyeing a test of the 1.2849 resistance.

Resistance: 1.2849, 1.2896

Support: 1.2641, 1.2493, 1.2387


Economic Data

Currency

Data

Time (GMT + 8)

Forecast

AUD

Retail Sales (MoM)

08:30

4.9%

USD

Initial Jobless Claims

21:30

240K

Market Focus

Stocks dropped on Tuesday as volatility resumed after a brief rebound earlier this week, with investors contemplating the impacts of a new coronavirus variant and new comments from Fed Chair Jerome Powell. Both the S&P 500 and Nasdaq declined, and the Dow Jones plummeted about 650 points, or 1.9%, intraday on Tuesday. Shares of airlines, cruise lines and lodging companies considered to be some of the most exposed to virus-related disruptions each sank in early trading to reverse Monday’s gains.

一張含有 文字 的圖片

自動產生的描述

Powell’s appetite for a faster tapering of Federal Reserve stimulus is casting him in role financial markets haven’t seen since 2018 hawk.

Stocks slid, short-term interest rates rose and VIX surged Tuesday after the central bank chairman warned that elevated inflation could justify ending asset purchases sooner than planned. Buffeted also by anxiety around the coronavirus, the S&P500 just endured its worst stretch of turbulence in more than a year.

For investors, an urgent question becomes whether Tuesday’s congressional testimony was a watershed moment for the monetary policies that have helped the S&P 500 effectively to double since Christmas 2018. That’s when Powell’s last big pivot occurred — the dismantling of interest-rate hikes that made the fourth quarter of that year one of the worst for equities ever.

“Not only is he speaking in a more hawkish tone, but he’s dropping major policy implications almost without regard to how the markets may take them,” said Max Gokhman, chief investment officer at AlphaTrAI. “All of the predictability he’s previously tried to cultivate in terms of taper and liftoff scheduling is in question.”


Main Pairs Movement:

The greenback initially dropped in the European trading hours, but soon rebounded during the US session to reach weekly highs against most of its major peers. The U-turn of the dollar derived from the two main concerns yesterday – the newest COVID variant and the Fed Chair Powell’s testimony.

The euro pair is of the best performers against the greenback, now trading at around 1.1340. Cable, however, plummeted to a fresh 2021 low of 1.3194. Safe havens posted gains on Tuesday, with USD/JPY dropped 0.33% and closed the day at 113.15, and USD/CHF plunged near 0.5% to a fresh 2-week low of 0.9158. Commodity-linked currencies are the worst. Aussie is last seen at 0.7123, down 0.11% comparing to its open price, and Loonie trades at 1.2780, even once jumped to 1.2837 intraday.

Gold plummeted after briefly advancing beyond 1,800, now trading at $1,775 a troy ounce. Crude oil prices also fell, with WTI at $66.70 a barrel, and Brent at $70.10.


Technical Analysis:

EURUSD (4- Hour Chart)

After retreating from a weekly high to under 1.128 level, the pair EUR/USD gained heavy upside traction and rebounded sharply on Tuesday. The pair continued to be surrounded by bullish momentum most of the day, touching the highest level since November 16. However, the rebound witnessed in US dollar weighed on the EUR/USD, which currently losing 0.08% on a daily basis. The concerns about new Omicron variant and rising uncertainty on the potential impact on the global economy drag the US bond yields lower, therefore keeping the greenback under pressure. In Europe, the Eurozone Consumer Price Index jumps by 4.9% in November, which is higher than market expectations. But the dovish ECB and rising Covid-19 cases might cap the upside for the pair.

For technical aspect, RSI indicator 49 figures as of writing, suggesting that the downside appears more favored as the RSI is dropping below the midline. Looking at the MACD indicator, a diminishing positive histogram also indicates that the pair may experience some downward trend. But for the Bollinger Bands, the price is falling from upper band, therefore a downward trend could be expected for the pair. In conclusion, we think market will be slightly bearish as the pair failed to break the long as the 1.1374 resistance, and a break below 1.1186 could open the road for additional losses.

Resistance: 1.1374, 1.1464, 1.1608

Support: 1.1263, 1.1186


GBPUSD (4- Hour Chart)

The pair GBP/USD declined on Monday, surrendering most of its intraday gains amid resurging US dollar. The pair was trading higher and touched a daily top near 1.337 in mid European session, but started to see heavy selling after Fed Chair Jerome Powell’s speech. At the time of writing, the cable stays in negative territory with a 0.52% loss for the day. During the speech, Powell said that it would be appropriate to consider wrapping up the bank’s QE taper a few months sooner. The Fed would also discuss speeding the QE taper at the 15 December FOMC meeting. This has lifted the greenback up sharply and put heavy pressure on the cable. Meanwhile, worries about the spread of the new coronavirus variant and the UK-EU impasse over the Northern Ireland Protocol might keep weighing on the cable.

For technical aspect, RSI indicator 32 figures as of writing, suggesting that the bearish momentum should persist for a while before there’s a trend reversal. Looking at the MACD indicator, a death cross is forming on the histogram, which also points that the pair may experience some downward trend. As for the Bollinger Bands, the price dropped out of the lower band, therefore a strong trend continuation could be expected. In conclusion, we think market will be bearish as the pair is eyeing a test of the 1.3188 support, a break below that level suggests more losses ahead for the cable.

Resistance: 1.3390, 1.3514, 1.3607

Support: 1.3188, 1.3106


USDCAD (4- Hour Chart)

The pair USD/CAD advanced to 1.283 area amid falling oil prices on Tuesday, regaining upside traction and stay in positive territory. The pair climbed to a two-month top near 1.281 level, but then pulled back moderately during European session. USD/CAD now rallies above 1.2800 on Powell’s hawkish remarks, currently rising 0.55% on a daily basis. Increasing risks of higher inflation and expectations for a faster bond taper act as a tailwind for the US dollar and push USD/CAD higher. On top of that, WTI oil drops below $66 amid deterioration in market sentiment, as Moderna’s CEO said that he believes the vaccine effectiveness would probably be less effective against the new variant. As for now, the dampened outlook for jet fuel demand will keep putting pressure on the commodity-linked loonie.

For technical aspect, RSI indicator 65 figures as of writing, suggesting that the bullish momentum should persist for a while before there’s a trend reversal. As for the Bollinger Bands, the price is from the moving average to upper band, therefore the upside traction could persist. In conclusion, we think market will be bullish as the pair is heading to test the 1.2849 resistance.

Resistance: 1.2775, 1.2849

Support: 1.2641, 1.2493, 1.2387


Economic Data


Currency

Data

Time (GMT + 8)

Forecast

AUD

GDP (QoQ) (Q3)

08:30

-2.7%

CNY

Caixin Manufacturing PMI (Nov)

09:45

50.5

EUR

German Manufacturing PMI (Nov)

16:55

57.6

GBP

Manufacturing PMI (Nov)

17:30

58.2

USD

ADP Nonfarm Employment Change (Nov)

21:15

525k

GBP

BoE Gov Bailey Speaks

22:00


USD

Fed Chair Powell Testifies

23:00


USD

ISM Manufacturing PMI (Nov)

23:00

61.0


USD

Crude Oil Inventories

23:30

-1.237M


Won Tien Ching joins VT Markets as regional business development director

30 November 2021, Sydney, Australia – VT Markets are delighted to welcome Won Tien Ching to the company as Regional Business Development Director.

VT Markets, one of the leading multi-asset trading platforms, announced the appointment of Won Tien Ching, former Chief Marketing Officer of Singapore at HGNH International Asset Management (HGNH AM) as the company’s Regional Business Development Director today.

Won has over 12 years of experience in the international financial services industry and in his newly appointed role, will support VT Markets achieve their marketing and business goals on a global level. The multi-asset trading services provider is planning to utilize the extensive experience of Mr. Won to progress the company’s expansion in different regions.

In his latest role at HGNH International Asset Management, Won led the company’s Sales and Marketing team for the execution of expansion in the region. In his new position at VT Markets, Won will focus on introducing high-profile partnerships and business development to cover the whole client lifecycle.

Won comments:

“I am delighted to join VT Markets at this juncture where there is an adventure awaiting and bigger targets to achieve with the team. VT Markets has shown its impressive capability to grow in the past few years and now we are targeting new markets and higher-value customers and partners. I would also like to inculcate a workplace culture that provides considerable latitude in exploring creative ways of achieving goals and embracing constant changes, whilst being disciplined enough to adhere to guidelines and targets set by the company. With this approach, I believe VT Markets will continue to grow and expand into new territories; building on their excellent brand credibility and top-notch services.”

VT Markets are excited to welcome Mr. Won to the team.

About VT Markets

VT Markets, based in Sydney, Australia, is a subsidiary of VT Markets LLC (VIG) and leverages more than 10 years of experience and expertise in global financial markets to offer easy and transparent market access and help our clients pursue their financial goals. Founded in 2016, VT markets has applied for advanced technical support in the retail FX market to provide clients with superior trading experience.

For inquiries, please contact [email protected] or visit www.vtmarkets.com

Back To Top
server

Hello there 👋

How can I help you?

Chat with our team instantly

Live Chat

Start a live conversation through...

  • Telegram
    hold On hold
  • Coming Soon...

Hello there 👋

How can I help you?

telegram

Scan the QR code with your smartphone to start a chat with us, or click here.

Don’t have the Telegram App or Desktop installed? Use Web Telegram instead.

QR code