Market Focus

US stock advanced on Friday, recovering from previous day’s slide. Market now tends to believe that the Federal Reserve won’t have to accelerate plans to tighten monetary policy after the release of a in-line inflation data. The US CPI came in 6.8%, which is the highest since 1982 but correspond with market’s expectations. Therefore, the fact that high US inflation wasn’t even higher supports the equity market. Also, Consumer Sentiment in US improved from a decade-low in November. On top of that, concerns about the spread of new Omicron variant keep weighing on market sentiment, as companies in UK have started to tell employees to work from home. Investors now await the key Fed meeting this week, which might provide some clues on the pace of bond tapering and interest rate hikes.

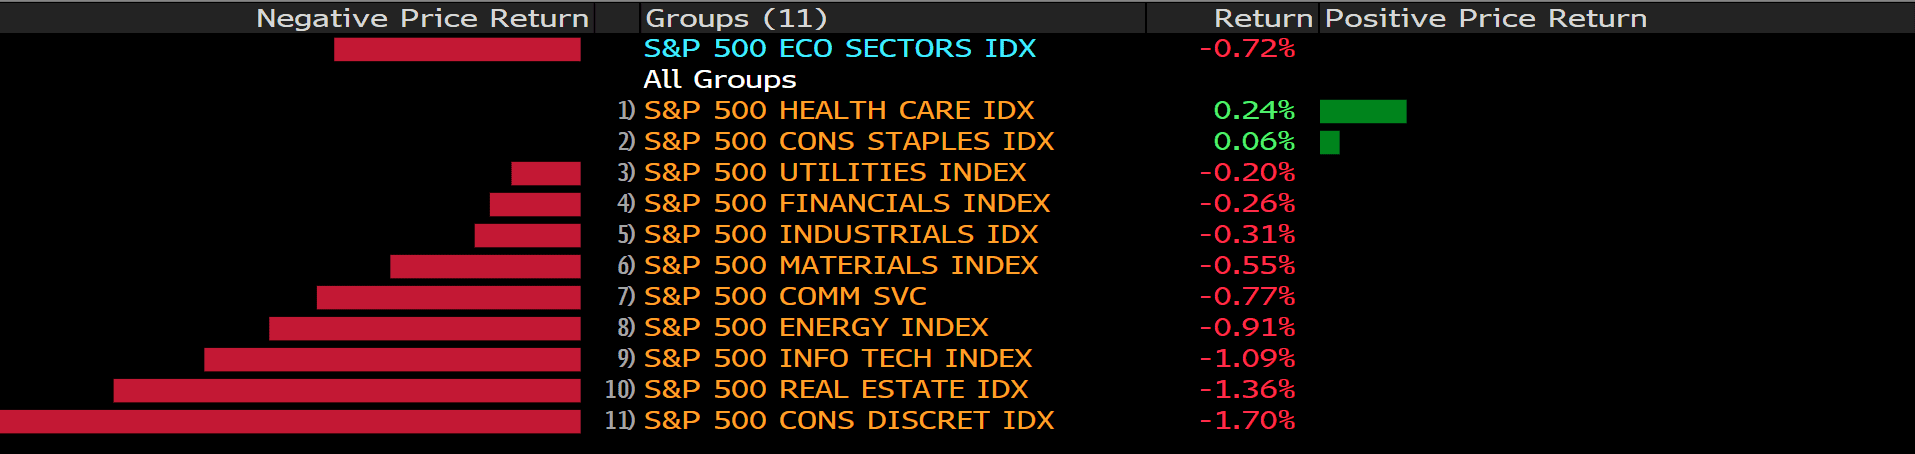
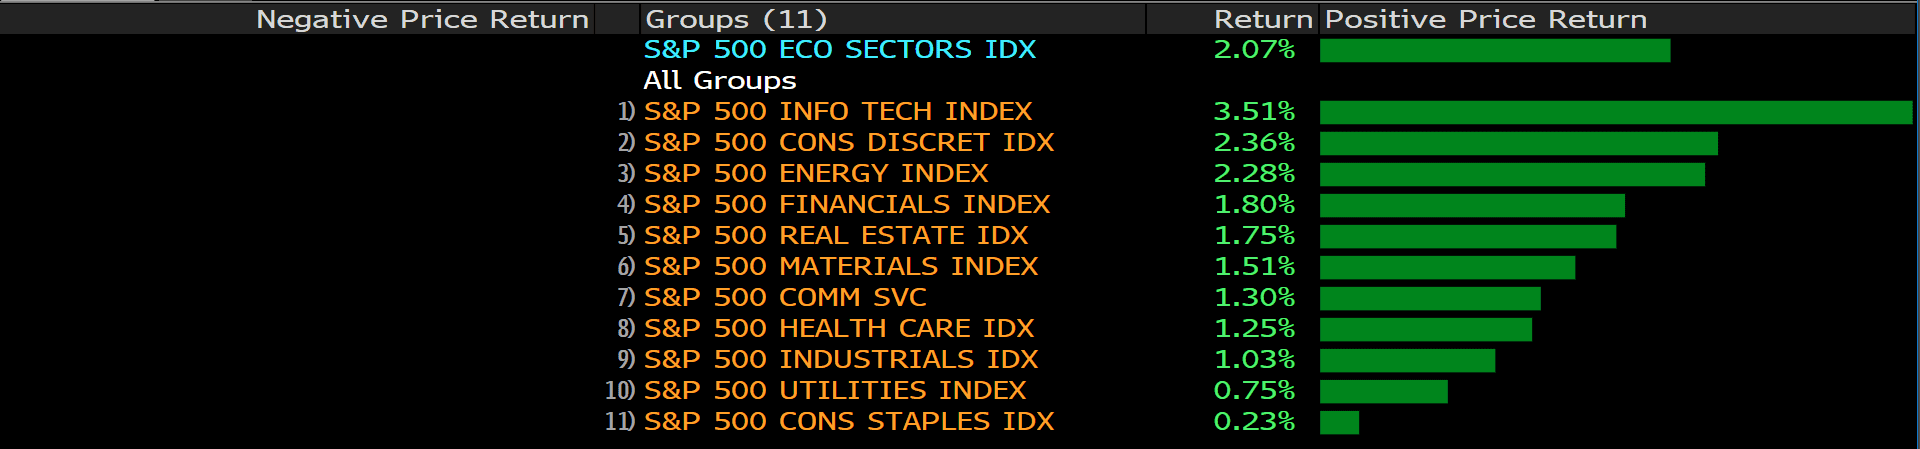
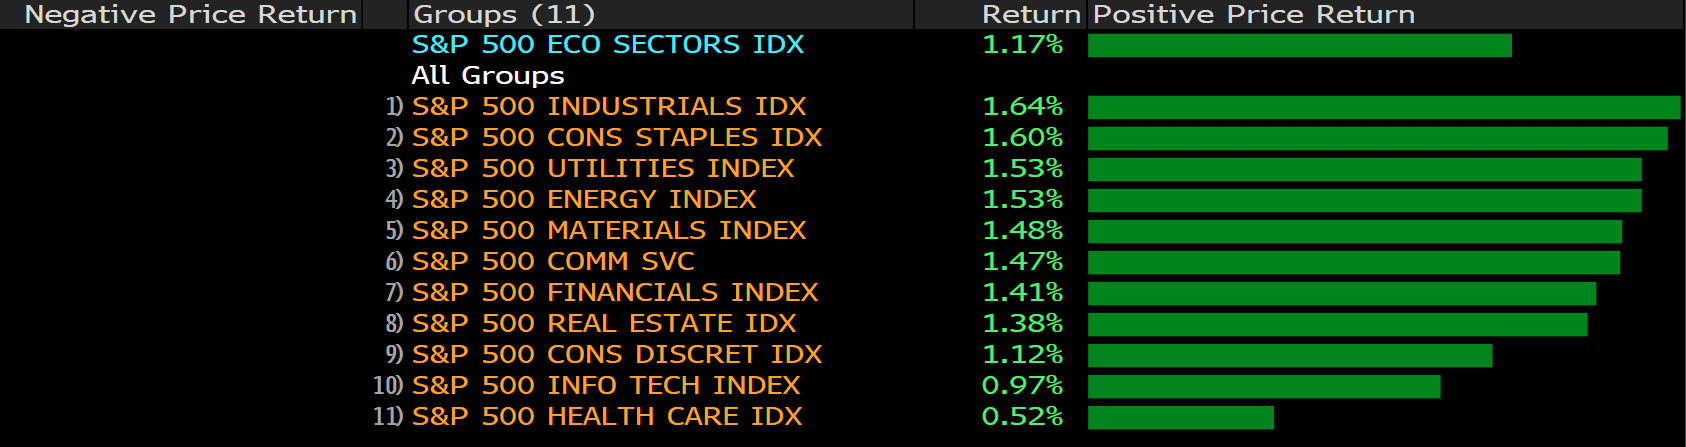
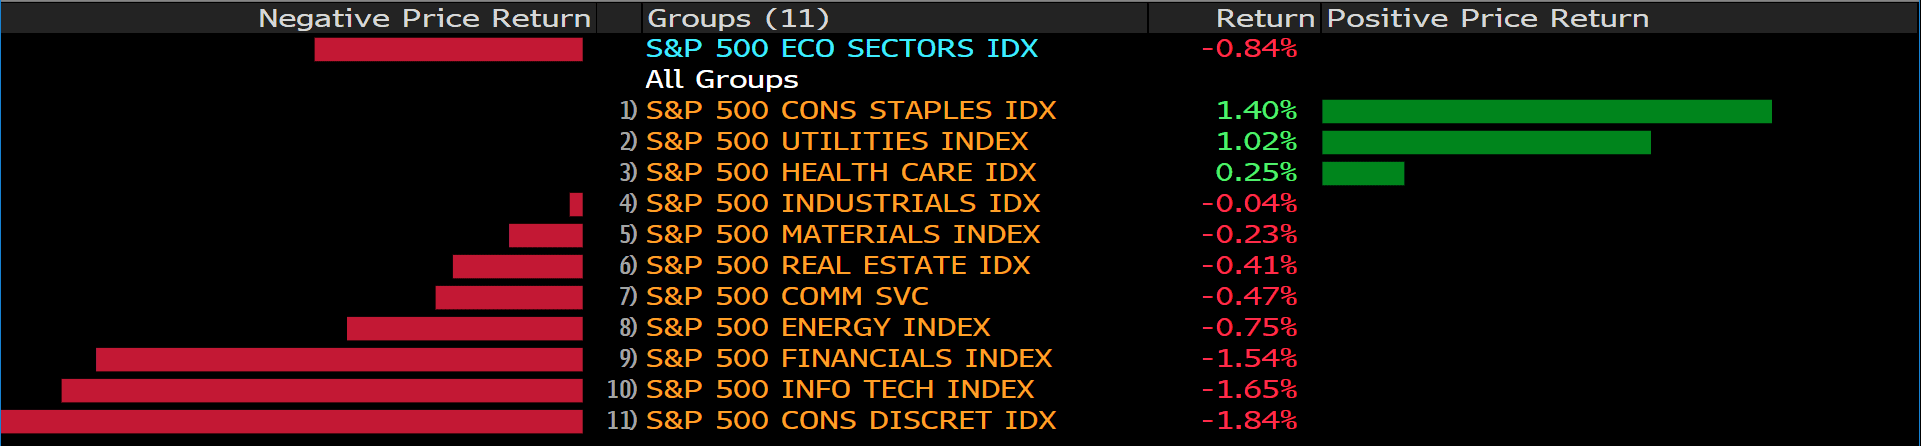
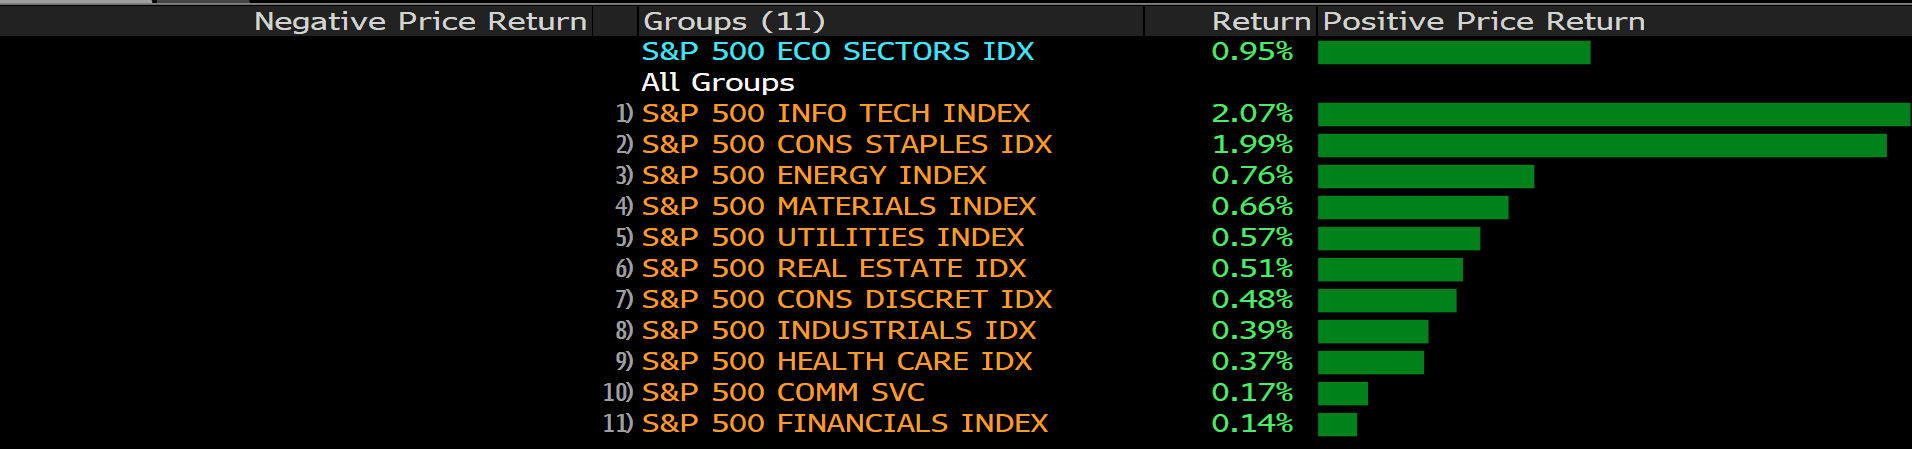
The benchmarks, S&P 500, Nasdaq 100 and the Dow Jones Industrial Average both rose on Friday amid upbeat market mood and relief that Fed won’t have raise interest rates too early. S&P 500 was up 1.0% on a daily basis and the Dow Jones Industrial Average advanced with a 0.7% gain for the day. All eleven sectors stayed in positive territory as the information technology and consumer staples sectors are the best performing among all groups, gaining 2.07% and 1.99%, respectively. The Nasdaq 100 advanced the most with 1.1% gain on Friday and the VIX fell a further more than 2.0 points to under 19.50.

一張含有 文字 的圖片

自動產生的描述

In Asia, after disclosures that came a day after the developer officially defaulted on their dollar debt, China Evergrande Group chairman Hui Ka Yan was forced to sell pledged shares in the company. Therefore, shares of Evergrande declined 1.7% lower as well as Chinese real estate stocks, which also down 1.5%.


Main Pairs Movement:

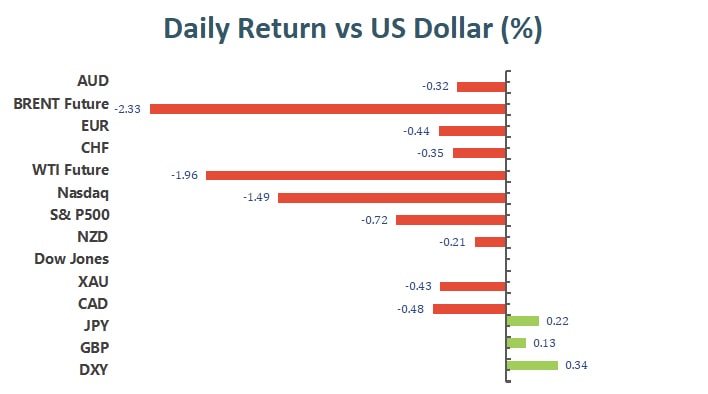
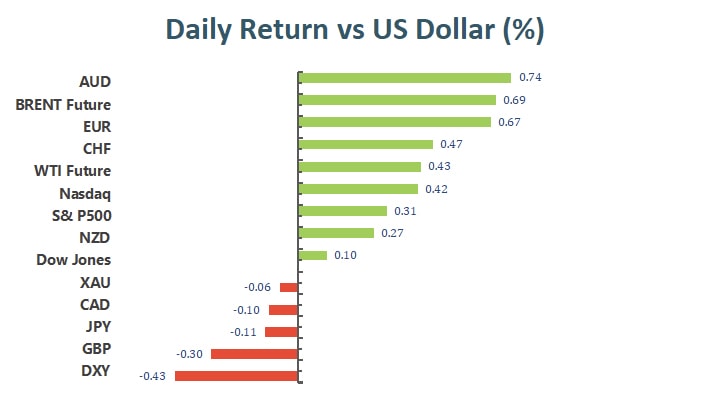
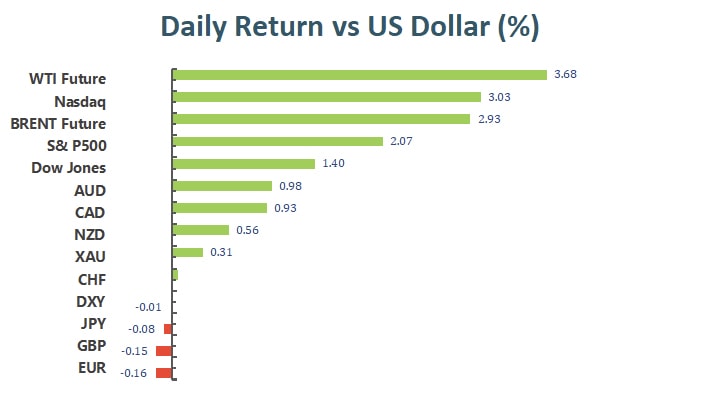
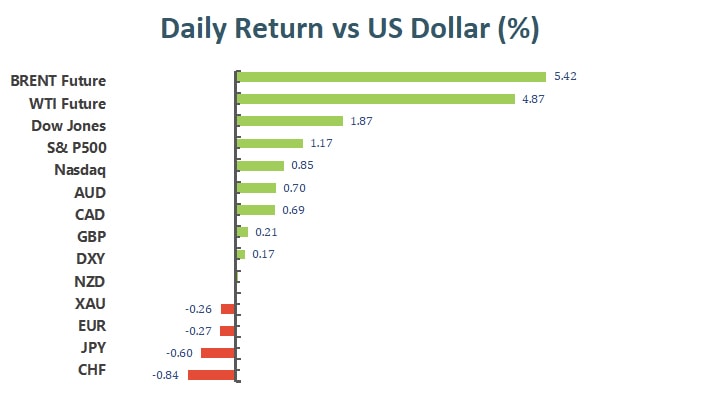
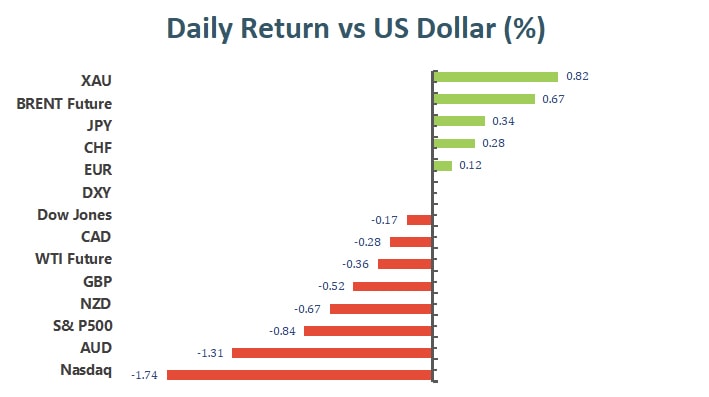
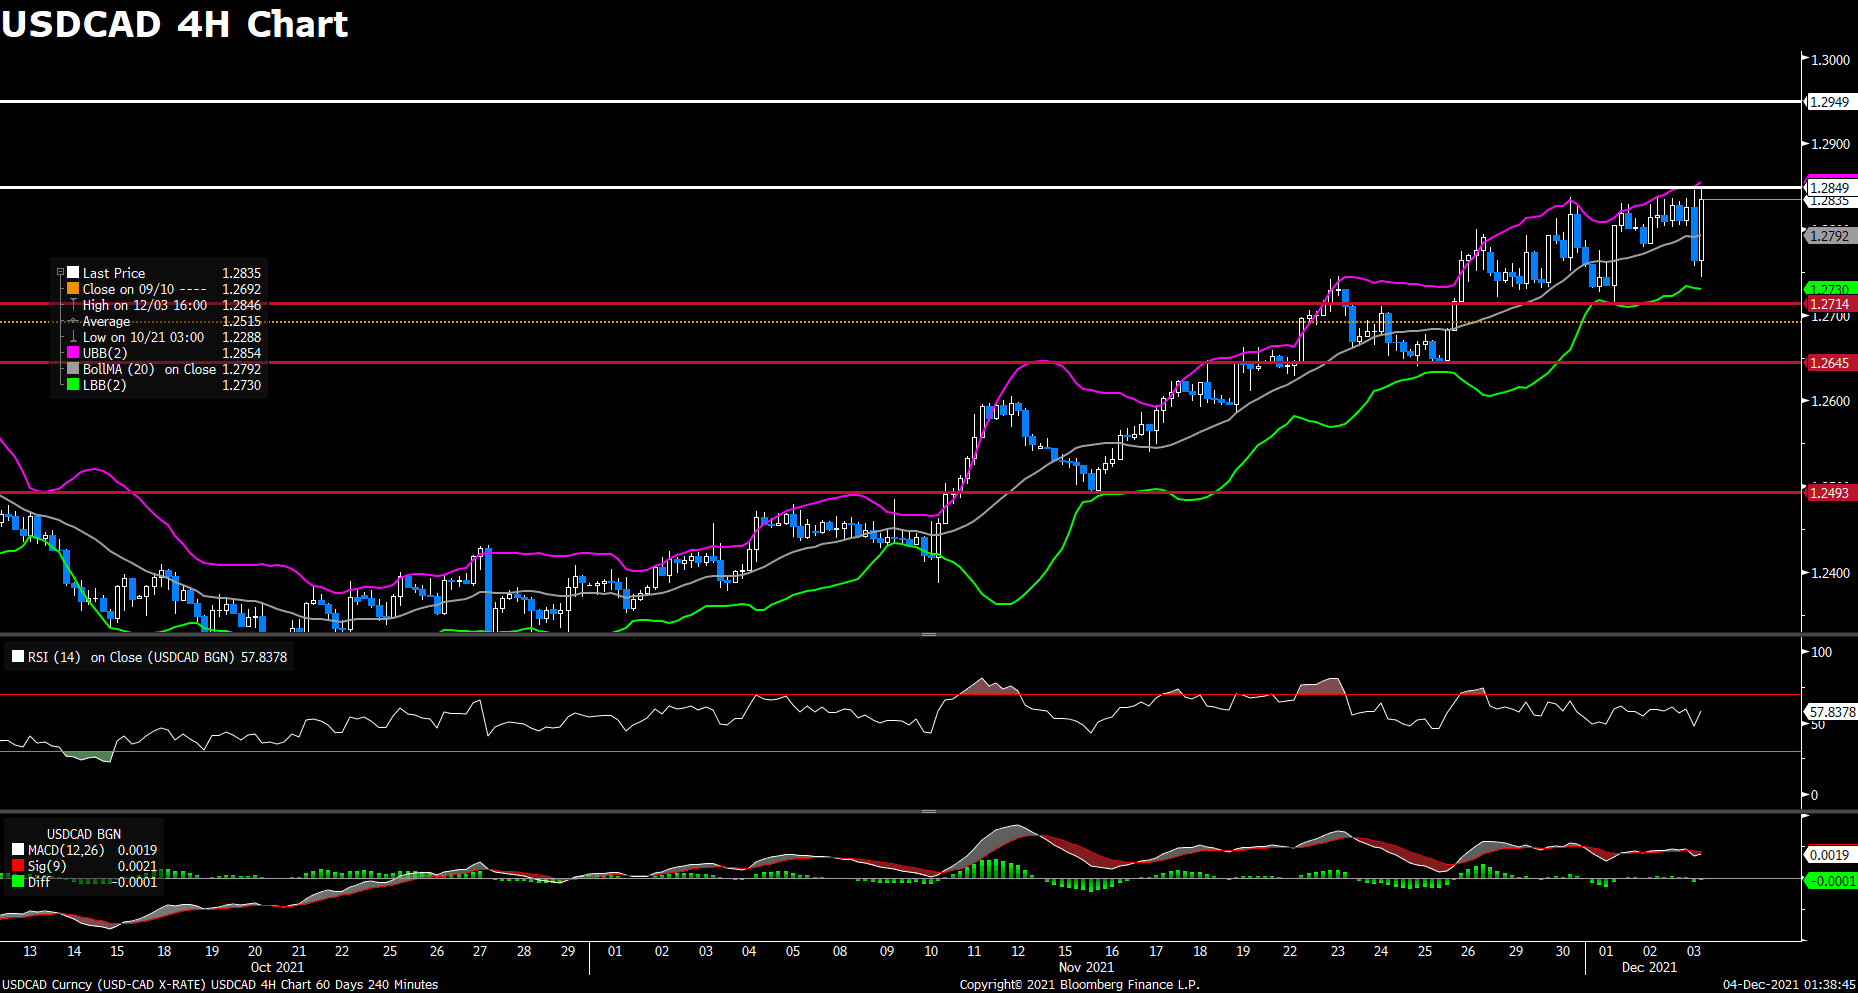
The US dollar edged 0.2% lower last Friday, staying in negative territory amid improved market sentiment. The DXY index gained bullish momentum and touched a daily top above 96.42 level during European session, but then pulled back to below 96 and surrendered its intraday gains at the end of the day. The in-line US CPI data supported major US equities and put pressure on the greenback. Markets focus now shift to the Fed meeting this week, as investors expect a speed up bond tapering.

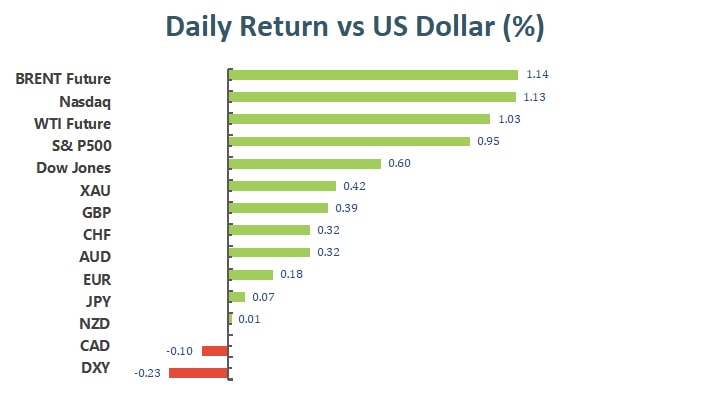
GBP/USD and EUR/USD both advanced last Friday amid US dollar weakness, climbing 0.34% and 0.20%, respectively. The cable saw fresh buying and touched a three-day high above 1.327 during American session. Meanwhile, EUR/USD recovered from a two-day low that touched earlier in the day, trading at around 1.131 area at the end of the day.

Gold advanced and touched a daily top around $1790 amid high US inflation report, which rose the most since the early 1980s. The renewed selling witnessed in greenback also acted as a tailwind for the precious metal, which gained 0.41% on a daily basis. WTI oil surged 1.81% for the day, closing out its best weekly performance since August. The growing confidence that the new Omicron variant is set to be far milder than past variants like delta pushed oil prices higher.


Technical Analysis:

AUDUSD (4- Hour Chart)

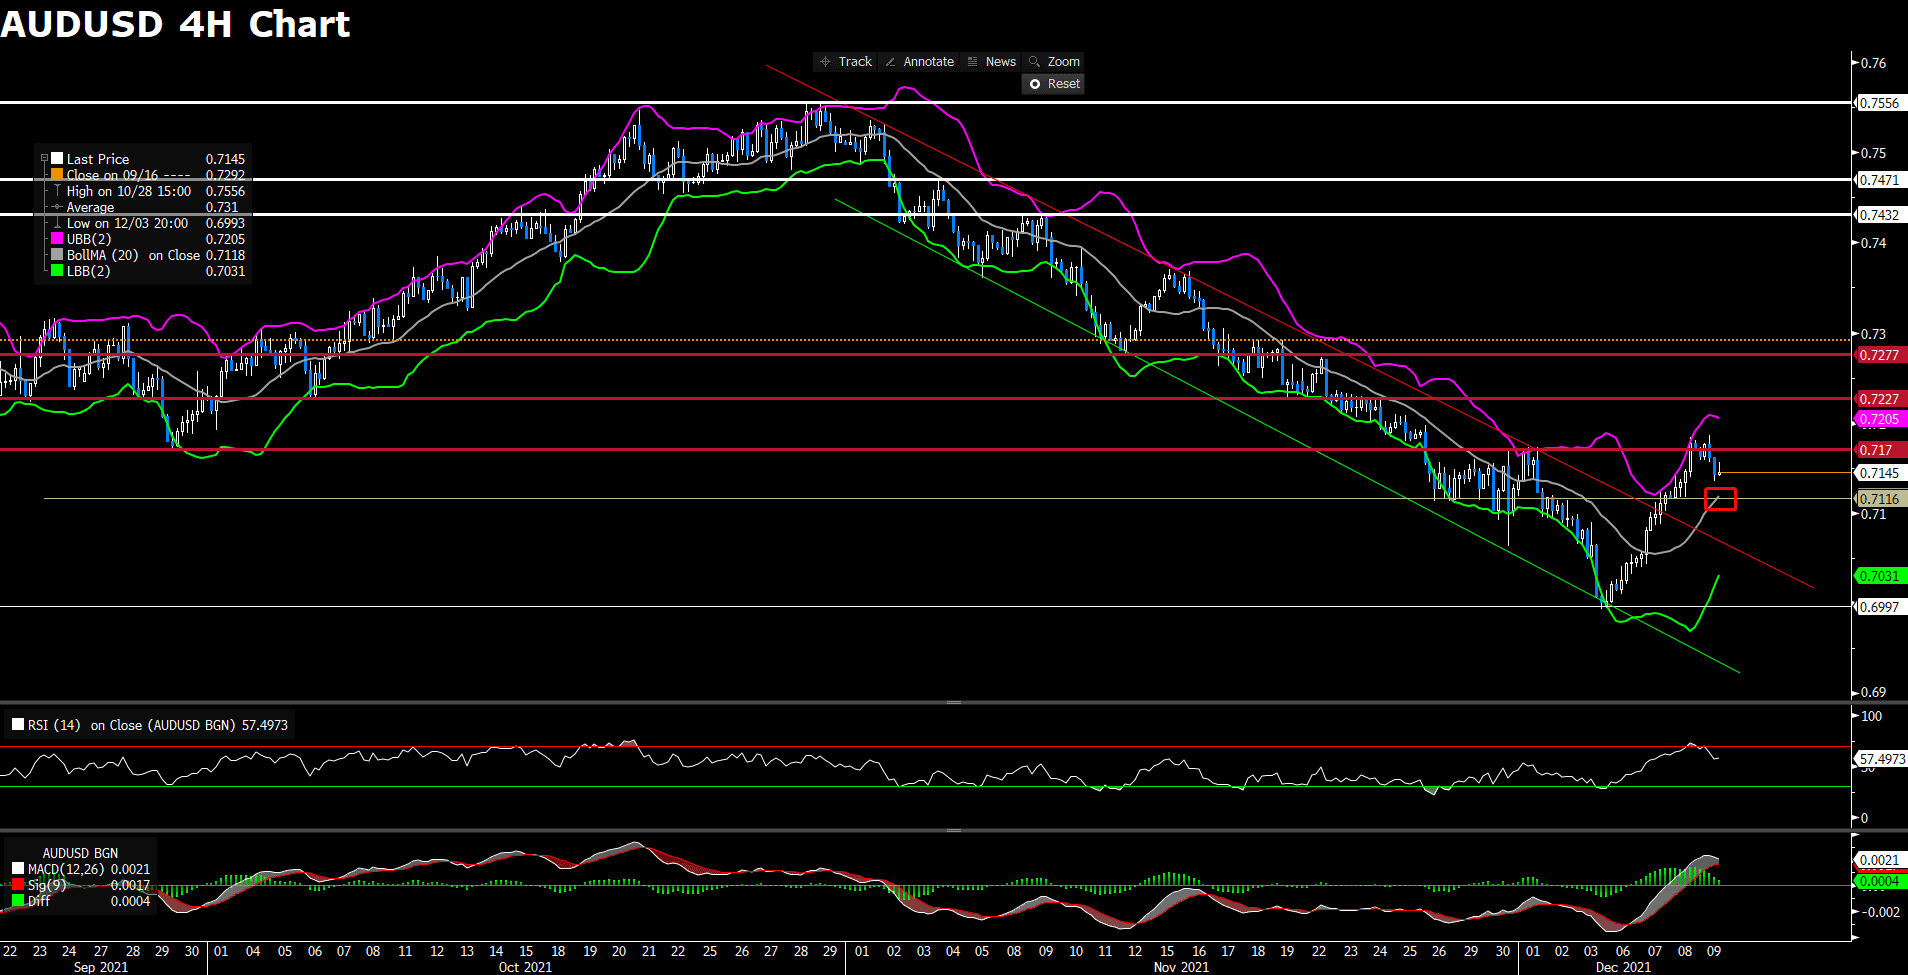
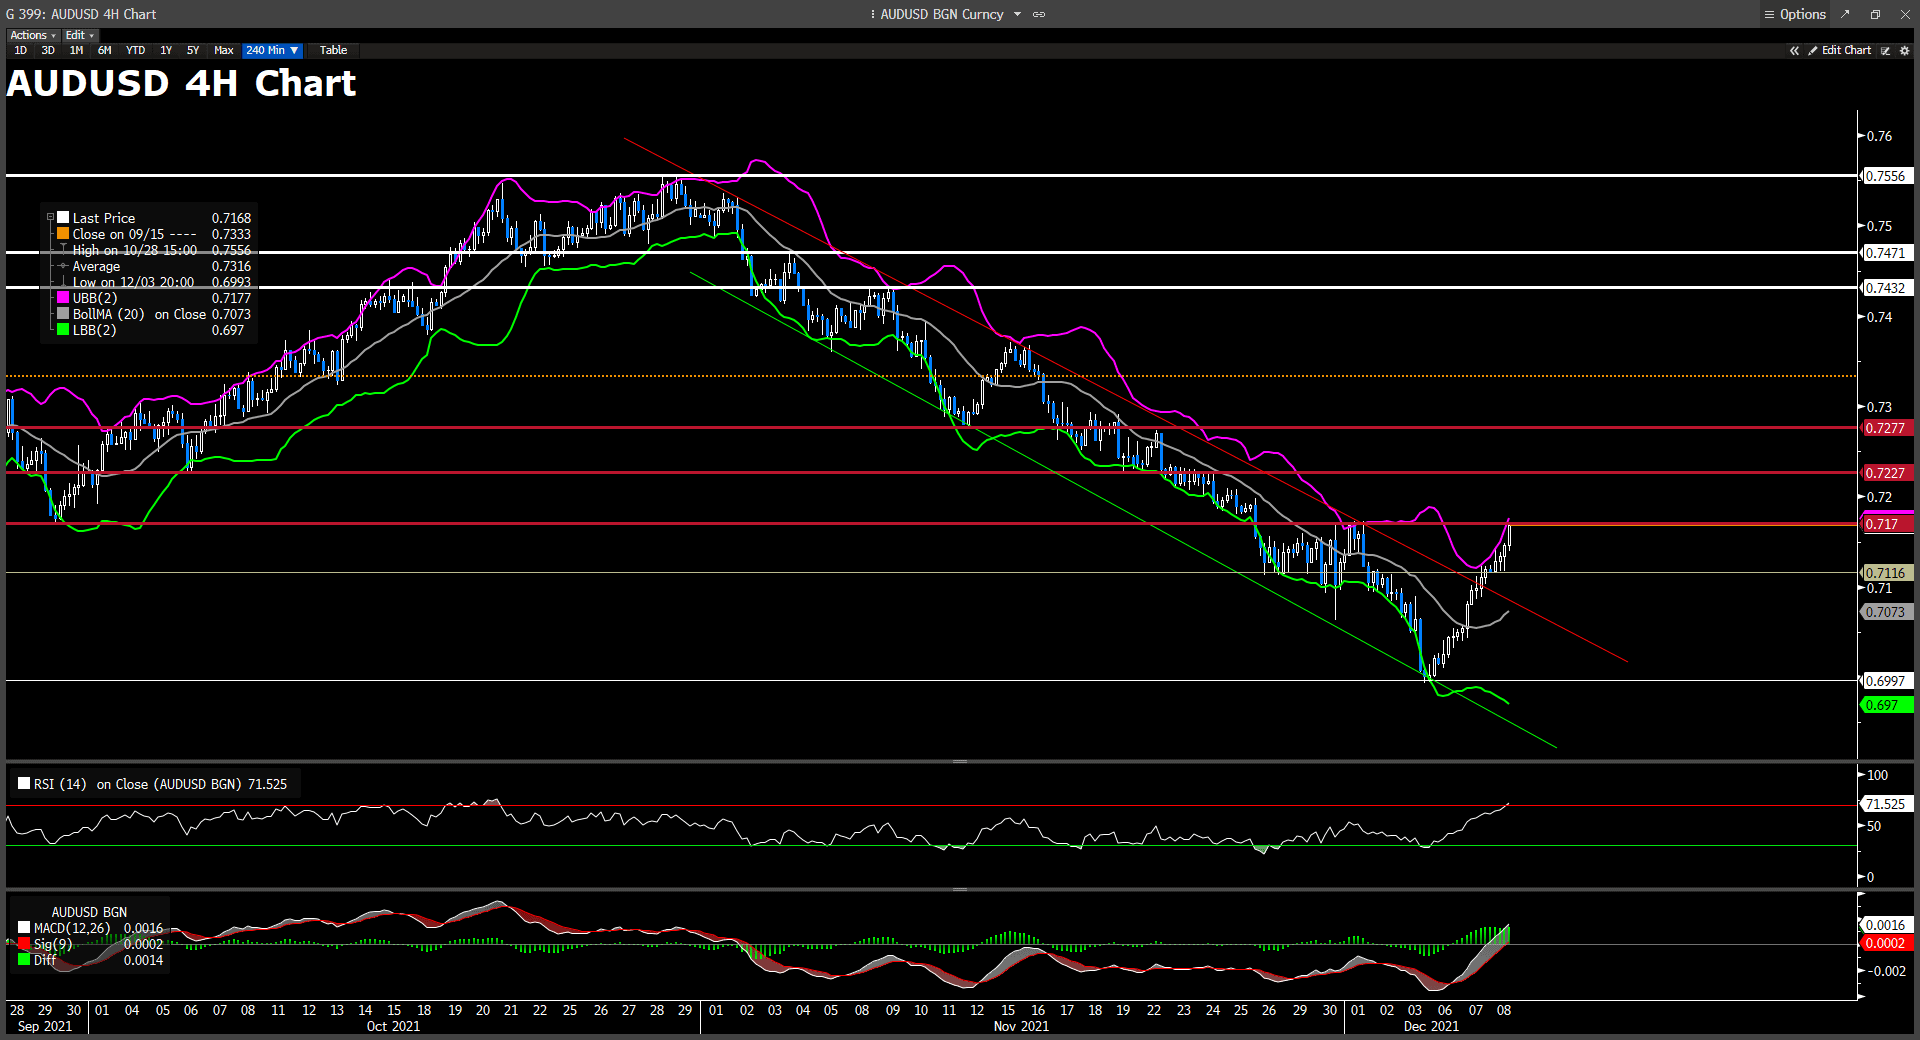
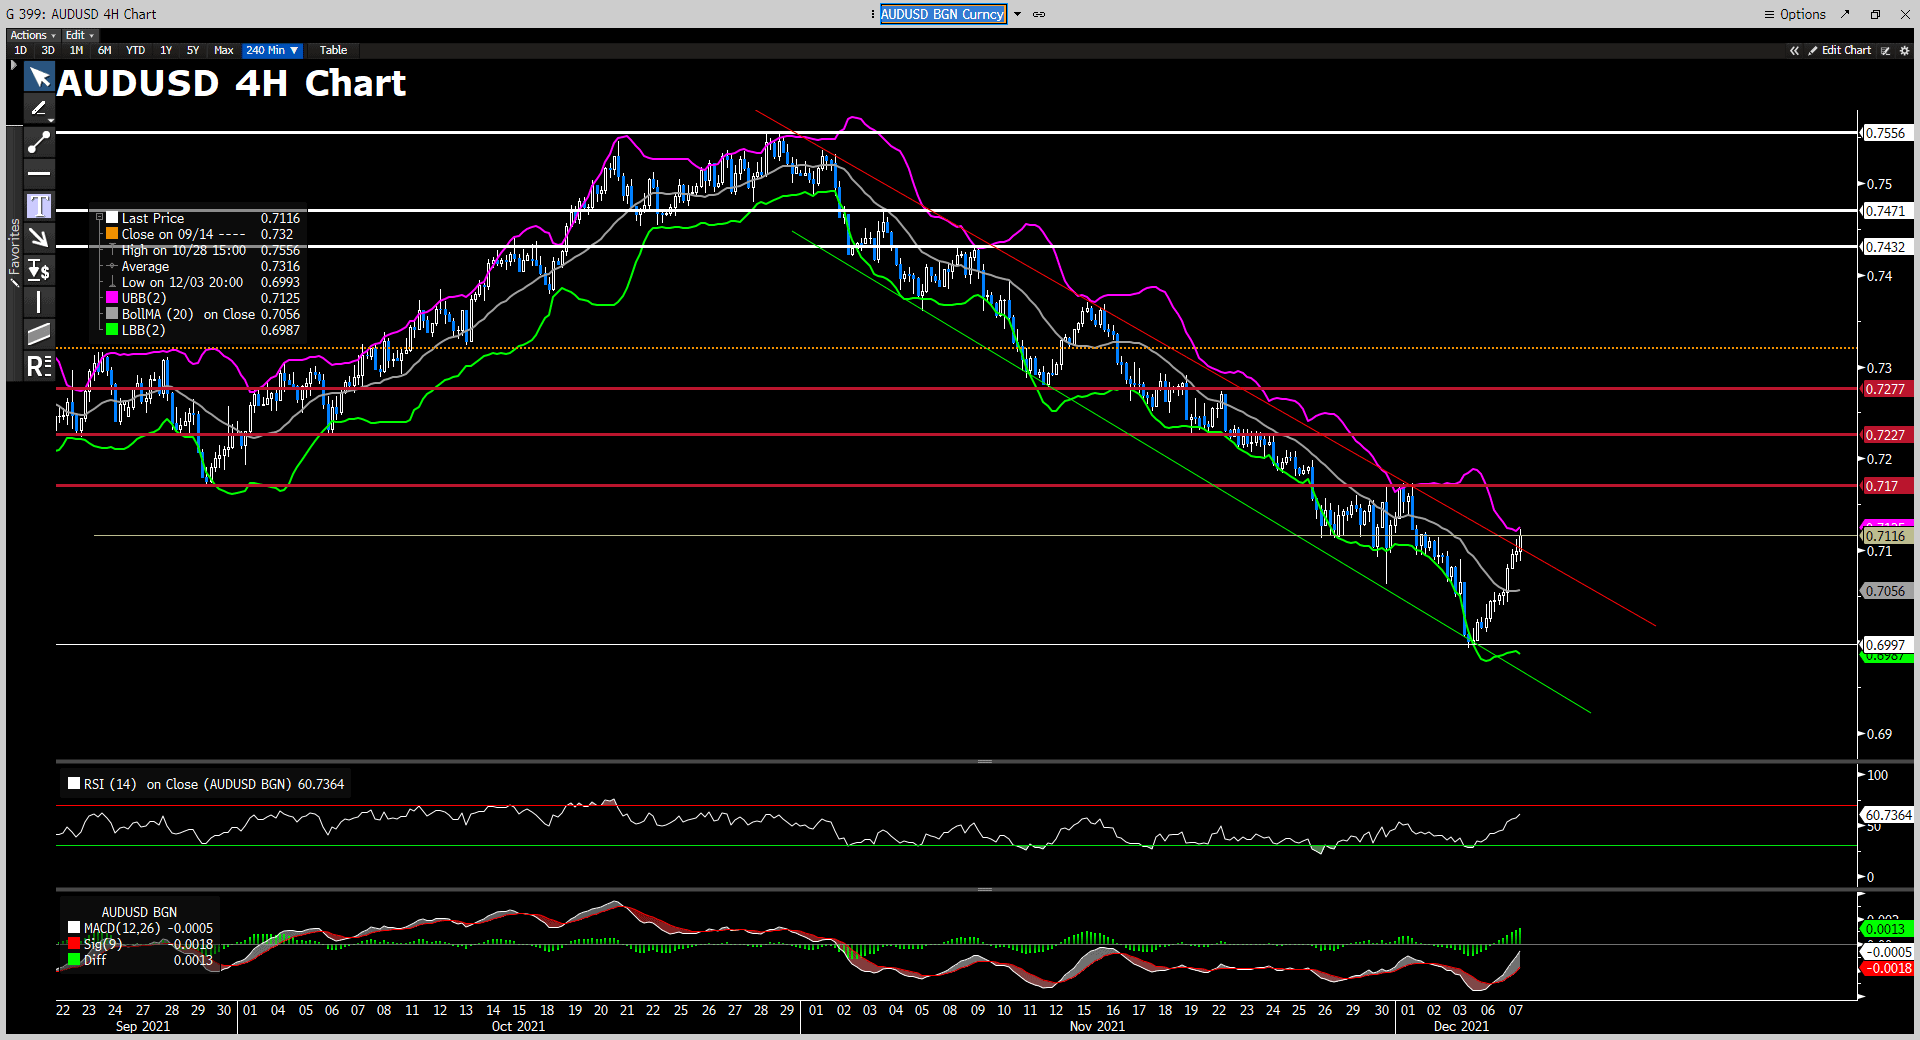
AUDUSD retests 0.717, gaining some positive traction after the US CPI report. From the technical perspective, the pair is currently challenging its immediate hurdle at 0.717. The outlook turns positive as the pair has breached the bearish trendline. If AUDUSD can officially trade above the 0.717, then it will reaffirm its upside momentum in the near term. From either the RSI or the MACD, a buying opportunity occurs as both indicators currently favor buyers. On the flip side, if AUDUSD falls below its support at 0.7116, then it will turn downside as it will falls within the bearish trendline.

Resistance: 0.717, 0.7227

Support: 0.7116, 0.6997


GBPUSD (4- Hour Chart)

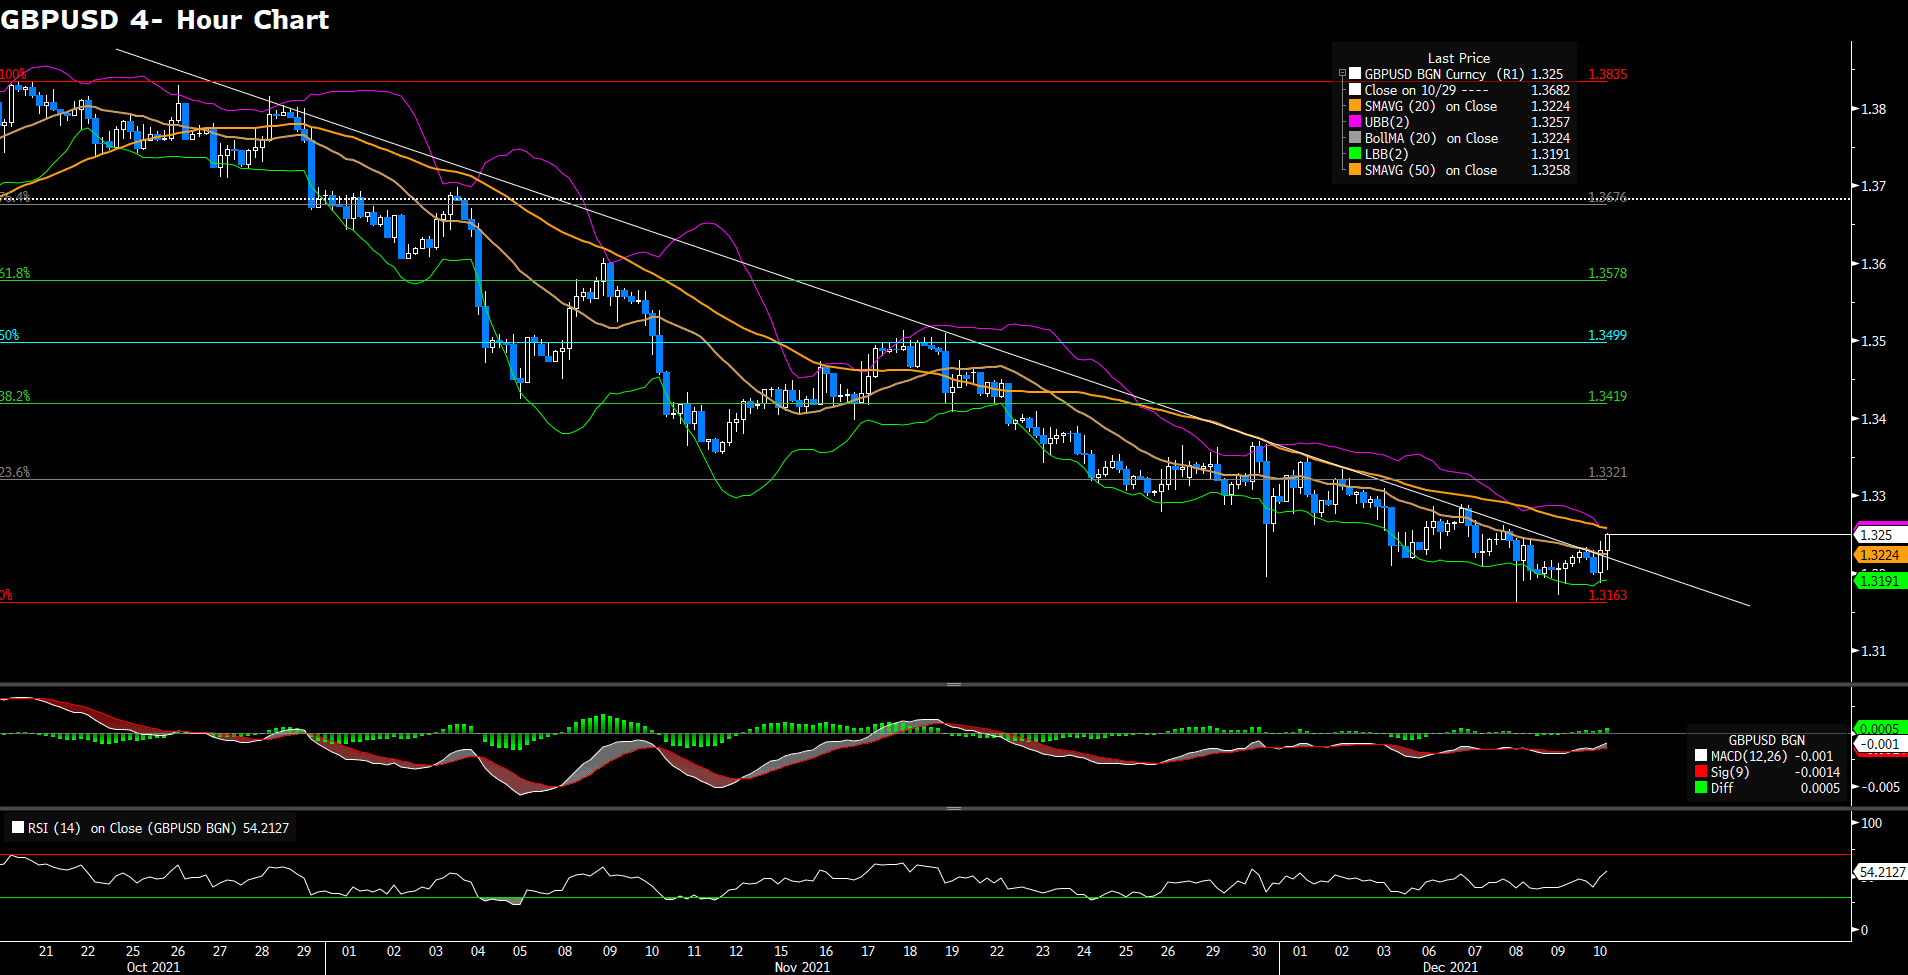
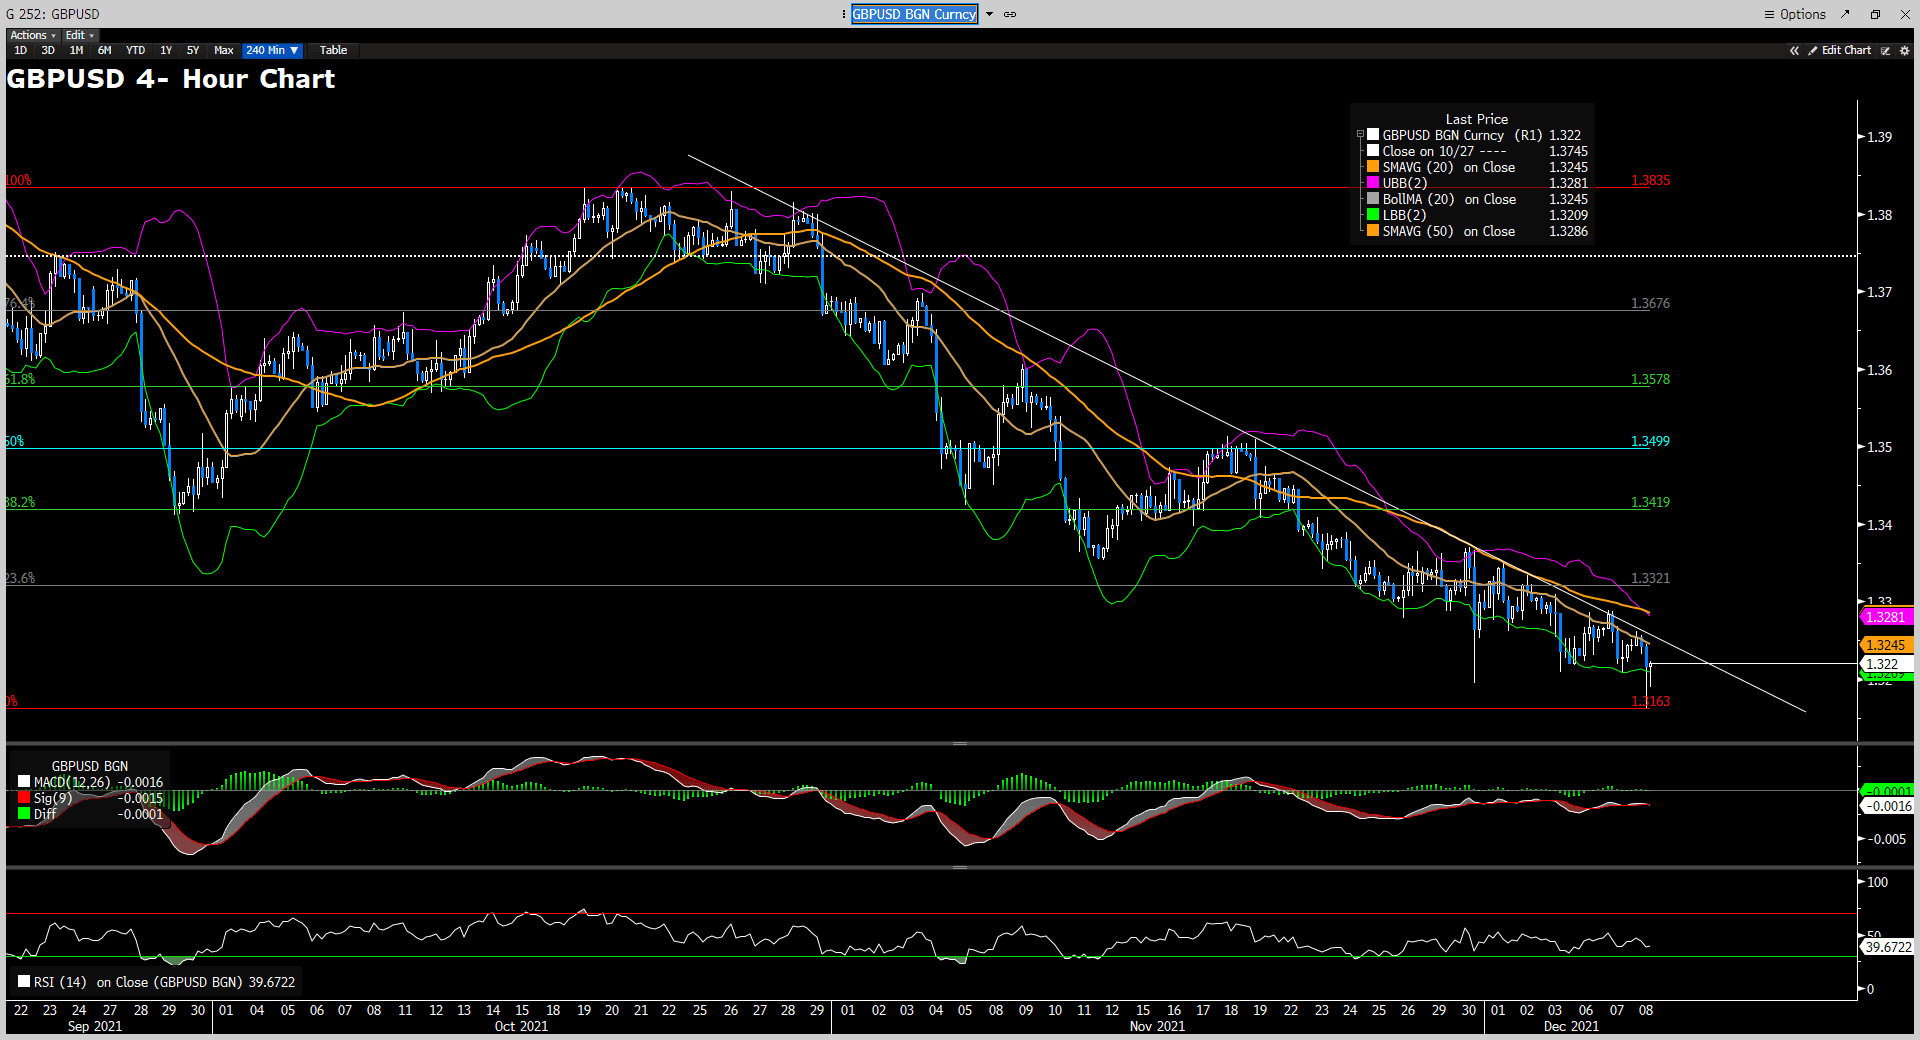
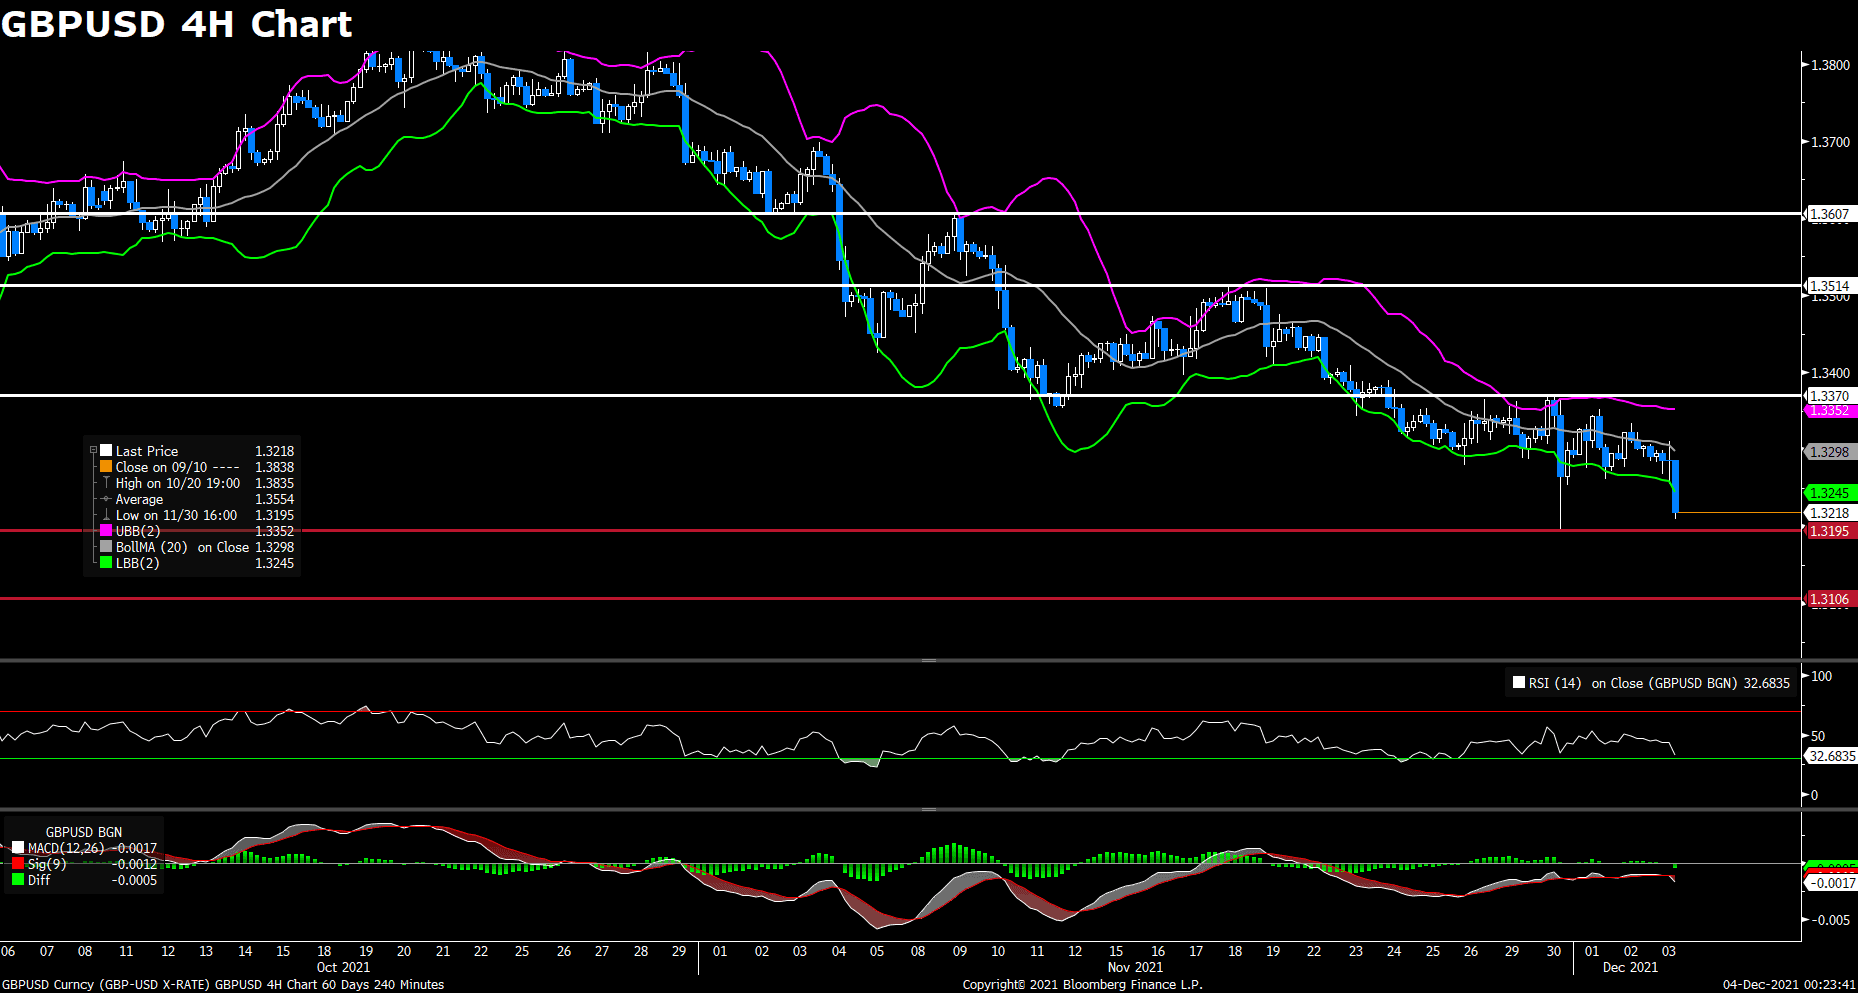
GBPUSD climbs above 1.3230 on worrisome US inflation report, hitting the highest in almost four decades. The US dollar seems vulnerable after the inflation report; in the meantime, heating US inflation figures might hint at steeper US Fed tightening. From the technical aspect, today’s upside momentum seems to bring GBPUSD out of the bearish trendline on the 4- hour chart, suggesting an overturn from bearish to bullish in the near term. A neutral RSI looks to favor bullish traders, who are also supported by a positive MACD. The next relevant resistance is set at 1.332, followed by 1.3417. On the flip side, if the pair fails to close its intraday price above the bearish trendline, then a selling opportunity will occur. The next relevant support is set at 1.3163.

Resistance: 1.3321, 1.3419, 1.3499

Support: 1.3163


EURUSD (4- Hour Chart)

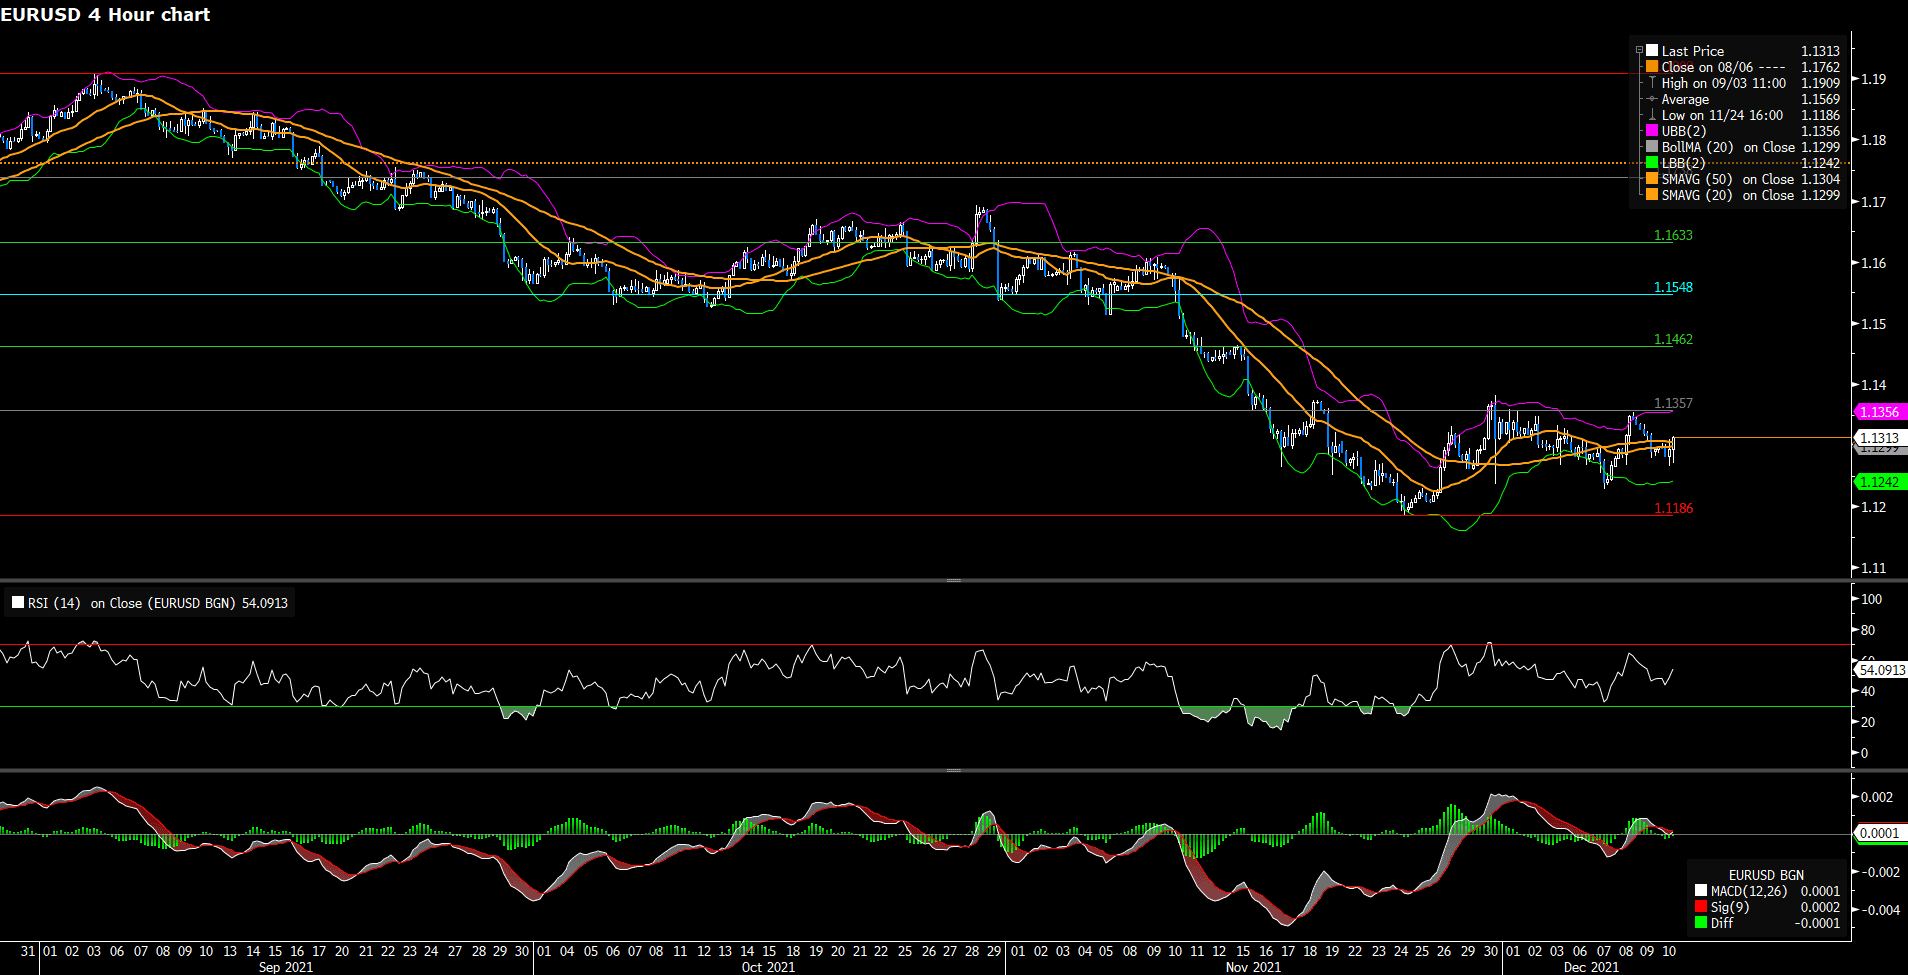
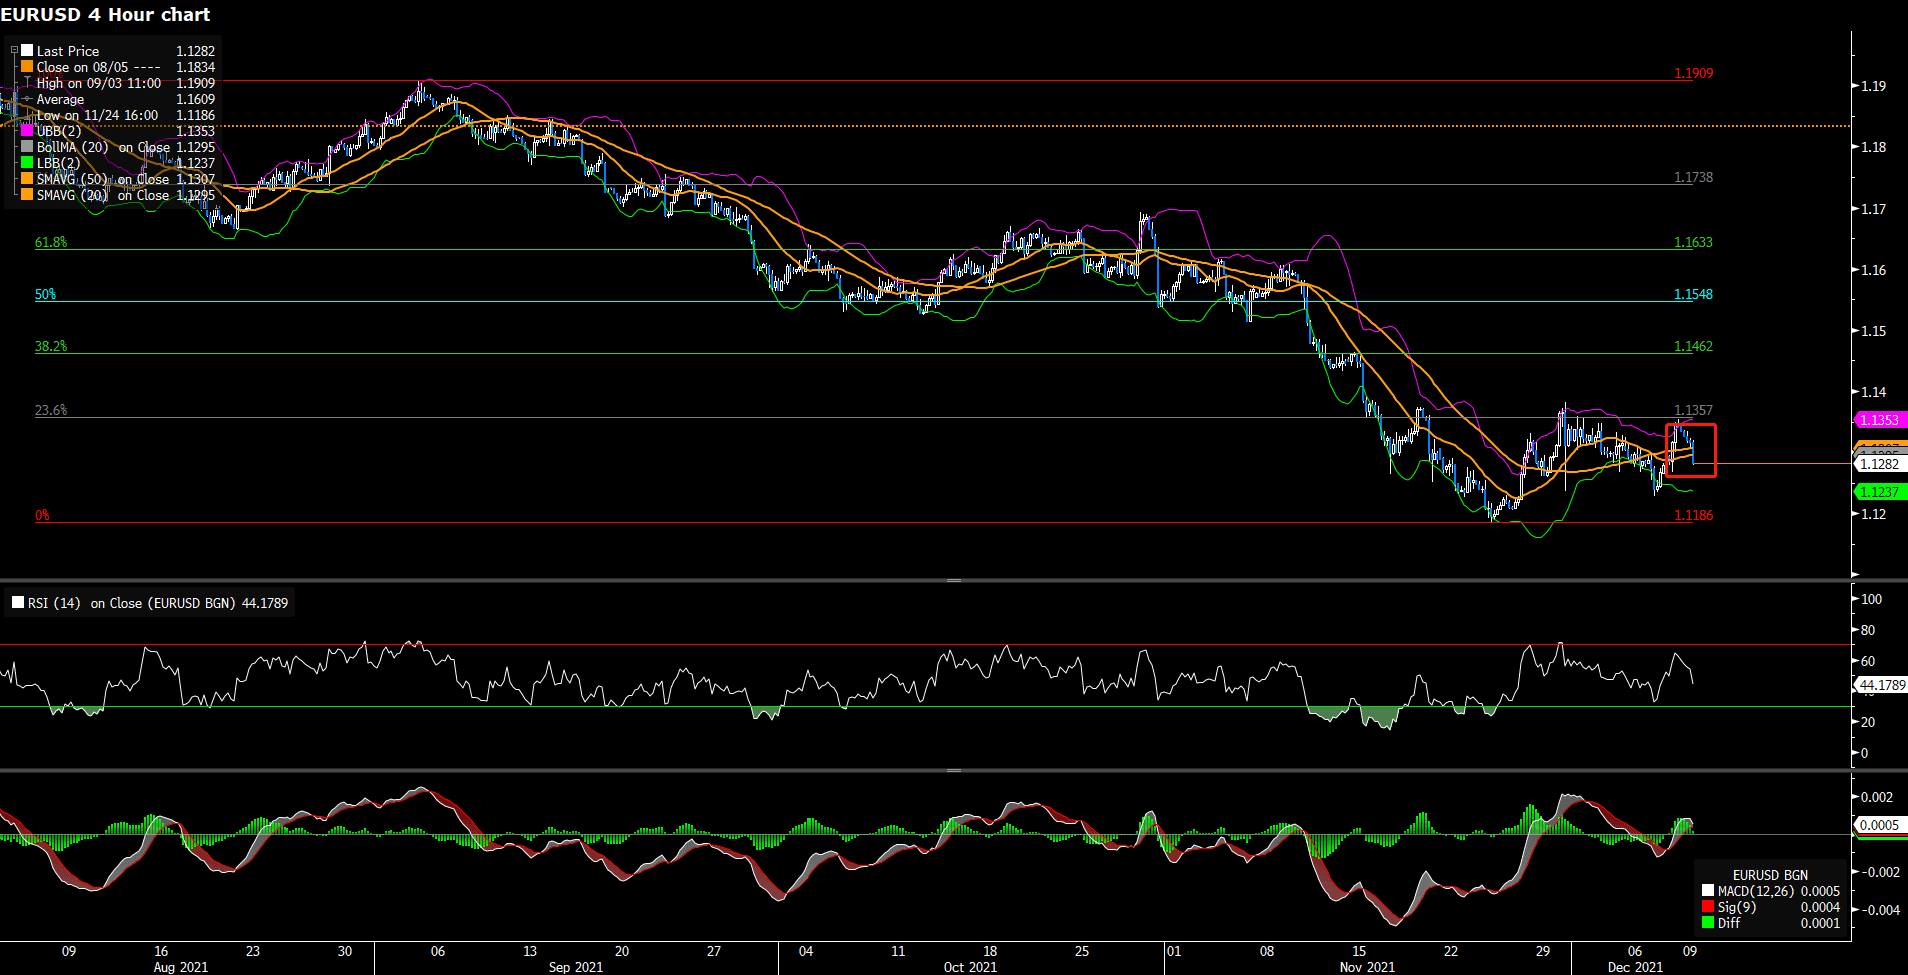
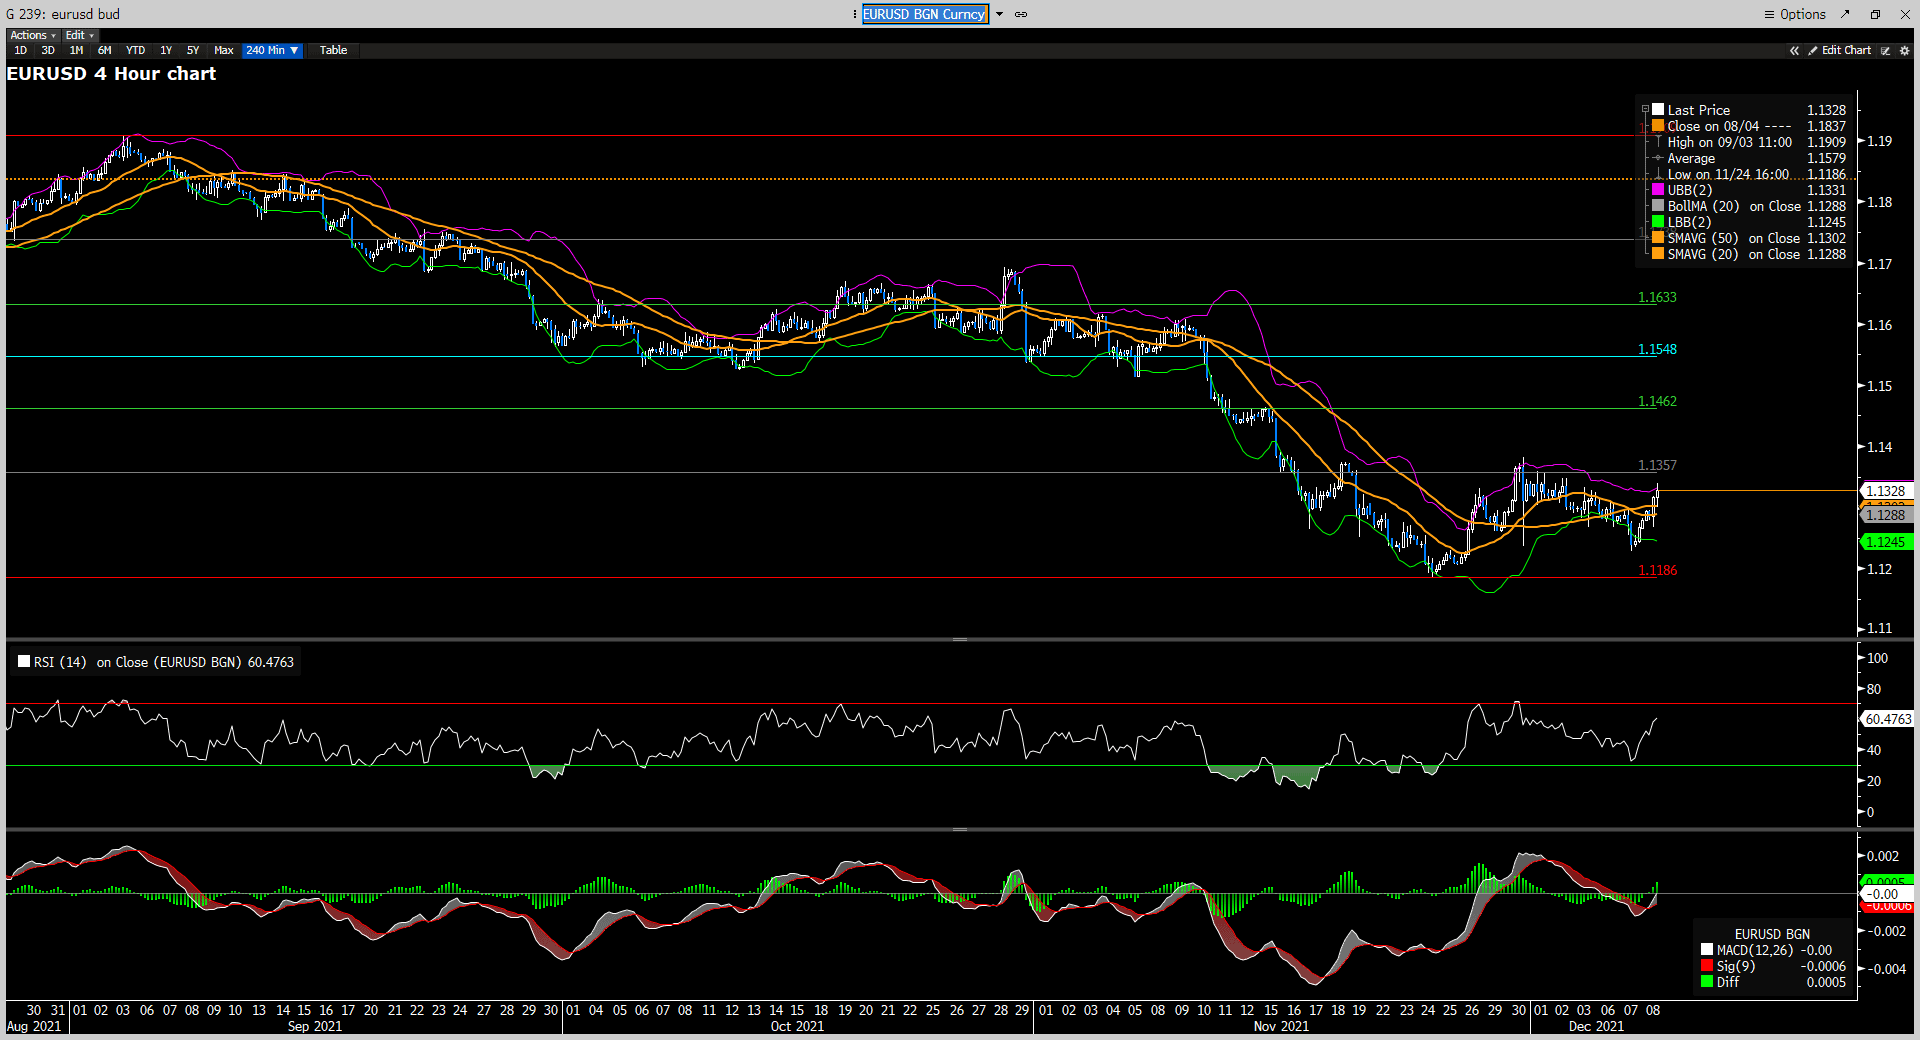
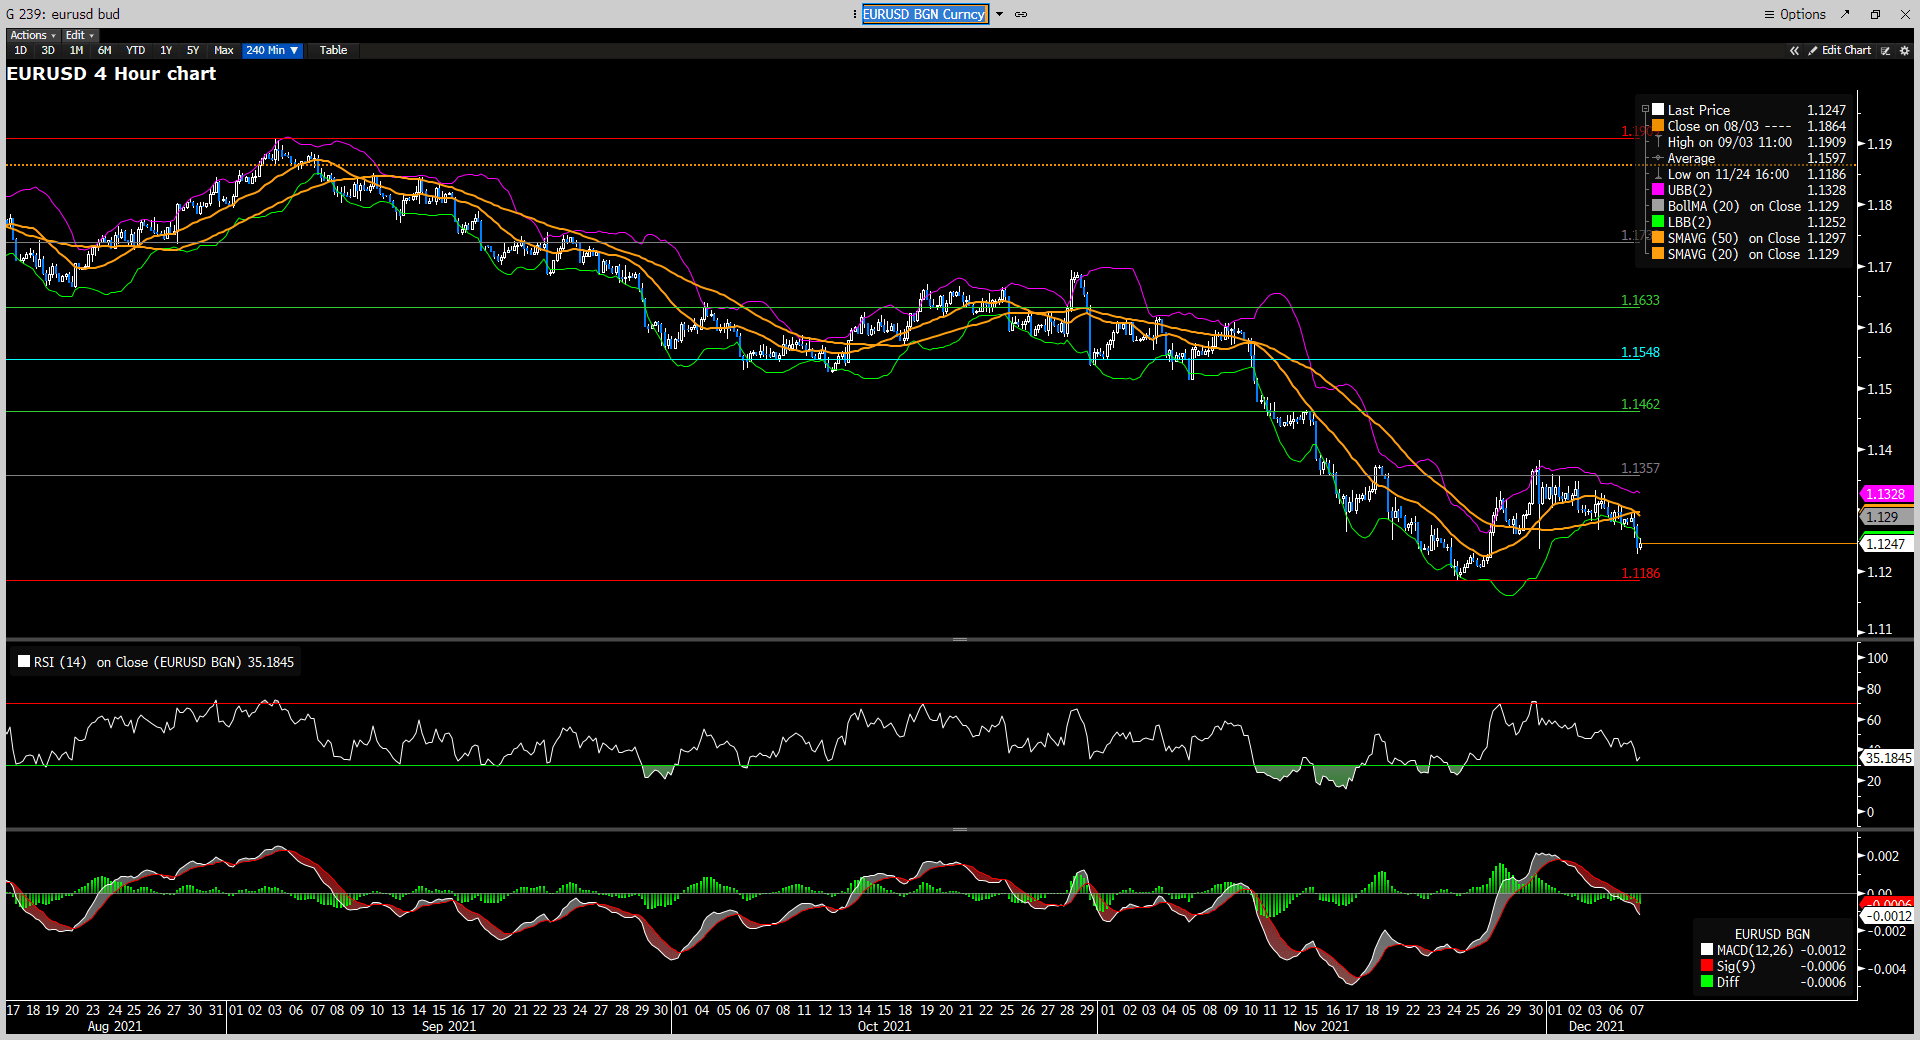
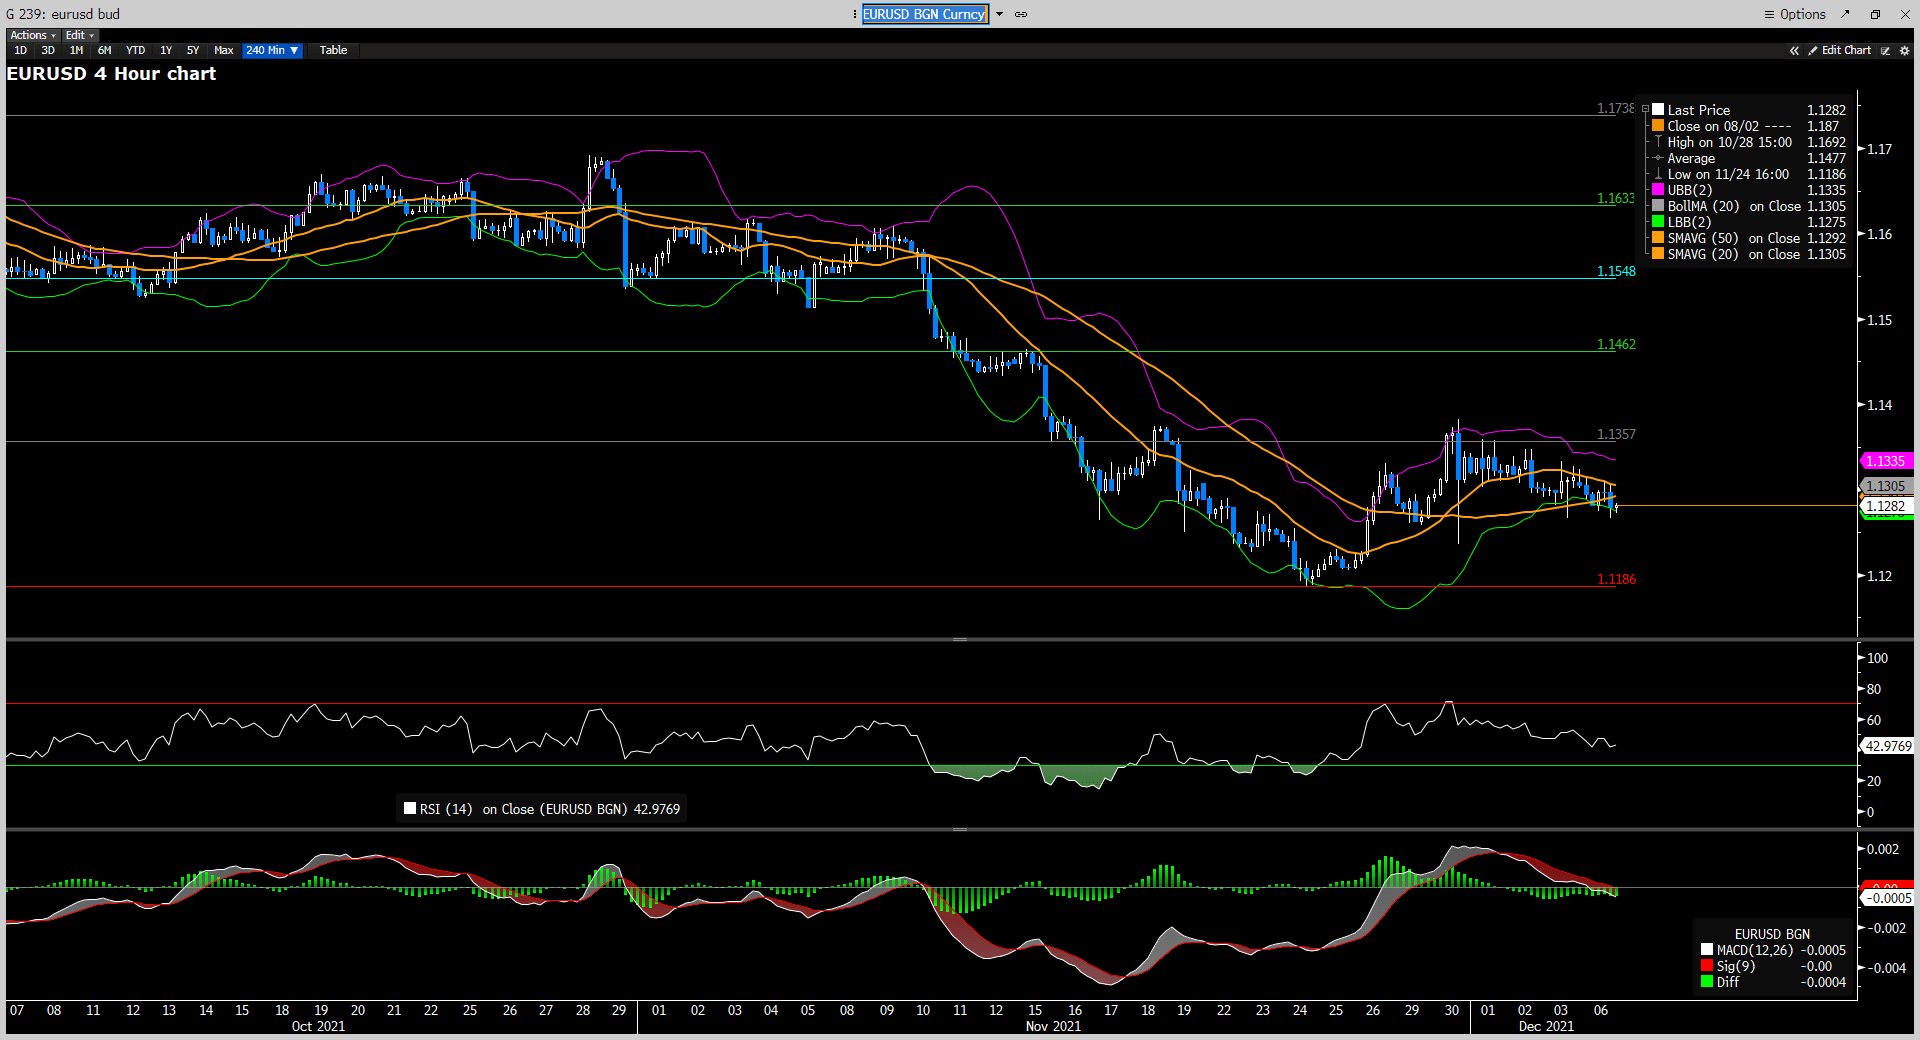
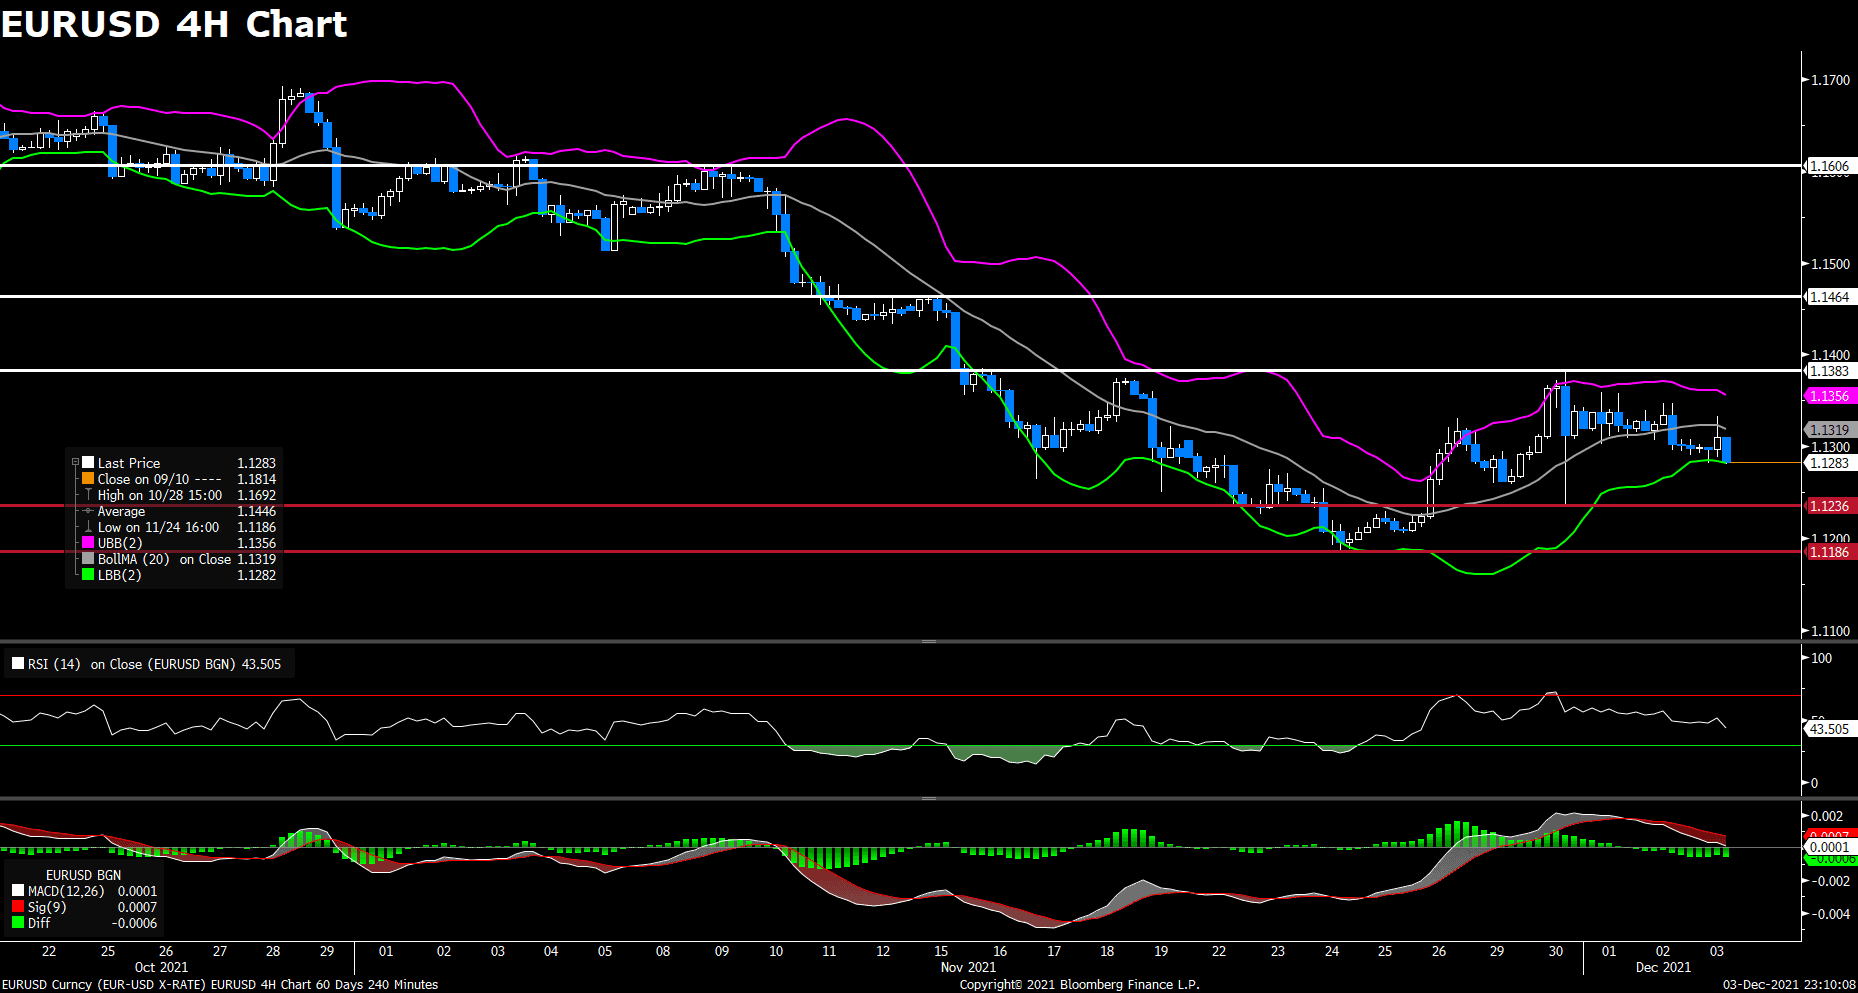
EURUSD bounces modestly above 1.1300 after the US inflation report at 6.8% in November, reaching the highest in almost four decades. From the technical aspect, the overnight pullback from weekly lows seems to turn the currency pair back to bullish mode in the near term. Climbing back above 1.1300 favors bullish traders as EURUSD is now trading above its 20 and 50 SMAs; in the meantime, the MACD indicator is now turning into positive levels as the time of writing. The current upside momentum is expected to bring the pair toward its immediate resistance at 1.1357. On the flip side, selling below 1.1299 region will reaffirm the negative bias and accelerate the downside momentum toward its support at 1.1186.

Resistance: 1.1357, 1.1462, 1.1548

Support: 1.1186


Economic Data

Currency

Data

Time (GMT + 8)

Forecast

JPY

Tankan Large Manufacturers Index (Q4)

07:50

19

JPY

Tankan Large Non-Manufacturers Index (Q4)

07:50

6

VT Markets Notification of Server Upgrade

Dear Client,

As part of our commitment to providing the best reliability and service to our client, we are planning an upgrade in our server on December 11th 2021.

As a result, we will be conduct maintenance according to the schedule below.
Start date and time: 2021-12-11 13:00 GMT+2(Server time)
End date and time: 2021-12-11 19:00 GMT+2(Server time)

Kindly be reminded that the following things might be affected during this maintenance period:

1. The login and operation of the client portal

2. The login of the trading account

3. The quotations of products will be paused. Clients might not be able to open new positions or close the held positions.

4. There might be a gap between the original price and the price after maintenance. Pending orders, Stop Loss, and Take Profit settings within the gap will be filled at the market price after maintenance ends.

After the upgrade, clients can login to trading account using the server which is shown in the account activation mail.

No action is required by our client. Your service will be back online after the maintenance is completed.

Thank you for your patience and understanding with regard to this important initiative.

If you’d like more information, please don’t hesitate to contact [email protected].

Market Focus

US stock declined on Thursday, ending its three day winning streak. Investors now worried about that the restrictions to stop the spread of new Omicron variant could harm the economic recovery. A study has found that new Omicron is 4.2 times more transmissible than the delta variant in its early stages. On top of that, UK PM Boris Johnson announced that the UK would started to reimpose Covid-19 restrictions on everyday life and people are encouraged to work from home. Investors now await the key US inflation data on Friday, which might provide some clues on the pace of bond tapering.

The benchmarks, S&P 500 and Nasdaq both dropped on Thursday as market sentiment soured and the bearish news about rising Omicron fears acted as a headwind for the equity markets. S&P 500 was down 0.7% on a daily basis and the Nasdaq 100 declined with a 1.5% loss for the day. Nine out of eleven sectors stayed in negative territory as the consumer discretionary and real estate sectors are the worst performing among all groups, losing 1.70% and 1.36%, respectively. The Dow Jones Industrial Average was little changed on Thursday.

一張含有 文字 的圖片

自動產生的描述

In Asia, China Evergrande Group and Kaisa Group Holdings Ltd. officially defaulted on their dollar debt, and the China authorities have made it clear that they have no intention of bailing out the Evergrande Group to prevent scenarios of an collapse. Moreover, the People’s Bank of China raised its foreign currency reserve requirement ratio for a second time this year.

Main Pairs Movement:

The US dollar edged higher on Thursday, staying in positive territory amid risk-off market sentiment. The DXY index gained bullish momentum and touched a daily top above 96.3 level during American session, but pulled back slightly and surrendered some of its intraday gains at the end of the day. Markets focus now shift to US Core CPI reports on Friday, as the Fed said it would be appropriate to discuss speeding the QE taper at next week’s meeting due to rising inflation pressure.

GBP/USD advanced on Thursday, climbing towards 1.322 area and recovered from yearly lows that touched earlier this week, despite UK promoted the work-from-home culture on Omicron variant threat. Meanwhile, EUR/USD dropped to daily lows below 1.129 level and posted a 0.47% loss on a daily basis, as investors now await the ECB monetary policy meetings next week.

Gold dropped to $1775 area amid Covid-19 restrictions spurred by the Omicron variant’s rapid spread. The recovery witnessed in greenback also weighed on the precious metal, which slided 0.48% on a daily basis. WTI oil tumbled 2.78% for the day, ending its previous rally. Covid-19 restrictions and the spread of the omicron variant both decreased the oil demand, dragging oil prices lower.

Technical Analysis:

AUDUSD (4- Hour Chart)

AUDUSD witness a turnaround from a two- week high as hawkish Fed expectations have renewed US dollar buying. Moreover, the US dollar regains strength after the economic data, initial jobless claims, has shown a better- than- expected result. In the meantime, the latest US CPI report on this Friday will heavily influence the US dollar price dynamics. From the technical perspective, the 4- hour outlook remains bullish as it has not yet fell within the bearish channel. The pair fails to challenge the resistance of 0.7170, giving the pair potentials to consolidate in the range of 0.7170 and 0.7116. The downside momentum is limited as the RSI is clear from the overbought condition while the MACD is still positive. The pair needs to fall below the support of 0.7116 and the midline of Bolliger Band to present a negative level

Resistance: 0.717, 0.7227

Support: 0.7116, 0.6997

BTCUSD (Daily Chart)

The Bitcoin hashrate, which is a measure of computing power, has almost recovered to its level in May when Chinese government started a crackdown on the mining industry. From the technical perspective. Bitcoin’s bulls have attempted to recover after hitting its support level at $46,510 last week, but it seems to hit a curb after reclaiming the psychological resistance at $50,000. The daily outlook looks bearish as it continues to trade below the ascending trendline, re- challenging its support at $46,510. Bitcoin’s bulls need to defend its support level in order to keep a further bullish correction alive. If it fails to defend, then the bearish momentum can go further toward the next support at $39,566. However, as the RSI indicator has almost reached the oversold territory, the bearish price action might fade soon. In the meantime, Bitcoin has reached the lower bounce of Bollinger Band, suggesting a pullback. To the upside, Bitcoin needs to climb above the acceptance level at $55,103 in order to regain strength; otherwise, its daily outlook remains bearish.

Resistance: 55,103, 58,000, 68,991

Support: 46,510, 39,566, 32,621

EURUSD (4- Hour Chart)

EURUSD declines below 1.1300 after the market is anticipating over a potential increase in the APP at its meeting next week. Dovish ECB headlines weigh on the euro dollar. At the same time, the US dollar rebounds amid a cautious mood on the new variant Covid. From the technical perspective, EURUSD trades below its 20 and 50- day SMAs, losing its positive momentum on the 4- hour chart, but still not yet claiming an upcoming decline as the MACD indicator is still positive, lending supports to bulls. In the same chart, if the currency pair remains below the SMAs, then it might head to the support at 1.1186 to extend its bearish mode. On the contrary, the pair needs to trade above the SMAs in order to reclaim and remain within positive levels.

Resistance: 1.1357, 1.1462, 1.1548

Support: 1.1186

Economic Data

Currency

Data

Time (GMT + 8)

Forecast

GBP

GDP (MoM)

15:00

0.4%

GBP

GDP (YoY) (Q3)

15:00

22.2%

GBP

Manufacturing Production (MoM) (Oct)

15:00

0.1%

EUR

ECB President Lagarde Speaks

17:05

N/A

USD

Core CPI (MoM) (Nov)

21:30

0.5%

VT Markets The Adjustment Of Weekly Dividend Notification

Dear Client,

Warmly reminds you that the component stocks in the stock index spot generate dividends. When dividends are distributed, VT Markets will make dividends and deductions for the clients who hold the trading products after the close of the day before the ex-dividend date.

Indices dividends will not be paid/charged as an inclusion along with the swap component. It will be executed separately through a balance statement directly to your trading account, the comment for which will be in the following format “Div & Product Name & Net Volume ” .

Please note the specific adjustments as follows:

Note: The above data is for reference only, the actual execution data may be changed, please refer to the MT4/MT5 software for details.

If you’d like more information, please don’t hesitate to contact [email protected].

Market Focus

After the last two consecutive days of impressive rally, the market was relatively quiet on Wednesday. U.S. stocks have been hesitant after determining their direction in the first hour of opening. At the end of the market, the Dow Jones Industrial Average rose 0.10% to 35,754.76 points, the S&P 500 index rose 0.31% to 4,701.22 and the Nasdaq Composite Index, rose 0.45% to 15,757.04 points. In the absence of economic data, the index has no additional impetus, but the number of initial jobless claims and CPI will be announced in the next two days, which may provide some momentum for the index trend. In the bond market, the 10-year Treasury bond yield rose to 1.528%, the third consecutive rise. Investors are waiting for the Fed’s meeting next week to see whether officials will accelerate the pace of reducing asset purchases.

一張含有 文字 的圖片

自動產生的描述

In the S&P 500 index sector, the communications services sector and the healthcare sector were the two biggest winners on Wednesday. In the communications sector, Roku Inc. and Stagwell Inc. rose 18.23% and 10.28%, respectively. On the other hand, in the Nasdaq Composite Index, which is dominated by technology stocks, Apple’s stock price rose 2.28% to a record high, Meta rose 2.4%, and Zillow Group rose 4.25% to lead the rise of technology stocks.


Main Pairs Movement:

Since the opening of the London trading hours, the U.S. dollar has been weakening, but it closed stronger than most major competitors. Currently, market full of the anxiety on the new coronavirus, Omicron, trading has been fluctuating throughout the day. At present, the market is still full of anxiety about the new coronavirus Omicron, and the trading market fluctuates throughout the day. With the escalation of infectious diseases in Europe, France, the United Kingdom and Germany announced restrictions. Fortunately, Pfizer stated that its booster injection of the coronavirus vaccine is effective for the Omicron variant.

Despite the lack of macroeconomic data release, the EUR/USD has recently rebounded to the 1.1350 area, while the AUD/USD has returned to above the 0.71435 level and continues to try to return to the 0.72 area.

After the British Prime Minister announced his so-called “Plan B” to contain the latest coronavirus outbreak. GBP/USD weakened and maintained a downward trend, and may continue to refresh the lowest level this year.

Gold is still at a familiar level and is currently trading at approximately $1,786.00 per troy ounce. Crude oil prices rose slightly, and WTI is currently quoted at $72.40 per barrel.


Technical Analysis:

AUDUSD (4- Hour Chart)

The Aussie extends its rally, currently challenging its immediate hurdle at 0.7170. From the At present, the market is full of anxiety about the new coronavirus Omicron, and trading fluctuates throughout the day. With the escalation of infectious diseases in Europe, France, the United Kingdom and Germany announced restrictions.

On the other hand, Pfizer stated that the booster injection of its coronavirus vaccine is effective for the Omicron variant. Early studies have shown that people who have been infected with the new coronavirus and have been vaccinated twice or the third dose are highly protected by the highly mutated virus strain. From a technical aspect, the outlook of AUDUSD turns upside after it breaches the bearish channel on the 4- hour chart. The pair is facing the critical resistance at 0.7170; the breach of the latter will expose a one- month down slope trendline, previous resistance- turned- support. Nonetheless, the breach would be difficult as the RSI has hit the overbought territory and the pair has reached the upper bounce of Bollinger Band, suggesting a pullback. To the downside, if the pair fails to break 0.7170 level, then it is expected to head toward 0.7116 for an adjustment. On the contrary, if the pair successfully penetrates 0.7170, then it is expected to head further north, toward 0.7227.

Resistance: 0.717, 0.7227

Support: 0.7116, 0.6997


GBPUSD (4- Hour Chart)

The Cable plummets to fresh 2021 lows around sub- 1.3200 as the greenback recovers. In the meantime, impending Brexit risks and new variant Covid weigh on the British Pound. From the technical perspective, the outlook of GBPUSD looks bearish on the 4- hour chart as it continues to trade within the descending channel. Despite of hitting the lower bounce of Bollinger Band, the bearish momentum seems unstoppable as the RSI has not reached the oversold territory and the MACD is still negative. As the time of writing, the pair is aiming for the next immediate support at 1.3163 before the bearish momentum takes a break.

Resistance: 1.3321, 1.3419, 1.3499, 1.3578

Support: 1.3163


EURUSD (4- Hour Chart)

EURUSD recovers the 1.1300 threshold while the US 10- year yield hovers around 1.5%. From the technical perspective, the pair turns bullish in the near term since the pair is currently extending above the 20 and 100 simple moving averages in the 4- hour chart, but not yet overcoming its resistance at 1.1357. The pair needs to trade above the acceptance level at 1.1357 to maintain its bullish trend. At the moment, the RSI indicator has not yet crossed the overbought line, providing more rooms to extend further north; in the meantime, the bullish momentum is supported by the positive MACD. To the downside, if the pair falls below its 20 and 100 simple moving averages, then it might head toward its support at 1.1186, turning back to the bearish mode.

Resistance: 1.1357, 1.1462, 1.1548

Support: 1.1186


Economic Data

Currency

Data

Time (GMT + 8)

Forecast

CNY

CPI (MoM) (Nov)

09:30

0.3%

CNY

CPI (YoY) (Nov)

09:30

2.5%

CNY

PPI (YoY) (Nov)

09:30

12.4%

USD

Initial Jobless Claims

21:30

215K

Market Focus

US stock advanced on Tuesday, making the biggest rally in nine months amid risk-on market sentiment. Investors’ mood turned more upbeat this week as several health experts have said that Omicron symptoms appear milder, and the variant seems won’t derail the global economic recovery. However, the new restrictions to stop the spread of Omicron could still put some pressure on market mood. Meanwhile, US Treasury yields surged on the back of the market’s optimism, with the 10-year Treasury note yielding 1.48% by the end of the day.

The benchmarks, S&P 500, Dow Jones and Nasdaq both rose on Tuesday as risk assets recovered and the encouraging news about easing Omicron fears acted as a tailwind for the equity markets. S&P 500 was up 2.1% on a daily basis and the Dow Jones Industrial Average climbed with a 1.4% gain for the day. All eleven sectors stayed in positive territory as the information technology and consumer discretionary sectors are the best performing among all groups, rising 3.51% and 2.36%, respectively. The Nasdaq 100 gained the most with 3%.

一張含有 文字 的圖片

自動產生的描述

In Asia, China has pledged measures to support economic growth. Moreover, China’s Trade Balance has eased to $71.72B while the Exports improved from 17.2% to 22.0%, led by a record on external demand and an easing power crunch. In Australia, the RBA decided to keep the benchmark rate unchanged at 0.1% and the weekly bond purchases of $4.0 billion intact until at least mid-February 2022, which is in line with market expectations.


Main Pairs Movement:

The US dollar edged higher on Tuesday, staying in positive territory amid upbeat market sentiment. The DXY index gained bullish traction and touched a weekly high near 96.6 area, but then started to see some selling while surrendered most of its intraday’s gains during American session. Markets now become more optimistic that Omicron will not derail the global economic recovery. However, it’s still too early to say as long as the omicron strain remains a new source of uncertainty.

GBP/USD declined on Tuesday, dropping below 1.325 level amid steady US dollar across the board. The pair reached a daily top in early European session but failed to preserve its bullish momentum. EUR/USD also dropped to a daily low below 1.123 level, as the EU Q3 GDP data failed to impress and made the EUR was the weakest USD rival, losing 0.13% on a daily basis.

Gold recovered some of Monday’s losses and edged higher to $1785 area, holding steady amid upbeat market mood and positive Omicron related-news. The precious metal is now rising 0.13% on a daily basis. WTI oil stayed in positive territory and surged 2.48% for the day, supporting by upbeat sentiment and the fact that the EIA raised its forecast for 2022 world oil demand growth by 200K barrels per day in its latest report.


Technical Analysis:

AUDUSD (4- Hour Chart)

The Aussie rebounds from sub- 0.70000 region for the second successive day. From the technical point of view, the pair looks bullish in the near term as its intraday outlook has breached the bearish channel. The upside momentum is expected to continue, heading toward the immediate hurdle at 0.7116. Afterward, the momentum might need to adjust as the pair is going to hit the upper bounce of Bollinger Band while the RSI is going to reach the overbought condition, due to a pullback.

Resistance: 0.7116, 0.717, 0.7227

Support: 0.6997


BTCUSD (Daily Chart)

Bitcoin edges higher for a third successive day following a devastating weekend’s slump. From the technical aspect, Bitcoin seems to be ready to test its immediate barrier at $55,000. Even though the near term outlook of Bitcoin remain bearish as it still falls below the bullish trend, the upside momentum is supported by the oversold RSI, which is currently at the 30ish mark. Bitcoin needs to climb above $55,000 in order to regain strength. If Bitcoin fails to break through and falls below its support at $46,510, then it will accelerate toward $39,566.

Resistance: 55,103, 58,000, 68,991

Support: 46,530, 39,566, 32,621


EURUSD (4- Hour Chart)

EURUSD trades at fresh weekly lows near 1.1200 region amid tepid EU data. From the technical perspective, the outlook of the pair leans to more sellers’ side on the 4- hour chart as the seller side of the MACD intensifies, reflecting strong selling interest. EURUSD is poised to accelerate its slump toward the next support at 1.1186 after it falls below its moving average. From the RSI indicator, it has not yet reached the oversold territory, providing rooms for further downside. The pair needs to climb all the way above its moving average and the midline of Bollinger Band to regain bullish momentum in the near term.

Resistance: 1.1357, 1.1462, 1.1548

Support: 1.1186


Economic Data

Currency

Data

Time (GMT + 8)

Forecast

USD

EIA Short-Term Energy Outlook

01:00

JPY

GDP (QoQ) (Q3)

07:50

-0.8%

INR

Interest Rate Decision

12:30

4%

EUR

ECB President Lagarde Speaks

16:15

USD

JOLTs Job Openings (Oct)

23:00

16.369m

CAD

BOC Press Conference

23:00

CAD

BoC Interest Rate Decision

23:00

0.25%

USD

Crude Oil Inventories

23:00

-1.885m

VT Markets Modification of Symbol name (DAX30 to DAX40)

Dear Client,

Please kindly note that one of the Indices of CFDs symbol named DAX30 will be updated to DAX40 on our platform, which will be effective from December 13th, 2021.

Please contact [email protected] if you would like more information regarding to this.

Market Focus

After the White House’s chief medical adviser, Dr. Anthony Fauci, eased concerns about the severity of the new Covid-19 virus, Wall Street decided to put aside omicron’s concerns on Monday. Besides, there are reports that China is considering easing its monetary policy. In terms of Fed policy, the latest report indicates that the central bank may announce its plan at the next meeting to withdraw from the bond purchase plan more quickly.

The Dow Jones Industrial Average rose 646.95 points to 35,227.04 points, the S&P 500 index rose 1.17% to 4,591.68. The Nasdaq Composite Index, which is dominated by technology stocks, rose 0.9% to 15,225.15 points.

一張含有 文字 的圖片

自動產生的描述

With the news that the epidemic has eased, the aviation industry finally rebounded on Monday.

The American Airlines Group rose 7.9%, US Global Jets exchange-traded fund rose 5.3% and United Airlines Holdings rose 8.3%. Moreover, the post-pandemic reopening stocks have also achieved good results, the Carnival and Royal Caribbean Cruises rose 8.0% and 8.3%, respectively. Marriott International rose 4.5%, Live Nation Entertainment rose 6.1%, and Cinemark Holdings rose 7.7%. However, in the technology sector, not as strong as other sectors, Apple rose more than 2% on Monday, while Microsoft fell 0.3%, and the leader in electric vehicles, Tesla, fell more than 5%.


Main Pairs Movement:

The U.S. dollar closed mixed on Monday. On Friday, the United States released a Nonfarm Payrolls report, which was lower than market expectations and raised doubts about further aggressive reductions in the US.

Regarding the Omicron coronavirus variant, although the virus is still spreading in many countries and communities, at the same time, there have been no deaths related to this variant so far, which raises people’s hopes for a milder illness to prevent lockdowns and restrictions, and this also avoid an economic slowdown.

The euro is one of the weakest opponents of the US dollar, closed at 1.1265 against the greenback on Monday. High-yield currencies rose slightly, with GBP/USD rising 0.23% to close at 1.32624. On the other hand, commodity-related currencies rose the most, Aussie up 0.8% and CAD went up 0.62% against the dollar. The yen and Swiss franc fell slightly due to weakening concerns, but all major currency pairs remained within familiar levels.

Gold fell slightly and closed at $1,778 per troy ounce. On the other hand, crude oil prices rose sharply with the stock market, and WTI closed at $69.70 per barrel and Brent oil closed at 73.64, both up 5%.


Technical Analysis:

XAUUSD (4- Hour Chart)

The outlook of the precious metal, Gold, remains subdued as it continues to fall within the descending channel. However, today’s bulls seems to push gold upside, toward its immediate hurdle at $1,789 and the edge of the descending trendline. Gold looks to hover around $1,780 recently as the RSI is currently neutral, setting at the 50th mark. To the upside, gold needs to breach the descending line and the 60 days- simple moving average in order to regain bullish momentum. On the contrary, if gold fails to break through the barrier, then it is expected to head toward the next support at $1,770.

Resistance: 1,780, 1,797, 1,808

Support: 1,770, 1,761


BTCUSD (Daily Chart)

Bitcoin bounces back and stands nearly $50,000 after a devastating weekend, tumbling more than 17%. From the technical perspective, the support around $49,000 looks steady and robust, Bitcoin’s bearish momentum stops here as the time of writing. The outlook of Bitcoin turns bearish on the daily chart as it has breached the ascending trendline. To the upside, Bitcoin needs to climb above the acceptance level of $55,103 to regain strength. As the time of writing, Bitcoin looks to rebound as the RSI has reached the oversold territory, which is due to a pullback. To the dowside, if the current support at $46,530 fails to hold, then Bitcoin is expected to head toward the next support at $39,566.

Resistance: 55,103, 58,000, 68,991

Support: 46,530, 39,566, 32,621


EURUSD (4- Hour Chart)

EURUSD trades below 1.1300 as the US dollar is comparably stronger. From the technical aspect, the outlook of EURUSD remains bearish on the 4- hour chart after meeting sellers around the resistance level at 1.1357. In the meantime, EURUSD continues to fall within the descending channel while it falls below its simple moving averages. It is expected to see the pair consolidates in the range from 1.1357 and 1.1.1186 as the RSI is currently in the midline, suggesting a directionless within negative levels and maintaining the risk skewed to the downside.

Resistance: 1.1357, 1.1462, 1.1548

Support: 1.1186


Economic Data

Currency

Data

Time (GMT + 8)

Forecast

GBP

BRC Retail Sales Monitor (YoY) (Nov)

08:01

N/A

GBP

Halifax House Price Index (MoM) (Nov)

15:00

N/A

GBP

Halifax House Price Index (YoY)

15:00

0.8%

USD

Exports

21:30

N/A

USD

Imports

21:30

N/A

USD

Nonfarm Productivity (QoQ) (Q3)

21:30

-4.9%

USD

Trade Balance (Oct)

21:30

-66.80B

USD

Unit Labor Costs (QoQ) (Q3)

21:30

8.3%

VT Markets Dec futures rollover announcement

Dear Client,

New contracts will automatically rolled-over as follows:

Please note:

• The rollover will be automatic, and any existing open positions will remain open.

• Positions that are open on the expiration date will be adjusted via a rollover charge or credit to reflect the price difference between the expiring and new contracts.

• To avoid CFD rollovers, clients can choose to close any open CFD positions prior to the expiration date.

• Clients should ensure that take profits and stop losses are adjusted before this rollover occurs.

If you’d like more information, please don’t hesitate to contact [email protected].

Market Focus

US stock fall last Friday amid a sharp selloff witnessed in huge technology companies, extending their weekly slide. The concerns about the new Omicron variant remained, as investors worry about that an outbreak could slowdown the recovery in global economy. Moreover, US Nonfarm Payrolls released last Friday rose by 210K in November, which is lower than market’s expectation of 550K. But the Federal Reserve is likely to follow through with faster tapering despite the dismal jod data, as the pressure of elevated inflation continues to rise.

The benchmarks, S&P 500, Dow Jones and Nasdaq both declined last Friday as the mixed US jod report increased the volatility of equity markets. S&P 500 was down 0.8% on a daily basis and the Dow Jones edged lower with a 0.2% loss for the day. Eight out of eleven sectors stayed in negative territory as the consumer discretionary and information technology sectors are the worst performing among all groups, dropped 1.84% and 1.65%, respectively. Consumer staples and utilities were the only major groups to climb higher on the day. The Dow Jones lost the most with 1.7%.

一張含有 文字 的圖片

自動產生的描述

In Asia, shares of Chinese companies traded in the US tumbled on Friday, as the The Chinese ride-hailing company, DiDi, decides to delist its American depositary shares from the New York Stock Exchange and pursue a listing in Hong Kong. The announcement adds even more uncertainty to the prospects for other US-listed Chinese firms.


Main Pairs Movement:

The US dollar edged higher last Friday, gathering some pace and retests the daily highs around 96.45 at the end of the week. After touching a fresh three-day high, the DXY index retreated to 96 level during mid American session and posted a 0.02 gain on a daily basis. The hawkish tone from Fed chair Powell continued to acted as a tailwind for the greenback, as he suggested that the Fed will discuss adopting a quicker tapering pace at the December meeting, all pointing to a rates lift-off at some point in mid-2022.

GBP/USD declined last Friday, dropping below 1.324 level amid rebounding US dollar. The pair reached a daily top in late European session but failed to preserve its bullish momentum. EUR/USD rebounded slightly amid the decline in US yields, rising 0.06% on a daily basis.

USD/JPY touched a fresh daily top after the release of US job reports, but then started to see heavy selling and dropped below 112.6 area. The pair is now trading at 112.88, rising 0.11% for the day.

Gold gained upside traction and rebounded above $1782, as the downbeat market sentiment lend some supports to the precious metal. Gold is now rising 0.02% on a daily basis. WTI stayed in negative territory and slumped 1.65% for the day.


Technical Analysis:

EURUSD (4- Hour Chart)

After previous day’s slide to 1.129 area, the pair EUR/USD consolidated in a range between 1.128 and 1.131 on Friday. The pair was flirting with 1.130 level during the Asian Session, then touched a daily high above 1.133 after US Nonfarm Payrolls released. However, the recovery witnessed in US dollar weighed on the pair, which surrendered most of its intraday gains and currently losing 0.17% on a daily basis. Nonfarm Payrolls rose by 210K in November, which is lower than market’s expectation of 550K and dragged the US dollar below 96 level right after the release. Despite the dismal data, the greenback has rebounded and posted a 0.22% gain at the moment. In Europe, European Central Bank President Christine Lagarde said that it is very unlikely to see rate hikes in 2022, therefore the dovish comments acted as a headwind for EUR/USD.

For technical aspect, RSI indicator 44 figures as of writing, suggesting tepid bear movement ahead. Looking at the MACD indicator, the MACD is now sitting below the signal line, which means a downward trend for the pair. As for the Bollinger Bands, the price is dropping out of lower band, therefore a trend continuation could be expected. In conclusion, we think market will be bearish as long as the 1.1383 resistance line holds.

Resistance: 1.1383, 1.1464, 1.1606

Support: 1.1236, 1.1186


GBPUSD (4- Hour Chart)

The pair GBP/USD declined sharply and refreshed 2021 low on Friday, staying under pressure amid renewed US dollar strength. The pair flirted with 1.329 level in early trades and edged lower during European session. After the release of US Nonfarm Payrolls, the cable touched the lowest level since December 2020 below 1.322, currently staying in negative territory with a 0.60% loss for the day. The US dollar remained its bullish traction despite downbeat NFP report, as the hawkish Fed continued to lend support to the greenback with the aspects of a rate hike in 2022. In the UK, UK Final Services PMI downwardly revised to 58.5 in November. On top of that, the UK-EU impasse over the Northern Ireland Protocol and the worsening row over the post-Brexit fishing rights both acted as a headwind for the British pound.

For technical aspect, RSI indicator 32 figures as of writing, reflecting that the bearish momentum should persist for a while before there’s a trend reversal. As for the Bollinger Bands, the price moved out of the lower band, therefore a strong downward trend continuation could be expected. In conclusion, we think market will be bearish as the pair is eyeing a test of the 1.3195 support. The next target on the downside aligns at 1.3106.

Resistance: 1.3370, 1.3514, 1.3607

Support: 1.3195, 1.3106


USDCAD (4- Hour Chart)

The pair USD/CAD advanced amid falling oil prices on Friday, rebounding back from daily lows that touched earlier in the session. The pair saw some buying and touched a daily top in mid European session, but then dropped to below 1.275 level amid dismal NFP report. USD/CAD now climbs towards 1.284 area and stays in positive territory, currently rising 0.22% on a daily basis. At the time of writing, WTI crude oil is losing 0.54% on a daily basis, as the OPEC+ decided to follow through on their plan to increase production by 400kb/d in January. The bearish news from oil market weighed on the commodity-linked loonie and pushed USD/CAD higher. In Canada, the Employment Change showed that the economy added 153.7K new jobs for November, which is a lot better than economists’ expectations of 35K.

For technical aspect, RSI indicator 57 figures as of writing, suggesting that the upside appears more favored as the RSI sits above the midline. As for the Bollinger Bands, the price rose sharply towards the upper band, therefore the bullish momentum could persist. In conclusion, we think market will be bullish as the pair is testing the 1.2849 resistance, and the next resistance sits at 1.2949.

Resistance: 1.2849, 1.2949

Support: 1.2714, 1.2645, 1.2493


Economic Data

Currency

Data

Time (GMT + 8)

Forecast

GBP

Construction PMI (Nov)

17:30

52.0

Back To Top
server

Hello there 👋

How can I help you?

Chat with our team instantly

Live Chat

Start a live conversation through...

  • Telegram
    hold On hold
  • Coming Soon...

Hello there 👋

How can I help you?

telegram

Scan the QR code with your smartphone to start a chat with us, or click here.

Don’t have the Telegram App or Desktop installed? Use Web Telegram instead.

QR code