Market Focus
Wall Street’s three major indexes rallied higher on Wednesday, as gains in the technology, basic materials and telecom sectors led stocks higher. In addition, the yield on the 10-year U.S. Treasury yield retreated from multi-year highs hit in the previous session, helping to stabilize global market sentiment and boosting demand for growth stocks. At the end of the market, the Dow Jones Industrial Average rose 0.86% to 35,768.06 points, the S&P 500 index gained 1.45% to 4,587.18 and the Nasdaq Composite Index added 2.08% to 14,490.37 points. On the other hand, the pan-European Stoxx 600 gained 1.7%, led by a 4.0% gain by automakers. Volkswagen was one of the index’s biggest gainers, up 6.1%, while its biggest investor, holding company Porsche, rose 8.2%
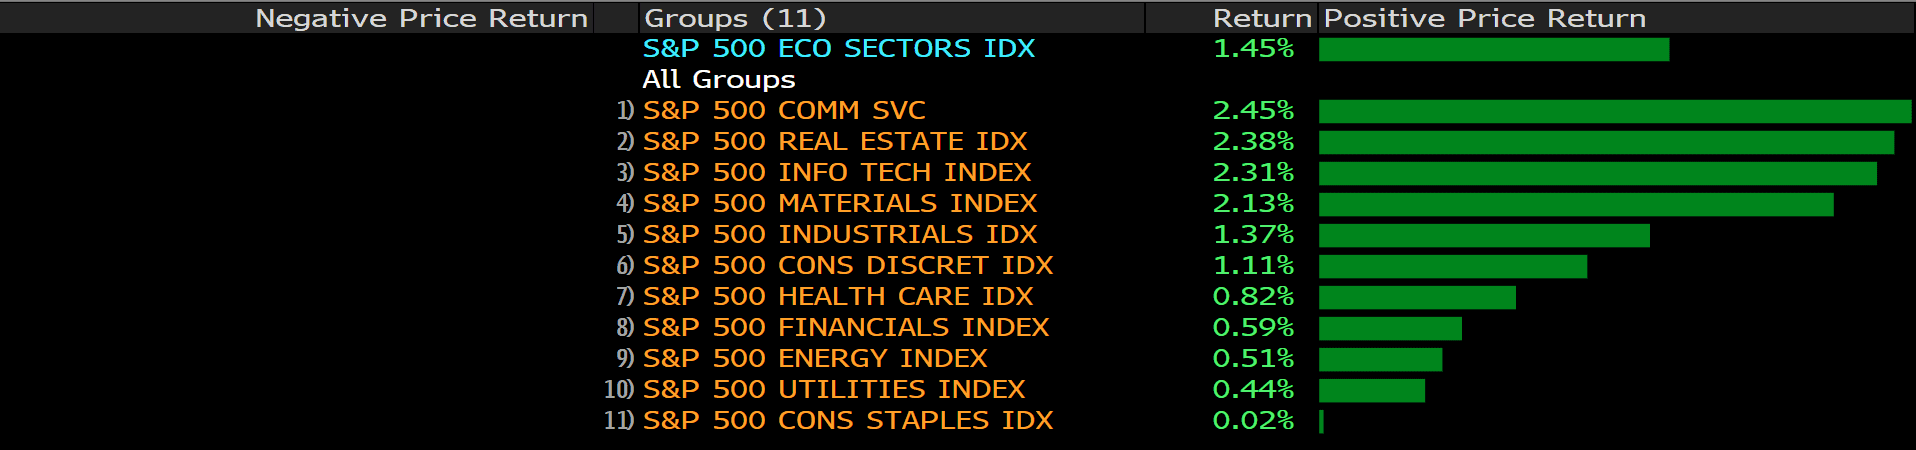
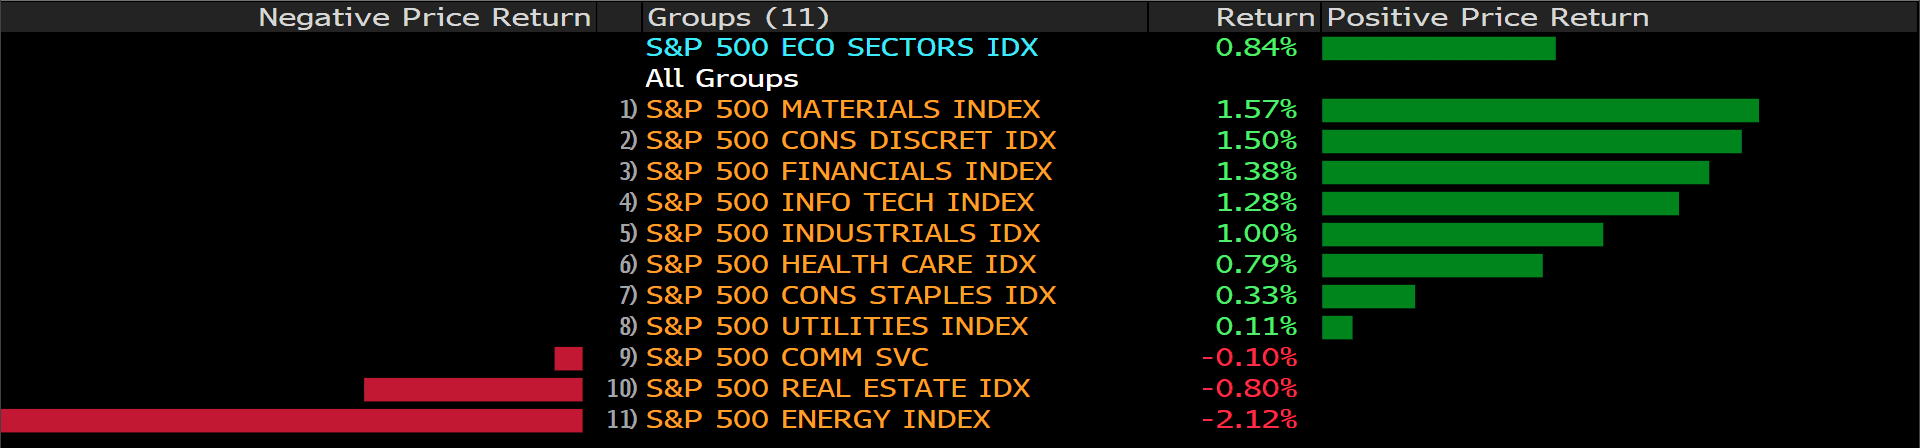
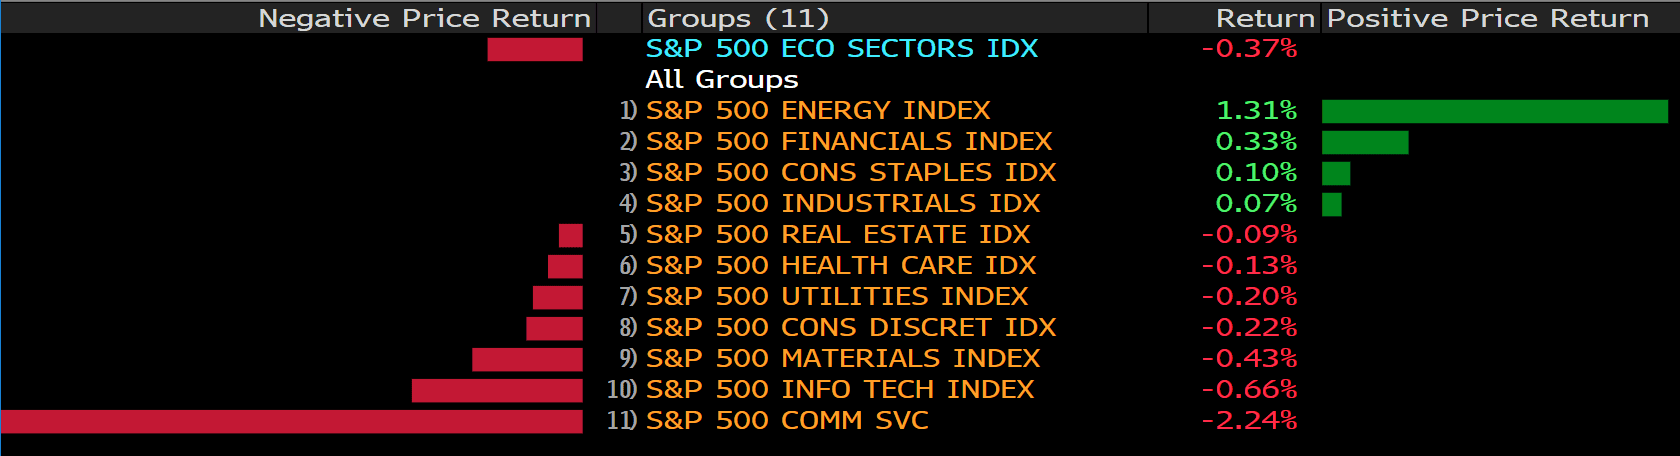
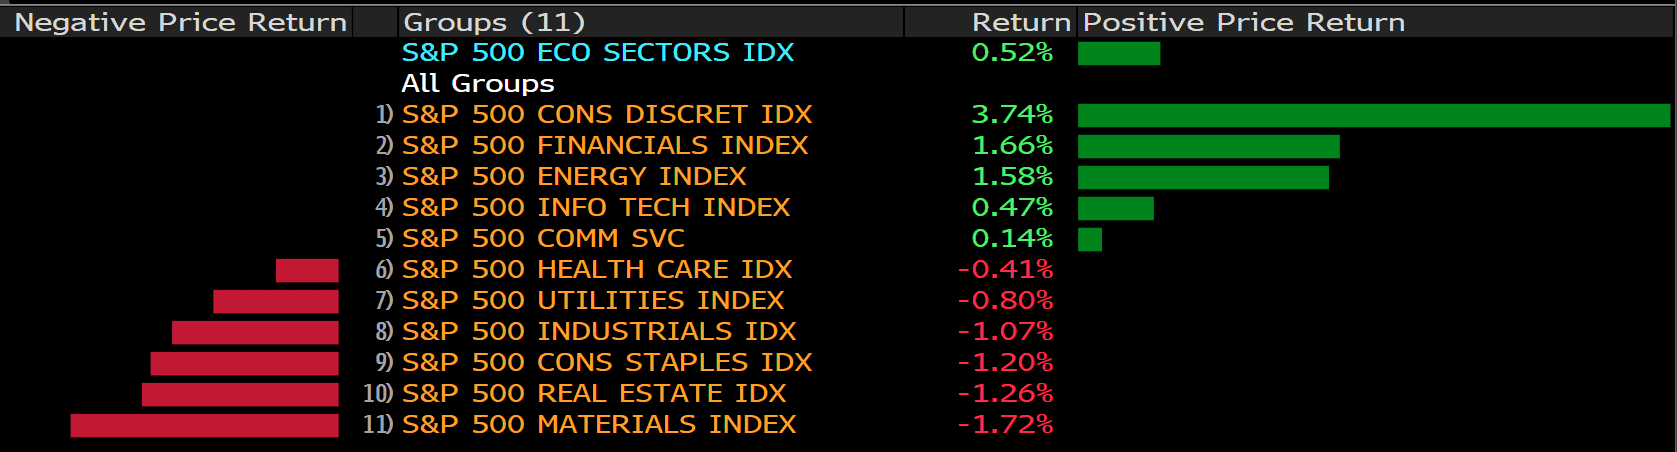
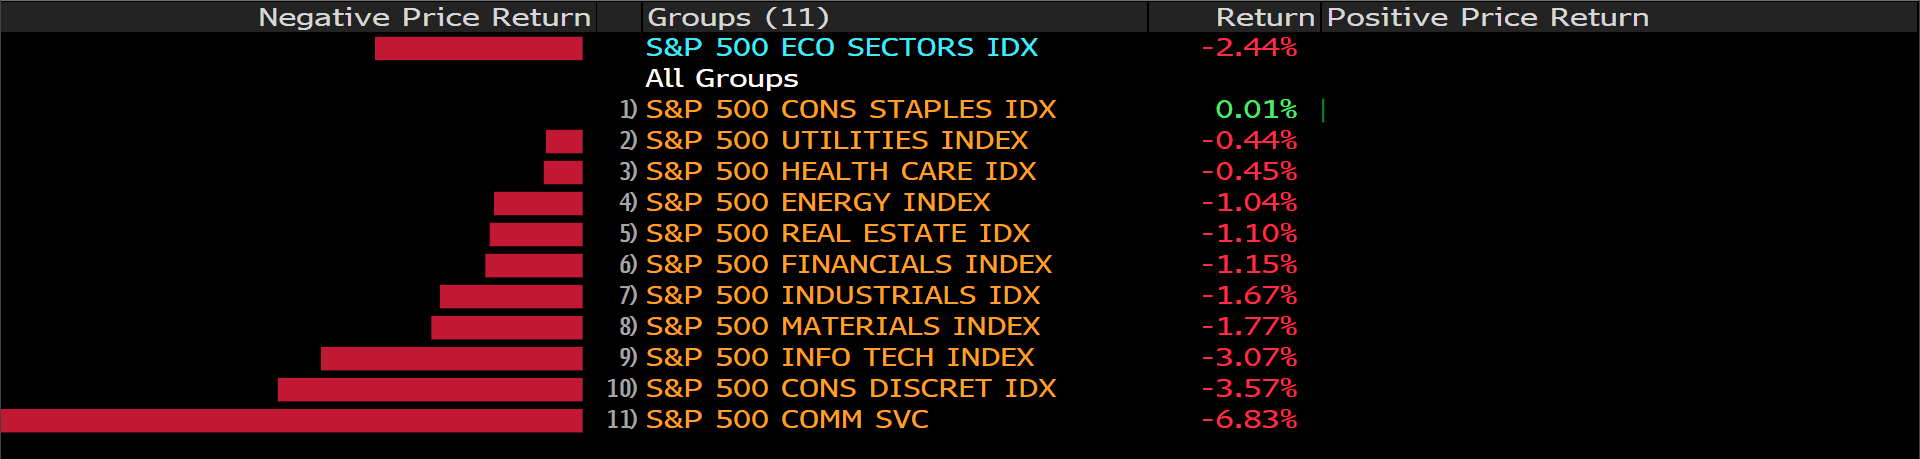
The 11 sectors of the S&P 500 performed brightly. The biggest winner was the communication services sector, which rose 2.45%, followed by the real estate, information technology and materials sectors, which rose 2.38%, 2.31% and 2.13% respectively. The best performers on the Dow were Disney, which rose 3.33%. Meanwhile, Intel was up 2.25% and Microsoft was up 2.18%. The top performers in the S&P 500 were Omnicom, Enphase Energy and Chipotle, which up 14.19%, 12.03% and 10.16% respectively. On Thursday, investors will be closely watching CPI data for clues on the Fed’s plans to raise interest rates. A surprisingly strong jobs report last week raised fears of more aggressive central bank moves.

Main Pairs Movement:
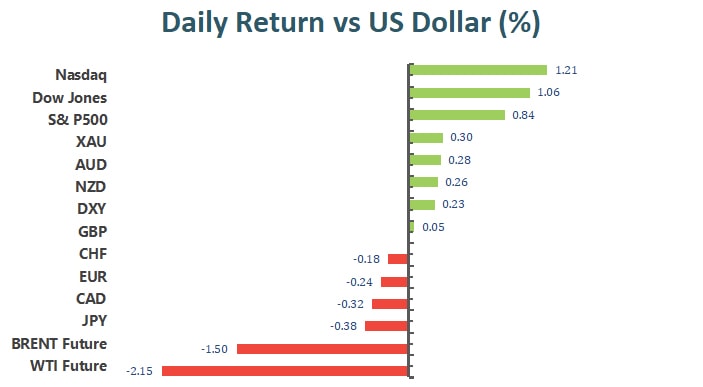
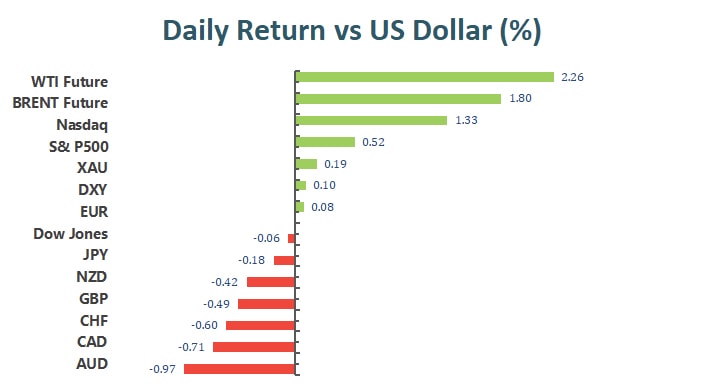
A pullback in government bond yields weighed on the dollar, which ended mixed. The U.S. 10-year Treasury yield was around 1.93%, retreat from its weekly high of 1.97%.
Sterling and the euro were unchanged in intraday trade, keeping choppy in a consolidation range. The GBP/USD trades around 1.35320, while the EUR/USD swings around 1.1420.
Commodity-related currencies were the best performers, with AUD/USD trading in the 0.7180 range, extending its three-day rally. USD/CAD also performed well, slipping to the 1.2670 area after BOC Governor Tiff Macklem made a confidence statement at the Canadian Chamber of Commerce that supply chain issues would subside soon.
Gold kept moving north and peaked $1,835.86 an ounce. Meanwhile, oil prices finally found some support after a two-day losing streak. At the end, WTI closed at $90.00 a barrel and Brent at $91.68 a barrel.
Technical Analysis:
EURUSD (4-Hour Chart)

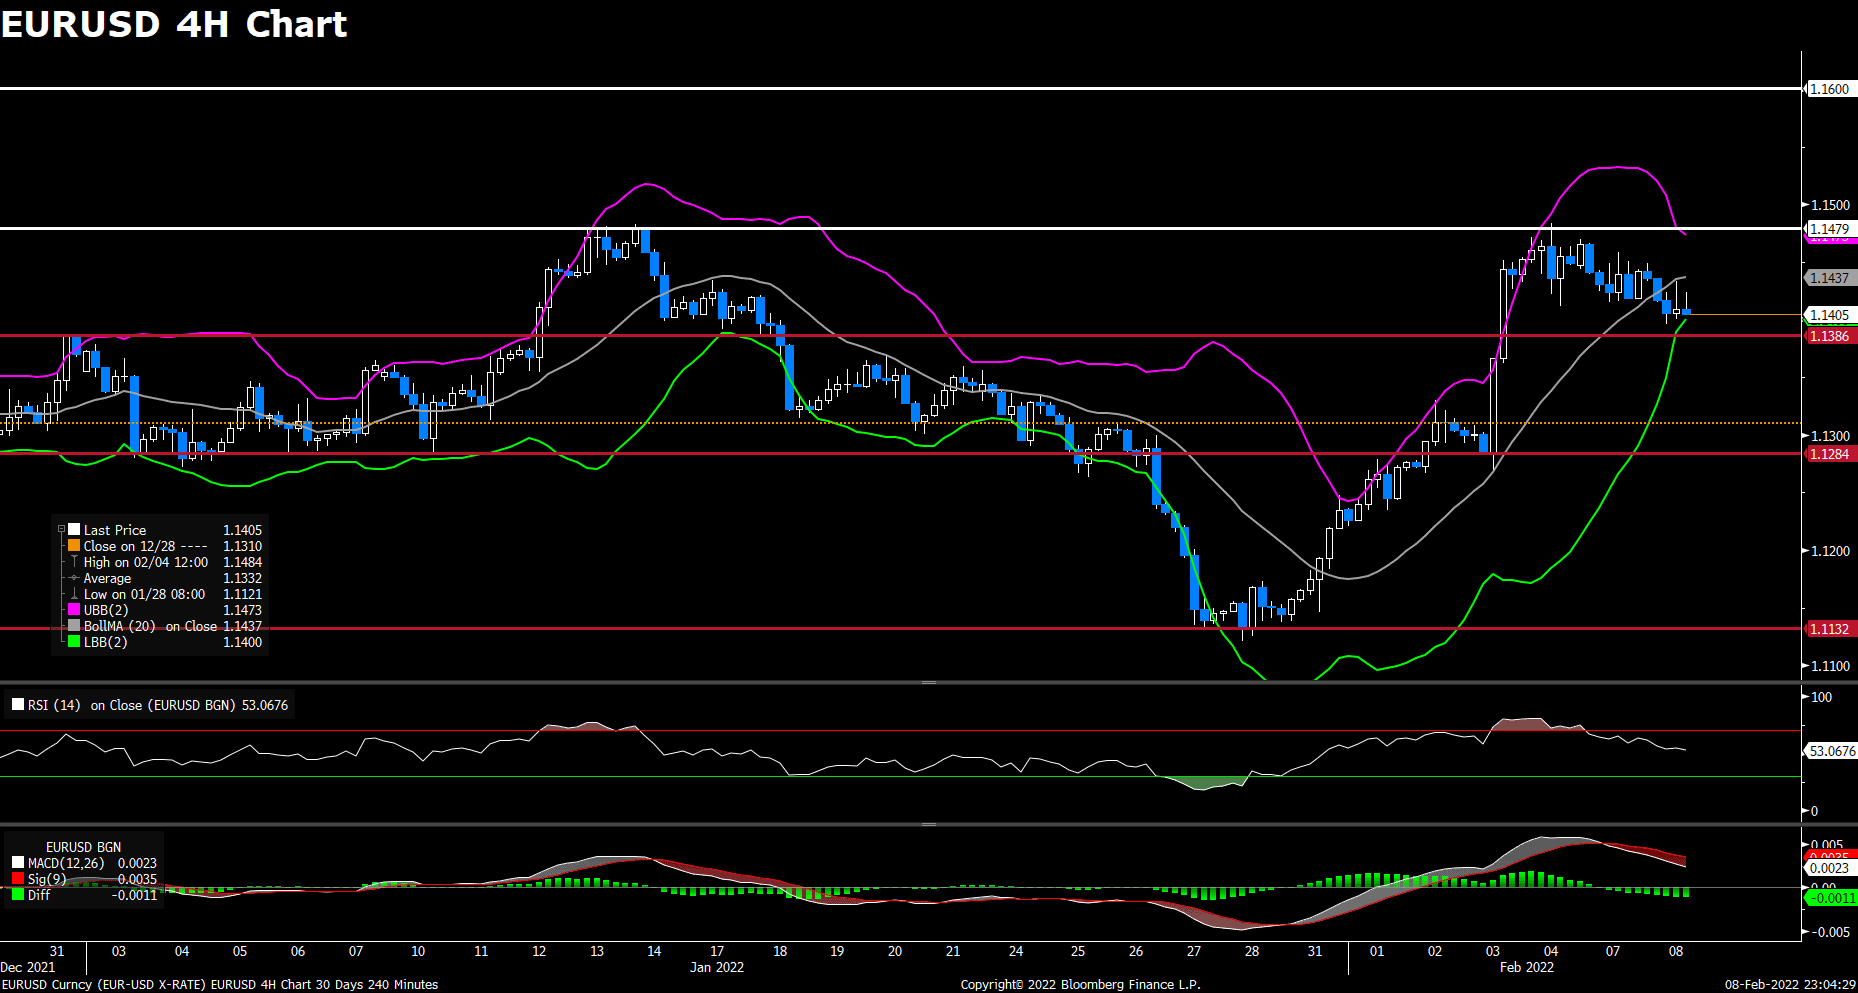
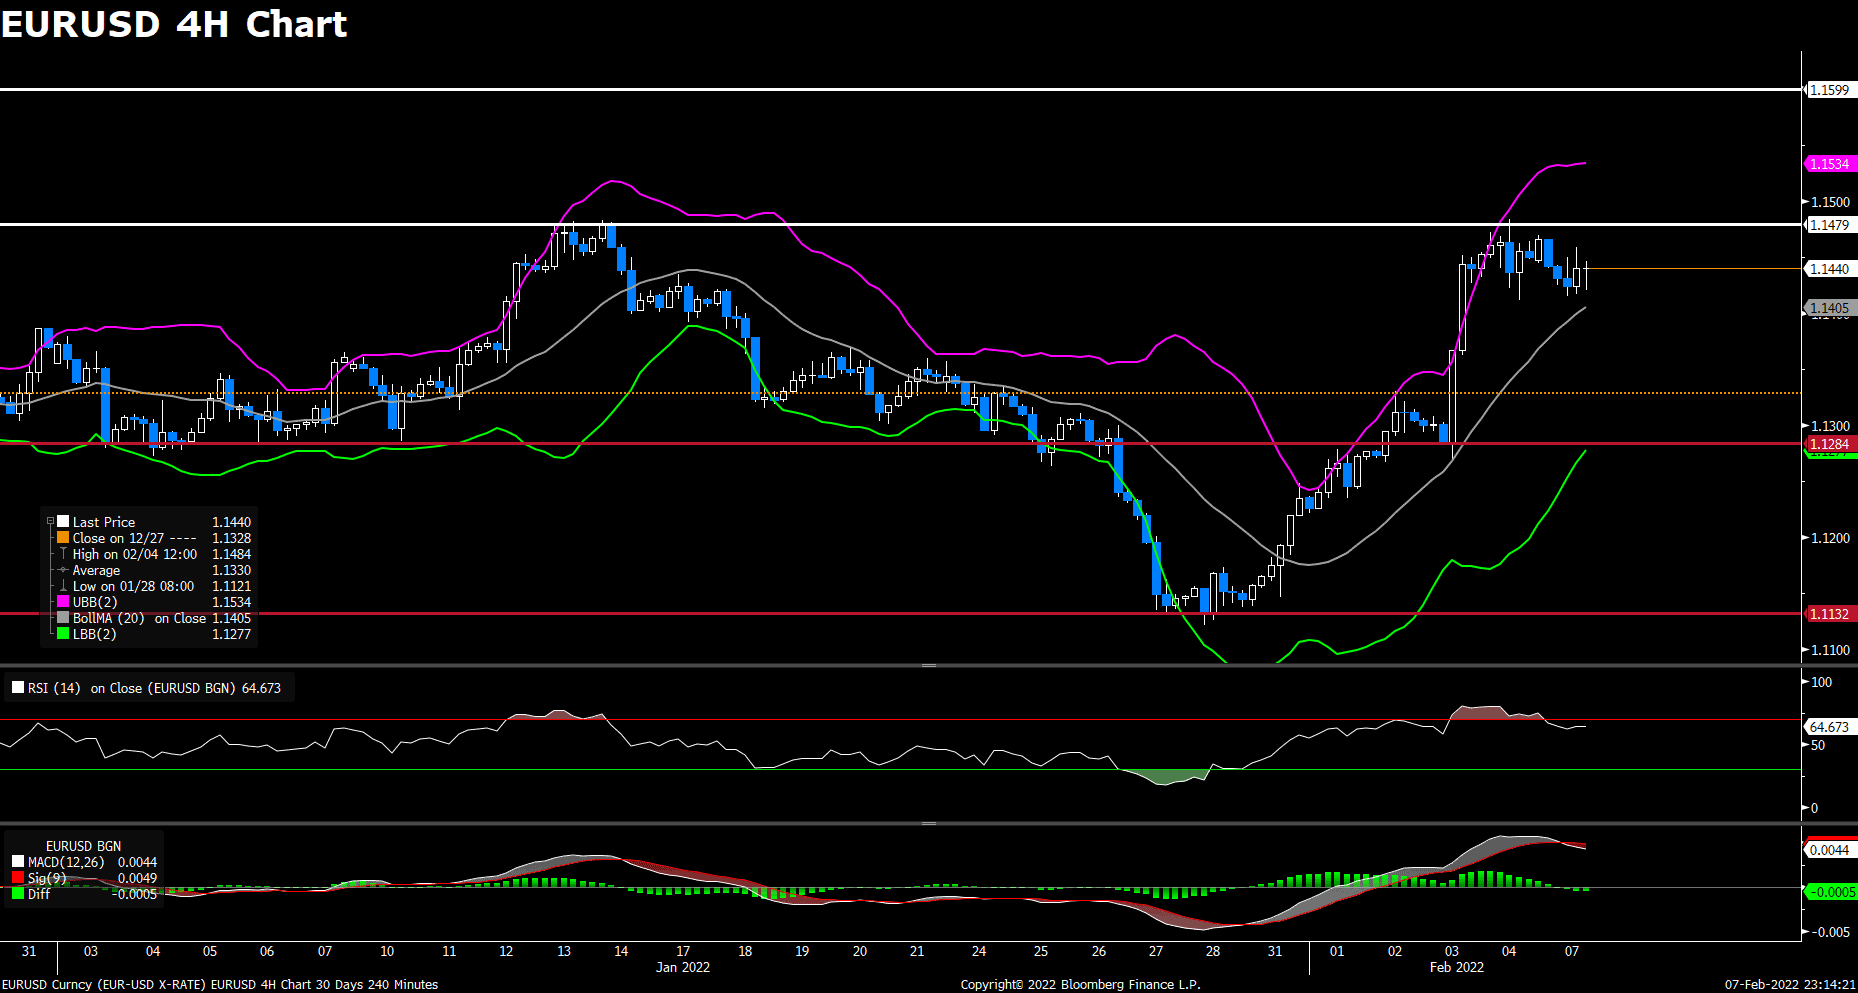
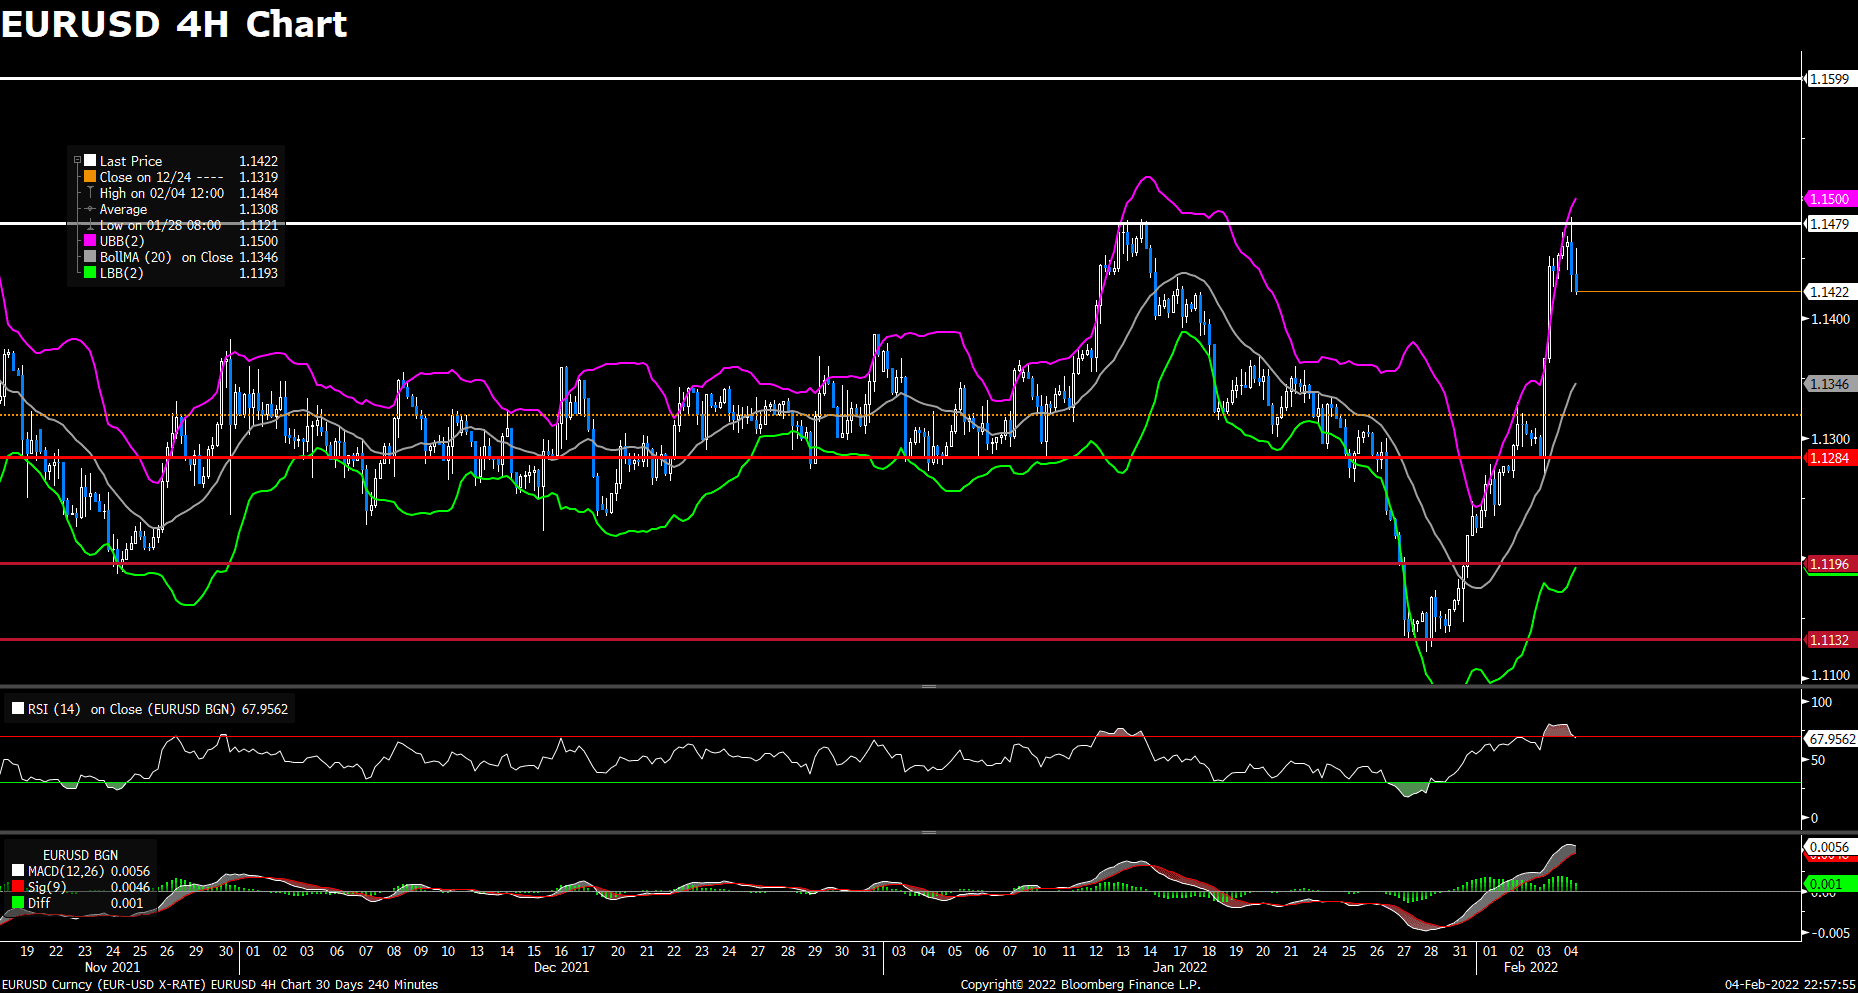
The EUR/USD pair edged higher on Wednesday, regaining some upside tractions and rebound to 1.1440 area amid US dollar weakness. The pair dropped to a daily low in early European session, but then reversed its weakness and climbed above the 1.1440 mark heading into American session. The pair was last seen trading at 1.1436, posting a 0.19% gain on a daily basis. EUR/USD stays in the positive territory amid weaker US dollar across the board, as the falling benchmark 10-year US Treasury bond yield dragged the greenback lower. However, expectations that the Fed would adopt a more aggressive policy might limit the losses for greenback and put pressure on EUR/USD. In Europe, ECB’s Governing Council Joachim Nagel said that he support a rate hike in 2022 after ending bond purchases if the inflation picture doesn’t change by March.
For technical aspect, RSI indicator 59 figures as of writing, suggesting that the upside is more favored as the RSI stays above the midline. As for the Bollinger Bands, the price is crossing above the moving average, which indicates that the pair could remain its upside traction. In conclusion, we think market will be slightly bullish as the pair might re-test the 1.1480 resistance. But the pair is now staying in a consolidation phase.
Resistance: 1.1480, 1.1612
Support: 1.1360, 1.1284, 1.1132
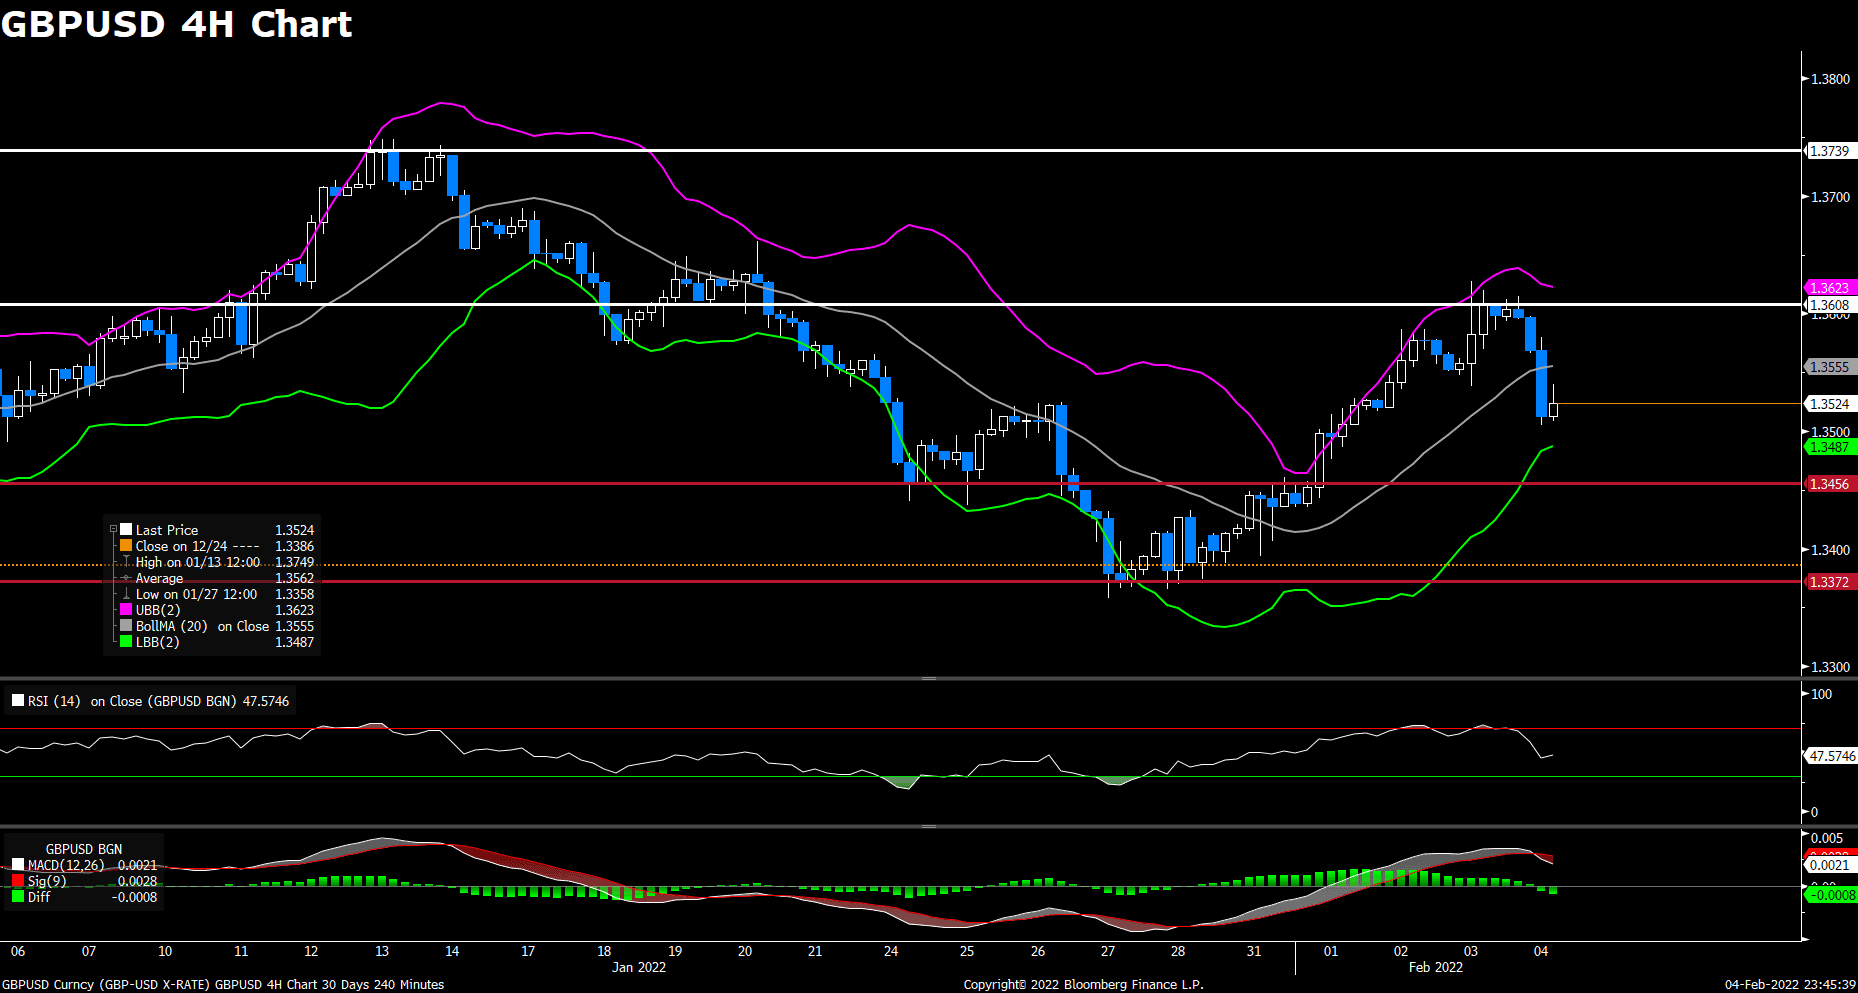
GBPUSD (4-Hour Chart)
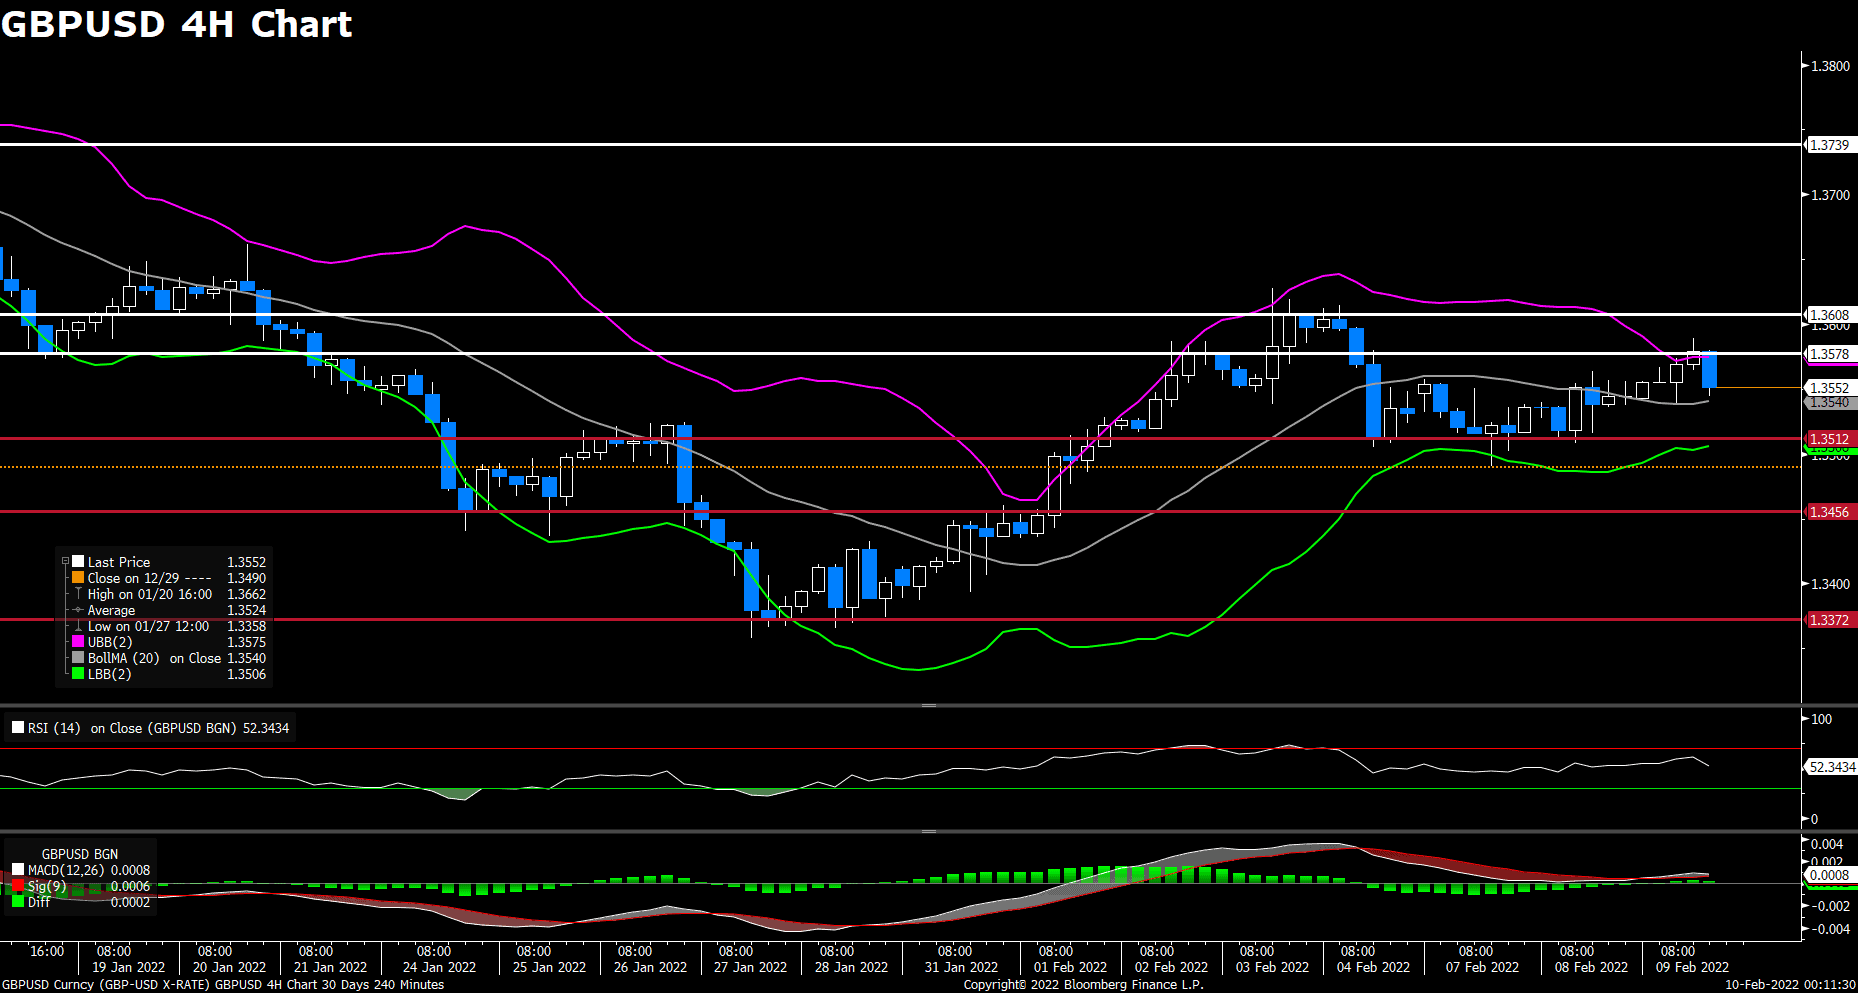
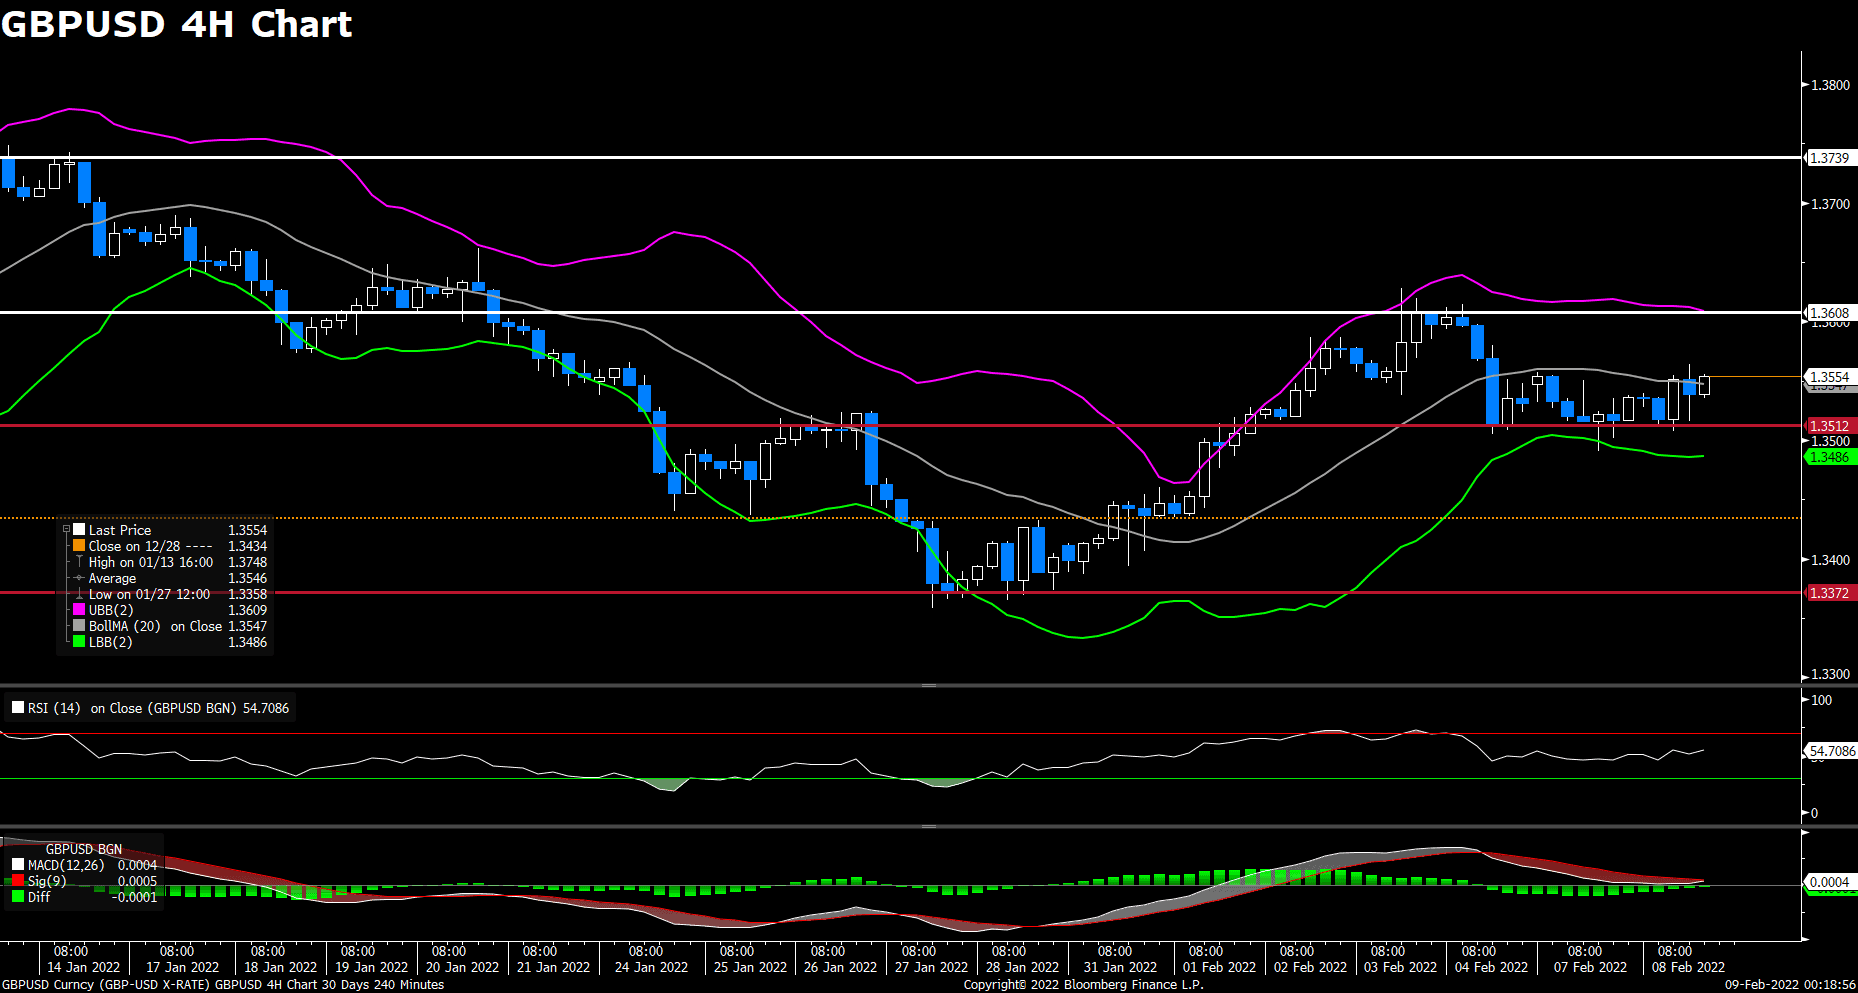
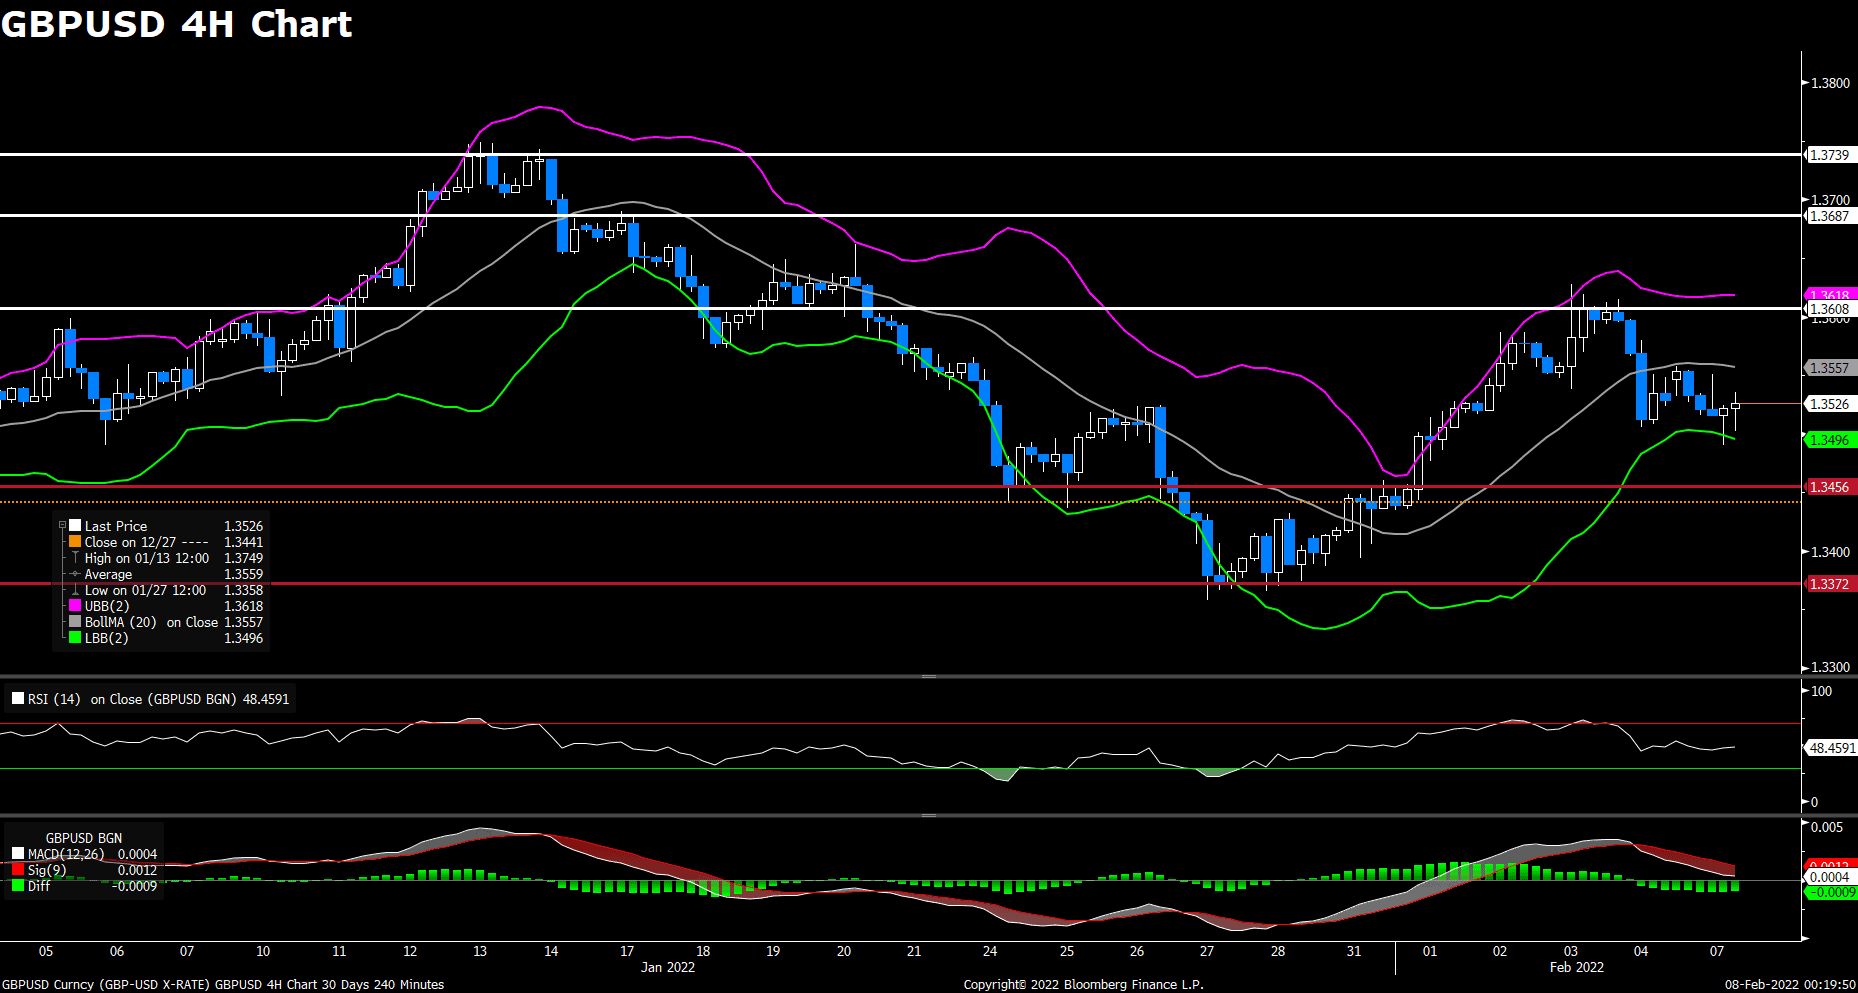
The pair GBP/USD advanced on Wednesday, surrounding by bullish momentum amid risk-on market sentiment and a sharp pullback in the US Treasury bond yields. The pair touched a fresh weekly high above 1.3585 level, then lost upside traction and surrendered some of its intraday gains. At the time of writing, the cable stays in positive territory with a 0.10% gain for the day, witnessing some fresh selling amid comments from BoE Chief Economist Huw Pill. He said that outlook for bank rate beyond coming months is uncertain, meanwhile inflation and output volatility could increase if the policy is miscalibrated. On top of that, the risk-on mood and retreating US dollar both acted as a tailwind for the cable. Market focus now shifts to US CPI data, which might influence the Fed’s monetary policy and provide trading impetus to the GBP/USD pair.
For technical aspect, RSI indicator 52 figures as of writing, showing that there is no obvious direction for the pair. As for the Bollinger Bands, the price dropped from the upper band after crossing it, so downside momentum could be expected. In conclusion, we think market will be bearish as the pair failed to break above the 1.3578 resistance. Also, traders might be reluctant to place aggressive bullish bets ahead of the US CPI report.
Resistance: 1.3578, 1.3608, 1.3739
Support: 1.3512, 1.3456, 1.3372
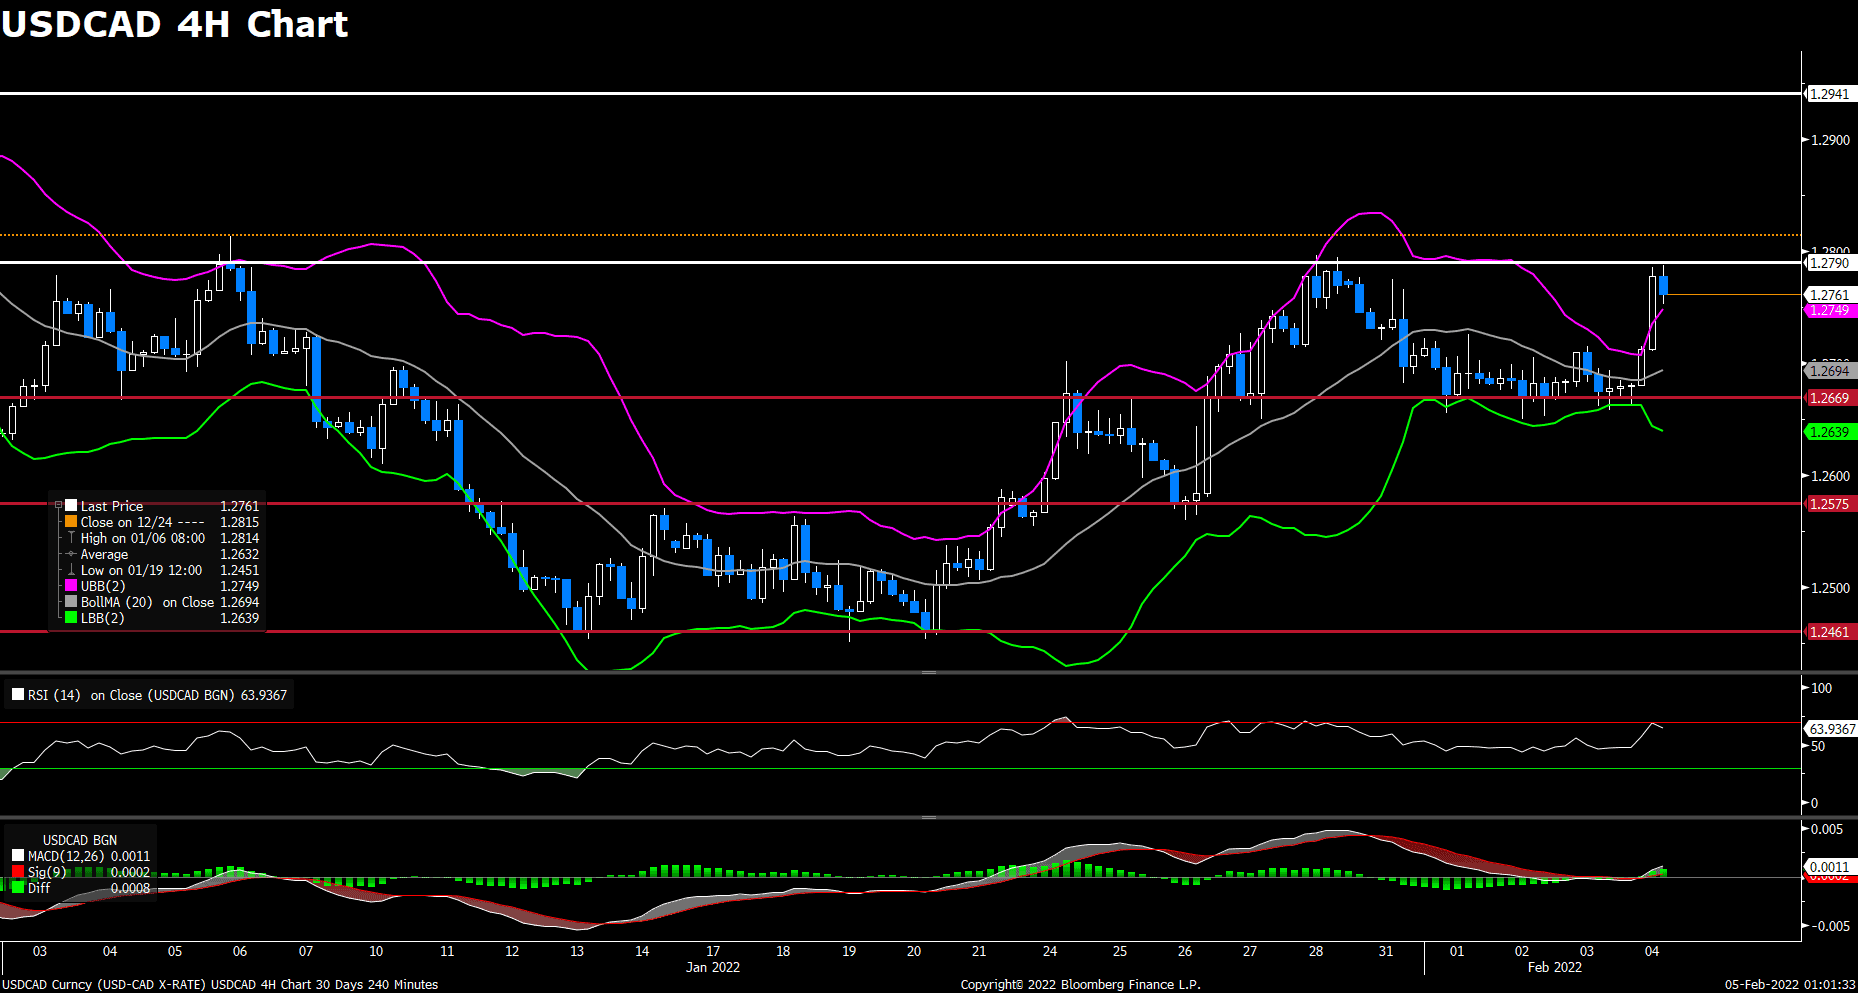
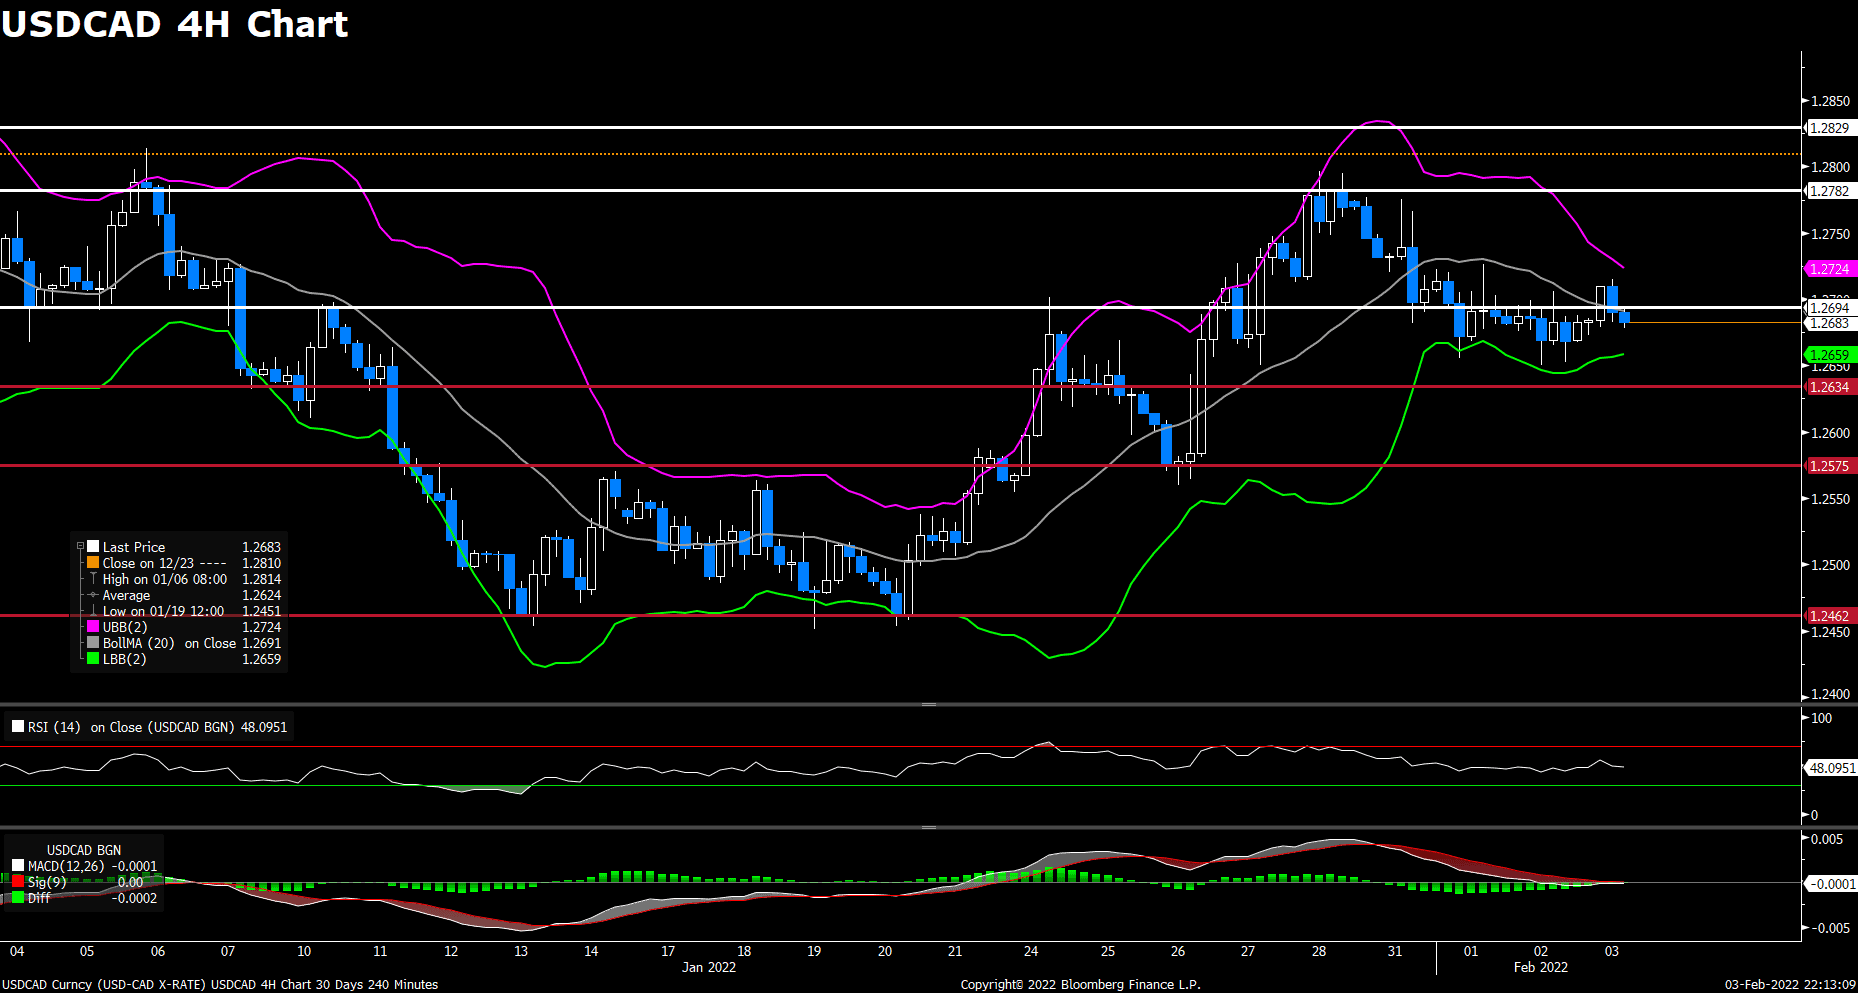
USDCAD (4-Hour Chart)
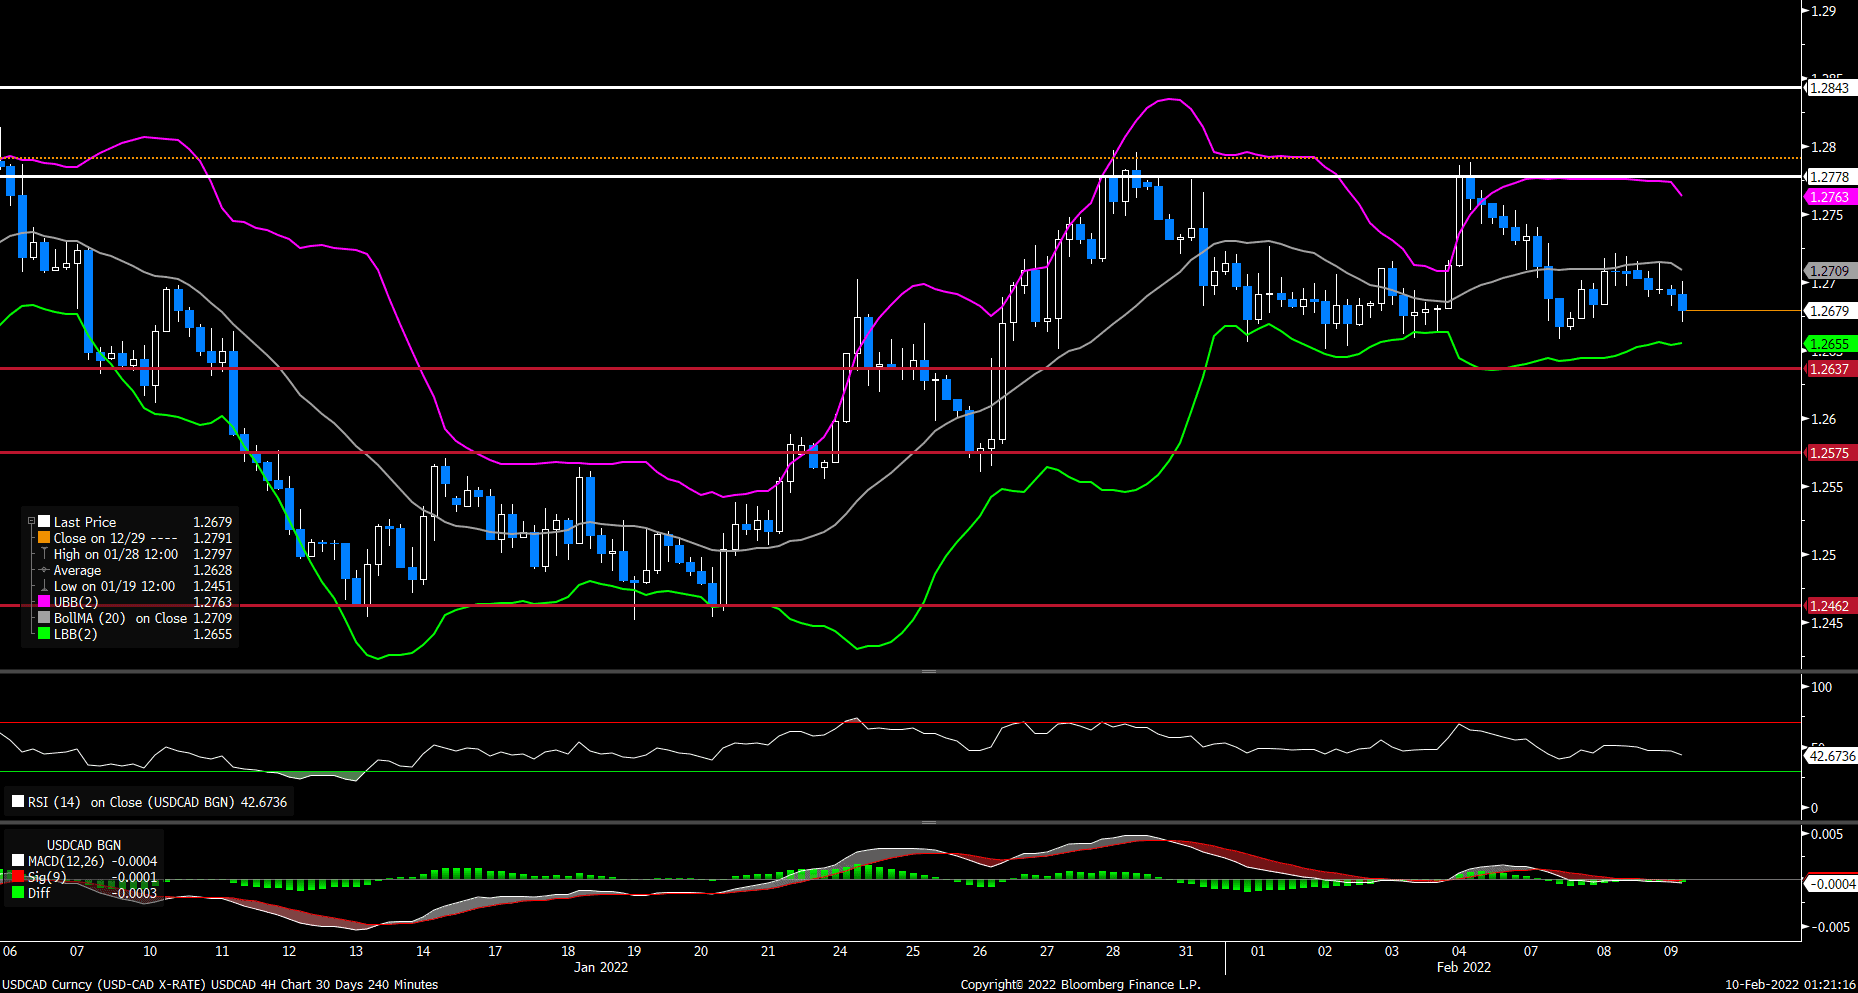
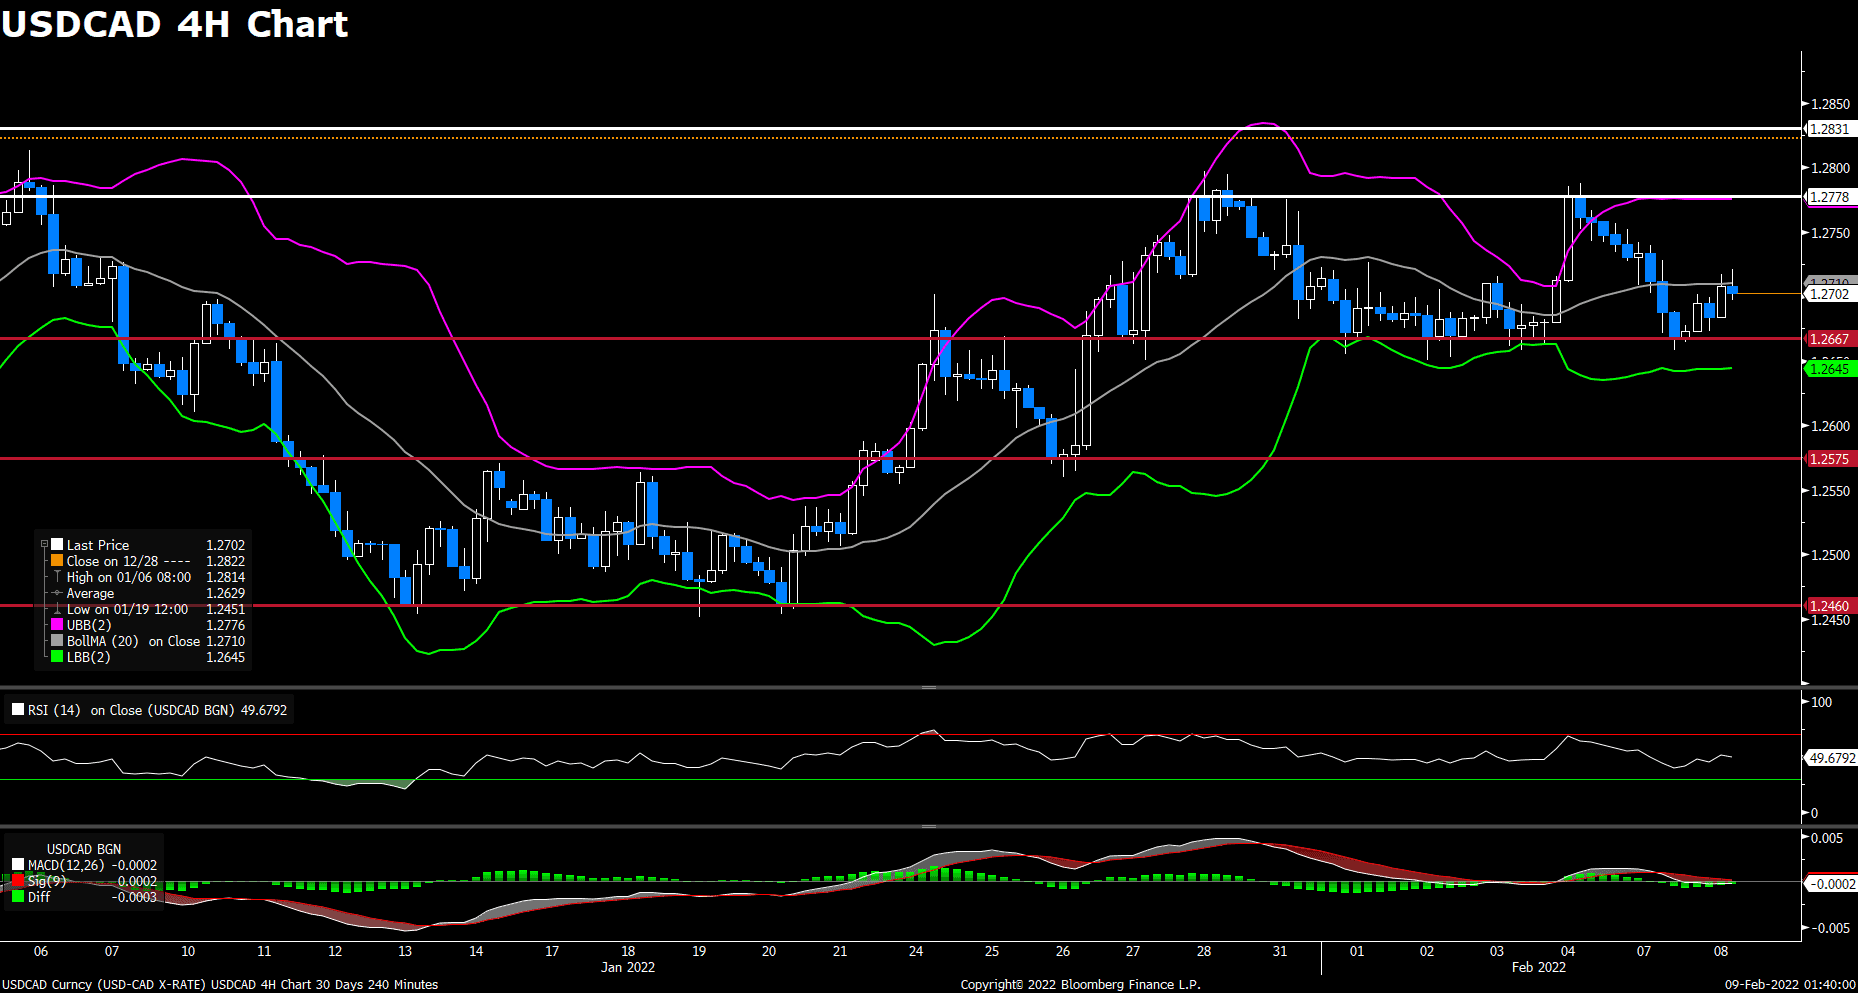
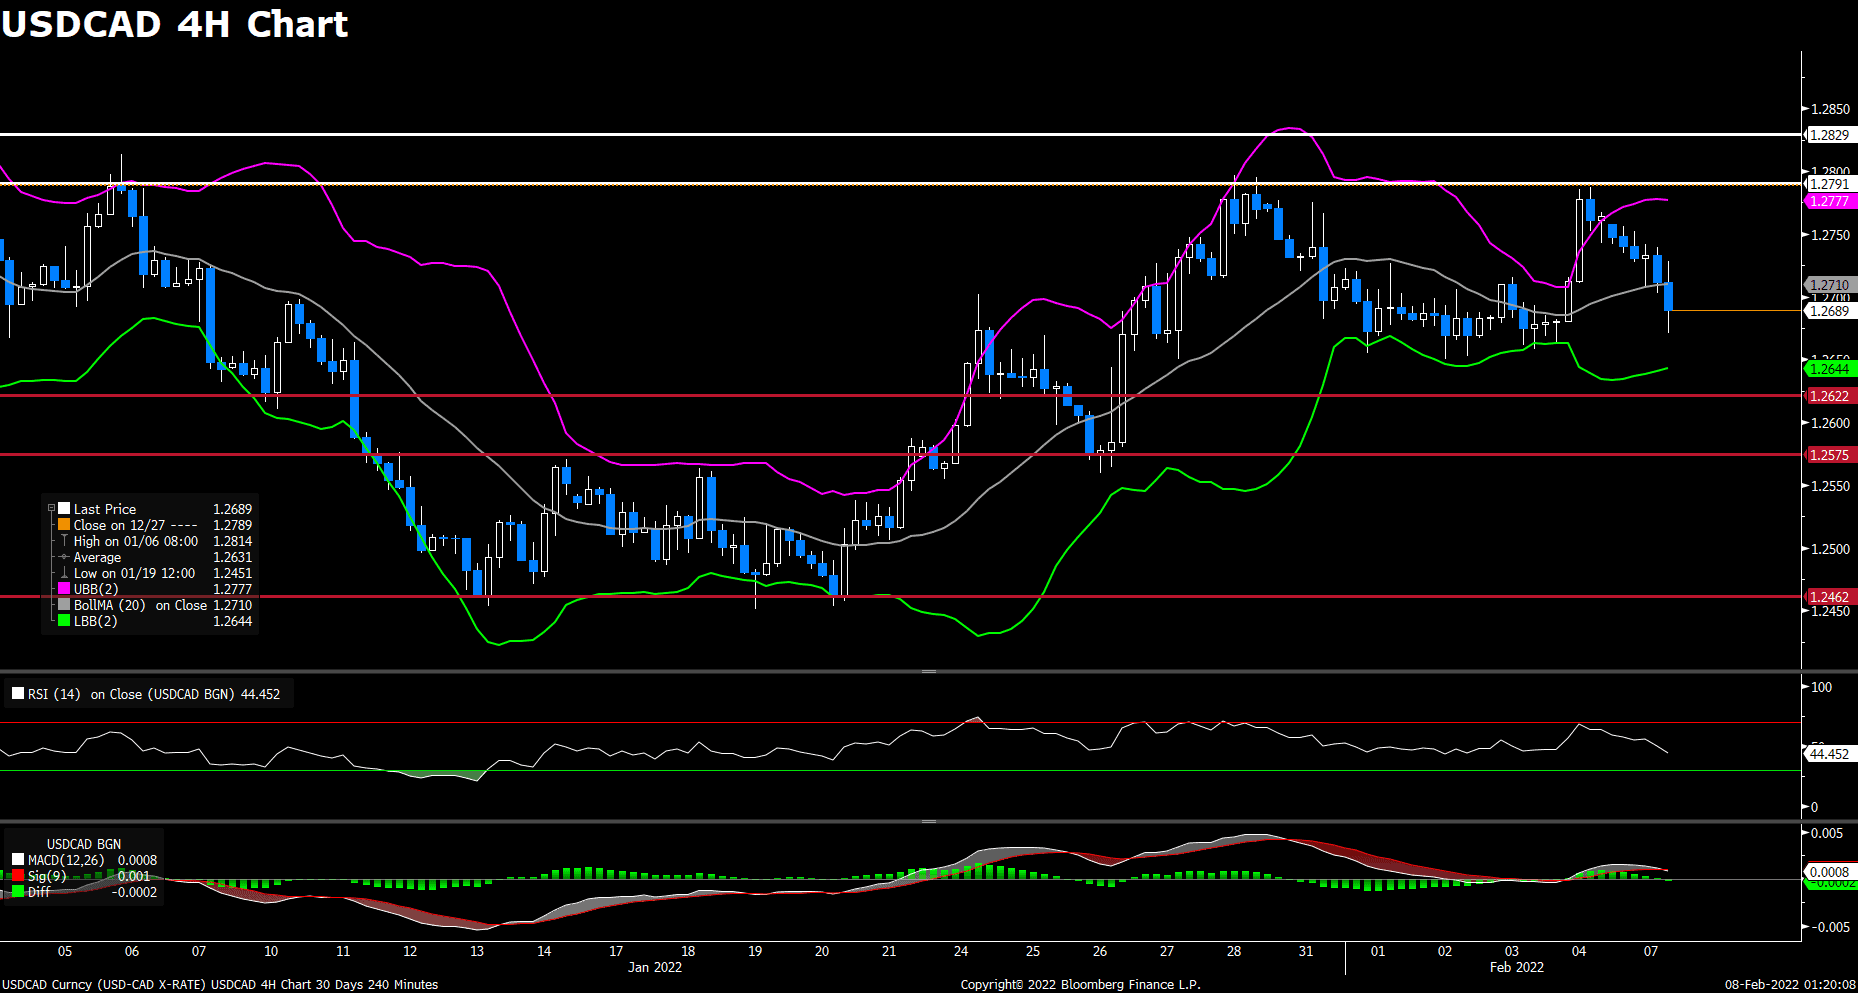
After previous day’s rebound to 1.2710 area, the pair USD/CAD failed to preserve its upside traction and remained under pressure today amid modest US dollar weakness. Despite bouncing back slightly in early European session, the pair saw fresh selling again and dropped towards 1.2680 mark heading into American session, now losing 0.19% on a daily basis. The sharp pullback in the US Treasury bond yields and the risk-on sentiment both decreased the demand of the safe-haven greenback. On top of that, crude oil inventories in the US tumble unexpectedly by 4.756 million barrels and pushed WTI to fresh daily highs above $89.00. But expectations that the 2015 nuclear deal will be agreed by US and Iran might weigh on crude oil prices and act as a headwind for the the commodity-linked loonie.
For technical aspect, RSI indicator 42 figures as of writing, suggesting bear movement ahead. As for the Bollinger Bands, the price fell from the moving average towards lower band, therefore the downside momentum should persist. In conclusion, we think market will be bearish as long as the 1.2778 resistance line holds. And escalating fears of Russia’s attack on Ukraine might lend support to the black gold and undermine the USD/CAD pair.
Resistance: 1.2778, 1.2843
Support: 1.2637, 1.2575, 1.2462
Economic Data:
|
Currency
|
Data
|
Time (GMT + 8)
|
Forecast
|
|
INR
|
Interest Rate Decision
|
12:30
|
4.00%
|
|
GBP
|
BoE Gov Bailey Speaks
|
17:05
|
|
|
USD
|
Core CPI (MoM) (Jan)
|
21:30
|
0.5%
|
|
USD
|
Initial Jobless Claims
|
21:30
|
230K
|
|
|
|
|
|
|
|
|
|
|
|
|
|
|
|