EUR/USD stayed weak in Friday’s Asian session, trading around 1.1680–1.1675, just above a nearly two-week low set on Thursday. The pair remained under pressure after a three-day rise in the US Dollar.
A temporary ceasefire extension did not lead to progress in peace talks, with a US naval blockade of Iranian ports weighing on risk sentiment. Higher crude oil prices also raised inflation worries and supported expectations of a more restrictive US Federal Reserve stance, helping the Dollar.
Technical Picture On The Four Hour Chart
On the 4-hour chart, price hovered near the 200-period Exponential Moving Average, leaving the near-term tone neutral after the latest drop. However, Thursday’s move below the 38.2% Fibonacci retracement of the rise from the March swing low favoured sellers, while the RSI near 32 pointed to ongoing downside pressure.
The MACD remained slightly negative, suggesting limited bullish momentum despite the EMA area. Support levels were cited at the 50.0% retracement at 1.1648, then 1.1600 and 1.1532, ahead of 1.1445.
Resistance was seen at 1.1696 (38.2%), then 1.1755 (23.6%). The technical analysis section was produced with help from an AI tool.
The current weakness in EUR/USD, now trading near 1.0550, is being driven by familiar pressures. Renewed tensions in the Strait of Hormuz are reviving inflationary concerns, strengthening the US dollar as the market anticipates a more aggressive Federal Reserve. The fundamental picture is creating a significant headwind for the euro.
Fundamental Drivers And Strategy Outlook
We have seen Q1 2026 core CPI stubbornly hold at an annualized 3.1%, pushing futures markets to price in a nearly 75% probability of a Fed rate hike by July. This contrasts sharply with the European Central Bank, which is signaling a longer pause, widening the policy divergence between the two central banks. This gap in interest rate expectations is the primary force weighing on the pair.
Looking back from 2025, we saw a similar dynamic unfold in late 2021 when the pair broke down from the 1.1600s amid rising inflation and a hawkish Fed. That period, along with the slide below parity in 2022, taught us that these fundamental trends can exert sustained pressure. The historical precedent suggests that the path of least resistance remains to the downside.
For the coming weeks, buying EUR/USD put options provides a straightforward strategy to capitalize on expected weakness. A break below the 1.0500 support level could open the door for a test of the 1.0400 handle. Traders could also consider bear put spreads to define risk and reduce the initial premium outlay.
Any unexpected de-escalation of geopolitical tensions or a surprisingly soft US inflation report could trigger a short-term relief rally. We should watch the 1.0650 area as the first major resistance level on any bounce. However, the underlying trend suggests that any meaningful recovery is likely to be met with fresh selling pressure.
Gold prices in India fell on Friday, based on FXStreet data. Gold was priced at INR 14,169.53 per gram, down from INR 14,271.88 on Thursday.
Gold also declined to INR 165,273.20 per tola from INR 166,464.40 a day earlier. Other reference prices were INR 141,695.20 for 10 grams and INR 440,722.10 per troy ounce.
How FXStreet Calculates Indian Gold Prices
FXStreet derives Indian gold prices by converting international prices using USD/INR and applying local units. The figures are updated daily using market rates at the time of publication, and local prices may vary slightly.
Central banks are the largest holders of gold. World Gold Council data shows central banks added 1,136 tonnes of gold worth about $70 billion to reserves in 2022, the highest annual purchase since records began.
Gold often moves inversely to the US Dollar and US Treasuries, and can also move opposite to risk assets. Price drivers include geopolitical events, recession fears, interest rates, and shifts in the US Dollar because gold is priced in dollars (XAU/USD).
We’re seeing a slight dip in gold prices today, but this should be viewed against the powerful rally we saw through late 2024 and most of 2025. This short-term softness provides an opportunity to evaluate the larger forces at play. The metal’s role as a safe haven remains its most important quality in the current uncertain economic climate.
Key Factors Shaping The Gold Outlook
A primary support for gold continues to be aggressive purchasing by central banks. Looking back, we know they collectively added over 1,000 tonnes in 2023 and continued their strong buying through 2025 with purchases well over 800 tonnes. This ongoing demand from official institutions signals a sustained effort to diversify reserves away from the US Dollar.
The major question for us is how the U.S. Federal Reserve will act in the second half of this year. After a long pause, where rates were held high to combat the stubborn inflation we saw in 2025, markets are now pricing in a potential rate cut before year-end as economic growth slows. Any pivot to lower rates would be very supportive for gold, as it reduces the appeal of holding yielding government bonds.
Ongoing geopolitical instability and the unpredictable nature of global trade relations are also providing a solid foundation for gold. Risk aversion remains elevated, and investors are continuing to allocate funds to assets that can protect wealth during turbulent times. This has kept a steady bid under the market, preventing any significant sell-offs.
Given this backdrop, traders should consider positioning for renewed upside in gold over the next several weeks. Implied volatility on gold options has been rising, suggesting the market is anticipating a move, which makes buying call options an attractive strategy to capture potential gains. This allows for participation in a rally while defining risk, should the economic outlook change unexpectedly.
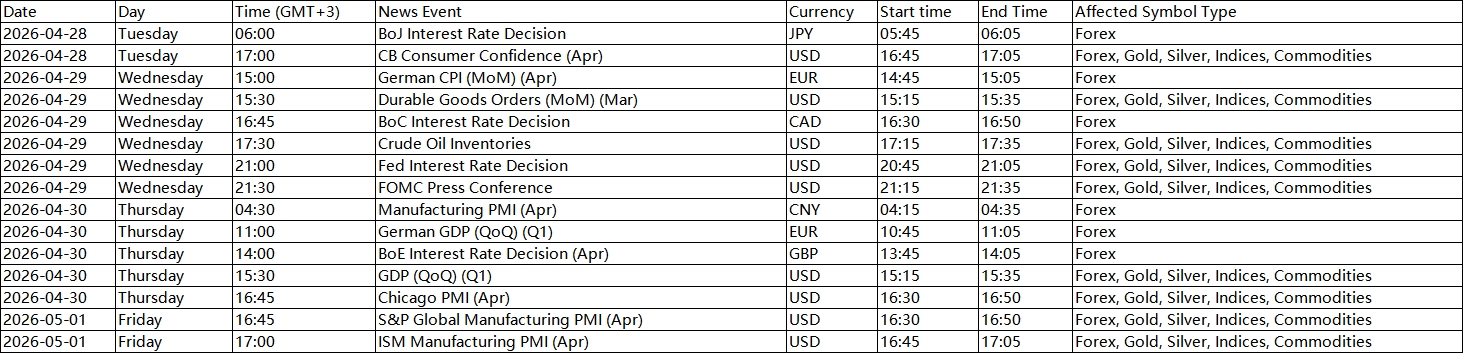
To ensure fair trading conditions and manage market volatility during major economic announcements and special market conditions, VT Markets will apply temporary leverage adjustments on certain trading products during specific news periods and market opening/closing.
These adjustments are designed to protect clients from abnormal market fluctuations, sudden liquidity changes, and extreme price movements that may occur during high-impact events or reduced market liquidity periods.
1. Products Affected
The temporary leverage adjustment may apply to the following products:
• Forex
• Gold
• Silver
• Oil
• Indices
• Commodities (including XPT and XPD)
2. Adjusted Leverage During News Releases and Market Opening/Closing
During the specified period, maximum leverage will be adjusted as follows:
Forex: 200
Gold: 200
Silver: 50
Oil: 10
Indices: 50
Commodities: 5
Please note that each product with leverage already below the above will not be affected.
3. News Events That Can Trigger the Adjustment
Leverage adjustments may be applied during major economic announcements including:
• FOMC Interest Rate Decisions
• CPI (Consumer Price Index)
• GDP
• PMI / NMI
• PPI
• Retail Sales
• Non-Farm Payroll (NFP)
• ADP Employment Data
• Crude Oil Inventories
The above data is for reference only. Other significant macroeconomic releases from major economies may also be included.
Please refer to the table below for details of the upcoming events and affected instruments:
All dates and times are stated in GMT+3 (MT4/MT5 server time).
4. Affected Period of News Releases and Market Opening/Closing
Temporary leverage adjustments apply during the following periods:
Economic News Period
• 15 minutes before the announcement
• 5 minutes after the announcement
Market Opening / Closing Period
• 3 hours before the weekly market closing (Friday)
• 30 minutes before daily market closing (Monday – Thursday)
Additional Conditions (Effective from 27 April 2026):
• If the following day is a full-day Gold market holiday, the Friday rule will also apply
→ Leverage will be reduced 3 hours before market close
• If the previous day is a full-day Gold market holiday, the Monday rule will also apply
→ Leverage will be reduced 30 minutes after market open for Gold, Silver, Oil, Forex, NAS100, SP500, DJ30, US2000
After the above period ends, leverage will automatically return to the original leverage.
5. Important Rules
• The adjustment only affects new positions open during the adjustment period
• Positions opened before the adjustment period will not be affected
• Once the adjustment period ends, original leverage will resume automatically
We strongly encourage clients to take these temporary leverage adjustments into account when planning trading strategies during high-impact economic events or special market conditions.
If you have any questions, please contact our support team: [email protected].
NZD/USD extended its pullback from the 0.5925–0.5930 area and fell for a second day. It traded near 0.5840 in Asia, close to the 200-day simple moving average.
The US dollar stayed firm for a fourth day as US-Iran tensions rose. Talks remain stalled over the Strait of Hormuz, supporting demand for the dollar.
Geopolitical Tensions Drive Safe Haven Demand
Donald Trump said on Tuesday that a US Navy blockade of Iranian ports will continue. Iran has demanded the full removal of the blockade before negotiations restart, and Trump ordered the Navy to shoot any boat laying mines.
Disrupted energy supplies have kept crude oil prices high and increased inflation concerns. Markets now price in only one 25-basis-point US rate cut in 2026, which supports the dollar and keeps pressure on NZD/USD.
In New Zealand, inflation data may limit further NZD losses. Annual inflation was 3.1% in the March 2026 quarter, above the 1–3% target band and above the 2% midpoint.
We see the NZD/USD pair is under considerable pressure, testing the critical 200-day moving average around the 0.5835 level. A decisive break below this technical floor in the coming days would likely signal a new leg down for the pair. This suggests that traders should prepare for increased downside momentum.
Options Strategies For A Bearish Outlook
The US Dollar’s strength is the primary driver, fueled by ongoing geopolitical tensions in the Strait of Hormuz. WTI crude oil prices have surged over 12% in the past month to trade above $95 a barrel, stoking global inflation fears and enhancing the dollar’s safe-haven appeal. We remember a similar dynamic during the Gulf tensions in late 2025, which also led to a significant flight to safety into the dollar.
This environment has dramatically shifted expectations for US Federal Reserve policy. The CME FedWatch Tool now shows that the market is pricing in just a 25% probability of a rate cut by June 2026, a sharp drop from over 60% a month ago. This expectation of higher-for-longer US rates provides a strong fundamental tailwind for the greenback against other currencies.
However, the Reserve Bank of New Zealand is facing its own inflation challenge, with the latest data showing a persistent 3.1% annual rate. Consequently, overnight index swap markets are now pricing in a 40% chance of an RBNZ rate *hike* by August to combat these price pressures. This hawkish stance from the RBNZ could provide some support for the Kiwi dollar, potentially limiting how far the pair can fall.
Given these opposing forces, buying NZD/USD put options offers a clear strategy to profit from a continued slide while defining risk. This allows traders to capitalize on the dominant US dollar trend, yet caps the maximum loss should the RBNZ’s hawkish policy cause a sudden rebound in the Kiwi. Volatility has picked up, making options more expensive, but they offer valuable protection against a sudden reversal.
For traders looking for a more cost-effective approach, we believe a bear put spread is a viable alternative. This involves buying a put option while simultaneously selling another put at a lower strike price, reducing the upfront premium paid. This strategy is particularly useful now, as it targets a specific downward range and lowers the cost of entry in a market with rising implied volatility.
USD/CHF extended gains for a fourth day and traded near 0.7870 in Asian hours on Friday, rising towards 0.7900. The US Dollar firmed on safe-haven demand amid uncertainty linked to the US–Iran conflict.
Lebanon is set to seek a one-month extension to the current ceasefire with Israel during a second round of direct talks in Washington. Israel’s UN Ambassador Danny Danon said the extension is “not 100%”.
Safe Haven Demand Lifts Dollar
The US military intercepted two Iranian oil supertankers accused of trying to evade a blockade, while Iran has threatened vessels in the Strait of Hormuz. US officials are preparing contingency plans to target Iran’s Strait capabilities if the ceasefire ends.
US Weekly Initial Jobless Claims rose to 215K from 212K. S&P Global PMI readings rose above expectations, with Manufacturing at 54.0 and Services at 51.3.
In Switzerland, the trade surplus narrowed to CHF 2.7 billion in March from a revised CHF 4.4 billion in February. Imports rose 10.1% month on month to CHF 19.6 billion, while exports increased 1% to CHF 22.4 billion.
Looking back at the analysis from over a year ago, we can see how the drivers for USD/CHF have fundamentally changed. The pair has since climbed significantly from the 0.7900 level and now trades around 0.9150. The acute risk aversion that was driven by the US-Iran conflict in 2025 has largely dissipated.
Shift Toward Policy Divergence
The intense focus on the Strait of Hormuz has subsided following de-escalation agreements in late 2025. This has removed the primary safe-haven bid that was supporting both the US Dollar and the Swiss Franc at the time. We see that the market’s attention has now shifted away from geopolitical flare-ups toward central bank policy divergence.
While US economic data was strong back then, we now see a more mixed but stable picture. Recent data shows weekly jobless claims holding steady around 210,000, but the latest ISM Manufacturing PMI has dipped to 49.8, indicating a slight contraction. However, the services sector remains a key pillar of strength, with the Services PMI posting a robust 53.5.
The speculation in 2025 of a more hawkish Swiss National Bank (SNB) has proven to be incorrect. With Swiss inflation having fallen to just 1.2% in the latest reading, the SNB became one of the first major central banks to begin an easing cycle, cutting its key policy rate to 1.50% last month. This stands in stark contrast to the US Federal Reserve, which is holding its policy rate steady.
This policy divergence creates a significant interest rate differential favouring the US Dollar, providing a strong tailwind for the USD/CHF pair. Derivative traders should consider selling out-of-the-money USD/CHF puts or implementing bull put spreads. This strategy takes advantage of the carry trade and the floor that the interest rate gap provides for the pair.
Implied volatility has also compressed significantly since the highs seen during the geopolitical tensions of 2025. This lower volatility environment makes it less expensive to construct longer-term bullish positions using call options. We believe traders can look at buying call options dated three to six months out to position for a continued, albeit slower, grind higher.
Japan’s Corporate Service Price Index rose to 3.1% year-on-year in March. This was up from 2.7% in the previous period.
The index measures changes in prices charged for services supplied by businesses. The latest reading shows faster annual service price growth in March.
Corporate Service Inflation Signals Boj Action
The jump in the Corporate Service Price Index to 3.1% is a major signal for us. This isn’t just about import costs anymore; it shows inflation is being driven by domestic services, a key metric the Bank of Japan watches. This reading, the highest in over two decades, heavily suggests the BoJ will be forced to act sooner and more decisively than the market expects.
We should anticipate a hawkish shift from the Bank of Japan, likely at their next meeting. This makes positioning for higher Japanese interest rates a priority in the coming weeks. Traders should consider paying fixed on Japanese yen interest rate swaps or directly shorting Japanese Government Bond (JGB) futures, as the 10-year yield has already started to test the 1.20% level on this news.
For currency derivatives, this data is strongly bullish for the yen. We expect the USD/JPY to come under significant pressure as rate hike expectations are priced in. Buying USD/JPY put options with a one-to-two-month expiry is a direct way to play this, especially as the pair falters around the 148.00 mark.
This inflationary pressure is a negative for Japanese equities, which have thrived on cheap money. Looking back at the market jitters during the initial policy normalization discussions in 2025, we anticipate a similar, but sharper, reaction now. We are buying put options on the Nikkei 225 index, as the prospect of real rate hikes threatens the record valuations we’ve seen this year.
US military officials are drawing up new plans to target Iran’s capabilities in the Strait of Hormuz if the current ceasefire fails, CNN reported on Thursday. The plans include “dynamic targeting” focused on assets around the Strait of Hormuz, the southern Arabian Gulf and the Gulf of Oman.
At the time of writing, West Texas Intermediate (WTI) was up 3.80% on the day at $95.45. Brent Crude Oil is a North Sea grade used as a benchmark for international prices and serves as a reference for about two-thirds of globally traded oil supplies.
Key Drivers Of Brent Pricing
Brent prices are driven mainly by supply and demand, with global growth affecting demand and conflicts, sanctions and political instability affecting supply. OPEC, a group of 12 oil-producing nations, sets production quotas at twice-yearly meetings, while OPEC+ adds ten non-OPEC members, including Russia.
US Dollar moves can affect oil prices because oil is traded in US Dollars. Weekly inventory reports from the American Petroleum Institute (API) and the Energy Information Agency (EIA) can shift prices; their results are within 1% of each other 75% of the time, and the EIA is a government agency.
With reports of the US developing plans targeting Iran’s Hormuz defenses, the geopolitical risk premium in crude oil is increasing sharply. A significant portion of the world’s oil supply transits the Strait of Hormuz, so any potential for conflict directly threatens a major supply chokepoint. This is why we have seen Brent crude surge past $101 per barrel this week, reacting to the heightened uncertainty.
Traders should prepare for a period of significant volatility over the next few weeks. The CBOE Crude Oil Volatility Index (OVX) has already risen to over 45, its highest point this year, showing the market is pricing in the possibility of large and sudden price swings. We believe that buying call options on crude futures is a viable strategy to capitalize on potential price spikes while defining and limiting downside risk.
This tension is occurring within an already tight market, which could amplify any price movements. OPEC+ held production quotas steady in its early April meeting, and the latest Energy Information Administration report showed a larger-than-expected inventory draw of 3.1 million barrels. This fundamental backdrop of constrained supply and solid demand provides strong underlying support for oil prices.
Historical Signals And Market Context
We have seen this scenario play out before, and it serves as a valuable reference. Looking back at 2025 from our current perspective, we saw how Houthi attacks in the Red Sea disrupted shipping and added a significant premium to oil prices for months. The tanker incidents in this same region back in 2019 also caused a nearly 20% single-day price jump, showing how quickly these situations can escalate.
Given that Brent crude is more sensitive to Middle Eastern supply disruptions than West Texas Intermediate, we expect the spread between the two benchmarks to widen. Traders could explore strategies that profit from this differential. Using option spreads instead of outright futures contracts may also be prudent to manage costs and protect against a sudden peaceful resolution that would erase the risk premium.
Japan’s national CPI excluding food and energy rose 2.4% year on year in March. This was down from 2.5% previously.
The recent drop in Japan’s core inflation to 2.4% suggests that price pressures may be peaking, slightly easing the urgency for the Bank of Japan to hike interest rates aggressively. We see this as a signal to pull back on bets for a rapid series of rate increases in the second quarter of 2026. This data point challenges the more hawkish sentiment that was building after the policy pivot we saw back in 2024.
Implications For Currency Strategy
For currency traders, this reinforces the appeal of the yen carry trade, where investors borrow in yen to invest in higher-yielding currencies. The interest rate gap with the U.S. is likely to remain wide, especially as the yen is currently trading near 160 to the dollar, a level not seen for decades. We should consider strategies that benefit from a weak or stable yen, such as selling out-of-the-money JPY call options against the dollar.
This environment is supportive for Japanese equities, so we should consider long positions on Nikkei 225 futures. A slower pace of rate hikes means corporate borrowing costs will not rise as fast as feared, which protects company profit margins that have already grown an average of 8% in the last reported quarter. Looking back at 2025, markets were far more nervous about the impact of rising rates on stocks, but that fear is now subsiding.
In the bond market, the slowing inflation figure implies that yields on Japanese Government Bonds (JGBs) may not climb as sharply as we previously modeled. The 10-year JGB yield, currently hovering around 1.1%, now seems less likely to push towards the 1.5% mark in the near term. This stability makes derivatives that bet on a contained yield range more attractive than outright short positions on JGB futures.
The latest “Shunto” spring wage negotiations also feed into this narrative, showing an average pay increase of around 4.6%. While this is historically strong and ensures real wage growth, it is a moderation from the landmark 5.2% hikes we saw in 2025. This cooldown in wage growth gives the central bank more breathing room to wait and see before its next policy move.
Brent crude rose 99 cents, or 0.94%, to $106.06 a barrel at 0410 GMT, while WTI gained 71 cents, or 0.73%, to $96.56.
Brent rose 17.13% over the week, while WTI gained 15.13%, marking the second-largest weekly gain since the war began.
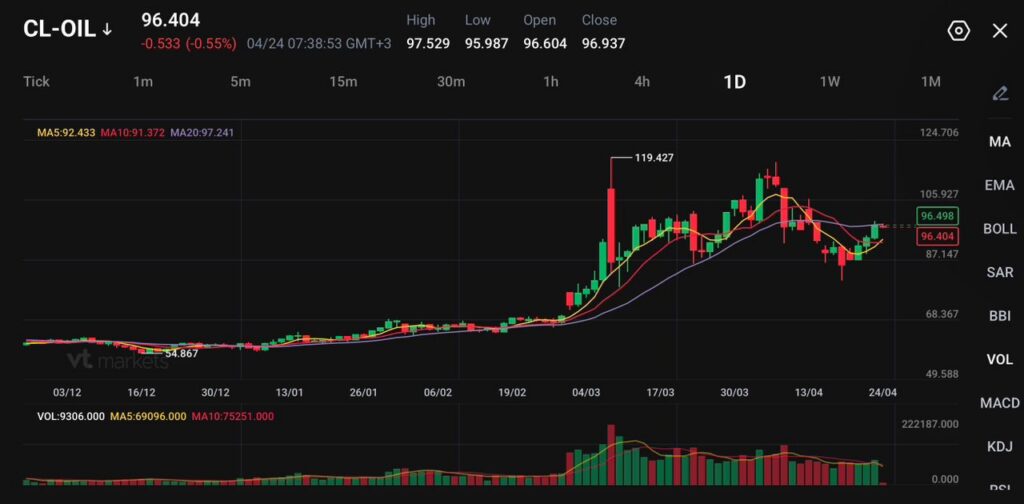
CL-OIL trades near 96.404, down 0.533, or 0.55%, with the 20-day moving average at 97.241 acting as the first key barrier.
Oil has moved from a fear trade into a full supply-risk trade. Brent crude futures rose 99 cents, or 0.94%, to $106.06 a barrel at 0410 GMT, while West Texas Intermediate futures rose 71 cents, or 0.73%, to $96.56. Reuters later reported Brent near $106.30 and WTI near $96.92 as traders kept pricing renewed stress around the Strait of Hormuz.
A US-sanctioned supertanker laden with Iranian oil appeared to be attempting to cross the Strait of Hormuz on Friday, with traffic through the waterway otherwise at a virtual standstill https://t.co/ECcE4NGrUe
The weekly move shows how quickly the market has repriced the risk. Brent rose 17.13% through the week, while WTI rose 15.13%, the second-largest weekly gain since the war began. Both benchmark contracts settled up more than 3% on Thursday. They jumped $5 a barrel after reports that air defences were engaging targets over Tehran and that a power struggle had widened between Iran’s hardliners and moderates.
The key driver is the Strait of Hormuz. The closure after the start of the US-Israeli war on Iran has cut around 20% of the world’s supply of oil and liquefied natural gas. Iran also posted a video on Thursday of commandos in a speedboat storming a huge cargo ship after the collapse of peace talks, again showing its grip over a route through which 20% of global oil and gas usually flows.
Iran's use of a swarm of small, fast boats to seize two container ships near the Strait of Hormuz could undermine suggestions that US forces have disabled its naval threat and reveals the challenges facing reopening the oil export route https://t.co/uqyZNLjzU4pic.twitter.com/CjD9x4dhmi
The oil market is not only pricing barrels. It is pricing freight delays, war insurance, refinery risk, LNG stress, and the chance that fuel inflation moves back into consumer prices. The International Energy Agency said that just over 112 bcm of LNG transited the Strait in 2025, accounting for almost 20% of global LNG trade. It also said almost 90% of those volumes went to Asia, while just over 10% went to Europe.
Consumers are already feeling the effects of the closure of the Strait of Hormuz with energy prices surging around the world. But what if the crisis is signaling a longer-term global power shift?@DanielYergin tells @TheStalwart and @tracyalloway on the Odd Lots podcast that… pic.twitter.com/huzwhppj9K
That keeps Asia more exposed to any long closure. Reuters reported that Asia’s LNG imports for April are expected to fall to 19.03 million metric tons, with Qatar’s contribution dropping from an average of more than 6 million tons before the war to just 800,000 tons. China’s April LNG imports are expected to fall to 3.36 million tons, the lowest since 2018, while spot LNG prices rose to $25.30 per mmBtu in March before easing to $16.05 per mmBtu.
For markets, that creates a clear chain reaction. Higher crude can lift headline inflation, slow the pace of rate-cut bets, support the US dollar, and pressure equity sectors tied to transport, airlines, manufacturing, and consumer spending. Energy producers may benefit from higher prices, but the broader equity market may struggle if traders start to treat oil strength as an inflation tax rather than a growth signal.
Diplomacy Offers Relief, But Not Certainty
The ceasefire narrative has grown more uncertain, with mixed signals from both diplomacy and military positioning. While there are indications of progress, the tone remains cautious, with no clear timeline for a broader resolution.
Recent developments point to efforts to extend de-escalation in parts of the region, which may help stabilise sentiment in the near term. However, the underlying tensions have not fully eased, and key actors continue to signal that escalation remains on the table if conditions shift.
President Donald Trump said the Lebanon-Israel ceasefire was extended for three weeks, adding he looked forward to hosting Israeli PM Benjamin Netanyahu and Lebanese President Joseph Aoun soon https://t.co/YLQm66lBjzpic.twitter.com/UO8UpIdbWw
That leaves markets in a familiar position. Diplomatic headlines may be enough to cool immediate panic and prompt profit-taking, but they are not yet strong enough to remove the underlying supply risk embedded in prices.
Technical Analysis
CL-OIL is trading near 96.40, stabilising after a recent pullback from the 105–106 resistance zone, with price attempting to base following a sharp retracement from earlier highs. The broader structure remains elevated after the strong rally from the mid-80s, but short-term momentum has cooled.
From a technical standpoint, the bias is neutral with a slight bullish tilt. Price is holding just above the 5-day (92.43) and 10-day (91.37) moving averages, which are beginning to flatten and act as near-term support. However, the 20-day (97.24) is now acting as overhead resistance, indicating that upside momentum has slowed and the market is consolidating.
Key levels to watch:
Support: 95.00 → 91.50 → 87.00
Resistance: 97.50 → 100.00 → 105.90
The market is currently testing the 97.50 resistance area, which aligns with the 20-day average and recent consolidation highs. A break above this level could trigger a move toward the 100.00 psychological level, with further upside potential if buyers regain control.
On the downside, 95.00 is acting as immediate support. A break below this level could expose 91.50, where stronger buying interest may emerge given the prior base formation.
Overall, oil is transitioning into a consolidation phase after a volatile rally, with price compressing between support and resistance. The near-term focus is on whether buyers can reclaim 97.50, or if the market rolls over and retests the lower support zone.
Market Implications For The Next Session
Oil above $100 would keep inflation risk at the front of the market. That would likely support defensive dollar demand, weigh on rate-sensitive equities, and push traders to reassess bond yields if fuel prices start feeding back into consumer inflation expectations.
A move back below 92.433 and 91.372 would ease the pressure. It would suggest traders are fading the war premium and looking for proof of real supply loss before pushing prices higher again. In that case, equities could breathe, while energy shares may lose some near-term momentum.
For now, the cautious forecast favours a volatile range between the low-to-mid $90s and the $105.927 resistance zone. A daily close above 97.241 keeps the recovery alive. A break below 95.987 warns that profit-taking is starting to overpower the Hormuz bid.
Learn more about trading Energies on VT Markets here.
Trader Questions
Why Are Oil Prices Rising?
Oil prices are rising because traders are pricing in renewed military risk in the Middle East. Iran released footage of commandos boarding a cargo ship in the Strait of Hormuz, while reports also said Tehran’s air defences had engaged “hostile targets.”
Brent crude rose 99 cents, or 0.94%, to $106.06 a barrel at 0410 GMT. West Texas Intermediate rose 71 cents, or 0.73%, to $96.56.
Why Does The Strait Of Hormuz Matter For Oil?
The Strait of Hormuz matters because around 20% of the world’s oil and liquefied natural gas normally flows through it. Any closure or disruption can quickly reduce available supply, raise shipping risk, and add a supply-risk premium to oil prices.
The closure after the beginning of the US-Israeli war on Iran cut around 20% of the world’s supply of oil and liquefied natural gas, which has kept energy markets highly sensitive to fresh headlines.
How Much Did Oil Prices Rise This Week?
Brent rose 17.13% over the week, while WTI rose 15.13%. That marked the second-largest weekly gain since the war began.
Both benchmark contracts also settled up more than 3% on Thursday and jumped $5 a barrel after reports of air defences engaging targets over Tehran and tensions inside Iran’s political leadership.
Could Oil Prices Rise Further?
Oil prices could rise further if US-Iran talks fail to make key progress by the end of April and fighting resumes. Haitong Futures warned that oil could climb to new highs for the year if the ceasefire turns into a preparatory phase for war.
From a technical view, CL-OIL needs to hold above the low-to-mid $90s and break above the 20-day moving average at 97.241. A stronger move above 105.927 could reopen the path toward the previous spike near 119.427.
What Oil Price Levels Should Traders Watch?
Traders should watch 97.241 first, as this is the 20-day moving average on the CL-OIL daily chart. A daily close above this level would show stronger short-term buying pressure.
Support sits near 95.987, followed by the 5-day moving average at 92.433 and the 10-day moving average at 91.372. A break below those levels could weaken the rebound and expose 87.147.
Start trading now – Click here to create your real VT Markets account
Written on April 24, 2026 at 6:17 am, by josephine
Japan’s national CPI excluding fresh food rose 1.8% year on year in March. This matched the forecast of 1.8%.
With Japan’s core inflation coming in at 1.8%, exactly as expected, the data gives the Bank of Japan no reason to rush into another interest rate hike. This reading for March 2026 remains below the central bank’s 2% target, reinforcing our view that monetary policy will stay accommodative for the foreseeable future. Traders should see this as a green light for strategies that benefit from a cautious central bank.
The most direct implication is continued pressure on the Japanese Yen, especially as the interest rate gap with the United States remains wide, with the Fed funds rate sitting over four percentage points higher. We saw how the Yen weakened past 155 per dollar last year in 2025 before the Ministry of Finance stepped in, and conditions are now similar. Buying call options on USD/JPY seems like a sensible way to position for further Yen weakness in the coming weeks.
This environment is also supportive of Japanese equities, as a weaker Yen boosts profits for the country’s major exporters. The Nikkei 225 has already gained over 15% since the BoJ finally ended its negative interest rate policy in late 2025, showing the market prefers a slow and predictable path. We feel that long positions through Nikkei 225 futures or call options remain an attractive trade.
Given the lack of any inflationary surprise, volatility in the Japanese Government Bond (JGB) market is likely to remain subdued. The 10-year JGB yield has been steady, hovering just under 1.0% recently, and this inflation print won’t change that narrative. Traders could use options to bet on this low volatility continuing, selling strangles on JGB futures if they believe yields will stay within a tight range.
The primary risk remains a sudden shift in tone from the Bank of Japan or direct currency intervention from the government if the Yen’s decline accelerates too quickly. Implied volatility on Yen currency pairs is currently quite low, suggesting the market is not pricing in a major surprise event. This complacency could make protective put options on USD/JPY an inexpensive way to hedge against an unexpected policy shock.
Written on April 24, 2026 at 6:05 am, by josephine