


Key Points
- Brent crude rose 99 cents, or 0.94%, to $106.06 a barrel at 0410 GMT, while WTI gained 71 cents, or 0.73%, to $96.56.
- Brent rose 17.13% over the week, while WTI gained 15.13%, marking the second-largest weekly gain since the war began.
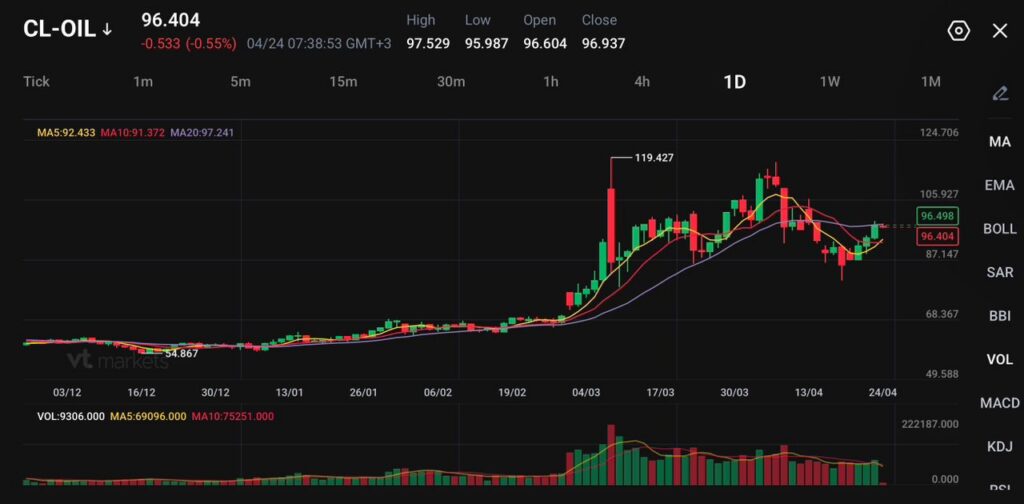
- CL-OIL trades near 96.404, down 0.533, or 0.55%, with the 20-day moving average at 97.241 acting as the first key barrier.
Oil has moved from a fear trade into a full supply-risk trade. Brent crude futures rose 99 cents, or 0.94%, to $106.06 a barrel at 0410 GMT, while West Texas Intermediate futures rose 71 cents, or 0.73%, to $96.56. Reuters later reported Brent near $106.30 and WTI near $96.92 as traders kept pricing renewed stress around the Strait of Hormuz.
The weekly move shows how quickly the market has repriced the risk. Brent rose 17.13% through the week, while WTI rose 15.13%, the second-largest weekly gain since the war began. Both benchmark contracts settled up more than 3% on Thursday. They jumped $5 a barrel after reports that air defences were engaging targets over Tehran and that a power struggle had widened between Iran’s hardliners and moderates.
The key driver is the Strait of Hormuz. The closure after the start of the US-Israeli war on Iran has cut around 20% of the world’s supply of oil and liquefied natural gas. Iran also posted a video on Thursday of commandos in a speedboat storming a huge cargo ship after the collapse of peace talks, again showing its grip over a route through which 20% of global oil and gas usually flows.
Hormuz Risk Hits More Than Crude
The oil market is not only pricing barrels. It is pricing freight delays, war insurance, refinery risk, LNG stress, and the chance that fuel inflation moves back into consumer prices. The International Energy Agency said that just over 112 bcm of LNG transited the Strait in 2025, accounting for almost 20% of global LNG trade. It also said almost 90% of those volumes went to Asia, while just over 10% went to Europe.
That keeps Asia more exposed to any long closure. Reuters reported that Asia’s LNG imports for April are expected to fall to 19.03 million metric tons, with Qatar’s contribution dropping from an average of more than 6 million tons before the war to just 800,000 tons. China’s April LNG imports are expected to fall to 3.36 million tons, the lowest since 2018, while spot LNG prices rose to $25.30 per mmBtu in March before easing to $16.05 per mmBtu.
For markets, that creates a clear chain reaction. Higher crude can lift headline inflation, slow the pace of rate-cut bets, support the US dollar, and pressure equity sectors tied to transport, airlines, manufacturing, and consumer spending. Energy producers may benefit from higher prices, but the broader equity market may struggle if traders start to treat oil strength as an inflation tax rather than a growth signal.
Diplomacy Offers Relief, But Not Certainty
The ceasefire narrative has grown more uncertain, with mixed signals from both diplomacy and military positioning. While there are indications of progress, the tone remains cautious, with no clear timeline for a broader resolution.
Recent developments point to efforts to extend de-escalation in parts of the region, which may help stabilise sentiment in the near term. However, the underlying tensions have not fully eased, and key actors continue to signal that escalation remains on the table if conditions shift.
That leaves markets in a familiar position. Diplomatic headlines may be enough to cool immediate panic and prompt profit-taking, but they are not yet strong enough to remove the underlying supply risk embedded in prices.
Technical Analysis
CL-OIL is trading near 96.40, stabilising after a recent pullback from the 105–106 resistance zone, with price attempting to base following a sharp retracement from earlier highs. The broader structure remains elevated after the strong rally from the mid-80s, but short-term momentum has cooled.
From a technical standpoint, the bias is neutral with a slight bullish tilt. Price is holding just above the 5-day (92.43) and 10-day (91.37) moving averages, which are beginning to flatten and act as near-term support. However, the 20-day (97.24) is now acting as overhead resistance, indicating that upside momentum has slowed and the market is consolidating.
Key levels to watch:
- Support: 95.00 → 91.50 → 87.00
- Resistance: 97.50 → 100.00 → 105.90
The market is currently testing the 97.50 resistance area, which aligns with the 20-day average and recent consolidation highs. A break above this level could trigger a move toward the 100.00 psychological level, with further upside potential if buyers regain control.
On the downside, 95.00 is acting as immediate support. A break below this level could expose 91.50, where stronger buying interest may emerge given the prior base formation.
Overall, oil is transitioning into a consolidation phase after a volatile rally, with price compressing between support and resistance. The near-term focus is on whether buyers can reclaim 97.50, or if the market rolls over and retests the lower support zone.
Market Implications For The Next Session
Oil above $100 would keep inflation risk at the front of the market. That would likely support defensive dollar demand, weigh on rate-sensitive equities, and push traders to reassess bond yields if fuel prices start feeding back into consumer inflation expectations.
A move back below 92.433 and 91.372 would ease the pressure. It would suggest traders are fading the war premium and looking for proof of real supply loss before pushing prices higher again. In that case, equities could breathe, while energy shares may lose some near-term momentum.
For now, the cautious forecast favours a volatile range between the low-to-mid $90s and the $105.927 resistance zone. A daily close above 97.241 keeps the recovery alive. A break below 95.987 warns that profit-taking is starting to overpower the Hormuz bid.
Learn more about trading Energies on VT Markets here.
Trader Questions
Why Are Oil Prices Rising?
Oil prices are rising because traders are pricing in renewed military risk in the Middle East. Iran released footage of commandos boarding a cargo ship in the Strait of Hormuz, while reports also said Tehran’s air defences had engaged “hostile targets.”
Brent crude rose 99 cents, or 0.94%, to $106.06 a barrel at 0410 GMT. West Texas Intermediate rose 71 cents, or 0.73%, to $96.56.
Why Does The Strait Of Hormuz Matter For Oil?
The Strait of Hormuz matters because around 20% of the world’s oil and liquefied natural gas normally flows through it. Any closure or disruption can quickly reduce available supply, raise shipping risk, and add a supply-risk premium to oil prices.
The closure after the beginning of the US-Israeli war on Iran cut around 20% of the world’s supply of oil and liquefied natural gas, which has kept energy markets highly sensitive to fresh headlines.
How Much Did Oil Prices Rise This Week?
Brent rose 17.13% over the week, while WTI rose 15.13%. That marked the second-largest weekly gain since the war began.
Both benchmark contracts also settled up more than 3% on Thursday and jumped $5 a barrel after reports of air defences engaging targets over Tehran and tensions inside Iran’s political leadership.
Could Oil Prices Rise Further?
Oil prices could rise further if US-Iran talks fail to make key progress by the end of April and fighting resumes. Haitong Futures warned that oil could climb to new highs for the year if the ceasefire turns into a preparatory phase for war.
From a technical view, CL-OIL needs to hold above the low-to-mid $90s and break above the 20-day moving average at 97.241. A stronger move above 105.927 could reopen the path toward the previous spike near 119.427.
What Oil Price Levels Should Traders Watch?
Traders should watch 97.241 first, as this is the 20-day moving average on the CL-OIL daily chart. A daily close above this level would show stronger short-term buying pressure.
Support sits near 95.987, followed by the 5-day moving average at 92.433 and the 10-day moving average at 91.372. A break below those levels could weaken the rebound and expose 87.147.
Start trading now – Click here to create your real VT Markets account


